A Novel EEG Feature Extraction Method Using Hjorth Parameter · 2017-11-03 · A Novel EEG Feature...
5
A Novel EEG Feature Extraction Method Using Hjorth Parameter Seung-Hyeon Oh, Yu-Ri Lee, and Hyoung-Nam Kim Pusan National University/Department of Electrical & Computer Engineering, Busan, Republic of Korea Email: [email protected] Abstract—When processing electroencephalography (EEG) signals in motor imagery case, it is essential to analyze them in both time and frequency domains. An EEG signal has a non-stationary property and its frequency feature also differs from individual to individual. Thus, we can infer that each subject has one’s own dominant timing and frequency band for extracting distinguishable features. Based on this inference, after analyzing EEG signals with the Hjorth parameter, we select the principal frequency band and the timing using the Fisher ratio of the Hjorth parameter. By doing these, the performance of the feature extraction in EEG-based BCI systems was improved in terms of the classification accuracy by 4.4% on average. 1 Index Terms—EEG, BCI, feature extraction, Hjorth parameter, motor imagery I. INTRODUCTION Brain Computer Interface (BCI) is a system that directly controls or interacts with a computer through the brain activity. There are two methods to collect brain signals which are invasive and noninvasive methods. An invasive BCI method uses electrodes placed on the exposed surface of a brain to record electrical activity. It is required to surgical operation like an incision into the skull. It may involve big dangerousness to human. On the other hand, a noninvasive method does not need any surgical process although it suffers from low quality of measurement signals. Therefore, non-invasive BCI has been more preferable to invasive BCI. There are several non-invasive BCI methods, such as magnetoencephalography (MEG), functional magnetic resonance imaging (fMRI), EEG, and so on. Especially, EEG has some advantages compared to other noninvasive methods. It has better temporal resolution than fMRI or computed tomography (CT) [1]. It is also easy to use, and has low cost for set-up [2]. Therefore, EEG is the most generally used measurement method among non-invasive methods. BCI based on EEG uses an electrical neural signal appeared on the scalp. EEG signals have specific patterns according to subject’s states, such as hypnosis, arousal, exercise, Manuscript received November 25, 2013; revised February 10, 2014. This work was supported by Basic Science Research Program through the National Research Foundation of Korea (NRF) funded by the Ministry of Education, Science and Technology (2012R1A1A2008555). concentration, and so on. Finding the relationship between a physical task and its corresponding EEG pattern has been an interesting research topic. The fact that EEG patterns are related to some physical tasks may be very applicable because it can be helpful for disabled people who can move a wheelchair or hit a key on a computer keyboard by controlling the BCI systems based on EEG signal. In addition, it can be also applied to ordinary human’s life, including driving a car, controlling a cursor, playing a game, and so on. Regarding these applications, an imagination of moving own body is called motor imagery. It is widely known that approximate frequency bands generally presenting a prominent feature are Mu band and Beta band in motor imagery EEG systems. However, the frequency band including the important feature slightly changes according to an individual. Further, EEG signals, especially about motor imagery, have an event-dependent property. Therefore, we need to analyze the changes of a signal feature with time. For these reasons, it is appropriate to analyze EEG signal both in time and frequency domains. Considering these two problems, we have studied on time–frequency feature extraction methods. The short- time Fourier transform (STFT) has been popular for time- frequency analysis of non-stationary signals [3]. However, its high computational complexity and redundant frequency information remain still to be solved in real- time STFT applications. The Hjorth parameter proposed in [4] may be a good alternative for the STFT because it can extract useful information both in time and frequency domains through simple computation [5]. In this paper, we introduce the Hjorth parameter and compute its Fisher ratio to find the dominant frequency band and the timing in training EEG signals. Extracting a high-informative feature in test EEG signals is carried out by computing the Hjorth parameter of a test signal at the pre-determined frequency band and timing instant. Then, the feature is used for classification. The remainder of the paper is organized as follows: In Section II, the STFT and the Hjorth parameter are introduced as conventional feature extraction methods. The proposed time–frequency feature extraction method is also described in Section II. Section III shows the performance improvement of the feature extraction method using the Hjorth parameter with selected 106 International Journal of Electronics and Electrical Engineering Vol. 2, No. 2, June, 2014 ©2014 Engineering and Technology Publishing doi: 10.12720/ijeee.2.2.106-110
Transcript of A Novel EEG Feature Extraction Method Using Hjorth Parameter · 2017-11-03 · A Novel EEG Feature...
A Novel EEG Feature Extraction Method Using
Hjorth Parameter
Seung-Hyeon Oh, Yu-Ri Lee, and Hyoung-Nam Kim Pusan National University/Department of Electrical & Computer Engineering, Busan, Republic of Korea
Email: [email protected]
Abstract—When processing electroencephalography (EEG)
signals in motor imagery case, it is essential to analyze them
in both time and frequency domains. An EEG signal has a
non-stationary property and its frequency feature also
differs from individual to individual. Thus, we can infer that
each subject has one’s own dominant timing and frequency
band for extracting distinguishable features. Based on this
inference, after analyzing EEG signals with the Hjorth
parameter, we select the principal frequency band and the
timing using the Fisher ratio of the Hjorth parameter. By
doing these, the performance of the feature extraction in
EEG-based BCI systems was improved in terms of the
classification accuracy by 4.4% on average. 1
Index Terms—EEG, BCI, feature extraction, Hjorth
parameter, motor imagery
I. INTRODUCTION
Brain Computer Interface (BCI) is a system that
directly controls or interacts with a computer through the
brain activity. There are two methods to collect brain
signals which are invasive and noninvasive methods. An
invasive BCI method uses electrodes placed on the
exposed surface of a brain to record electrical activity. It
is required to surgical operation like an incision into the
skull. It may involve big dangerousness to human. On the
other hand, a noninvasive method does not need any
surgical process although it suffers from low quality of
measurement signals. Therefore, non-invasive BCI has
been more preferable to invasive BCI. There are several
non-invasive BCI methods, such as
magnetoencephalography (MEG), functional magnetic
resonance imaging (fMRI), EEG, and so on. Especially,
EEG has some advantages compared to other noninvasive
methods. It has better temporal resolution than fMRI or
computed tomography (CT) [1]. It is also easy to use, and
has low cost for set-up [2]. Therefore, EEG is the most
generally used measurement method among non-invasive
methods. BCI based on EEG uses an electrical neural
signal appeared on the scalp.
EEG signals have specific patterns according to
subject’s states, such as hypnosis, arousal, exercise,
Manuscript received November 25, 2013; revised February 10, 2014. This work was supported by Basic Science Research Program
through the National Research Foundation of Korea (NRF) funded by the Ministry of Education, Science and Technology
(2012R1A1A2008555).
concentration, and so on. Finding the relationship
between a physical task and its corresponding EEG
pattern has been an interesting research topic. The fact
that EEG patterns are related to some physical tasks may
be very applicable because it can be helpful for disabled
people who can move a wheelchair or hit a key on a
computer keyboard by controlling the BCI systems based
on EEG signal. In addition, it can be also applied to
ordinary human’s life, including driving a car, controlling
a cursor, playing a game, and so on. Regarding these
applications, an imagination of moving own body is
called motor imagery.
It is widely known that approximate frequency bands
generally presenting a prominent feature are Mu band and
Beta band in motor imagery EEG systems. However, the
frequency band including the important feature slightly
changes according to an individual. Further, EEG signals,
especially about motor imagery, have an event-dependent
property. Therefore, we need to analyze the changes of a
signal feature with time. For these reasons, it is
appropriate to analyze EEG signal both in time and
frequency domains.
Considering these two problems, we have studied on
time–frequency feature extraction methods. The short-
time Fourier transform (STFT) has been popular for time-
frequency analysis of non-stationary signals [3]. However,
its high computational complexity and redundant
frequency information remain still to be solved in real-
time STFT applications. The Hjorth parameter proposed
in [4] may be a good alternative for the STFT because it
can extract useful information both in time and frequency
domains through simple computation [5]. In this paper,
we introduce the Hjorth parameter and compute its Fisher
ratio to find the dominant frequency band and the timing
in training EEG signals. Extracting a high-informative
feature in test EEG signals is carried out by computing
the Hjorth parameter of a test signal at the pre-determined
frequency band and timing instant. Then, the feature is
used for classification.
The remainder of the paper is organized as follows: In
Section II, the STFT and the Hjorth parameter are
introduced as conventional feature extraction methods.
The proposed time–frequency feature extraction method
is also described in Section II. Section III shows the
performance improvement of the feature extraction
method using the Hjorth parameter with selected
106
International Journal of Electronics and Electrical Engineering Vol. 2, No. 2, June, 2014
©2014 Engineering and Technology Publishingdoi: 10.12720/ijeee.2.2.106-110
frequency band and timing, comparing with the methods
based on the STFT and the Hjorth parameter without any
frequency band selection. Section IV presents the
conclusion.
II. FEATURE EXTRACTION IN EEG SIGNALS
There are several existing time-frequency feature
extraction methods. Among them, the short-time Fourier
transform (STFT) is one of the most conventional feature
extraction methods. The Hjorth parameter can be also
used as a good feature in real-time EEG applications. In
this section, after introducing the STFT and the Hjorth
parameter, our proposed method of extracting a high-
informative feature will be presented in detail.
A. Short- Time Fourier Transform (STFT)
Window w, cetered m
m Time
Fre
quen
cy
Time
Fre
quen
cy
(a)
(b)
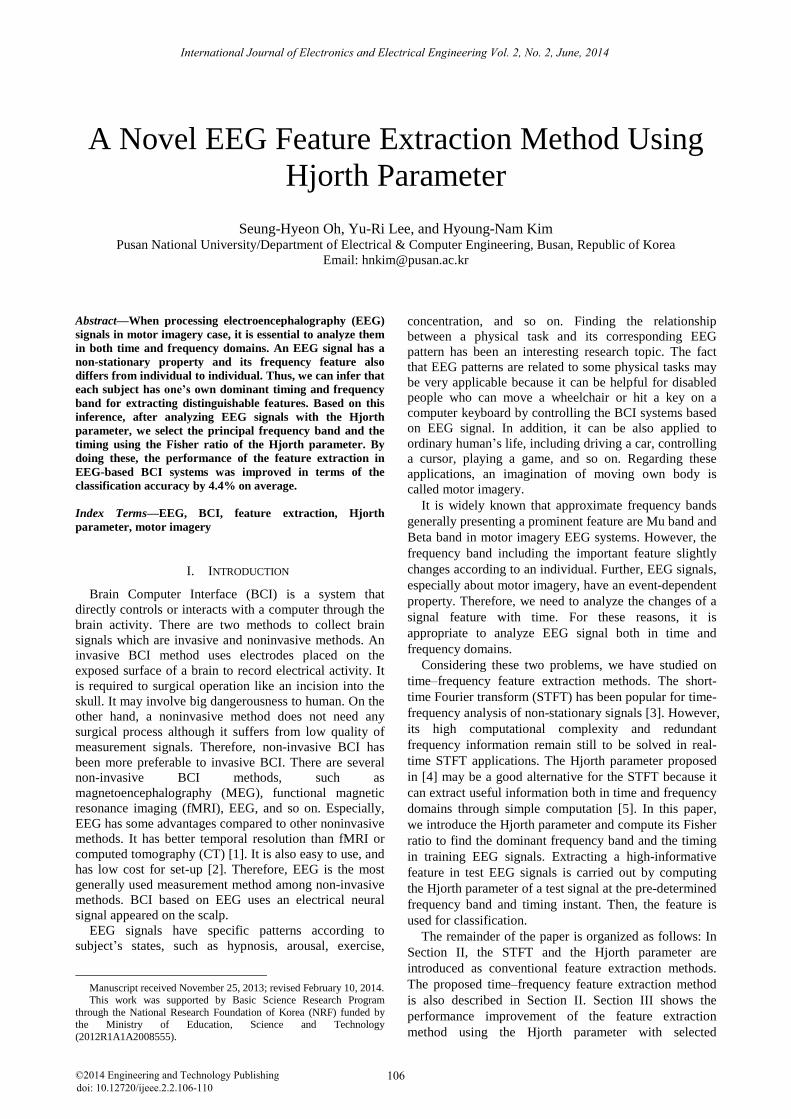
Figure 1. Comparison of the time-frequency plane (a) STFT and (b) Fourier transform.
Fourier transform is used for analyzing a signal in
entire frequency domain and shows the relative power of
each frequency. However, this method is not appropriate
for analyzing non-stationary signals. As shown in Fig. 1,
Fourier transform has no dependency on specific time
because it calculates frequency response based on whole
time, not local time. In this respect, the STFT method
may become a good candidate for analyzing non-
stationary signals [6]. It analyzes localized signal by
windowing in frequency domain [3]. Letting be a
non-stationary signal, here EEG signal, the STFT can be
applied to the EEG signal as follows:
( ) [ ] [ ] j n
n
X m x n w n m e
(1)
where is a windowing function. As we can see in (1)
and Fig. 1, the STFT represents the Fourier transform of
the local windowed signal divided in time domain and
shows the frequency response according to time variation.
Thus, the STFT method can be used for extracting a
feature of EEG signals.
B. Hjorth Parameter [4]
The Hjorth parameter is one of the ways of indicating
statistical property of a signal in time domain and it has
three kinds of parameters as in Table I: Activity, Mobility,
and Complexity. Activity parameter, the variance of the
time function, can indicate the surface of power spectrum
in frequency domain. That is, the value of Activity
returns a large/small value if the high frequency
components of the signal exist many/few. Mobility
parameter is defined as the square root of the ratio of the
variance of the first derivative of the signal and that of the
signal. This parameter has a proportion of standard
deviation of power spectrum. Complexity parameter
indicates how the shape of a signal is similar to a pure
sine wave. The value of Complexity converges to 1 as the
shape of signal gets more similar to a pure sine wave.
TABLE I. THE HJORTH PARAMETER
Parameter Notation
Activity var( ( ))y t
Mobility var( '( ))
var( ( ))
y t
y t
Complexity mobility( '( ))
mobility( ( ))
y t
y t
While these three parameters contain information
about frequency spectrum of a signal, they also help
analyze signals in time domain. In addition, the lower
computational complexity can be achieved with the use
of them.
C. The Proposed Method
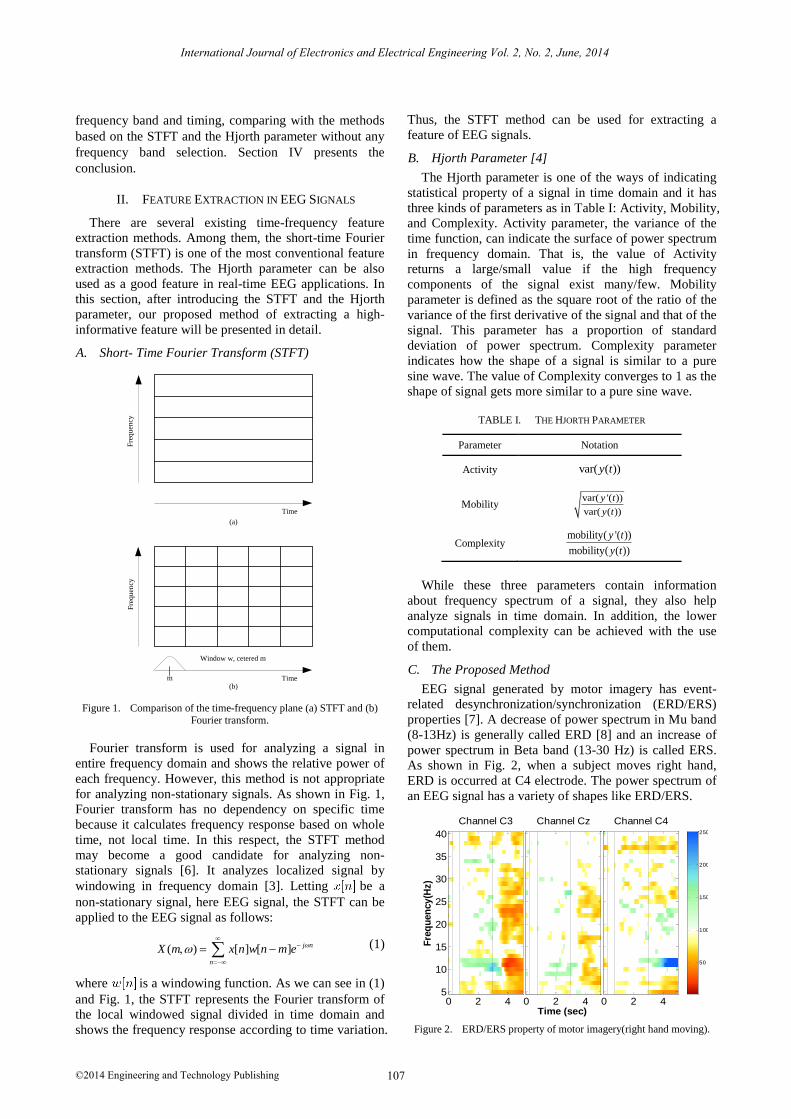
EEG signal generated by motor imagery has event-
related desynchronization/synchronization (ERD/ERS)
properties [7]. A decrease of power spectrum in Mu band
(8-13Hz) is generally called ERD [8] and an increase of
power spectrum in Beta band (13-30 Hz) is called ERS.
As shown in Fig. 2, when a subject moves right hand,
ERD is occurred at C4 electrode. The power spectrum of
an EEG signal has a variety of shapes like ERD/ERS.
Fre
qu
en
cy
(Hz)
Channel C3
0 2 45
10
15
20
25
30
35
40
Time (sec)
Channel Cz
0 2 4
Channel C4
0 2 4
50
100
150
200
250
Figure 2. ERD/ERS property of motor imagery(right hand moving).
107
International Journal of Electronics and Electrical Engineering Vol. 2, No. 2, June, 2014
©2014 Engineering and Technology Publishing
When a subject moves his arms or imagines that, the
distribution of power spectrum is changed in Mu band
and Beta band. The power in the Mu band decreases but
that in the Beta band increases. On the other hand, the
power spectrum is converged on Mu band when a subject
is in the relaxed state. Because the Hjorth parameter can
detect the difference of power spectrum, we can use it as
a feature vector.
Considering that each subject has a slightly different
timing and frequency band of ERD/ERS, we need to find
the individual dominant band where ERD/ERS appears.
To achieve this goal, we introduce the Hjorth parameter
for analyzing EEG signals and then use a band-pass filter
to get a significant frequency band by removing
unnecessary bands where ERD/ERS does not occur.
It is important to select a significant feature in motor
imagery for improving the performance of classification,
because significant features can differ in every subjects.
Therefore, we find the timing and the frequency band by
using Fisher ratio as in the following :
After band-pass filtering in an initial frequency band,
the filtered EEG signal is selected by windowing in time
domain. The duration of a window is 1 sec and windows
are overlapped each other for 0.5 sec. A feature is
calculated by using the Hjorth parameter at each k th
window. In this way, all features are obtained in all
windowed durations of training EEG signals, and then the
features of each class are ensemble-averaged. And this
procedures are repeated, changing a frequency band to
others. The frequency bands are selected as the following
way. The n frequency points are defined within the
frequency range of 5-30 Hz and a frequency band is
composed of two points among n points. Then, the
number of bands is the number of 2 combinations from
frequency points, nC2.
In order to select the important timing and frequency
band, the Fisher ratio ( , , )F j k l , where j is the filter index
2( 1, 2, , )nj C , k is the window index, and l is the
index of the Hjorth parameter (l=Activity, Mobility,
Complexity), is calculated from the averaged features of
two classes as
1 2
2 2
1 2
( , , ) ( , , )( , , )
( , , ) ( , , )
m j k l m j k lF j k l
j k l j k l
(2)
where ( , , )im j k l (i=1,2) denotes the average and
2( , , )i j k l stands for the variance of the Hjorth parameter
l of each class i at k th window and j th filter. If the
Fisher ratio of the extracted feature is high, two classes
are distinguishable by the feature [10]. The prominent
timing and frequency band are selected as
, ,
ˆ ˆˆ[ , , ] max( ( , , ))j k l
j k l F j k l (3)
where j is the index of the prominent band, k is the
index of the prominent timing, and l is the index of the
chosen Hjorth parameter.
III. EXPERIMENTAL RESULTS
A. Data Description
BCI Competition 2008(IV) Graz data set 2b was used
for analysis [9]. This data set consists of EEG data from 9
subjects. The subjects were right-handed, had normal or
corrected-to-normal vision and were paid for parti-
cipating in the experiments. All participants were sitting
in an armchair, watching a flat screen monitor placed
approximately 1-meter away at eye level.
Three bipolar electrodes (C3, Cz, and C4), following
the standard of ten/twenty electrode system, were
recorded with a sampling frequency of 250 Hz. The Fz
electrode was used as the EEG ground. The signals
filtered between 0.5 and 50 Hz. The placement of three
bipolar electrodes could be slightly different for each
subject. Subjects conducted an experiment which was to
imagine moving their own left or right hand in
accordance with the timing schedule as given in Fig. 3.
Fixation crossCue
Imaginary period
0 1 2 3 4 5 96 7 8
Pause
Time(sec)
Beep
Imagination of left hand movement
Imagination of right hand movementPreparation
Figure 3. Timing schedule of one trial [9].
Experimental time per one trial was 8 secs long on
average. Each trial started with the preparation phase for
3 secs and the short acoustic warning tone was sounded at
2 sec after the trial begins. At 1 sec after the warning tone,
a visual cue was presented for 1.25 secs on the screen
monitor. Each cue was a randomized arrow pointing left
or right side. Next, the subjects imagined the
corresponding hand movements according to the
randomized cues. After imagining the task for 4 secs, a
short break was followed up to 2.5 secs.
B. Feature Selection
We chose frequency points 5, 8, 13, 15, 20, 25, and 30
Hz to implement the proposed method. In this paper, the
number of filters is 21. After filtering, the Hjorth
parameter is calculated in each frequency band during 10
secs after the visual cue started. And then a band which
has the highest Fisher ratio among the features is selected.
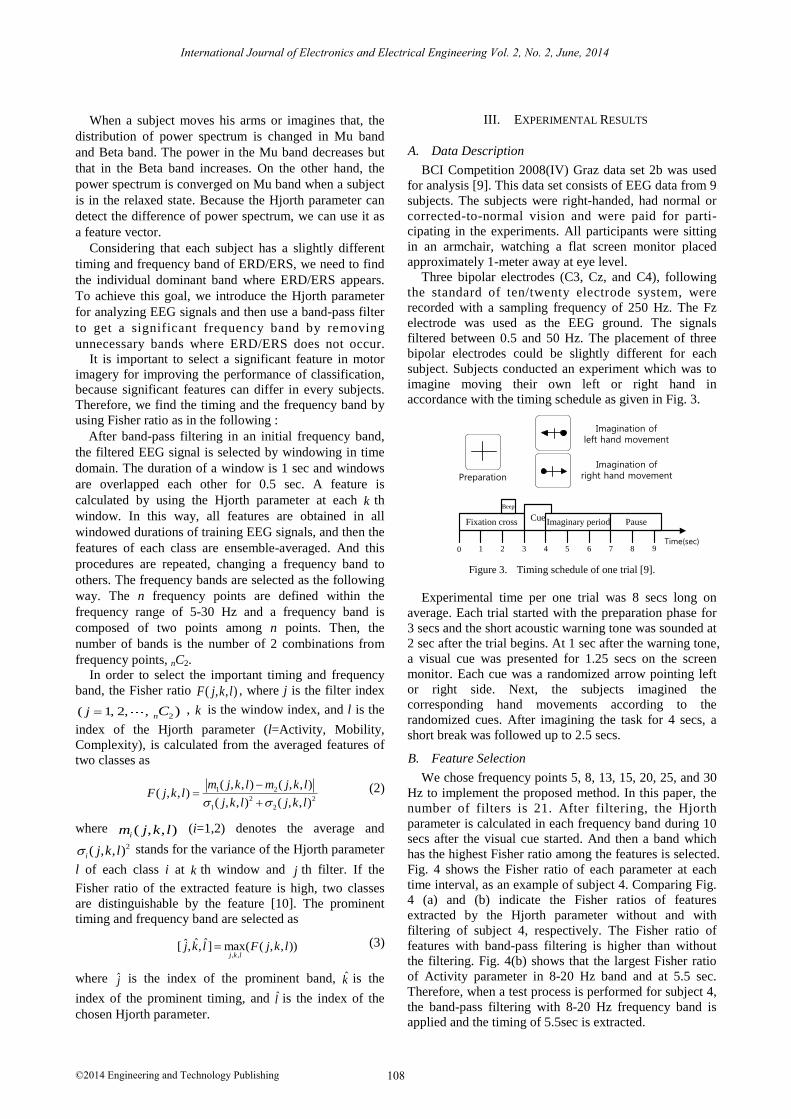
Fig. 4 shows the Fisher ratio of each parameter at each
time interval, as an example of subject 4. Comparing Fig.
4 (a) and (b) indicate the Fisher ratios of features
extracted by the Hjorth parameter without and with
filtering of subject 4, respectively. The Fisher ratio of
features with band-pass filtering is higher than without
the filtering. Fig. 4(b) shows that the largest Fisher ratio
of Activity parameter in 8-20 Hz band and at 5.5 sec.
Therefore, when a test process is performed for subject 4,
the band-pass filtering with 8-20 Hz frequency band is
applied and the timing of 5.5sec is extracted.
108
International Journal of Electronics and Electrical Engineering Vol. 2, No. 2, June, 2014
©2014 Engineering and Technology Publishing
3 4 5 6 7 8 9 10 11 120
1
2
3
Time(sec)
(a)
fish
er
rati
o
Activity
Mobility
Complexity
3 4 5 6 7 8 9 10 11 120
1
2
3
Time(sec)
(b)
fish
er
rati
o
Activity
Mobility
Complexity
Figure 4. Fisher ratio of features extracted by Hjorth parameter of subject 4. (a) without band-pass filtering (b) with 8-20 Hz band-pass
filtering.
In other subjects, the Fisher ratio of Mobility can be
larger than that of Activity. However, the Complexity
parameter is not selected as a feature because the Fisher
ratio of that is very low in whole subjects. Consequently,
Activity and Mobility parameter is proper feature vector
except for Complexity.
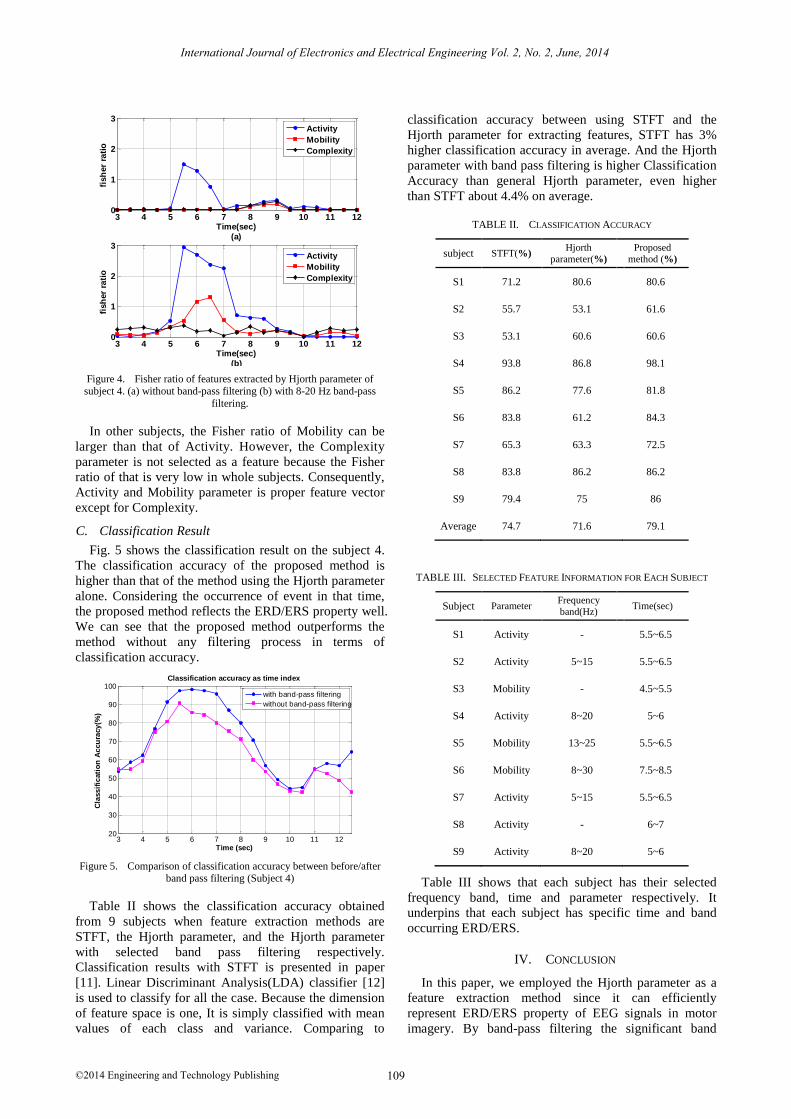
C. Classification Result
Fig. 5 shows the classification result on the subject 4.
The classification accuracy of the proposed method is
higher than that of the method using the Hjorth parameter
alone. Considering the occurrence of event in that time,
the proposed method reflects the ERD/ERS property well.
We can see that the proposed method outperforms the
method without any filtering process in terms of
classification accuracy.
3 4 5 6 7 8 9 10 11 1220
30
40
50
60
70
80
90
100
Time (sec)
Cla
ss
ific
ati
on
Ac
cu
racy
(%)
Classification accuracy as time index
with band-pass filtering
without band-pass filtering
Figure 5. Comparison of classification accuracy between before/after band pass filtering (Subject 4)
Table II shows the classification accuracy obtained
from 9 subjects when feature extraction methods are
STFT, the Hjorth parameter, and the Hjorth parameter
with selected band pass filtering respectively.
Classification results with STFT is presented in paper
[11]. Linear Discriminant Analysis(LDA) classifier [12]
is used to classify for all the case. Because the dimension
of feature space is one, It is simply classified with mean
values of each class and variance. Comparing to
classification accuracy between using STFT and the
Hjorth parameter for extracting features, STFT has 3%
higher classification accuracy in average. And the Hjorth
parameter with band pass filtering is higher Classification
Accuracy than general Hjorth parameter, even higher
than STFT about 4.4% on average.
TABLE II. CLASSIFICATION ACCURACY
subject STFT(%) Hjorth
parameter(%)
Proposed
method (%)
S1 71.2 80.6 80.6
S2 55.7 53.1 61.6
S3 53.1 60.6 60.6
S4 93.8 86.8 98.1
S5 86.2 77.6 81.8
S6 83.8 61.2 84.3
S7 65.3 63.3 72.5
S8 83.8 86.2 86.2
S9 79.4 75 86
Average 74.7 71.6 79.1
TABLE III. SELECTED FEATURE INFORMATION FOR EACH SUBJECT
Subject Parameter Frequency
band(Hz) Time(sec)
S1 Activity - 5.5~6.5
S2 Activity 5~15 5.5~6.5
S3 Mobility - 4.5~5.5
S4 Activity 8~20 5~6
S5 Mobility 13~25 5.5~6.5
S6 Mobility 8~30 7.5~8.5
S7 Activity 5~15 5.5~6.5
S8 Activity - 6~7
S9 Activity 8~20 5~6
Table III shows that each subject has their selected
frequency band, time and parameter respectively. It
underpins that each subject has specific time and band
occurring ERD/ERS.
IV. CONCLUSION
In this paper, we employed the Hjorth parameter as a
feature extraction method since it can efficiently
represent ERD/ERS property of EEG signals in motor
imagery. By band-pass filtering the significant band
109
International Journal of Electronics and Electrical Engineering Vol. 2, No. 2, June, 2014
©2014 Engineering and Technology Publishing
found using the Hjorth parameter and the Fisher ratio, it
is confirmed that each case has own dominant frequency
band and timing. The classification accuracy with the use
of the proposed feature selection method is higher than
that of the conventional feature extraction method, STFT.
In further research, a study on automatic band selection
methods would be needed.
ACKNOWLEDGMENT
This research was supported by Basic Science
Research Program through the National Research
Foundation of Korea(NRF) funded by the Ministry of
Education, Science and Technology (2012R1A1A20085
55).
REFERENCES
[1] E. Martinez-Montes, et al. “Concurrent EEG/fMRI analysis by
multiway partial least squares," NeuroImage, vol. 22, no. 3, pp. 1023-1034, 2004.
[2] J. DellaBadia Jr., et al. “Assessment and cost comparison of sleep-
deprived EEG, MRI and PET in the prediction of surgical treatment for epilepsy,” Seizure, vol. 11, no. 5, pp. 303-309, 2002.
[3] K. M. Kemal, et al. "Comparison of STFT and wavelet transform methods in determining epileptic seizure activity in EEG signals
for real-time application," Computers in Biology and Medicine,
vol. 35, no. 7, pp. 603-616, 2005. [4] H. Bo, "EEG analysis based on time domain properties,"
Electroencephalography and Clinical Neurophysiology, vol. 29, no. 3, pp. 306-310, 1970.
[5] V. Carmen, et al. "Time domain parameters as a feature for EEG-
based brain–computer interfaces," Neural Networks, vol. 22, no. 9, pp. 1313-1319, 2009.
[6] J. K. Hammond and P. R. White, "The analysis of non-stationary signals using time-frequency methods," Journal of Sound and
Vibration, vol. 190, no. 3, pp. 419-447, 1996.
[7] G. Pfurtscheller, “EEG event-related desynchronization (ERD) and event-related synchronization (ERS) in Electroencephalo-
graphy: Basic principles,” Clinical Neurophysiology, vol. 110, no. 11, pp. 1842–1857, 1999.
[8] G. Pfurtscheller, et al. "Mu rhythm (de) synchronization and EEG
single-trial classification of different motor imagery tasks," NeuroImage, vol. 31, no. 1, pp. 153-159, 2006.
[9] M. Tangermann, K. R. Müller, A. Aertsen, et al. “Review of the BCI Competition IV,” Front Neurosci., 2012.
[10] P. Swati, et al. "Feature selection strategy for classification of
single-trial EEG elicited by motor imagery," in Proc. 14th International IEEE Symposium on Wireless Personal Multimedia
Communications, 2011.
[11] N. Brodu, F. Lotte, and A. Lécuyer “Comparative study of band-power extraction techniques for motor imagery classification,” in
Proc. IEEE Symposium on Computational Intelligence, Cognitive
Algorithms, Mind, and Brain, 2011. [12] O. D. Richard, P. E. Hart, and D. G. Stork, Pattern Classification,
New York: John Wiley, Section 10 (2001): l.
Seung-Hyeon Oh received the B.S. degrees in
electronic and electrical engineering from Pusan National University (PNU), Busan, Korea, in
2013. He is currently working toward the M.S.
degree at the Communications and Signal Processing Laboratory (CSPL), Department of
Electronics Engineering at Pusan National University (PNU), Busan, Korea. His main
research interests are in the area of digital signal
processing, pattern recognition, bio signal processing.
Yu-Ri Lee received the B.S. and M.S. degree in
electronic and electrical engineering from Pusan
National University, Busan, Korea, in 2010 and 2012, respectively. She is currently working
toward the Ph.D. degree at the Communications and Signal Processing Laboratory (CSPL),
Department of Electrical & Computer
Engineering at Pusan National University, Busan, Korea. Her main research interests are in the area
of digital signal processing, bio signal processing, signal processing for digital broadcasting, and SCA.
Hyoung-Nam Kim (M’00) received the BS, MS,
and PhD degrees in electronic and electrical engineering from Pohang University of Science
and Technology (POSTECH), Pohang, Korea, in
1993, 1995, and 2000, respectively. From May 2000 to February 2003, he was with Electronics
and Telecommunications Research Institute (ETRI), Daejeon, Korea, developing advanced
transmission and reception technology for
terrestrial digital television. In 2003, he joined the faculty of the Department of Electronics and Electrical Engineering at Pusan National
University (PNU), Busan, Korea, where he is currently an associate professor. From February 2009 to February 2010, he was with the
Department of Biomedical Engineering, Johns Hopkins University
School of Medicine, as a Visiting Scholar. His research interests are in the area of digital signal processing, adaptive IIR filtering, bio signal
processing, and RADAR/SONAR signal processing, in particular, signal processing for digital broadcasting, digital communications, and
multimedia systems. Dr. Kim is a member of IEEE, IEICE, IEEK, and
KICS.
110
International Journal of Electronics and Electrical Engineering Vol. 2, No. 2, June, 2014
©2014 Engineering and Technology Publishing