A novel data-driven workflow combining literature and ...
10
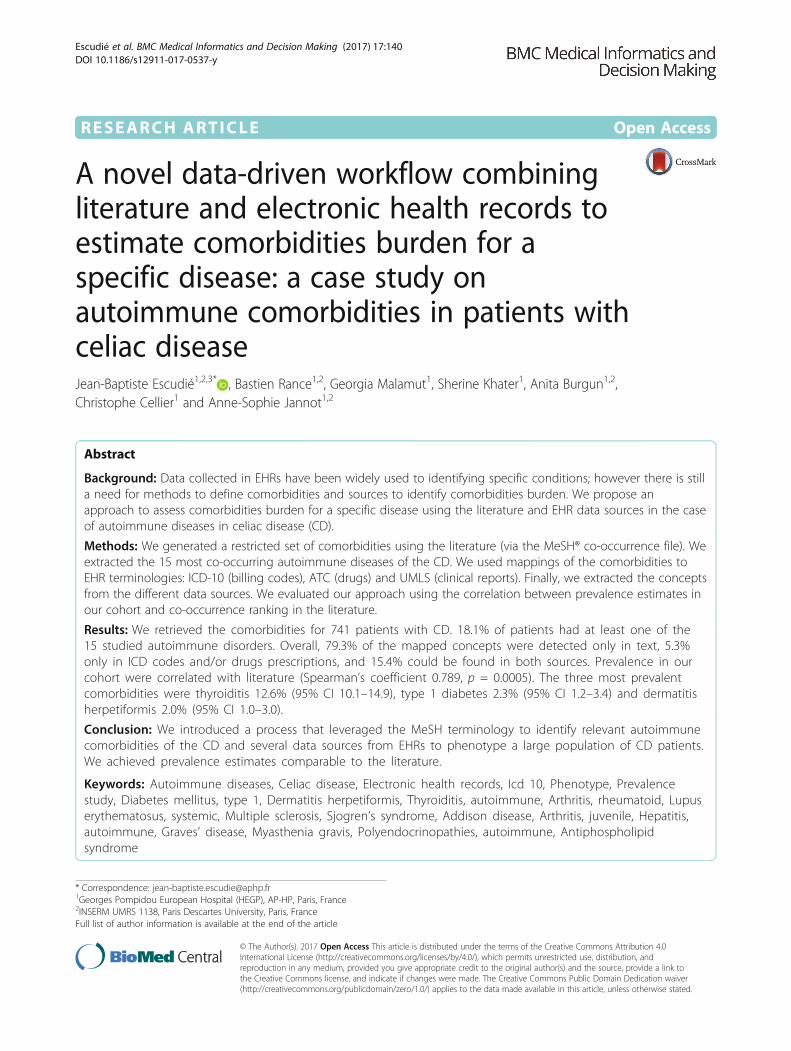
RESEARCH ARTICLE Open Access A novel data-driven workflow combining literature and electronic health records to estimate comorbidities burden for a specific disease: a case study on autoimmune comorbidities in patients with celiac disease Jean-Baptiste Escudié 1,2,3* , Bastien Rance 1,2 , Georgia Malamut 1 , Sherine Khater 1 , Anita Burgun 1,2 , Christophe Cellier 1 and Anne-Sophie Jannot 1,2 Abstract Background: Data collected in EHRs have been widely used to identifying specific conditions; however there is still a need for methods to define comorbidities and sources to identify comorbidities burden. We propose an approach to assess comorbidities burden for a specific disease using the literature and EHR data sources in the case of autoimmune diseases in celiac disease (CD). Methods: We generated a restricted set of comorbidities using the literature (via the MeSH® co-occurrence file). We extracted the 15 most co-occurring autoimmune diseases of the CD. We used mappings of the comorbidities to EHR terminologies: ICD-10 (billing codes), ATC (drugs) and UMLS (clinical reports). Finally, we extracted the concepts from the different data sources. We evaluated our approach using the correlation between prevalence estimates in our cohort and co-occurrence ranking in the literature. Results: We retrieved the comorbidities for 741 patients with CD. 18.1% of patients had at least one of the 15 studied autoimmune disorders. Overall, 79.3% of the mapped concepts were detected only in text, 5.3% only in ICD codes and/or drugs prescriptions, and 15.4% could be found in both sources. Prevalence in our cohort were correlated with literature (Spearman’s coefficient 0.789, p = 0.0005). The three most prevalent comorbidities were thyroiditis 12.6% (95% CI 10.1–14.9), type 1 diabetes 2.3% (95% CI 1.2–3.4) and dermatitis herpetiformis 2.0% (95% CI 1.0–3.0). Conclusion: We introduced a process that leveraged the MeSH terminology to identify relevant autoimmune comorbidities of the CD and several data sources from EHRs to phenotype a large population of CD patients. We achieved prevalence estimates comparable to the literature. Keywords: Autoimmune diseases, Celiac disease, Electronic health records, Icd 10, Phenotype, Prevalence study, Diabetes mellitus, type 1, Dermatitis herpetiformis, Thyroiditis, autoimmune, Arthritis, rheumatoid, Lupus erythematosus, systemic, Multiple sclerosis, Sjogren’s syndrome, Addison disease, Arthritis, juvenile, Hepatitis, autoimmune, Graves’ disease, Myasthenia gravis, Polyendocrinopathies, autoimmune, Antiphospholipid syndrome * Correspondence: [email protected] 1 Georges Pompidou European Hospital (HEGP), AP-HP, Paris, France 2 INSERM UMRS 1138, Paris Descartes University, Paris, France Full list of author information is available at the end of the article © The Author(s). 2017 Open Access This article is distributed under the terms of the Creative Commons Attribution 4.0 International License (http://creativecommons.org/licenses/by/4.0/), which permits unrestricted use, distribution, and reproduction in any medium, provided you give appropriate credit to the original author(s) and the source, provide a link to the Creative Commons license, and indicate if changes were made. The Creative Commons Public Domain Dedication waiver (http://creativecommons.org/publicdomain/zero/1.0/) applies to the data made available in this article, unless otherwise stated. Escudié et al. BMC Medical Informatics and Decision Making (2017) 17:140 DOI 10.1186/s12911-017-0537-y
Transcript of A novel data-driven workflow combining literature and ...
RESEARCH ARTICLE Open Access
A novel data-driven workflow combiningliterature and electronic health records toestimate comorbidities burden for aspecific disease: a case study onautoimmune comorbidities in patients withceliac diseaseJean-Baptiste Escudié1,2,3* , Bastien Rance1,2, Georgia Malamut1, Sherine Khater1, Anita Burgun1,2,Christophe Cellier1 and Anne-Sophie Jannot1,2
Abstract
Background: Data collected in EHRs have been widely used to identifying specific conditions; however there is stilla need for methods to define comorbidities and sources to identify comorbidities burden. We propose anapproach to assess comorbidities burden for a specific disease using the literature and EHR data sources in the caseof autoimmune diseases in celiac disease (CD).
Methods: We generated a restricted set of comorbidities using the literature (via the MeSH® co-occurrence file). Weextracted the 15 most co-occurring autoimmune diseases of the CD. We used mappings of the comorbidities toEHR terminologies: ICD-10 (billing codes), ATC (drugs) and UMLS (clinical reports). Finally, we extracted the conceptsfrom the different data sources. We evaluated our approach using the correlation between prevalence estimates inour cohort and co-occurrence ranking in the literature.
Results: We retrieved the comorbidities for 741 patients with CD. 18.1% of patients had at least one of the15 studied autoimmune disorders. Overall, 79.3% of the mapped concepts were detected only in text, 5.3%only in ICD codes and/or drugs prescriptions, and 15.4% could be found in both sources. Prevalence in ourcohort were correlated with literature (Spearman’s coefficient 0.789, p = 0.0005). The three most prevalentcomorbidities were thyroiditis 12.6% (95% CI 10.1–14.9), type 1 diabetes 2.3% (95% CI 1.2–3.4) and dermatitisherpetiformis 2.0% (95% CI 1.0–3.0).
Conclusion: We introduced a process that leveraged the MeSH terminology to identify relevant autoimmunecomorbidities of the CD and several data sources from EHRs to phenotype a large population of CD patients.We achieved prevalence estimates comparable to the literature.
Keywords: Autoimmune diseases, Celiac disease, Electronic health records, Icd 10, Phenotype, Prevalencestudy, Diabetes mellitus, type 1, Dermatitis herpetiformis, Thyroiditis, autoimmune, Arthritis, rheumatoid, Lupuserythematosus, systemic, Multiple sclerosis, Sjogren’s syndrome, Addison disease, Arthritis, juvenile, Hepatitis,autoimmune, Graves’ disease, Myasthenia gravis, Polyendocrinopathies, autoimmune, Antiphospholipidsyndrome
* Correspondence: [email protected] Pompidou European Hospital (HEGP), AP-HP, Paris, France2INSERM UMRS 1138, Paris Descartes University, Paris, FranceFull list of author information is available at the end of the article
© The Author(s). 2017 Open Access This article is distributed under the terms of the Creative Commons Attribution 4.0International License (http://creativecommons.org/licenses/by/4.0/), which permits unrestricted use, distribution, andreproduction in any medium, provided you give appropriate credit to the original author(s) and the source, provide a link tothe Creative Commons license, and indicate if changes were made. The Creative Commons Public Domain Dedication waiver(http://creativecommons.org/publicdomain/zero/1.0/) applies to the data made available in this article, unless otherwise stated.
Escudié et al. BMC Medical Informatics and Decision Making (2017) 17:140 DOI 10.1186/s12911-017-0537-y

BackgroundPrecise phenotyping of patient data remains one of thekey points of personalized medicine. From a clinical per-spective, detailed knowledge of the comorbidities en-ables targeted treatment strategies. And from a researchperspective, specific and accurate phenotypes allow therecruitment of patients in observational or interven-tional studies. Clinical Data Warehouses (CDW) gatherinformation on hundred thousands of patients. TheseCDWs can be used to phenotype comorbidities as in ourinstitution [1].To phenotype patients using Electronic Health Re-
cords (EHRs), many different EHR sources could bemined: for instance International Classification of Dis-eases (ICD) codes, clinical reports, drug prescriptions,procedures, and laboratory test results if relevant. ICDcodes have been widely used to phenotype patients [2].Several studies [3, 4] showed that billing codes were spe-cific enough to identify patients suffering from a givencondition such as inflammatory bowel disease. However,ICD codes have a low sensitivity, particularly if the mainclaim was another condition, because then the studiedcondition is less likely to be coded. Therefore, ICD codesmight perform poorly to phenotype comorbidities. Theclinical narrative within the EHRs forming the patient’smedical history contains lots of detailed information suchas data collected outside the hospital, e.g., results of labtests performed before the admission, or information re-garding decision support, e.g., rejected clinical hypotheses.Disorder terms are indeed present in various types of clin-ical narratives, such as radiology reports [5, 6], medicalobservations [7, 8], nurse narratives [9]– and generallyevery document produced for healthcare activity. Severalauthors reported that clinical notes offer good sensitivity;moreover combining billing codes, clinical notes, andmedications provides superior phenotyping performance[2, 10–12].Strategies such as phenotyping algorithms com-bining different types and sources of data (e.g. as proposedby PheKB [13]) are promising, but they require experttime to develop and the number of available algorithmsare limited and focused on specific diagnoses.Celiac disease (CD) is an autoimmune disorder triggered
by gluten in genetically susceptible individuals. The dis-ease is characterized by autoantibodies directed againstgluten such as anti-gliadin or other targets (anti-transglu-taminase, anti-endomysial). Many symptoms can be asso-ciated with CD, the most prominent are caused bymalabsorption. CD is also associated with numerous auto-immune comorbidities. These comorbidities add to thehigh burden of symptoms and complications for these pa-tients, and might be target for specific treatment strategiesand screening programs. This is why it is necessary toidentify these subpopulations for clinical research andpublic health policies. Previous epidemiological studies
have shown that dysthyroidism and type 1 diabetes me-llitus were the most prevalent diseases in patients withCD (6.0 to 30.2% and 2.2 to 6.5% respectively) [14–20].Several methods were used, namely autoantibody detec-tion [17–20], questionnaires [14, 15, 21, 22], nationalregister [23] and retrospective reviews of medical records[16, 24], providing heterogeneous results, and only esti-mates for one or few autoimmune comorbidities. The esti-mated prevalence of thyroid disorders varies largely inthese studies (from 6 to 30%). Other authors have studiedthe prevalence of CD among patients with autoimmunediseases [25]. For example, there is a high prevalence ofCD in young diabetic patients [26].To the best of our knowledge, there is no clear review
on the most prevalent set of autoimmune comorbiditiesassociated to CD, while there is a need to phenotypeautoimmune comorbidities burden in CD patients to en-able further stratification of patients’ profiles. Whilemethods to phenotype patients for a specific disease ex-ists, they do not allow to estimate comorbidities burdenin a specific domain. This step requires usually domainexperts to define a set of specific comorbidities, but thiselicitation step might introduce bias. Biomedical literatureand its metadata can also be mined to extract knowledgefor various purposes [27]: precision medicine and drug re-positioning, pathway extraction, gene function prediction,data integration, pharmacogenomics, toxicology. As thebiomedical literature also explores comorbidities associ-ated to diseases, its metadata could provide informationon relevant comorbidities for a given disease.The present study aimed to show how a workflow based
on both literature and EHRs information can help identi-fying relevant autoimmune comorbidities in CD and tophenotype for these autoimmune comorbidities the popu-lation of adult CD patients followed up in Georges Po-mpidou European Hospital (HEGP). We assessed itsperformance in this context by assessing quantitativelywhether literature-based knowledge was correlated toknowledge extracted from EHRs regarding autoimmuneCD comorbidities. Our secondary objective aimed atassessing to what extent three major EHR components(ICD codes, drug prescriptions and narrative reports) con-tributed to identifying comorbidities in the specific do-main of autoimmune comorbidities in our population.
MethodsOverviewWe first selected the list of autoimmune diseases fromMeSH® terminology. We then restricted this list to themost frequent autoimmune diseases associated with CDin the literature, based on the number of co-occurrencesof MeSH® terms in MEDLINE®. We mapped selectedautoimmune disorders to different terminologies toidentify concepts and terms for data collection. Then we
Escudié et al. BMC Medical Informatics and Decision Making (2017) 17:140 Page 2 of 10

included CD patients from a local registry and com-pleted by querying the hospital clinical data warehouse(CDW). Finally we identified status for selected auto-immune diseases for these patients by reviewing theirEHR for mapped concepts.
Selection of a restricted set of autoimmune diseasesusing MeSH® co-occurrence fileTo define autoimmune comorbidities burden in CD, wefirst extract a specific set of autoimmune disease. An ini-tial list of autoimmune diseases was defined as: all thechildren of concept ‘Autoimmune Disease’ (D001327) inthe MeSH® hierarchy, i.e., all the descriptors with aMeSH® Tree Number starting with C20.111. We identi-fied amongst this list the autoimmune diseases most fre-quently associated with CD in MEDLINE® using theMeSH® co-occurrence file (MRCOC) provided by theU.S. National Library of Medicine as part of the UMLSMetathesaurus (2014AB release). The MRCOC file con-tains the number of times each pair of MeSH® descrip-tors occurred in MEDLINE® citations. We extracted allpairs of MeSH terms that contained both the MeSH de-scriptor for Celiac Disease (D002446) and any MeSH de-scriptor for autoimmune diseases. We arbitrarilyrestricted the list for this study to the 15 autoimmunediseases the most co-occurring with CD. This process al-lows to focus on a domain of comorbidities using theMeSH hierarchy and to a subset of comorbidities usingthe number of co-occurrences in MEDLINE®.
MeSH® mapping to drugs and diagnoses terminologiesWe used the Unified Medical Language System (UMLS) tomap autoimmune disorders MeSH® concepts to otherterminologies used in the CDW. To leverage diagnosiscodes we used the International Classification of Diseasesversion 10 (ICD-10). We used the Anatomical TherapeuticChemical Classification System (ATC) whenever a drugwas specific to an autoimmune disease. These terminolo-gies (MeSH, ICD-10 and ATC) also provided terms to con-stitute a catalog of words for helping textual data review.
Study populationThe HEGP hospital has a specialized consultation forCD patients with about 50 new patients recruited peryear in the last decade. The gastroenterology departmenthas maintained a list of patients with CD for researchpurposes. The study has been approved and data accessgranted by the following commissions: the “CommissionNationale de l’Informatique et des Libertés” (declaration#174350) and the HEGP institutional review board(registration #00001072).To complete the list of patients maintained by the gastro-
enterology department, we also extracted patients fulfillingthe three following criteria: (i) at least one encounter in the
2000-2014 period of time (ii) presence of at least one ICD10 code for CD (K90) in billing claims; (ii) one or morehospitalization stay or consultation in the gastroenterologydepartment and (iii) at least one text document (dischargeor letter) containing the term ‘celiac disease’ or one of itssynonyms. We extracted these data from HEGP i2b2 CDW[25]. This CDW contains routine care data divided intoseveral categories among them demographics (age, sex, andvital status), vital signs (e.g., temperature, blood pressure,weight…), diagnoses (ICD-10), procedures (French classifi-cation), clinical data (structured questionnaires from EHR),free text reports, pathology codes (French ADICAP classifi-cation), biological test results (LOINC), and ComputerizedProvider Order Entry (ATC) drug prescriptions [28].The study population counted 741 patients and a cor-
pus of 6340 clinical reports (patients’ inclusion flowchartavailable in Fig. 1).
Autoimmune diseases phenotypingWe queried the CDW to identify for each patient thepresence/absence of the selected autoimmune diseases.We used the selected ICD-10 diagnosis codes to querybilling data and selected ATC codes to query Computer-ized Prescription Order Entry data.We extracted every narrative report including dis-
charge summaries, outpatient reports, multi-disciplinaryexpert meeting summaries and letters from all depart-ments of the hospital and reviewed them manually toextract selected autoimmune disease status for each pa-tient. To facilitate the manual review, we developed abrowser-accessible software, FASTVISU [29], interfacedwith the CDW to display and explore all the documentsfor a given patient. FASTVISU highlights terms with anentity recognition module based on a list of regular ex-pressions (e.g., the pattern \bdiab\w + \b to match fordiabetes) defined by the user and approximate matchingtechniques. For the 15 selected autoimmune comorbidi-ties, a set of regular expressions was established, andused to query the CDW and obtain the CD corpus; thentwo trained physicians reviewed all the clinical narrativesin the CD corpus using FASTVISU to validate the pres-ence/absence of each of the selected autoimmune dis-eases for each patient.Because autoimmune diseases are chronic diseases, a
patient was considered having the autoimmune disorderif the condition was ascertained at least once in her/hisEHR. The analysis was performed considering all sourcestogether then each source separately.Figure 2 illustrates our workflow.
Statistical analysisPatients’ characteristics were summarized using medianand interquartile ranges for quantitative variables and pro-portions for qualitative variables. We measured Sperrin’s I
Escudié et al. BMC Medical Informatics and Decision Making (2017) 17:140 Page 3 of 10

coefficient [30] to evaluate temporal irregularity of thedata recorded in the EHR, denoting whether some en-counters would provide more data and, consequently,whether other time periods would be less covered. Sper-rin’s I coefficient was calculated for each patient with atleast 2 encounters using formula (1):
I ¼ 2n
þ n−2n
1−ffiffiffiffiffiffiffiffiffiffiffiffiffiffiffiffiffiffiffiffiffiffiffiffiffiffiffiffiffiffiffiffiffiffiffiffiffiffiffiffiffiffiffiffiffiffiffiffiffiffiffiffiffiffiffiffiffiffiffiffiffiffiffiffiffiffiffiffi
n−1ð Þ Var gi; i ¼ 1;…; n−1� �
q
� �
ð1Þ
Reviewers’ mutual-agreement in the text review wasevaluated with Cohen’s alpha coefficient.For each autoimmune disease, a case was defined by at
least one ICD code, one drug prescription, or one men-tion in text. For each prevalence estimate, we computedthe 95% confidence interval or Wilson’s interval if theproportion was close to 0%.
To compare the contributions of text, ICD codes anddrugs to estimate autoimmune comorbidities, we com-puted the proportions of cases detected by text alone,structured information (ICD code or drug prescriptionon CPOE) alone, or both.Finally, to assess the performance of literature-based
comorbidities selection, we estimated the correlation be-tween MeSH® and diseases prevalence, using Spearman’scorrelation coefficient between number of publicationsindexed with MeSH® terms for both CD and an auto-immune disease, and the prevalence the correspondeddisease obtained from our EHR extraction.Statistical analysis was conducted with R (version 3.1.2).
ResultsWe selected the first fifteen autoimmune disease whoseMeSH® terms co-occurred the most with CD MeSH®terms in MEDLINE (Table 1). The most frequent weretype I diabetes (523 citations), dermatitis herpetiformis
Fig. 1 Patients inclusion flowchart
Escudié et al. BMC Medical Informatics and Decision Making (2017) 17:140 Page 4 of 10

(478 citations), and thyroiditis (96 citations). The numberof co-occurrences ranged from 12 to 523.The mapping of the selected autoimmune diseases to
ICD-10 provided 39 diagnosis codes (Table 1). For themapping of the selected disease to ATC, levothyroxinewas used as marker for dysthyroidism, and insulin as amarker for type I diabetes. Insulin and levothyroxine cor-responded to a total of 263 ATC codes (Additional file 1).We built a catalog of 55 terms from ICD-10, ATC andMeSH to help review of narratives.The 741 included patients had overall 6340 clinical re-
ports. Patients’ characteristics are presented in Table 2.Ages spanned adulthood, with a mean of 42.5 yearsand a standard deviation of 16.9 years. Most were fe-male, with a sex ratio of 2.8.Eighteen patients (2.4%)had only one encounter. One third of the patientshad been followed up for 5 to 20 years. Patients hada median of 5 [3; 10] clinical documents, with a max-imum of 146. Half of the CD patients had no otherICD-10 code than CD, 19.7% had 1 to 5 distinctICD-10 codes, and 12.7% had between 6 and 69codes. Most patients (93.5%) had at least onehospitalization stay during the 2000-2014 period, asall patients are offered a day hospital admission forinitial management of their CD.Sperrin’s I coefficient was 0.759 mean (SD) 0.10, indi-
cating that patients were followed up regularly.
Readers voted on 466 items. More specifically, 465 pa-tients out of the 741 included patients had nohighlighted terms and 466 autoimmune disease itemshad at least one highlighted term occurrence on the 276remaining patients. For 140 items, voters both approvedthat the patient suffered from this disease; for 304 items,readers both disapproved that the patient suffered fromthis disease and for 22 items, readers mutually disagreed.Therefore, inter-reviewer agreement for autoimmunedisorder identification in narrative reports was excellent,with a Cohen’s kappa value of 0.89.The prevalence estimates of the 15 selected auto-
immune diseases with their 95% confidence intervals arepresented in Tables 3 and 4 together with literatureestimates.Figure 3 represents the respective contributions of text
and structured information to identify cases. Overall,79.3% of the cases were detected only in text, 5.3% onlyin ICD codes and/or drugs prescriptions, and 15.4%could be found in both types of sources, with variationsacross the diseases. 86% of dermatitis herpetiformis diag-noses were mentioned only in narrative reports, whereasonly 7% were found as structured information exclu-sively; in 7% of the cases the dermatitis herpetiformis in-formation was present in both text and ICD codes.Information regarding autoimmune thyroiditis wasmostly present only in text (92.5% of detected cases),
Fig. 2 Workflow from comorbidities selection to comorbidities burden phenotyping
Escudié et al. BMC Medical Informatics and Decision Making (2017) 17:140 Page 5 of 10

with only 2.2% of cases detected in codes alone, and5.3% in both text and structured data (ICD code and/ordrugs prescription). Type 1 diabetes was detected by textalone in 17.6% of the cases, codes alone in 23.5%, andfound in both in 58.8% of the cases.The three most prevalent diseases were thyroiditis
(12.6%), type 1 diabetes (2.3%) and dermatitis herpetifor-mis (2.0%). 18.1% of CD patients had at least one of the15 autoimmune diseases, in accordance with literature
Table 1 Autoimmune disease selection by descending order of co-occurrence frequencies and ICD-10 codes used for diagnosisextraction
MeSH® terms N co-occurrences DUI* ICD-10
Diabetes Mellitus, Type 1 523 D003922 E10.a
Dermatitis Herpetiformis 478 D003874 L130
Thyroiditis, Autoimmune 96 D013967 E063
Arthritis, Rheumatoid 87 D001172 M069.a
Lupus Erythematosus, Systemic 73 D008180 M32.a
Multiple Sclerosis 44 D009103 G35
Sjogren’s Syndrome 43 D012859 M350
Addison Disease 42 D000224 E271|E272
Arthritis, Juvenile 37 D001171 M089.a
Hepatitis, Autoimmune 35 D019693 K754
Graves’ Disease 30 D006111 E050|E05.a
Glomerulonephritis, IGA 27 D005922 N0330|N0170
Myasthenia Gravis 22 D009157 G700
Polyendocrinopathies, Autoimmune 15 D016884 E31.a
Antiphospholipid Syndrome 12 D016736 D686.a
* DUI Descriptor Unique IdentifiersaMeans all descending nodes, | means OR
Table 2 Population characteristics
Age in years, mean (SD) 42.5 (16.9)
Sex, n (%)
Female 545 (73.6)
Male 196 (26.4)
Follow-up time in years per patient, n (%)
0 (1 encounter) 18 (2.4)
0–1 248 (33.5)
1–2 91 (12.3)
2–5 134 (18.1)
5–20 250 (33.7)
In- or Outpatient, n (%)
Outpatients 48 (6.5)
Inpatients 693 (93.5)
Number of encounters, median (IQR), max 3 (2, 4), 47
Documents per patient, median (IQR), max 5 (3, 10), 146
Sperrin’s I irregularity indicator, mean (SD), n = 638 0.759 (0.10)
Number of distinct ICD-10 codes per patient, n (%) a
0 372 (50.2)
1 129 (17.4)
2–5 146 (19.7)
6–69 94 (12.7)
IQR interquartile rangeaExcept code K900 for Celiac disease
Table 3 Prevalence estimates
Disease N cases Prevalence per1000 patient [CI95]
Autoimmune thyroiditis 93 125.5 (101; 149)
Type 1 diabetes mellitus 17 22.9 (12.1; 33.5)
Dermatitis herpetiformis 15 20.2 (10; 30.2)
Rheumatoid arthritis 7 9.4 (2.5; 16.3)
Autoimmune hepatitis 7 9.4 (2.5; 16.3)
Graves’ disease 6 8.1 (1.6; 14.5)
Sjogren’s syndrome 6 8.1 (1.6; 14.5)
Addison disease 3 4 (1.4; 11.8)
Systemic lupus erythematosus 2 2.7 (0.7; 9.8)a
Juvenile arthritis 1 1.3 (0.1; 7.6)a
Multiple sclerosis 1 1.3 (0.1; 7.6)a
Autoimmune Polyendocrinopathies 1 1.3 (0.1; 7.6)a
Antiphospholipid syndrome 0 0 (0; 5.2)a
Myasthenia gravis 0 0 (0; 5.2)a
CI95: 95% confidence intervalaWilson’s intervals
Escudié et al. BMC Medical Informatics and Decision Making (2017) 17:140 Page 6 of 10
estimates. Prevalence estimates strongly correlate withco-occurrence ranking for the 15 autoimmune diseases,as measured by a Spearman’s correlation coefficientvalue of 0.789 (P value = 0.0005). The three most preva-lent autoimmune diseases in our adult CD populationappeared as the top three in the co-occurrence ranking.
DiscussionWe successfully identify major CD autoimmune comor-bidities using a novel data-driven workflow leveragingMeSH® terminology and Medline MeSH® co-occurrences.We mapped these comorbidities to terminologies used inEHRs to phenotype a new set of 741 patients achievingprevalence estimates comparable to the literature. Onefinding is the importance of clinical text reports as themost informative data source to phenotype patients wasclinical narratives.
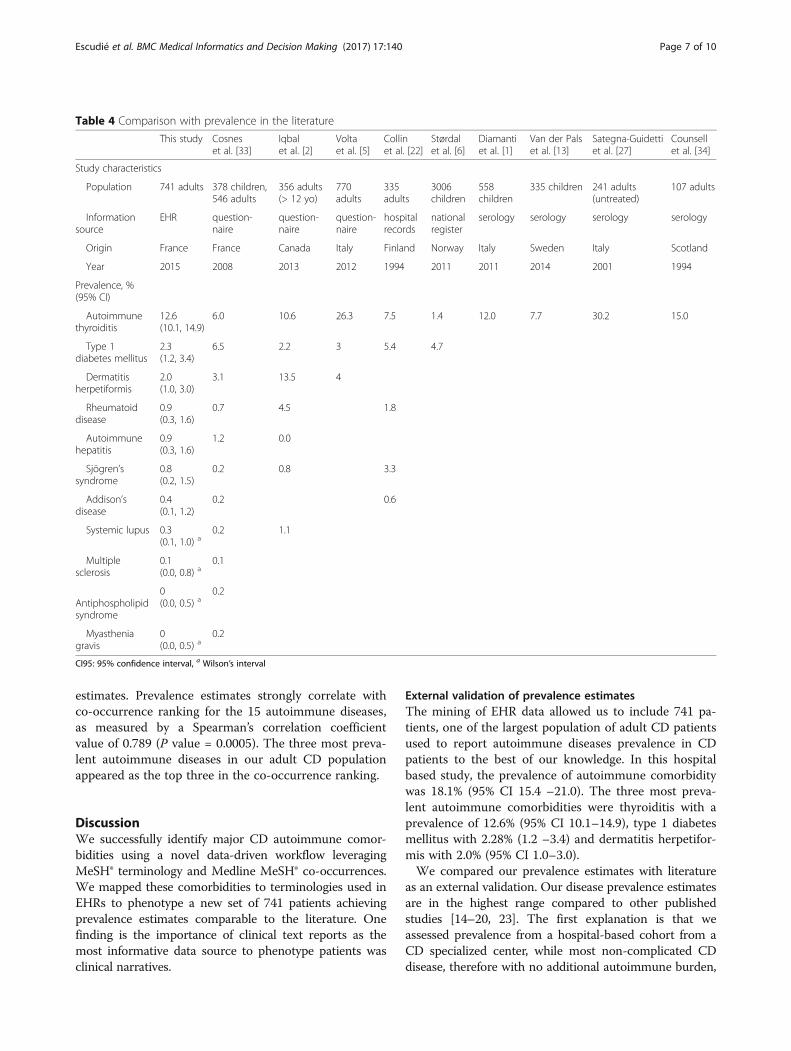
External validation of prevalence estimatesThe mining of EHR data allowed us to include 741 pa-tients, one of the largest population of adult CD patientsused to report autoimmune diseases prevalence in CDpatients to the best of our knowledge. In this hospitalbased study, the prevalence of autoimmune comorbiditywas 18.1% (95% CI 15.4 –21.0). The three most preva-lent autoimmune comorbidities were thyroiditis with aprevalence of 12.6% (95% CI 10.1–14.9), type 1 diabetesmellitus with 2.28% (1.2 –3.4) and dermatitis herpetifor-mis with 2.0% (95% CI 1.0–3.0).We compared our prevalence estimates with literature
as an external validation. Our disease prevalence estimatesare in the highest range compared to other publishedstudies [14–20, 23]. The first explanation is that weassessed prevalence from a hospital-based cohort from aCD specialized center, while most non-complicated CDdisease, therefore with no additional autoimmune burden,
Table 4 Comparison with prevalence in the literature
This study Cosneset al. [33]
Iqbalet al. [2]
Voltaet al. [5]
Collinet al. [22]
Størdalet al. [6]
Diamantiet al. [1]
Van der Palset al. [13]
Sategna-Guidettiet al. [27]
Counsellet al. [34]
Study characteristics
Population 741 adults 378 children,546 adults
356 adults(> 12 yo)
770adults
335adults
3006children
558children
335 children 241 adults(untreated)
107 adults
Informationsource
EHR question-naire
question-naire
question-naire
hospitalrecords
nationalregister
serology serology serology serology
Origin France France Canada Italy Finland Norway Italy Sweden Italy Scotland
Year 2015 2008 2013 2012 1994 2011 2011 2014 2001 1994
Prevalence, %(95% CI)
Autoimmunethyroiditis
12.6(10.1, 14.9)
6.0 10.6 26.3 7.5 1.4 12.0 7.7 30.2 15.0
Type 1diabetes mellitus
2.3(1.2, 3.4)
6.5 2.2 3 5.4 4.7
Dermatitisherpetiformis
2.0(1.0, 3.0)
3.1 13.5 4
Rheumatoiddisease
0.9(0.3, 1.6)
0.7 4.5 1.8
Autoimmunehepatitis
0.9(0.3, 1.6)
1.2 0.0
Sjögren’ssyndrome
0.8(0.2, 1.5)
0.2 0.8 3.3
Addison’sdisease
0.4(0.1, 1.2)
0.2 0.6
Systemic lupus 0.3(0.1, 1.0) a
0.2 1.1
Multiplesclerosis
0.1(0.0, 0.8) a
0.1
Antiphospholipidsyndrome
0(0.0, 0.5) a
0.2
Myastheniagravis
0(0.0, 0.5) a
0.2
CI95: 95% confidence interval, a Wilson’s interval
Escudié et al. BMC Medical Informatics and Decision Making (2017) 17:140 Page 7 of 10

are likely to be followed-up in ambulatory care only.Moreover, our study benefited from the coverage of theCDW, which includes a long follow-up and, therefore, in-creases the probability of mentioning an associated auto-immune disease. The quality of this longitudinal source ofinformation was measured by Sperrin’s coefficient, whichdemonstrates a broad coverage of text documents duringthe follow-up period. In contrast, prevalence studies basedon questionnaires [14, 15, 21] may underestimate preva-lence, e.g., due to memory bias.It would have been of interest to extract diagnosis
date, but as we expected many missing data and approx-imations due to early childhood diagnoses, we did notextract this information.
Text reports were more sensitive than ICD codes andmedications for detecting autoimmune comorbiditiesIn this study, most diagnoses were ascertained throughtext reports. This finding is consistent with the review byShivade et al. of 97 studies using EHR for phenotype iden-tification [2]. A typical example is thyroiditis, where about98% of the cases were found in the text reports (92.5%only in text, and 5.3% in both text and structured data).Few diagnoses cases were ascertained through ICD-10
codes. In France, as in many countries, ICD-10 coding isprimarily used for billing purposes and limited to inpa-tients. Consequently, the coding does not aim to coverall the patient’s conditions [31]. Moreover narrative re-ports include extensive information such as a dedicated
medical history section [10]. Additionally, autoimmunedisease cases were identified in our study using docu-ments produced during outpatient visits during whichno ICD-10 codes were collected in line with Frenchregulation (no ICD-10 codes are produced during out-patient visits in France). Similarly, Wei et al. analyzedthe respective contributions of clinical notes, ICD codesand medications for detecting ten diseases in EHRs andshowed that clinical narratives offered the best sensitivity(0.77) [12].Our results showed the benefits of combining text
mining and structured data extraction. Other examplesare found in the literature in colon cancer [11], atrial fib-rillation, Alzheimer’s disease, breast cancer, gout, humanimmunodeficiency virus infection, multiple sclerosis,Parkinson’s disease, rheumatoid arthritis, and types 1and 2 diabetes mellitus [12].
Literature-based selection of autoimmune diseasesTo the best of your knowledge there was no clear syn-thesis of major CD autoimmune comorbidities. Thenovel approach mining literature presented in this studyenabled to identify relevant comorbidities as attested bythe fact that the attention from the literature was coher-ent with the prevalence found both in the literature andin our cohort: autoimmune dysthyroidism or type 1 dia-betes mellitus appeared in the top co-occurring MeSH®terms and these comorbidities were described in theliterature as being the most prevalent autoimmune
Fig. 3 Phenotypes identified by text reviewing only (black), ICD codes or drugs only (grey), both (light grey), in percent
Escudié et al. BMC Medical Informatics and Decision Making (2017) 17:140 Page 8 of 10

comorbidities in CD patients [16, 20]. Furthermore, thethree most prevalent autoimmune diseases in our adultCD population appeared as the top three in the co-occurrence ranking. Our method is flexible as domain re-striction using MeSH® hierarchy and limiting the numberof results with the number of co-occurrence are both op-tional, although we haven’t evaluated this method withoutthese two types of restrictions. Moreover, this novel ap-proach provided us with the most recent list of auto-immune diseases associated with CD in the literature.This is of interest because research subjects evolve overtime and in this light Medline acts as a biomedical re-search collective memory and an up-to-date view ofclinical expertise. For example, based on MEDLINE co-occurrences before year 2000, Autoimmune Hepatitiswould not be in the top 15 selection, but Pemphigus andPemphigoid, Bullous would be (see Additional file 2).Combined with EHR mining give us prevalence estimate ofcomorbidities that were not suspected as being associatedto CD at the time patients’ diagnoses were recorded. An-other advantage of this data-driven selection is to providean automatable alternative to the usual elicitation stepwhich classically determines relevant comorbidities by do-main experts. This method allows to design more prag-matic studies, not relying on one or two experts’ opinion.
Automatable and RECORD statement compliant workflowThe workflow of this study, i.e. comorbidities selectionfrom the MeSH® co-occurrences file, mapping from MeSH®to other terminologies, and case identification through textand coded data mining, can be automated to estimate co-morbidities burden in other EHR-based studies.Our workflow is in line with RECORD statement [32],
in particular reporting a complete list of codes and algo-rithms for each comorbidities.Moreover, we demonstrated that manual review could be
performed easily using text visualization tools integrated withthe CDW, even for non-English language based EHR [29].Phenotyping quality is sometimes considered as a limit
of EHR reuse. In the proposed workflow, we reinforcephenotyping quality by manual phenotype extraction bytwo readers in reasonable time thanks to assisted extrac-tion using a visualization tool, FASTVISU. While FAS-TVISU is based on regular expressions which lack ofprecision, our workflow could be improved using a nat-ural language based tool.
ConclusionWe provide an automatable workflow fulfilling require-ments from RECORD statement on observationalroutinely-collected health data aiming at identifying co-morbidities burden for a specific disease using EHR. Weapplied this workflow to finely phenotype autoimmune
comorbidities in a large CD population. We think that thisflexible workflow will ease the extraction of relevant infor-mation from EHR.
Additional files
Additional file 1: List of ATC codes used. Lists of AnatomicalTherapeutic Chemical Classification System (ATC) codes used forautoimmune thyroiditis (levothy*) and for diabetes mellitus, Type 1(insulin). (DOCX 13 kb)
Additional file 2: Evolution of the numbers of co-occurrences in time.The 15 first ranked autoimmune diseases (in red) which would have beenincluded based on the literature available at various time points. Numbersof co-occurrences until the specified year, ranks in prevalence estimatesfrom this study, ranks in number of MeSH terms co-occurrence with term‘Celiac Disease’ in MEDLINE at specified years. First version of the clinicalvignette related on a new analgesic to control pain in mild trauma injurieswith the four experimental factors tested. Description of first clinical vignetteand list of response options. (DOCX 17 kb)
AcknowledgmentsDavid Baudoin participated in the data management of the list of CDpatients.Dr. Eric Zapletal participated in the CDW data extractions.Dr. Pierre Durieux revised critically the manuscript.
FundingNo external funding, apart from the support of the authors’ institution, wasavailable for this study.
Availability of data and materialsMeSH®, ATC and MRCOC file are available in the UMLS from the U.S. NationalLibrary of Medicine.Data generated from these terminologies and dataset during this study areincluded in this published article and its Additional files, with exception ofindividual clinical data.
Authors’ contributionsJBE conceived the study, reviewed the EHR, conducted the data analysis,participated in data interpretation and redacted the manuscript. BRparticipated in the study design, the terminologies extraction, datainterpretation, drafting the work. GM participated in the study design andthe data interpretation. SK participated in the study population inclusion,and the data interpretation. AB participated in the study design, the datainterpretation, and drafting the work. CC participated in the datainterpretation. ASJ conceived the study, reviewed the EHR, and participatedin data interpretation and in the manuscript redaction. Every authors revisedcritically the manuscript, gave their final approval and agreed to beaccountable for all aspects of the study.
Ethics approval and consent to participateThis study has been approved by the institutional review board forobservational study (Comité éthique de recherche des hôpitaux universitairesParis Ouest) under registration #00001072.Patient consent for reuse of their EHR on an opt-out basis is declared at theCommission Nationale de l’Informatique et des Libertés, references #1743502and #1695855v0.
Consent for publicationNot applicable.
Competing interestsThe authors declare that they have no competing interests.
Publisher’s NoteSpringer Nature remains neutral with regard to jurisdictional claims inpublished maps and institutional affiliations.
Escudié et al. BMC Medical Informatics and Decision Making (2017) 17:140 Page 9 of 10

Author details1Georges Pompidou European Hospital (HEGP), AP-HP, Paris, France. 2INSERMUMRS 1138, Paris Descartes University, Paris, France. 3Pôle InformatiqueMédicale et Santé Publique, Hôpital Européen Georges Pompidou, 20 rueLeblanc, 75015 Paris, France.
Received: 18 November 2016 Accepted: 12 September 2017
References1. Jannot AS, Zapletal E, Avillach P, Mamzer MF, Burgun A, Degoulet P. The
Georges Pompidou University Hospital Clinical Data Warehouse: a 8-yearsfollow-up experience. Int J Med Inform. 2017;102:21–8.
2. Shivade C, Raghavan P, Fosler-Lussier E, Embi PJ, Elhadad N, Johnson SB, etal. A review of approaches to identifying patient phenotype cohorts usingelectronic health records. J Am Med Inform Assoc. 2014;21:221–30.
3. Conway M, Berg RL, Carrell D, Denny JC, Kho AN, Kullo IJ, et al. Analyzingthe heterogeneity and complexity of electronic health record orientedphenotyping algorithms. AMIA Annu Symp Proc. 2011;2011:274–83.
4. Benchimol EI, Guttmann A, Mack DR, Nguyen GC, Marshall JK, Gregor JC, etal. Validation of international algorithms to identify adults withinflammatory bowel disease in health administrative data from Ontario,Canada. J Clin Epidemiol. 2014;67:887–96.
5. Bertaud V, Lasbleiz J, Mougin F, Burgun A, Duvauferrier R. A unifiedrepresentation of findings in clinical radiology using the UMLS and DICOM.Int J Med Inf. 2008;77:621–9.
6. Fiszman M, Chapman WW, Aronsky D, Evans RS, Haug PJ. Automaticdetection of acute bacterial pneumonia from chest X-ray reports. J Am MedInform Assoc. 2000;7:593–604.
7. Hahn U, Romacker M, Schulz S. MEDSYNDIKATE–a natural language systemfor the extraction of medical information from findings reports. Int J MedInf. 2002;67:63–74.
8. Friedman C, Shagina L, Lussier Y, Hripcsak G. Automated encoding ofclinical documents based on natural language processing. J Am MedInform Assoc. 2004;11:392–402.
9. Bakken S, Hyun S, Friedman C, Johnson SB. ISO reference terminologymodels for nursing: applicability for natural language processing of nursingnarratives. Int J Med Inf. 2005;74:615–22.
10. Li L, Chase HS, Patel CO, Friedman C, Weng C. Comparing ICD9-encodeddiagnoses and NLP-processed discharge summaries for clinical trials pre-screening: a case study. AMIA Annu Symp Proc. 2008;2008:404–8.
11. Xu H, Fu Z, Shah A, Chen Y, Peterson NB, Chen Q, et al. Extracting andintegrating data from entire electronic health records for detectingcolorectal cancer cases. AMIA Annu Symp Proc. 2011;2011:1564–72.
12. Wei W-Q, Teixeira PL, Mo H, Cronin RM, Warner JL, Denny JC. Combiningbilling codes, clinical notes, and medications from electronic health recordsprovides superior phenotyping performance. J Am Med Inform Assoc. 2016;23:e20–7.
13. Kirby JC, Speltz P, Rasmussen LV, Basford M, Gottesman O, Peissig PL, et al.PheKB: a catalog and workflow for creating electronic phenotypealgorithms for transportability. J Am Med Inform Assoc. 2016;23(6):ocv202.
14. Cosnes J, Cellier C, Viola S, Colombel J, Michaud L, Sarles J, et al. Incidenceof autoimmune diseases in celiac disease: protective effect of the gluten-free diet. Clin Gastroenterol Hepatol. 2008;6:753–8.
15. Iqbal T, Zaidi MA, Wells GA, Karsh J. Celiac disease arthropathy andautoimmunity study. J Gastroenterol Hepatol. 2013;28:99–105.
16. Collin P, Salmi J, Hällström O, Reunala T, Pasternack A. Autoimmune thyroiddisorders and coeliac disease. Eur J Endocrinol Eur Fed Endocr Soc. 1994;130:137–40.
17. Diamanti A, Ferretti F, Guglielmi R, Panetta F, Colistro F, Cappa M, et al.Thyroid autoimmunity in children with coeliac disease: a prospective survey.Arch Dis Child. 2011;96:1038–41.
18. van der Pals M, Ivarsson A, Norström F, Högberg L, Svensson J, Carlsson A.Prevalence of thyroid autoimmunity in children with celiac diseasecompared to healthy 12-year olds. Autoimmune Dis. 2014;2014:417356.
19. Sategna-Guidetti C, Volta U, Ciacci C, Usai P, Carlino A, De Franceschi L, etal. Prevalence of thyroid disorders in untreated adult celiac disease patientsand effect of gluten withdrawal: an Italian multicenter study. Am JGastroenterol. 2001;96:751–7.
20. Counsell CE, Taha A, Ruddell WS. Coeliac disease and autoimmune thyroiddisease. Gut. 1994;35:844–6.
21. Lubrano E, Ciacci C, Ames PR, Mazzacca G, Oriente P, Scarpa R. The arthritisof coeliac disease: prevalence and pattern in 200 adult patients. Br JRheumatol. 1996;35:1314–8.
22. Volta U, Caio G, Stanghellini V, De Giorgio R. The changing clinical profile ofceliac disease: a 15-year experience (1998-2012) in an Italian referral center.BMC Gastroenterol. 2014;14:194.
23. Størdal K, Bakken IJ, Surén P, Stene LC. Epidemiology of Coeliac Disease andComorbidity in Norwegian Children: J. Pediatr Gastroenterol Nutr. 2013;57:467–71.
24. Bybrant MC, Örtqvist E, Lantz S, Grahnquist L. High prevalence of celiacdisease in Swedish children and adolescents with type 1 diabetes and therelation to the Swedish epidemic of celiac disease: a cohort study. Scand JGastroenterol. 2014;49:52–8.
25. Zapletal E, Rodon N, Grabar N, Degoulet P. Methodology of integration of aclinical data warehouse with a clinical information system: the HEGP case.Stud Health Technol Inform. 2010;160:193–7.
26. Al-Hussaini A, Sulaiman N, Al-Zahrani M, Alenizi A, El Haj I. High prevalenceof celiac disease among Saudi children with type 1 diabetes: a prospectivecross-sectional study. BMC Gastroenterol. 2012;12:180.
27. Gonzalez GH, Tahsin T, Goodale BC, Greene AC, Greene CS. Recentadvances and emerging applications in text and data mining for biomedicaldiscovery. Brief Bioinform. 2016;17:33–42.
28. Abdelali B, Caruba T, Zapletal E, Sabatier B, Durieux P, Degoulet P. A Clinical DataWarehouse-Based Process for Refining Medication Orders Alerts. J Am MedInformat Assoc: JAMIA. 2012;19(5):782–85. doi:10.1136/amiajnl-2012-000850.
29. Escudié J-B, Jannot A-S, Zapletal E, Cohen S, Malamut G, Burgun A, et al.Reviewing 741 patients records in two hours with FASTVISU. AMIA AnnuSymp Proc. 2015;2015:553–9.
30. Sperrin M, Thew S, Weatherall J, Dixon W, Buchan I. Quantifying thelongitudinal value of healthcare record collections forpharmacoepidemiology. AMIA Annu Symp Proc. 2011;2011:1318–25.
31. Casez P, Labarère J, Sevestre M-A, Haddouche M, Courtois X, Mercier S, et al.ICD-10 hospital discharge diagnosis codes were sensitive for identifyingpulmonary embolism but not deep vein thrombosis. J Clin Epidemiol. 2010;63:790–7.
32. Benchimol EI, Smeeth L, Guttmann A, Harron K, Moher D, Petersen I, et al.The REporting of studies Conducted using Observational Routinely-collected health Data (RECORD) Statement. PLoS Med. 2015 [cited 2016 Oct28];12 Available from: http://www.ncbi.nlm.nih.gov/pmc/articles/PMC4595218/.
33. Hruby GW, Matsoukas K, Cimino JJ, Weng C. Facilitating biomedicalresearchers’ interrogation of electronic health record data: Ideas fromoutside of biomedical informatics. J Biomed Inform. 2016;60:376–84.
34. Adler-Milstein J, DesRoches CM, Kralovec P, Foster G, Worzala C, Charles D,et al. Electronic health record adoption in US hospitals: progress continues,but challenges persist. Health Aff Proj Hope. 2015;34:2174–80.
• We accept pre-submission inquiries
• Our selector tool helps you to find the most relevant journal
• We provide round the clock customer support
• Convenient online submission
• Thorough peer review
• Inclusion in PubMed and all major indexing services
• Maximum visibility for your research
Submit your manuscript atwww.biomedcentral.com/submit
Submit your next manuscript to BioMed Central and we will help you at every step:
Escudié et al. BMC Medical Informatics and Decision Making (2017) 17:140 Page 10 of 10