A Nonlinear Model of Cardiac Autonomic Control in...
19
A Nonlinear Model of Cardiac Autonomic Control in Obstructive Sleep Apnea Syndrome JAVIER A. JO, 1,3 ANNA BLASI, 1 EDWIN M. VALLADARES, 1 RICARDO JUAREZ, 2 AHMET BAYDUR, 2 and MICHAEL C. K. KHOO 1 1 Department of Biomedical Engineering, OHE-500, University of Southern California, Los Angeles, CA, 90080-1451 USA; 2 Department of Medicine, University of Southern California, Los Angeles, CA, USA; and 3 Department of Biomedical Engineering, Texas A&M University, College Station, TX, USA (Received 21 November 2006; accepted 23 March 2007; published online 6 April 2007) Abstract—Using the Volterra–Wiener approach, we em- ployed a minimal model to quantitatively characterize the linear and nonlinear effects of respiration (RCC) and arterial blood pressure (ABR) on heart rate variability (HRV) in normal controls and subjects with moderate-to-severe obstructive sleep apnea syndrome (OSAS). Respiration, R– R interval (RRI), blood pressure (BP) and other polysom- nographic variables were recorded in eight normal controls and nine OSAS subjects in wakefulness, Stage 2 and rapid eye-movement sleep. To increase respiratory and cardiovas- cular variability, a preprogrammed ventilator delivered randomly timed inspiratory pressures that were superim- posed on a baseline continuous positive airway pressure. Except for lower resting RRI in OSAS subjects, summary statistical measures of RRI and BP and their variabilities were similar in controls and OSAS. In contrast, RCC and ABR gains were significantly lower in OSAS. Nonlinear ABR gain and the interaction between respiration and blood pressure in modulating RRI were substantially reduced in OSAS. ABR gain increased during sleep in controls but remained unchanged in OSAS. These findings suggest that normotensive OSAS subjects have impaired daytime para- sympathetic and sympathetic function. Nonlinear minimal modeling of HRV provides a useful, insightful, and compre- hensive approach for the detection and assessment of abnormal autonomic function in OSAS. Keywords—Autonomic nervous system, Heart rate variabil- ity, Baroreflex, Respiratory sinus arrhythmia, Volterra– Wiener model, Minimal model, Closed-loop control. INTRODUCTION Obstructive sleep apnea syndrome (OSAS) is char- acterized by repeated episodes of upper airway occlu- sion during sleep. Each occlusion episode results in increasing asphyxia until transient arousal restores upper airway patency. The cardiovascular conse- quences of these events are profound, and chronic exposure to obstructive apnea constitutes an indepen- dent risk factor for systemic hypertension, heart fail- ure, myocardial infarction, and stroke. 5,32,39 Abnormal autonomic control has been suggested as the common factor linking OSAS to these cardiovascular dis- eases. 21,34,37 Recently, we introduced a new noninvasive ap- proach for quantitatively assessing autonomic function in OSAS under different sleep–wake states. This method is based on a closed-loop minimal model of heart rate variability (HRV) that assumes HRV to be generated via two functional mechanisms: direct respiratory–cardiac coupling and the arterial barore- flex. 17 This model was able to capture the most salient features of the cardiorespiratory dynamics under study, but was unable to account for a significant residual fraction of the total variance, particularly dynamics at frequencies below 0.1 Hz. We hypothesize that this residual variance was the consequence of the assumption of linear dynamics in our original model, and that the discrepancy can be largely eliminated by extending the model to incorporate simple nonlineari- ties in and interactions between the model inputs. For small fluctuations about a mean operating point, linear system identification methods provide a convenient and effective means for characterizing a physiological system. However, in many situations, spontaneous or induced physiological fluctuations can be large enough that nonlinear dynamic effects cannot be ignored. Nonlinear dynamics can lead to phenom- ena such as limit cycles, threshold, and saturation ef- fects, which are commonly observed in physiological systems. 38 Experimental studies have also demon- strated nonlinear interactions between the sympathetic Address correspondence to Michael C. K. Khoo, Department of Biomedical Engineering, OHE-500, University of Southern Califor- nia, Los Angeles, CA, 90080-1451 USA. Electronic mail: [email protected] Supported by NIH Grants HL-58725, EB-001978, and M01 RR-43 Annals of Biomedical Engineering, Vol. 35, No. 8, August 2007 (Ó 2007) pp. 1425–1443 DOI: 10.1007/s10439-007-9299-5 0090-6964/07/0800-1425/0 Ó 2007 Biomedical Engineering Society 1425
Transcript of A Nonlinear Model of Cardiac Autonomic Control in...

A Nonlinear Model of Cardiac Autonomic Control in Obstructive Sleep
Apnea Syndrome
JAVIER A. JO,1,3 ANNA BLASI,1 EDWIN M. VALLADARES,1 RICARDO JUAREZ,2 AHMET BAYDUR,2 and MICHAEL
C. K. KHOO1
1Department of Biomedical Engineering, OHE-500, University of Southern California, Los Angeles, CA, 90080-1451 USA;2Department of Medicine, University of Southern California, Los Angeles, CA, USA; and 3Department of Biomedical
Engineering, Texas A&M University, College Station, TX, USA
(Received 21 November 2006; accepted 23 March 2007; published online 6 April 2007)
Abstract—Using the Volterra–Wiener approach, we em-ployed a minimal model to quantitatively characterize thelinear and nonlinear effects of respiration (RCC) and arterialblood pressure (ABR) on heart rate variability (HRV) innormal controls and subjects with moderate-to-severeobstructive sleep apnea syndrome (OSAS). Respiration, R–R interval (RRI), blood pressure (BP) and other polysom-nographic variables were recorded in eight normal controlsand nine OSAS subjects in wakefulness, Stage 2 and rapideye-movement sleep. To increase respiratory and cardiovas-cular variability, a preprogrammed ventilator deliveredrandomly timed inspiratory pressures that were superim-posed on a baseline continuous positive airway pressure.Except for lower resting RRI in OSAS subjects, summarystatistical measures of RRI and BP and their variabilitieswere similar in controls and OSAS. In contrast, RCC andABR gains were significantly lower in OSAS. NonlinearABR gain and the interaction between respiration and bloodpressure in modulating RRI were substantially reduced inOSAS. ABR gain increased during sleep in controls butremained unchanged in OSAS. These findings suggest thatnormotensive OSAS subjects have impaired daytime para-sympathetic and sympathetic function. Nonlinear minimalmodeling of HRV provides a useful, insightful, and compre-hensive approach for the detection and assessment ofabnormal autonomic function in OSAS.
Keywords—Autonomic nervous system, Heart rate variabil-
ity, Baroreflex, Respiratory sinus arrhythmia, Volterra–
Wiener model, Minimal model, Closed-loop control.
INTRODUCTION
Obstructive sleep apnea syndrome (OSAS) is char-acterized by repeated episodes of upper airway occlu-
sion during sleep. Each occlusion episode results inincreasing asphyxia until transient arousal restoresupper airway patency. The cardiovascular conse-quences of these events are profound, and chronicexposure to obstructive apnea constitutes an indepen-dent risk factor for systemic hypertension, heart fail-ure, myocardial infarction, and stroke.5,32,39 Abnormalautonomic control has been suggested as the commonfactor linking OSAS to these cardiovascular dis-eases.21,34,37
Recently, we introduced a new noninvasive ap-proach for quantitatively assessing autonomic functionin OSAS under different sleep–wake states. Thismethod is based on a closed-loop minimal model ofheart rate variability (HRV) that assumes HRV to begenerated via two functional mechanisms: directrespiratory–cardiac coupling and the arterial barore-flex.17 This model was able to capture the most salientfeatures of the cardiorespiratory dynamics understudy, but was unable to account for a significantresidual fraction of the total variance, particularlydynamics at frequencies below 0.1 Hz. We hypothesizethat this residual variance was the consequence of theassumption of linear dynamics in our original model,and that the discrepancy can be largely eliminated byextending the model to incorporate simple nonlineari-ties in and interactions between the model inputs.
For small fluctuations about a mean operatingpoint, linear system identification methods provide aconvenient and effective means for characterizing aphysiological system. However, in many situations,spontaneous or induced physiological fluctuations canbe large enough that nonlinear dynamic effects cannotbe ignored. Nonlinear dynamics can lead to phenom-ena such as limit cycles, threshold, and saturation ef-fects, which are commonly observed in physiologicalsystems.38 Experimental studies have also demon-strated nonlinear interactions between the sympathetic
Address correspondence to Michael C. K. Khoo, Department of
Biomedical Engineering, OHE-500, University of Southern Califor-
nia, Los Angeles, CA, 90080-1451 USA. Electronic mail:
[email protected] byNIHGrantsHL-58725,EB-001978, andM01RR-43
Annals of Biomedical Engineering, Vol. 35, No. 8, August 2007 (� 2007) pp. 1425–1443
DOI: 10.1007/s10439-007-9299-5
0090-6964/07/0800-1425/0 � 2007 Biomedical Engineering Society
1425

and parasympathetic nervous system with respect toheart rate control.14,23 As such, several recent studieshave employed nonlinear dynamical theory and fractalanalysis to characterize HRV.24 Fractal analysis hasbeen shown to be useful for purposes of risk stratifi-cation in patients with impaired left ventricular func-tion following myocardial infarction, providing betterprediction of mortality in this patient population.16
However, one limitation of these univariate analyses isthat they provide information of only the net effects ofthe many influences that give rise to HRV. In contrast,the ‘‘input–output’’ minimal model approach we haveadopted yields greater insight into how the mainphysiological mechanisms that contribute to HRV arealtered in OSAS. As well, this kind of model can bereadily adapted for investigating conditions underwhich rapidly changing dynamics may be important,such as during transient state changes during sleep.3
The approach outlined in this paper employs asecond-order nonlinear time-invariant dual-input rep-resentation, based on the Laguerre expansion tech-nique (LET) for Volterra–Wiener kernel estimation.26
The advantages of this technique and its applicationsto modeling renal blood pressure-flow properties as asingle-input single-output system were demonstratedby Marmarelis and colleagues.7,27 The extension of theLaguerre expansion technique to the estimation of adual-input HRV model was introduced by Chon et al.8
In this study, we propose a model similar in structureto Chon’s to determine how respiratory–cardiac cou-pling and the baroreflex control of heart rate are al-tered by OSAS during wake and sleep.
In summary, the specific objectives of this study are:(a) to quantify the nonlinear dynamics involved on themodulation of HRV by changes in respiration andblood pressure; (b) to determine the significance ofthese nonlinear interactions on the overall variabilityof the heart rate; and (c) to assess how these nonlineardynamics are affected by OSAS and changes in wake–sleep state.
METHODS
Experimental Protocol and Instrumentation
Nine untreated patients with moderate-to-severeOSAS (apnea-hypopnea index=44.1 ± 2.8 h)1) andeight normal controls underwent overnight polysom-nography, preceded by application of the test protocol(described below) during wakefulness. Age was notsignificantly different between the two groups; how-ever, body-mass index was significantly higher in theOSAS patients (p<0.05). All subjects were normo-tensive and were free of diabetes, significant cardiacarrhythmia, congestive heart failure, and lung disease.
Informed consent was obtained prior to each study.The study protocol was approved by the USC Insti-tutional Review Board.
Arterial blood pressure (ABP) was monitored con-tinuously from one wrist using a noninvasive arterialtonometer (Model 7000, Colin Medical Instruments,San Antonio, TX). Electrocardiogram (ECG), arterialoxygen saturation ðSaO2
Þ, central and occipital elec-troencephalogram, chin electromyogram, left and rightelectrooculogram, and nasal thermistor were alsomonitored. All signals were sampled at 200 Hz.
Each subject was connected via nasal mask to acomputer-controlled bilevel pressure ventilator (S/T-D30, Respironics, Pittsburgh, PA). Measurements ofmask pressure and airflow were obtained from thedetachable control panel of the S/T-D ventilator.Airflow was electronically integrated in both inspira-tory and expiratory phases to obtain the instantaneouslung volume (Vt) relative to passive functional residualcapacity. We determined in initial tests that the tidalvolumes derived from the ventilator volume monitorwere highly correlated (r>0.97, p=0.0001) withcorresponding readings obtained from a referencepneumotachometer (Model 3700, Hans Rudolph,Kansas City, MO). A chinstrap was used to keep themouth closed during sleep, preventing leakage orinspiration through the mouth. Continuous monitor-ing of mask pressure enabled the detection of abrupt orunusual changes in baseline pressure that could indi-cate leaks through the mouth.
A minimal continuous positive airway pressure(CPAP) of 2–3 cm H2O was applied during wakeful-ness in the control group in order to overcome theadditional resistance to breathing presented by themask and respiratory apparatus. In the OSAS patients,the levels of CPAP applied ranged from 8 to15 cm H2O, depending on what was necessary toeliminate obstructive apnea and significant hypopneaduring sleep. Obstructive apneas were identified asepisodes of zero airflow lasting 10 s or more, andhypopneas as periods >10 s duration in which thenasal thermistor signal was reduced to <50% of itsmagnitude during unobstructed breathing and SaO2
decreased by >4%. Thus, in the OSAS subjects,obstructive apneas and hypopneas were preventedfrom occurring throughout the night.
During the 10-min test protocol, the ventilator wasset to assist-control, bilevel ventilation mode. Underthis condition, the subject was allowed to breathe at hisown respiratory rate, but the inspiratory pressure wasswitched randomly breath-to-breath between theCPAP level and CPAP+5 cm H2O. Expiratory pres-sure was kept constant at the CPAP level. Using thisexperimental setup, tidal volume was modulatedbreath-to-breath without the need for voluntary
JO et al.1426

control by the subject. This test protocol, which al-lowed the ventilatory pattern of each subject to containa broadened spectrum of frequencies, was designed toenhance the accuracy and reliability of subsequentparameter estimation from the recorded data.20
Following one or two trials to minimize subjectanxiety during wakefulness, the test protocol was ap-plied at least three times in each sleep–wake state. Testsequences which elicited arousals or outright awaken-ing were terminated, and the protocol was not repeateduntil the subject returned to a stable sleep state. Sleepstages were scored according to conventional criteria.30
Data Analysis
From each 10-min test segment, R–R intervals(RRI), and systolic blood pressure (SBP) and diastolicblood pressure (DBP) values were estimated beat-to-beat from the ECG and ABP signals and resampled at2 Hz using the Berger algorithm.2 Very low-frequencyoscillatory behavior or baseline drift was observed insome of the datasets. These ultra low-frequency non-stationarities were removed by detrending the datasetsprior to applying spectral analysis and modeling.
The Model
RRI, Vt, and SBP were assumed to be interrelatedthrough a closed-loop control scheme consistent withthe underlying physiology, as had been previouslyproposed.1,29 We assumed that respiration influencesRRI directly through autonomic respiratory–cardiaccoupling (RCC). The latter is believed to be the resultof central respiratory entrainment of the cardiovagalmotorneurons in the medulla as well as vagal feedbackfrom the pulmonary stretch receptors.10 Respirationalso affects RRI indirectly through changes in intra-thoracic pressure, which are translated into changes inblood pressure that subsequently act on the arterialbaroreflex (ABR). The totality of these respiratoryinfluences on HRV constitutes what is commonlytermed ‘‘respiratory sinus arrhythmia.’’10 The ‘‘closed-loop’’ nature of the control scheme derives from thefact that changes in RRI lead to changes in cardiacoutput, which, in turn, influence blood pressure. Apartfrom intrathoracic pressure changes and changes incardiac output, fluctuations in blood pressure can alsoarise from other sources of spontaneous variability,such as sympathetically driven variations in peripheralvascular resistance.
The focus of this study was limited to the portion ofthe closed-loop model that accounts for HRV. Themodel, illustrated schematically in Fig. 1, assumes thatfluctuations in heart rate are produced through sixfunctional mechanisms. The first five sources corre-
spond to autonomic-mediated mechanisms involved inthe variability of the heart rate: a component withlinear dynamics representing the neural coupling ofrespiration and heart rate (Hx); a linear arterialbaroreflex (ABR) component (Hu); two nonlinearcompartments describing the second-order effects ofrespiration (Hxx) and blood pressure (Huu) on heartrate; and a third nonlinear compartment characterizingmultiplicative interaction of respiration and bloodpressure on heart rate (Hxu). The last source (WRRI)encompasses all other influences not explained by theother linear and nonlinear components.
The nonlinear dynamic relationship between thetwo inputs x(t) (Vt) and u(t) ðDSBPÞ , and the systemoutput y(t) ðDRRIÞ was represented by a second-ordertime-invariant Volterra–Wiener model, represented bythe following equation:
yðtÞ¼TXM
s¼0kxðsÞxðt�s�DxÞþT
XM
s¼0kuðsÞxðt�s�DuÞ
þT2XM
s1¼0
XM
s2¼0kxxðs1;s2Þxðt�s1�DxÞxðt�s2�DxÞ
þT2XM
s1¼0
XM
s2¼0kuuðs1;s2Þuðt�s1�DuÞuðt�s2�DuÞ
þT2XM
s1¼0
XM
s2¼0kxuðs1;s2Þxðt�s1�DxÞuðt�s2�DuÞ
þWRRIðtÞð1Þ
The above equation assumes a discrete time base t withsampling interval T (= 0.5 s). The parameter Mdetermines the extent of the system memory. The linearkernels kx and ku represent the linear contribution to
Hx
Hxx
Hxu
Huu
Hu
+
Vt(n) :x
∆SBP(n) :u
∆RRI(n) : y+
Otherinfluences
WRRI(n)
FIGURE 1. Schematic block diagram of the dual-input sec-ond-order model of HRV. Fluctuations in RRI (HRV) are as-sumed to be produced by: a neural coupling of respirationand RRI (Hx); an arterial baroreflex component (Hu); nonlinear(second-order) effects of respiration (Hxx) and blood pressure(Huu) on RRI; and nonlinear (second-order) interaction ofrespiration and blood pressure on RRI (Hxu). WRRI(n)encompasses all other influences not explained by the model.
Cardiac Autonomic Function in OSAS 1427

the output of each single signal. The nonlinear self-kernels kxx and kuu represent the quadratic contribu-tion of each input signals. The cross-kernel kxu de-scribes the effect on the output resulting from thesecond-order nonlinear interaction of the two inputsignals. The second-order self-kernels are symmetricfunctions of their arguments and the second-ordercross-kernels are asymmetric functions of their argu-ments.
In Eq. (1), Dx and Du are the delays between theoutput ðDRRIÞ and the two inputs (DV and DSBP ,respectively) associated with the corresponding mech-anisms; and the signal WRRI(t) represents the vari-ability of RRI not explained by the model. Causalityconstraints were also imposed upon the model to ac-count for the closed-loop structure of the baroreflexes.A delay of at least Du = 0.5 s was inserted in thebaroreflex dynamics. Previous studies have suggestedthat changes in heart rate are synchronous with neuralrespiration but precedes mechanical inspiration.1,8,17,29
Therefore, the nonlinear model was allowed to adoptnegative values of the delay Dx. In order to accom-modate this effect, the RRI signal was delayed beforethe estimation. Shifting the estimated RCC first- andsecond-order kernels back in time later compensatedfor this negative delay.
A linear version of the model (which includes onlythe first two summations in Eq. (1) was also estimated,in order to determine the improvement in predictiveability of the model when the nonlinear contributionsare taken into account. A description of the Laguerreexpansion of the kernels technique applied in thepresent work for the estimation of our proposed non-linear model is presented in the following section.
It is imperative to note that the system under studyoperates in a closed-loop, so that changes in heart ratecan subsequently affect SBP through changes in car-diac output. In general, this condition, in which themodel input is dependent on its output, can lead toerroneous parameter estimates when conventionalanalysis techniques are employed. To circumvent thisproblem, we formulated the model equations in thetime domain so that ‘‘causality’’ constraints could beimposed: i.e., the model output was constrainedmathematically to be dependent on only past values ofthe inputs. Previous studies have employed similarmethodologies that essentially allow the closed loop tobe ‘‘opened’’ computationally.1,29
Model Estimation and Optimization
The traditional and most straightforward techniquefor multiple-input system kernel estimation has beenthe cross-correlation technique proposed by Leeand Schetzen,22 which performs a Gram–Schmidt
orthogonalization of the Volterra series expansion withrespect to Gaussian white noise. The simplicity of thismethod has facilitated its application to a wide varietyof physiological systems. However, it requires longdata records, strict whiteness of the input, and a heavycomputational burden associated with the estimationof higher-order kernels. An improved version of thealgorithm based on the Laguerre expansion of thekernels26 alleviates most of the deficiencies inherent inthe cross-correlation technique. In particular, the La-guerre expansion technique (LET) does not requirestrict whiteness of the input since Gram–Schmidtorthogonalization with respect to Gaussian white noiseis not utilized. Instead, unknown Laguerre expansioncoefficients are estimated using least-squares minimi-zation. This leads to increased estimation accuracy inthe presence of noise, reduces the requirement for longdata records, and allows accurate kernel estimationwhen the input deviates from the theoretical require-ment for white-noise stimuli.26 The Laguerre functionshave been suggested as an appropriate orthonormalbasis, owing to their built-in exponential term thatmakes them suitable for modeling physical systemswith asymptotically exponential relaxation dynamics.26
The Laguerre expansion technique uses the orthonor-mal set of discrete time Laguerre functions bjðsÞ todiscretize and expand the system kernels of the second-order Volterra model as follows:
k1ðsÞ ¼XS1
jx¼1cx1ðjxÞbjxðsÞ þ
XS2
ju¼1cu1ðjuÞbjuðsÞ
k2ðs1; s2Þ ¼XS1
jx1¼1
XS1
jx2¼1cx2ðjx1; jx2Þbjx1ðs1Þbjx2ðs2Þ
þXS2
ju1¼1
XS2
ju2¼1cu2ðju1; ju2Þbju1ðs1Þbju2ðs2Þ
þXS1
jx¼1
XS2
ju¼1cxuðjx; juÞbjxðs1Þbjuðs2Þ
ð2Þ
In Eq. (2), fcx1ð�Þ; cx2ð�Þ; cu1ð�Þ; cu2ð�Þ; cxuð�Þg are thesets of the unknown expansion coefficients, which areto be estimated from the input–output data; bjðsÞ de-notes the jth order orthonormal discrete time Laguerrefunction; S1 and S2 are the number of Laguerrefunctions used to model both the linear and nonlineardynamics corresponding to the interaction between thetwo inputs and the output. The Laguerre functionsbasis is defined as:
bjðsÞ ¼aðs�jÞ=2ð1� aÞ1=2Xj
k¼0ð�1Þk
s
k
� �j
k
� �
� aj�kð1� aÞk; s � 0
ð3Þ
JO et al.1428

In a more efficient implementation, bjðsÞ can be com-puted recursively as follows:
b0ðsÞ ¼ffiffiffiffiffiffiffiffiffiffiffiffiffiffiffiffiffiffiffiasð1� aÞ
p
bjðsÞ ¼ffiffiffiap
bjðs� 1Þ þffiffiffiap
bj�1ðsÞ � bj�1ðs� 1Þ; j>0
ð4Þ
The parameter (0< a < 1) determines the rate ofexponential decline of the Laguerre functions. Thisparameter is selected based on the kernel memorylength and the number of Laguerre functions used forexpansion, so that all the functions decline sufficientlyclose to zero by the end of the kernel.26 The memorylength of the kernels was fixed to 50 s (100 samples),based on our previous results obtained from applying alinear model to the same data sets.17,18 By inserting Eq.(2) into Eq. (1), the second-order Volterra model thusbecomes:
yðtÞ ¼XS1
jx¼1cx1ðjxÞmjxðtÞ þ
XS2
ju¼1cu1ðjuÞwjuðtÞ
þXS1
jx1¼1
XS1
jx2¼1cx2ðjx1; jx2Þmjx1ðtÞmjx2ðtÞ
þXS2
ju1¼1
XS2
ju2¼1cu2ðju1; ju2Þwju1ðtÞwju2ðtÞ
þXS1
jx¼1
XS2
ju¼1cxuðjx; juÞmjxðtÞwjuðtÞ
ð5Þ
where mjðtÞ and wjðtÞ are the discrete convolutions ofthe inputs with Laguerre functions and denoted as the‘‘key variables’’:
mjðtÞ ¼TXM
s¼0bjðsÞxðt� s�DxÞ
wjðtÞ ¼TXM
s¼0bjðsÞuðt� s�DuÞ
ð6Þ
The unknown expansion coefficients fcx1ð�Þ; cx2ð�Þ;cu1ð�Þ; cu2ð�Þ; cxuð�Þg can be estimated by generalizedleast-square fitting using the time-series y(t), mjðtÞ andwjðtÞ.
To select the model with the minimum number ofparameters (minimal number of Laguerre functions,and hence, expansion coefficients) that would best fitthe observations, the following optimization procedurewas applied. For a given set of number of Laguerrefunctions {S1, S2} and delays {Dx, Du}, the expansioncoefficients were calculated for all combinations of{S1, S2} ranging from 1 to 7, with Dx ranging from )2to 1 s (corresponding to the RSA delay) and Du from0.5 to 2 s (corresponding to the ABR delay). The
‘‘optimal model’’ was selected by searching for theglobal minimum of the minimum description length31
over the entire grid of values for {S1, S2} and thedelays {Dx, Du}. Model adequacy was checked bytesting for whiteness of the residuals and the lack ofcorrelation between the corresponding inputs andresiduals.33 The normalized mean squared error(NMSE) and coherence function served as indicatorsof the prediction accuracy. The optimization proce-dure was performed for every set of data.
Once the Laguerre expansion coefficients for theoptimal candidate model were estimated, the linearimpulse response corresponding to the two mecha-nisms represented in our model (RCC and ABR) wererelated to the linear self-kernels as follows:
hRCCðtÞ ¼ kxðtÞ ¼XS1
j¼0cx1ðjÞbjðtÞ
hABRðtÞ ¼ kuðtÞ ¼XS2
j¼0cu1ðjÞbjðtÞ
ð7Þ
Similarly, the second-order self- and cross-kernelswere estimated from the expansion coefficients as fol-lows:
kxxðs1; s2Þ ¼XS1
jx1¼1
XS1
jx2¼1cx2ðjx1; jx2Þbjx1ðs1Þbjx2ðs2Þ
kuuðs1; s2Þ ¼XS2
ju1¼1
XS2
ju2¼1cu2ðju1; ju2Þbju1ðs1Þbju2ðs2Þ
kxuðs1; s2Þ ¼XS1
jx¼1
XS2
ju¼1cxuðjx; juÞbjxðs1Þbjuðs2Þ
ð8Þ
The corresponding linear version of the models werealso optimized using the same procedure describedabove, but allowing the number of Laguerre functionsemployed {S1, S2} to range from 1 to 15.
Statistical Analysis
To facilitate statistical comparison, compact de-scriptors were derived from the model impulse re-sponses. One of these is the impulse responsemagnitude (IRM) or the difference between the maxi-mum and minimum values of linear kernel. In order tocompare the nonlinear dynamics of the system, theKernel Magnitude (KM), defined as the differencebetween maximum and minimum values of the esti-mated second-order kernels was computed.
Each estimated parameter was subjected to two-wayrepeated-measures analysis of variance (subjectgroup · sleep–wake state). Post-hoc multiple pairwise
Cardiac Autonomic Function in OSAS 1429

comparisons (Student–Newmans–Keuls test) werecarried out if statistical significance was indicated.
Physiological Interpretation of Nonlinear HRVDynamics
One of the limitations of the Volterra–Wiener ap-proach to system identification is that the higher-orderkernels do not readily lend themselves to physiologicalinterpretation. To derive greater insight into thedynamics characterized by the estimated second-orderkernels and what they mean in terms of the underlyingphysiological mechanisms, we performed the followingsimulations.
It has been previously observed that the frequencyresponse relating respiration to RRI is dependent ontidal volume.15 In order to test the hypothesis that thesecond-order RCC component of our model reflectsthis observation, we convolved the average Hx andHxx with a chirp signal (frequency range 1–45 cycles/min) of fixed amplitude of VT liters. The FFT of theestimated RRI response was then derived to representthe frequency response of the RCC component at thegiven tidal volume of VT liters. The simulations wererepeated for various VT values (0.5, 1, 2, and 3 L). Weanticipated that without the Hxx component, the fre-quency response (normalized to the tidal volume level)would be independent of VT. However, with Hxx,there should be VT dependence, so that as VT in-creases, RCC gain increases.
It is also well established that the steady-state ABRresponse is not linear, showing saturation at higherblood pressure levels. In order to test the hypothesisthat the second ABR component of our model reflectsthis observation, we convolved the average Hu andHuu with step functions of different magnitudes (1–5 mmHg). We anticipated that without the Huu com-ponent, the steady-state ABR response should be lin-ear with respect to the step magnitudes; while byincluding Huu a saturation effect should be observed.
Finally, it has been shown that neck suction whenapplied during inspiration produces smaller increasesin RRI than when applied during expiration.11 Thissuggests that there is a respiratory modulation of ABRgain. In order to test the hypothesis that the second-order cross-kernel of our model reflects respiratorymodulation of ABR, we performed the followingsimulation. The average Hxu was convolved with asemi-sinusoidal tidal volume pattern (1 L) of 6 s peri-od, and a positive pulsed SBP signal (0.5 s pulse width,magnitude 30 mmHg) triggered at different timesalong the inspiratory/expiratory cycle. We anticipatedthat the increase in RRI following each SBP pulseshould be different, depending on the timing of thepulse within the respiratory cycle.
RESULTS
Sample Time-Series
A representative segment of data obtained from oneof the OSAS subjects is displayed in Fig. 2. A CPAPlevel of approximately 7 cm H2O was applied duringsleep. The randomly timed increases in inspiratorypressure delivered during the test procedure can beobserved in the top panel. The consequent variabilityimposed on the breathing pattern is quite evident inboth tidal volume and breath duration. These respi-ratory variations, in turn, lead to corresponding fluc-tuations in SBP and RRI. The occurrence ofspontaneous fluctuations in SBP and RRI largelyindependent of the respiratory changes (e.g., at �40 s)should be noted.
Summary Statistical Measures
Due to the heavy instrumentation imposed on thesubjects, total sleep time was spent primarily in Stage 2and rapid eye-movement (REM) sleep. Thus, com-parisons of the results were made across only threestates: wakefulness, REM sleep, and non-REM Stage 2sleep. The means and standard errors (SE) of the car-diovascular variables in both subject groups are shownin Table 1. RRI was significantly lower in OSAS pa-tients relative to controls (p<0.005), and increasedfrom wakefulness to sleep (p<0.02) in both groups.There was no group or state difference in any of theother summary statistical measures of HRV and bloodpressure variability. Average minute ventilation de-creased significantly during sleep in both control sub-jects (awake: 9.0 ± 0.5 L/min, REM: 7.4± 0.4 L/min,and Stage 2: 7.2± 0.3 L/min) and OSAS patients(awake: 9.9± 0.6 L/min, REM: 7.5± 0.4 L/min, andStage 2: 6.8± 0.5 L/min), but was not different be-tween groups.
Linear and Nonlinear Model Prediction Accuracy
Model accuracy was evaluated by computing theoutput prediction normalized mean square error(NMSE). The average NMSE achieved using only thelinear (first-order) part of the model was 59.3±3.2%for the control group and 64.5 ± 1.9% for the OSASgroup. The average NMSE achieved using the second-order model was 32.2 ± 3.2% for the control groupand 34.2 ± 2.4% for the OSAS group. Thus, extend-ing the linear model to include second-order nonlin-earities led to a halving of NMSE. This is furtherillustrated in the frequency domain (Fig. 3): here, theaverage spectra of the measured RRI signal (solid line)along with the first-order (dotted line) and second-
JO et al.1430

order (dashed line) model prediction residuals aredisplayed. The improvement in the output predictionfrom the first-order to the second-order models isevident by the higher power spectral density of thefirst-order residuals below 0.3 Hz, and especially below0.15 Hz. In order to quantify the contribution of theindividual second-order dynamics to the model pre-diction, the NMSE was computed in models that in-cluded the linear and each one of the three second-order components at a time. On average, the individualcontributions of the second-order kernels were as fol-lows: Vt
2–RRI contribution 7.4 ± 0.7% in controlsand 9.4 ± 0.7% in OSAS; SBP2–RRI contribution8.8 ± 0.6% in controls and 10.6 ± 0.7% in OSAS;and Vt*SBP–RRI contribution 12.7 ± 0.9% in con-trols and 15.5 ± 0.9% in OSAS.
Linear Kernels
The impulse responses corresponding to the twomechanisms are consistent with the underlying physi-ology. Representative RCC impulse responses fromthe control and OSAS groups are shown in Fig. 4 (leftpanels). The RCC linear kernel, representing the lineardynamics of the central component of the respiratorysinus arrhythmia, shows a fast negative peak (increasein heart rate during inspiration) and a lead (negativedelay) between the HR and the Vt. RepresentativeABR impulse responses are also displayed in Fig. 4(right panels). The ABR impulse response increasesinitially to positive values, reflecting a very rapiddecrease in HR (increase in RRI) in response to anincrease in ABP. The magnitudes of the impulse
0 50 100 150 200 2505
10
15
Pm
ask
(cm
H2O
)
0 50 100 150 200 2500
0.5
1
1.5
Vt (
L)
0 50 100 150 200 250
100
120
SB
P (
mm
Hg)
0 50 100 150 200 250600
800
1000
RR
I (m
s)
Time (s)
FIGURE 2. Sample trace of the cardiorespiratory signals recorded during a test procedure in an OSAS subject during sleep. Themask pressure tracing (Pmask) shows the pulses of +5 cm H2O randomly introduced by the ventilator, superimposed over abaseline CPAP level of 7 cm H2O. Corresponding changes in instantaneous lung volume (Vt), systolic blood pressure (SBP), andR–R interval (RRI) are also shown.
TABLE 1. Summary of cardiovascular measures.
Parameter
Control OSA p-Value
Wakefulness REM Stage 2 Wakefulness REM Stage 2 Group State Group · State
Mean RRI (ms) 980 ± 44 1027 ± 39 1045 ± 39 799 ± 39 821 ± 39 812 ± 39 0.002* 0.015* 0.194
RRI variability (ms) 49.9 ± 8.3 49.1 ± 7.5 44.4 ± 7.1 44.1 ± 6.6 41.4 ± 5.6 29.3 ± 3.6 0.212 0.098 0.606
Mean SBP (mmHg) 127.1 ± 6.3 122.8 ± 5.7 117.9 ± 4.0 121.1 ± 3.8 125.4 ± 4.3 121.9 ± 3.8 0.970 0.379 0.291
SBP variability (mm Hg) 4.9 ± 0.3 4.1 ± 0.5 4.5 ± 0.3 7.4 ± 1.7 4.7 ± 0.8 4.8 ± 0.5 0.232 0.079 0.384
Mean DBP (mmHg) 69.2 ± 4.6 70.9 ± 4.8 66.6 ± 2.5 65.5 ± 3.2 69.3 ± 2.0 65.7 ± 3.3 0.564 0.405 0.893
DBP variability (mmHg) 3.5 ± 0.7 2.7 ± 0.3 2.8 ± 0.3 5.7 ± 1.4 4.1 ± 0.5 3.4 ± 0.4 0.059 0.108 0.508
RRI: R-R Interval; SBP: Systolic blood pressure; DBP: Diastolic blood pressure.
Cardiac Autonomic Function in OSAS 1431

responses corresponding to the control subject werelarger than the ones from the OSAS subject for bothRCC and ABR mechanisms, except for ABR duringwakefulness.
Second-Order Kernels
Representative Vt2–RRI second-order kernels are
shown in Fig. 5. The Vt2–RRI kernels presented dis-
tinct shapes and very slow dynamics (lasting longerthan the 40 s), indicating the presence of complex andvery slow frequency contributions. The kernel ampli-tudes were larger during sleep relative to wakefulness,especially in the control subject. Sample SBP2–RRIsecond-order kernels are shown in Fig. 6. Although theSBP2–RRI kernels also presented distinct shapes, theywere less irregular than those for the Vt
2–RRI kernels.Moreover, the SBP2–RRI kernels presented a fast largepeak within the first 10 s and decayed within 40 s,
reflecting relatively faster dynamics. The kernelamplitudes from the control subject were larger thanthose from the OSAS patient, during both wakefulnessand sleep. Sample Vt*SBP–RRI second-order kernelsare also shown in Fig. 7. These kernels presented acombination of both slow and fast dynamics, alignedto the Vt and SBP axes respectively, which is consistentwith the type of time responses found in the self-ker-nels described before.
Statistical Comparison of Model Parameters
Table 2 displays the group-averaged results(mean±SE) for all compact descriptors derived fromthe RCC and ABR impulse responses. The linear RCCgain index (IRMRCC) was smaller in the OSAS subjectsrelative to controls (p<0.04). In both subject groups,there was little change in IRMRCC across sleep–wakestates (Fig. 8, top-left panel). Latency of the RCC
Control
0 0.1 0.2 0.3 0.4
OSAS
0 0.1 0.2 0.3 0.4
2000
4000
6000
0 0.1 0.2 0.3 0.40
2000
4000
6000
Aw
ake
(ms2 /
Hz)
0 0.1 0.2 0.3 0.4
2000
4000
6000
RE
M(m
s2 /H
z)
2000
4000
6000
Frequency (Hz) Frequency (Hz)
Sta
ge 2
(m
s2 /H
z)0 0.1 0.2 0.3 0.
0
2000
4000
6000
0 0.1 0.2 0.3 0.40
2000
4000
6000
0
FIGURE 3. Average spectra of the RRI signal (solid lines) and the first-order (dotted lines) and second-order (dashed lines)residuals, for the control and OSAS groups, during wakefulness, REM and Stage 2 sleep. Second-order residuals are considerablylower with respect to the first-order residuals at frequencies below 0.15 Hz, and especially below 0.08 Hz.
JO et al.1432

impulse responses was more negative in the OSASpatients relative to controls (p<0.04), but unchangedwith sleep–wake state.
The ABR gain (IRMABR) was lower in the OSASsubjects relative to controls (p<0.04) and increasedalmost significantly from wakefulness to sleep; how-ever, this increase was clearly much greater in thecontrols (IRMABR was approximately twice as large insleep relative to wakefulness in the control subjects,while it was no significant dependence of the ABRgain on state in the OSAS patients; Fig. 8, top-rightpanel).
Table 2 also displays the group-averaged results(mean±SE) for all compact descriptors derived fromthe second-order self- and cross-kernels. The Vt
2–RRIgain ðKMV2
tÞ increased from wakefulness to sleep in
both control subjects and OSAS patients (p<0.03).The SBP2–RRI gain ðKMSBP2Þ was higher in controlsvs. OSAS patients (p<0.0001). KMSBP2 also increasedalmost twice from wakefulness to Stage 2 sleep in thecontrols, while there was no significant dependence of
the SBP2–RRI gain on state in the OSAS patients(Fig. 8, bottom-left panel). The Vt*SBP–RRI gainðKMVt
�SBPÞ was higher in controls relative to OSASpatients (p < 0.002), but did not change significantlyacross wake–sleep states (Fig. 8, bottom-right panel).
Simulation Results for Physiological Interpretation ofNonlinear Kernels
The normalized frequency response of the linear andnonlinear RCC components to a chirp Vt signal ofdifferent levels is shown in Fig. 9. For both Controland OSAS groups, the linear RCC responses wereindependent of tidal volume. In contrast, the combinedlinear/nonlinear RCC response was affected by tidalvolume in both groups. As tidal volume increased from0.5 to 3 L, the nonlinear RCC responses also in-creased, particular at frequencies below 0.3 Hz. Boththe linear and nonlinear RCC responses were larger inthe Control group compared to the OSAS group. Theincrease in the nonlinear RCC response with tidal
hRCC(n)
0 10 20 30 40
AW
AK
E(m
s/L)
-60
-40
-20
0
hABR(n)
0 10 20 30 40
(ms/
mm
Hg)
-2
0
2
4
6
8
0 10 20 30 40
RE
M(m
s/L)
-60
-40
-20
0
0 10 20 30 40
(ms/
mm
Hg)
-2
0
2
4
6
8
Time (s)0 10 20 30 40
Sta
ge
2 (m
s/L)
-60
-40
-20
0
Time (s)0 10 20 30 40
(ms/
mm
Hg)
-2
0
2
4
6
8
FIGURE 4. Representative tracings of the RCC and ABR model impulse responses estimated from a normal control (dark trac-ings) and OSAS patient (light tracings) during wakefulness, REM, and Stage 2 sleep. The impulse response amplitudes corre-sponding to the control subject were larger than the ones from the OSAS subject for both RCC and ABR mechanisms, except forABR during wakefulness.
Cardiac Autonomic Function in OSAS 1433

volume level was more pronounced in the OSAS thanin the Control group.
The step-responses for the linear and nonlinearcomponents of ABR for different SBP step magnitudesare shown in Fig. 10. A steady-state level was achievedwithin 30 s in both groups. The linear ABR step-re-sponses increased as the SBP step magnitude increased,as expected. The nonlinear ABR step-responses, on theother hand, were negative and decreased as the SBPstep magnitude increased. The resulting combined
linear and nonlinear ABR step-responses also in-creased with the SBP step magnitude, although as thestep became larger, the differential increase becamesmaller. This can be better visualized in the bottompanels, which display the steady-state values achievedunder the different step magnitudes tested. The first-order steady-state ABR responses were linearly relatedto the SBP step-size, while the combined first/second-order steady-state ABR responses increased lessrapidly with the respect to the step magnitude,
-10-8-6-4-202468
1020
3040 0
1020
3040
AW
AK
E(m
s/L2 )
τ1 (sec)
τ 2(sec)
NORMAL
-10-8-6-4-202468
1020
3040 0
1020
3040
RE
M(m
s/L2 )
τ1 (sec)
τ 2(sec)
-10-8-6-4-202468
1020
3040 0
1020
3040
ST
AG
E 2
(ms/
L2 )
τ1 (sec)
τ 2(sec)
-10-8-6-4-202468
1020
3040 0
1020
3040
τ1 (sec)
τ 2(sec)
OSAS
-10-8-6-4-202468
1020
3040 0
1020
3040
τ1 (sec)
τ 2(sec)
-6
-4
-2
0
2
4
6
8
1020
3040 0
1020
3040
τ1 (sec)
τ 2(sec)
FIGURE 5. Representative Vt2–RRI second-order kernels, corresponding to wakefulness, REM, and Stage 2 sleep in the control
and OSAS subjects shown in Fig. 4. Note that kernel amplitudes were higher in sleep vs. wakefulness in both subjects.
JO et al.1434

demonstrating a tendency to saturate with increasingstep magnitude.
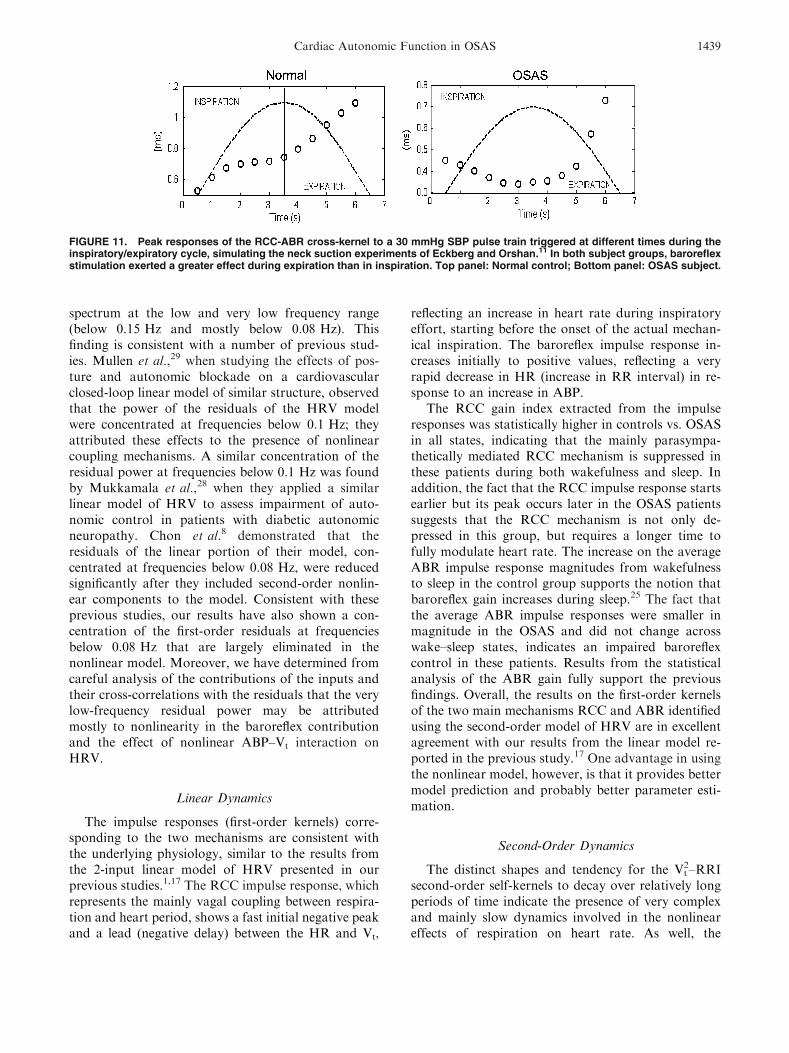
Figure 11 shows the results of model simulations inwhich the linear and nonlinear baroreflex componentswere stimulated by BP pulses at different times duringthe respiratory cycle. In both types of subjects, theABR pulse response was larger when the SBP pulsewas triggered during expiration than during inspira-tion. In the control group, the ABR pulse responsedecreased to �80% of its mean value (�50 ms) at midinspiration, and started to increase to �120% of itsmean values at mid expiration. This behavior is similarto the experimental results obtained by Eckberg11
using neck suction to stimulate the baroreceptors. Inthe OSAS group, the decrease in ABR pulse response
during inspiration was minimal, but the increase dur-ing expiration was more substantial. As expected, theABR pulse responses in OSAS were smaller in overalllevel than those in the controls because of the reducedlinear and nonlinear baroreflex gains in the formergroup.
DISCUSSION
Delineation of Major Components of HRV
HRV is modulated primarily from neural andmechanical coupling of the respiratory and cardio-vascular systems, lung vagal, and baroreflex
-0.15
-0.10
-0.05
0.00
0.05
0.10
0.15
1020
3040 0
1020
3040
AW
AK
E(m
s/m
mH
g2 )
τ1 (sec)
τ 2(sec)
NORMAL
-0.15
-0.10
-0.05
0.00
0.05
0.10
0.15
1020
3040 0
1020
3040
RE
M(m
s/m
mH
g)
τ1 (sec)
τ 2(sec)
-0.15
-0.10
-0.05
0.00
0.05
0.10
0.15
1020
3040 0
1020
3040
ST
AG
E 2
(ms/
mm
Hg2 )
τ1 (sec)
τ 2(sec)
-0.15
-0.10
-0.05
0.00
0.05
0.10
0.15
1020
3040 0
1020
3040
τ1 (sec)
τ 2(sec)
OSAS
-0.15
-0.10
-0.05
0.00
0.05
0.10
0.15
1020
3040 0
1020
3040
τ1 (sec)
τ 2(sec)
-0.15
-0.10
-0.05
0.00
0.05
0.10
0.15
1020
3040 0
1020
3040
τ1 (sec)
τ 2(sec)
FIGURE 6. Representative SBP2–RRI second-order kernels, corresponding to wakefulness, REM, and Stage 2 sleep in the samecontrol and OSAS subjects displayed in Fig. 4. Kernel amplitudes were larger in the control relative to the OSAS subject, but thereappears to be little dependence on state.
Cardiac Autonomic Function in OSAS 1435

feedbacks.10 Central to the method introduced in thisstudy is the mathematical model that allows delinea-tion of these respiratory and baroreflex contributions.Although respiration and blood pressure are treated asmutually independent inputs, together with heart rate,are part of a larger closed-loop control system.1,17 Byimposing physiological delays in this closed-loop sys-tem, feedforward and feedback dynamics can be sep-arated, in essence, allowing the loop to be‘‘computationally opened.’’20 For instance, in thebaroreflex portion of the closed-loop system, present
changes in RRI are constrained to be influenced onlyby past fluctuations of blood pressure. This imposedconstraint (termed ‘‘causality’’ in systems engineeringterminology) forces the estimation scheme to convergetowards a solution that reflects the effect of bloodpressure on RRI (i.e., the baroreflex), rather than theeffects of RRI on blood pressure (i.e., the feedforwardcomponent). This ‘‘temporal delineation’’ approachcan only be formulated in the time domain and hasbeen extensively used in cardiovascular control systemidentification.1,8,17,29 In contrast, frequency-domain
-4
-2
0
2
4
1020
3040 0
1020
3040
AW
AK
E(m
s/L/
mm
Hg)
τ1 (sec)
τ 2(sec)
NORMAL
-4
-2
0
2
4
1020
3040 0
1020
3040
RE
M(m
s/L/
mm
Hg)
τ1 (sec)
τ 2(sec)
-4
-2
0
2
4
1020
3040 0
1020
3040
ST
AG
E 2
(m
s/L/
mm
Hg)
τ1 (sec)
τ 2(sec)
-4
-2
0
2
4
1020
3040 0
1020
3040
τ1 (sec)
τ 2(sec)
OSAS
-4
-2
0
2
4
1020
3040 0
1020
3040
τ1 (sec)
τ 2(sec)
-4
-2
0
2
4
1020
3040 0
1020
3040
τ1 (sec)
τ 2(sec)
FIGURE 7. Sample Vt*SBP–RRI second-order cross-kernels, corresponding to wakefulness, REM, and Stage 2 sleep in the samecontrol and OSAS subjects displayed in Fig. 4. See text for further details.
JO et al.1436

methods (i.e., cross-spectral analysis) do not allow theimplementation of causality constraints.
In principle, the estimation of the linear and non-linear kernels of our model is best achieved when thecorresponding inputs, SBP and Vt, are independent ofeach other.8 Changes in intrathoracic pressure duringrespiration, however, can induce changes in bloodpressure. Fortuitously, other influences, such as vari-ations in cardiac output and peripheral resistance, alsocontribute to spontaneous fluctuations in SBP. In ourstudy, application of the test protocol helped to furtherdecorrelate Vt and SBP, since on any given breath,inspiration can result in either a decrease or increase in
SBP. Which way SBP is affected depends on the rela-tive amounts of active breathing vs. assistance pro-vided by the ventilator during that breath.17
Nonlinear Contributions of Vt and SBP to HRV
The nonlinear characteristics involved in the mod-ulation of HRV were confirmed by comparing theprediction NMSE achieved by the linear and nonlinearmodels. The prediction NMSE was reduced by �30%when second-order terms were included in the model,showing that second-order dynamics cannot be ne-glected. It was also observed that the individual con-
TABLE 2. Linear and nonlinear gain estimates.
Parameter
Control OSA p-Value
Wake REM Stage 2 Wake REM Stage 2 Group State Group · State
Linear parameters
RCC IR magnitude
(ms/L)
47.8 ± 8.5 51.0 ± 7.7 53.6 ± 8.5 25.5 ± 5.1 33.8 ± 5.5 28.4 ± 6.5 0.037 0.054 0.246
ABR IR magnitude
(ms/mmHg)
2.21 ± 0.44 4.34 ± 0.92 3.71 ± 0.77 1.84 ± 0.42 1.75 ± 0.34 2.19 ± 0.42 0.032 0.053 0.058
Nonlinear parameters
Vt2–RRI kernel magnitude
(ms/L2)
25.8 ± 4.7 34.7 ± 8.6 37.2 ± 5.4 14.8 ± 2.7 28.4 ± 4.6 24.3 ± 6.5 0.128 0.025 0.737
SBP2–RRI kernel magnitude
(ms/mmHg2)
0.19 ± 0.07 0.24 ± 0.04 0.38 ± 0.08 0.07 ± 0.02 0.09 ± 0.01 0.06 ± 0.01 <0.0001 0.174 0.085
Vt*SBP–RRI kernel magnitude
(ms/L1/mmHg2)
4.32 ± 0.91 5.12 ± 0.58 5.48 ± 0.69 1.98 ± 0.35 3.21 ± 0.62 2.64 ± 0.30 0.002 0.084 0.62
RCC: respiratory–cardiac coupling component; ABR: arterial baroreflex component.
WAKE REM S2
KM
SB
P2
(ms/
mm
Hg2 )
0.0
0.1
0.2
0.3
0.4
0.5
WAKE REM S2
KM
Vt*S
BP (
ms/
L/m
mH
g)
1
2
3
4
5
6
7
WAKE REM S2
IRM
RC
C (
ms/
L)
10
20
30
40
50
60
70
WAKE REM S2
IRM
AB
R (
ms/
mm
Hg)
1
2
3
4
5
6
FIGURE 8. Average values of the linear and nonlinear gains for the control (filled circles) and OSAS (open triangles) groups arepresented here. RSA gain (IRMRSA) was significantly higher in controls vs. OSAS, but was unchanged with sleep–wake state.Baroreflex gain (IRMABR) was also higher in controls vs. OSAS patients, and increased substantially in controls, while was onlyslightly elevated in the OSAS. SBP2–RRI gain (KMSBP2 ) was higher in controls vs. OSAS, especially during Stage 2 sleep. Vt*SBP–RRI gain (KMVt
�SBP) was higher in controls vs. OSAS.
Cardiac Autonomic Function in OSAS 1437

tribution of the second-order kernels were higher forthe SBP2–RRI and Vt*SBP–RRI components, indi-cating that nonlinear mechanisms involving SBPinteractions, contribute more to HRV.
Analysis of the spectral content of the first- andsecond-order model residuals (output predictionerror) demonstrated that the second-order nonlinear-ities make a significant contribution to the RRI
FIGURE 9. Normalized frequency responses of the linear (top) and combined linear + nonlinear (bottom) RSA components for theControl (left) and OSAS (right) groups, for different values of tidal volume. Note that the ordinate scales for the frequencyresponses in the Control group (left panel) are substantially larger than the corresponding scales for the OSAS group (right panel).
FIGURE 10. Linear (top panels), nonlinear (second row), and overall (third row) ABR step-responses to a SBP step input ofdifferent amplitudes (1–5 mmHg), for the Control (left) and OSAS (right) groups. The bottom panels each display the overall ABRsteady-state response as a function of SBP step magnitudes.
JO et al.1438
spectrum at the low and very low frequency range(below 0.15 Hz and mostly below 0.08 Hz). Thisfinding is consistent with a number of previous stud-ies. Mullen et al.,29 when studying the effects of pos-ture and autonomic blockade on a cardiovascularclosed-loop linear model of similar structure, observedthat the power of the residuals of the HRV modelwere concentrated at frequencies below 0.1 Hz; theyattributed these effects to the presence of nonlinearcoupling mechanisms. A similar concentration of theresidual power at frequencies below 0.1 Hz was foundby Mukkamala et al.,28 when they applied a similarlinear model of HRV to assess impairment of auto-nomic control in patients with diabetic autonomicneuropathy. Chon et al.8 demonstrated that theresiduals of the linear portion of their model, con-centrated at frequencies below 0.08 Hz, were reducedsignificantly after they included second-order nonlin-ear components to the model. Consistent with theseprevious studies, our results have also shown a con-centration of the first-order residuals at frequenciesbelow 0.08 Hz that are largely eliminated in thenonlinear model. Moreover, we have determined fromcareful analysis of the contributions of the inputs andtheir cross-correlations with the residuals that the verylow-frequency residual power may be attributedmostly to nonlinearity in the baroreflex contributionand the effect of nonlinear ABP–Vt interaction onHRV.
Linear Dynamics
The impulse responses (first-order kernels) corre-sponding to the two mechanisms are consistent withthe underlying physiology, similar to the results fromthe 2-input linear model of HRV presented in ourprevious studies.1,17 The RCC impulse response, whichrepresents the mainly vagal coupling between respira-tion and heart period, shows a fast initial negative peakand a lead (negative delay) between the HR and Vt,
reflecting an increase in heart rate during inspiratoryeffort, starting before the onset of the actual mechan-ical inspiration. The baroreflex impulse response in-creases initially to positive values, reflecting a veryrapid decrease in HR (increase in RR interval) in re-sponse to an increase in ABP.
The RCC gain index extracted from the impulseresponses was statistically higher in controls vs. OSASin all states, indicating that the mainly parasympa-thetically mediated RCC mechanism is suppressed inthese patients during both wakefulness and sleep. Inaddition, the fact that the RCC impulse response startsearlier but its peak occurs later in the OSAS patientssuggests that the RCC mechanism is not only de-pressed in this group, but requires a longer time tofully modulate heart rate. The increase on the averageABR impulse response magnitudes from wakefulnessto sleep in the control group supports the notion thatbaroreflex gain increases during sleep.25 The fact thatthe average ABR impulse responses were smaller inmagnitude in the OSAS and did not change acrosswake–sleep states, indicates an impaired baroreflexcontrol in these patients. Results from the statisticalanalysis of the ABR gain fully support the previousfindings. Overall, the results on the first-order kernelsof the two main mechanisms RCC and ABR identifiedusing the second-order model of HRV are in excellentagreement with our results from the linear model re-ported in the previous study.17 One advantage in usingthe nonlinear model, however, is that it provides bettermodel prediction and probably better parameter esti-mation.
Second-Order Dynamics
The distinct shapes and tendency for the Vt2–RRI
second-order self-kernels to decay over relatively longperiods of time indicate the presence of very complexand mainly slow dynamics involved in the nonlineareffects of respiration on heart rate. As well, the
FIGURE 11. Peak responses of the RCC-ABR cross-kernel to a 30 mmHg SBP pulse train triggered at different times during theinspiratory/expiratory cycle, simulating the neck suction experiments of Eckberg and Orshan.11 In both subject groups, baroreflexstimulation exerted a greater effect during expiration than in inspiration. Top panel: Normal control; Bottom panel: OSAS subject.
Cardiac Autonomic Function in OSAS 1439
significant increase in the magnitudes of the Vt2–RRI
kernels from wakefulness to sleep in both the controland OSAS suggests that the nonlinear effects of res-piration on heart rate play a more important roleduring sleep. All the linear indexes of RCC gain pre-sented here and in our previous study17 represent directrespiratory modulation of heart rate, mainly viaparasympathetic activity, since the mechanisms repre-sented by these indices work at frequencies above0.1 Hz, where the sympathetic system is unable tomodulate heart rate. On the other hand, the nonlinearcomponent of RCC gain (Vt
2–RRI interaction), whichcontains very low frequency dynamics, may be medi-ated by both sympathetic and parasympathetic activ-ity, as was shown in the study by Chon et al.8 In theirstudy, it was observed that following propanololadministration (sympathetic blockade), the Vt
2–RRIkernel amplitudes became smaller, but the decreasewas more evident after atropine administration (para-sympathetic blockade). Thus, the fact that Vt
2–RRIkernel magnitudes increased during sleep suggests thatboth sympathetically and parasympathetically medi-ated nonlinear effects of respiration in the modulationof heart rate are increased during sleep. In contrast tothe linear RCC gains, the Vt
2–RRI kernel magnitudeswere similar in the control and OSAS groups, indi-cating that only the linear component of RCC is al-tered in OSAS.
Mechanisms involved in the SBP2–RRI interactionappear to present less complex but much fasterdynamics than those observed in Vt
2–RRI interaction.In the study of Chon et al.,8 the amplitude of theSBP2–RRI decreased considerably after the applica-tion of double autonomic blocking agents (propanololand atropine). However, when only either propanolol(sympathetic blockade) or atropine (parasympatheticblockade) was applied, only a modest reduction in theSBP2–RRI was observed. These results indicate thatboth vagal and sympathetic modulations are involvedin the nonlinear interactions between blood pressureand heart rate, but in the absence of one of these twofactors, the remaining factor is still able to significantlymediate the nonlinear interaction between bloodpressure and heart rate. Therefore, our results, whichshow a dramatic significant decrease in the magnitudesof the SBP2–RRI kernels from the OSAS group rela-tive to those from the control group (notice theachieved p<0.0001), strongly support the notion thatboth sympathetic and parasympathetic functions in-volved in the nonlinear arterial baroreflex modulationof heart rater are impaired in OSAS patients. It is alsointeresting to observe that the SBP2–RRI kernelmagnitude increased from wakefulness to sleep (almosttwo-fold during Stage 2 sleep) in the control group,while it was almost unchanged in the OSAS group.
These findings and the results from the linear ABRgains indicate that both the linear and nonlinearcomponents of the arterial baroreflex mechanism in-creased during sleep under normal conditions, while inOSAS patients both linear and nonlinear dynamics ofABR are diminished.
Chon et al.8 also reported a reduction in Vt*SBP–RRI kernel magnitude after either atropine or pro-panolol administration, indicating that the contribu-tion to HRV from the interaction between ABP andrespiration is mediated by both vagal and sympatheticpathways. Our estimates of the Vt*SBP–RRI kernelshow that the interactions between fast changes in SBPand fast and slow changes in Vt are attenuated in theOSAS subjects, further suggesting impairment of bothsympathetic and parasympathetic control in these pa-tients.
One of the disadvantages of employing the Volterraapproach to model nonlinear dynamics is that thecomplexity of the model grows very rapidly as theorder of the dynamics increases. Kernels that are third-order or higher are difficult even to represent on agraphical basis, since three-dimensional plots of thekernel yield information of only a ‘‘slice’’ through oneof the dimensions. Thus, truncating the model to sec-ond order is somewhat arbitrary and could lead to theomission of potentially important nonlinear dynamics.On the other hand, our tests of the residuals followingthe application of the second-order model showed thatthese were largely broad-band (see Fig. 3), suggestingthat much of the dynamics was indeed captured by themodel. Our findings are supported by a previous studyby Chon et al.,8 who similarly employed a second-or-der Volterra model to investigate HRV. An alternativeapproach has been to use ‘‘block-structured’’ modelsthat contain interconnections of dynamic linear sys-tems and static nonlinearities.36 These types of modelsallow some highly nonlinear systems to be character-ized with a relatively small number of parameters. Thedrawback here is that an incorrect assumption of thesystem structure would also lead to incorrect modelidentification. There are a number of simple cases inwhich one-to-one correspondences between Volterrakernel models and block-structured models can beeasily identified. For instance, if the actual underlyingsystem could be described as a ‘‘Hammerstein’’ model,consisting of a static nonlinearity followed by a lineardynamic system, the second-order kernel would bezero everywhere except along the diagonal (s1= s2). Inthe case of a ‘‘Wiener’’ model, consisting of a lineardynamic system followed by a static nonlinearity, any‘‘slice’’ of the second-order kernel at fixed s2 would beproportional to the first-order kernel. We examinedour estimated second-order kernels for these specialfeatures but did not find them.
JO et al.1440
Physiological Interpretation of Current Findings
As mentioned earlier, the complexity of second- andhigher-order Volterra kernels greatly complicate ourability to interpret the physiological ramifications ofthese models. To alleviate this problem, we performedsimulations with the estimated models that mimickedphysiological experiments. Simulations of the RSAresponse derived from our linear and nonlinear kernelsconfirmed a dependency of the RSA frequency re-sponse upon the tidal volume.10,15 More interestingly,this tidal volume dependency increases with increasingmagnitude of the nonlinear (second-order) dynamicsbetween respiration and heart rate fluctuations. Sim-ulations of the ABR steady-state response derivedfrom our linear and nonlinear kernels confirmed asaturation in the SBP–RRI relation. The simulationsalso demonstrate that the rapidity with which the in-creases in RRI saturate as SBP is increased depends onthe magnitude and form of the second-order kernelrelating blood pressure to RRI fluctuations.
Simulations of the RSA–ABR nonlinear interactionderived from our second-order cross-kernel indicate arespiratory modulation of baroreflex gain. For bothcontrols and OSAS, the ABR response was largerduring expiration than during inspiration, as had beenpreviously observed by Eckberg and Orshan.11 Thisresults provide additional evidence of the existence ofan interaction between respiratory and baroreceptorreflexes, and suggest that the quality of the centralautonomic modulation depends upon the level ofafferent baroreceptor activity and the depth of inspi-ration.10 It is important to note, however, that thiseffect is small relative to the combined effects of allother components of our model.
How does OSAS lead to detrimental consequencesfor the autonomic regulation of the cardiovascularsystem? Although the pathophysiological pathwaysremain unresolved, a number of important animalstudies5,12 suggest that chronic exposure to episodichypoxia, which stimulates the peripheral chemoreflexesacutely, leads to a resetting of chemoreceptor function.This, in turn, suppresses baroreceptor function, lead-ing to a sustained increase in sympathetic tone.13 It isalso possible that the concomitant exposure to episodicarousal from sleep, which generally accompaniesthe termination of obstructive apnea, could play acontributory role in the genesis of sympatheticoveractivity.4
Potential Confounding Effects of CPAP
In the OSAS patients, CPAP at their individuallyprescribed levels was applied during sleep in orderto ensure upper airway patency throughout the test
procedure. This was an important part of the experi-mental procedure, since it enabled us to assess auto-nomic control across different sleep–wake states andacross individuals under relatively similar patterns ofrespiration and under stable stages of sleep. In con-trast, previous investigations of autonomic control inOSAS during sleep were carried out under uncon-trolled conditions in which the episodes of obstructiveapnea were associated with profound swings in sym-pathetic and parasympathetic activity as well as tran-sient state changes.19,35 The occurrence of large swingsin respiration and the cardiovascular variables can leadto severe distortions of the HRV and blood pressurevariability spectra, and thus contribute to interpreta-tional difficulties if these spectral measures are used formaking inferences about autonomic function.21
On the other hand, CPAP application in the OSASpatients during sleep may have led inevitably to someconfounding influences. For example, in subjects withnormal heart function, acute application of CPAP isknown to decrease left ventricular preload more thanleft ventricular afterload, leading to a reduction incardiac output.9 However, our OSAS subjects did notshow any change in SBP or DBP during sleep relativeto wakefulness when only minimal CPAP was applied.The CPAP-induced increase in lung volume itself mayhave also contributed to some increase in vagal activityand reduction in sympathetic drive.6 Therefore, ourtechnique is likely to have underestimated the extent ofautonomic abnormality in the OSAS subjects duringsleep.17
CONCLUSIONS
In this study, we have applied a second-order modelto determine the presence of nonlinear interactions inthe regulation of HRV, as well as to investigate howthese interactions are affected by OSAS and by dif-ferent wake–sleep states. Our results showed a signifi-cant nonlinear component of HRV, concentratedprimarily at frequencies below 0.08 Hz, confirmingprevious results. Second-order interactions related tothe baroreflex constituted the most significant nonlin-ear component involved in HRV. It was also demon-strated that both linear and nonlinear dynamicsinvolved in the regulation of HRV are altered in OSASand depend to some extent on sleep–wake state. Fi-nally, this study provides simple physiological inter-pretations to the second-order dynamics derived byour nonlinear model of HRV. The second-order ker-nels reflect specific characteristics of the RCC andABR mechanisms, such as dependence of RCC ontidal volume, saturation in the SBP–RRI relation,and respiratory modulation of baroreflex gain. In
Cardiac Autonomic Function in OSAS 1441

summary, the application of the nonlinear model-based approach to quantify linear and nonlineardynamics involved in the autonomic control of heartrate constitutes a useful, insightful and comprehensiveapproach for the detection and assessment of abnor-mal autonomic function in OSAS during wakefulnessand sleep. This noninvasive method could also beuseful for evaluating autonomic dysfunction in otherdisease conditions, such as diabetes, Parkinson diseaseand Shy–Drager syndrome.
REFERENCES
1Belozeroff, V., R. B. Berry, C. S. H. Sassoon, and M. C. K.Khoo. Effects of CPAP therapy on cardiovascular vari-ability in obstructive sleep apnea: a closed-loop analysis.Am. J. Physiol.: Heart Circ. Physiol. 282:H110–H121,2002.2Berger, R. D., S. Akselrod, D. Gordon, and R. J. Cohen.An efficient algorithm for spectral analysis of heart ratevariability. IEEE Trans. Biomed. Eng. 33:900–904, 1986.3Blasi, A., J. Jo, E. Valladares, E. Juarez, A. Baydur, andM. C. K. Khoo. Autonomic cardiovascular control fol-lowing transient arousal from sleep: a time-varying closed-loop model. IEEE Trans. Biomed. Eng. 53:74–82, 2006.4Blasi, A., B. J. Morgan, J. B. Skatrud, J. Jo, E. Valladares,and M. C. K. Khoo. Autonomic cardiovascular controlfollowing arousal from sleep: time-varying spectral analy-sis. J. Appl. Physiol. 95:1394–1404, 2003.5Brooks, D., R. L. Horner, L. F. Kozar, C. L. Render-Texeira, and E. A. Phillipson. Obstructive sleep apnea as acause of systemic hypertension: evidence from a caninemodel. J. Clin. Invest. 99:106–109, 1997.6Butler, G. C., M. T. Naughton, M. A. Rahman, T. D.Bradley, and J. S. Floras. Continuous positive airwaypressure increases heart rate variability in congestive heartfailure. J. Am. Coll. Cardiol. 25:672–679, 1995.7Chon, K. I., Y. M. Chen, V. Z. Marmarelis, D. J. Marsh,and N. H. Holstein-Rathlou. Detection of interactionsbetween myogenic and TGF mechanisms using nonlinearanalysis. Am. J. Physiol. 36:F160–F173, 1994.8Chon, K., T. J. Mullen, and R. J. Cohen. A dual-inputnonlinear system analysis of autonomic modulation ofheart rate. IEEE Trans. Biomed. Eng. 43:530–544, 1996.9De Hoyos, A., P. P. Liu, D. C. Benard, and T. D. Bradley.Hemodynamic effects of continuous positive airway pres-sure in humans with normal and impaired left ventricularfunction. Clin. Sci. (Colch) 88:173–178, 1995.
10Eckberg, D.Respiratory sinus arrhythmia and other humancardiovascular neural periodicities. In: Regulation ofBreathing, edited by J. A. Dempsey and A. I. Pack. (2nded.New York: Dekker, 1995, pp. 669–740.
11Eckberg, D. L., and C. R. Orshan. Respiratory andbaroreceptor reflex interactions in man. J. Clin. Invest.59:780–785, 1977.
12Fletcher, E. C., J. Lesske, R. Behm, C. C. Miller, and T.Unger. Carotid chemoreceptors, systemic blood pressure,and chronic episodic hypoxia mimicking sleep apnea.J. Appl. Physiol. 72:1978–1984, 1992.
13Francis, D. P., A. J. S. Coats, and P. Ponikowski.Chemo-reflex-baroreflex interactions in cardiovascular disease. In:Sleep Apnea: Implications in Cardiovascular and Cere-brovascular Disease, edited by T. D. Bradley and J. S.Floras. New York: Marcel Dekker, 2000, pp. 33–60.
14Goldberger, J. J., S. Challapalli, T. Tung, M. A. Parker,and A. H. Kadish. Relationship of heart rate variability toparasympathetic effect. Circulation 103:1977–1983, 2001.
15Hirsch, J. A., and B. Bishop. Respiratory sinus arrhythmiain humans: how breathing pattern modulates heart rate.Am. J. Physiol. 241:H620–H629, 1981.
16Huikuri, H. V., T. H. Makikallio, C. K. Peng, A. L.Goldberger, U. Hintze, and M. Moller. Fractal correlationproperties of R-R interval dynamics and mortality in pa-tients with depressed left ventricular function after an acutemyocardial infarction. Circulation 101:47–54, 2000.
17Jo, J. A., A. Blasi, E. Valladares, R. Juarez, A. Baydur, andM. C. K. Khoo. Model-based assessment of autonomiccontrol in obstructive sleep apnea syndrome during sleep.Am. J. Respir. Crit. Care Med. 167:128–136, 2003.
18Jo, J. A., A. Blasi, E. Valladares, R. Juarez, A. Baydur, andM. C. K. Khoo. Determinants of heart-rate variability inObstructive Sleep Apnea Syndrome during wakefulnessand sleep. Am. J. Physiol. (Heart Circ. Physiol.)288:H1103–H1112, 2005.
19Keyl, C., P. Lemberger, M. Dambacher, P. Geisler, K.Hochmuth, and A. W. Frey. Heart rate variability in pa-tients with obstructive sleep apnea. Clin. Sci. 91(Suppl):56–57, 1996.
20Khoo, M. C. K. Physiological Control Systems: Analysis,Simulation and Estimation. Wiley/IEEE Press, 2000.
21Khoo, M. C. K., T. S. Kim, and R. B. Berry. Spectralindices of cardiac autonomic function in obstructive sleepapnea. Sleep 22:443–451, 1999.
22Lee, Y., and M. Schetzen. Measurement of the Wienerkernels of a nonlinear system by cross-correlation. Int. J.Control 2:237–254, 1965.
23Levy, M. N. Sympathetic-parasympathetic interactions inheart. Circ. Res. 29:437–445, 1971.
24Makikallio, T. H., J. M. Tapanainen, M. P. Tulppo, and H.V. Huikuri. Clinical applicability of heart rate variabilityby methods based on nonlinear dynamics. Cardiac Elec-trophysiol. Rev. 6:250–255, 2002.
25Mancia, G. and A. L. Mark. Arterial baroreflexes in hu-mans. In: Handbook of Physiology. The CardiovascularSystem. Peripheral Circulation and Organ Blood Flow,sect. 3, vol. III, pt. 2, Chapt. 20. Bethesda, MD: Am.Physiol. Soc., 1983, pp. 755–793.
26Marmarelis, V. Z. Identification of nonlinear biologicalsystems using Laguerre expansion of kernels. Ann. Biomed.Eng. 21:573–589, 1993.
27Marmarelis, V. Z., K. H. Chon, Y. M. Chen, D. J. Marsh,and N. H. Holstein-Rathlou. Nonlinear analysis of renalautoregulation under broadband forcing conditions. Ann.Biomed. Eng. 21:591–603, 1993.
28Mukkamala, R., J. M. Mathias, T. J. Mullen, R. J. Cohen,and R. Freeman. System identification of closed-loopcardiovascular control mechanisms: diabetic autonomicneuropathy. Am. J. Physiol. 276:R905–R912, 1999.
29Mullen, T. J., M. L. Appel, R. Mukkamala, J. M. Mathias,and R. J. Cohen. System identification of closed-loopcardiovascular control: effects of posture and autonomicblockade. Am. J. Physiol. 272:H448–H461, 1997.
30Rechtschaffen, A., and R. Kales. A Manual of Standard-ized Terminology, Techniques and Scoring System for
JO et al.1442

Sleep Stages of Human Subjects. Los Angeles: BIS/BRI,UCLA, 1968.
31Rissanen, J. Estimation of structure by minimumdescription length. Circ. Syst. Signal Process. 1(3–4):395–406, 1982.
32Shepard, J. W. Hypertension, cardiac arrhythmias, myo-cardial infarction, and stroke in relation to obstructivesleep apnea. Clin. Chest Med. 3:437–458, 1992.
33Shiavi, R. Introduction to Applied Statistical SignalAnalysis. Homewood, IL: Aksen Associates, 1991.
34Somers, V. K., M. E. Dyken, M. P. Clary, and F. M.Abboud. Sympathetic neural mechanisms in obstructivesleep apnea. J. Clin. Invest. 96:1897–1904, 1995.
35Vanninen, E., A. Tuunainen, M. Kansanen, M. Uusitupa,and E. Lansimies. Cardiac sympathovagal balance duringsleep apnea episodes. Clin. Physiol. 16:209–216, 1996.
36Westwick, D. T., and R. E. Kearney. Nonparametricidentification of nonlinear biomedical systems, Part 1:theory. Crit. Rev. Biomed. Eng. 26:153–226, 1998.
37Wiklund, U., B. O. Olofsson, K. Franklin, H. Blom, P.Bjerle, and U. Niklasson. Autonomic cardiovascular reg-ulation in patients with obstructive sleep apnea: a studybased on spectral analysis of heart rate variability. Clin.Physiol. 20:234–241, 2000.
38Yip, K. P., N. H. Holstein-Rathlou, and D. J. Marsh.Chaos in blood flow control in genetic and renovascularhypertensive rats. Am. J. Physiol. 261:F400–F408, 1991.
39Zwillich, C. W. Sleep apnoea and autonomic function.Thorax 53:S20–S24, 1998.
Cardiac Autonomic Function in OSAS 1443