A NNUAL R EPORT 2002 - 株式会社...
28
Ryohin Keikaku Co., Ltd. A NNUAL R EPORT 2002 Year Ended February 28, 2002
Transcript of A NNUAL R EPORT 2002 - 株式会社...
Ryohin Keikaku Co., Ltd.
A N N U A L R E P O R T 2 0 0 2Year Ended February 28, 2002
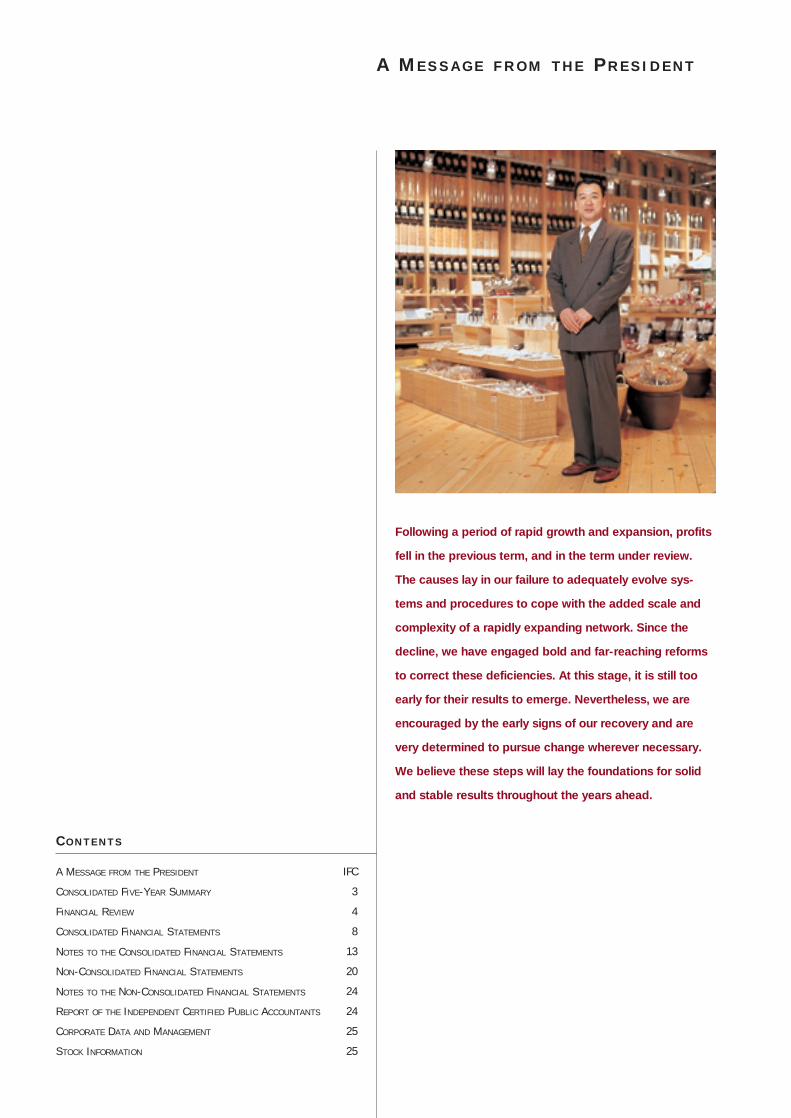
Following a period of rapid growth and expansion, profits
fell in the previous term, and in the term under review.
The causes lay in our failure to adequately evolve sys-
tems and procedures to cope with the added scale and
complexity of a rapidly expanding network. Since the
decline, we have engaged bold and far-reaching reforms
to correct these deficiencies. At this stage, it is still too
early for their results to emerge. Nevertheless, we are
encouraged by the early signs of our recovery and are
very determined to pursue change wherever necessary.
We believe these steps will lay the foundations for solid
and stable results throughout the years ahead.
A MESSAGE FROM THE PRESIDENT
CONSOLIDATED FIVE-YEAR SUMMARY
FINANCIAL REVIEW
CONSOLIDATED FINANCIAL STATEMENTS
NOTES TO THE CONSOLIDATED FINANCIAL STATEMENTS
NON-CONSOLIDATED FINANCIAL STATEMENTS
NOTES TO THE NON-CONSOLIDATED FINANCIAL STATEMENTS
REPORT OF THE INDEPENDENT CERTIFIED PUBLIC ACCOUNTANTS
CORPORATE DATA AND MANAGEMENT
STOCK INFORMATION
IFC
3
4
8
13
20
24
24
25
25
C O N T E N T S
A M E S S A G E F R O M T H E P R E S I D E N T
Annual Report 2002 1
A Year of Change Prepares forRenewed Progress
On behalf of the management of Ryohin
Keikaku Co., Ltd., I would like to outline
our business results for fiscal 2001,
which ended February 28, 2002.
We reported disappointing results in
the previous term, fiscal 2000, experi-
encing the first drop in profits since our
establishment. During the year under
review, we began implementing various
measures to promote growth.
Consolidated operating revenue rose
3.8% from the previous year, to ¥119.8
billion. Regrettably, operating profit
dropped to ¥5.5 billion in total, a 52.4%
decline, and net income fell 99.8%, to
¥13 million. The latter came about as we
elected to include an extraordinary loss
of ¥5.9 billion in a positive move to clear
away negative legacies from our previ-
ous rapid growth phase. This move,
which included disposing of inventories
and supporting the reconstruction of a
subsidiary in France, was taken to lay
Bold Reforms to RestoreConsistent Growth
Reconstruction of store network under
new strategy
Although the year under review ended
with disappointing results for the
Company, we have already taken a
number of measures aimed at reestab-
lishing steady and consistent growth.
First, we reduced the pace of domes-
tic store openings, selecting eleven loca-
tions where high profitability could truly
be expected, and closing ten stores with
marginal prospects, while, in the previ-
ous year, we opened 45 stores, due to
accelerated openings in anticipation of
the enforcement of the Large-Scale
Retail Store Location Law.
In parallel with selective opening of
new stores, we promoted more efficient
store operations by concentrating on
developing business through licensed
stores in collaboration with leading
regional companies.
the groundwork for healthy growth in the
coming years.
During the year under review, we
opened a flagship store in the Yurakucho
district of Tokyo, and another in the
Nanba district of Osaka, both popular
shopping areas in major cities in eastern
and western Japan, respectively. Sales
at the online Mujirushi Ryohin Net Stores,
which were established in September
2000 as our sales channel on the
Internet, grew steadily to ¥1.5 billion. The
MUJI Card, our bonus-point credit card,
also turned in good results, as the
number of users exceeded 200,000
within two years of its introduction.
Overseas, we closed five unprofitable
stores in France and Belgium as part of
a plan to reform our European store net-
work. At the same time, we reestab-
lished our presence in Hong Kong with
the opening of a new store, which post-
ed profits in its first year of operation.
The store’s brisk business encouraged
us to open a second store in the region.
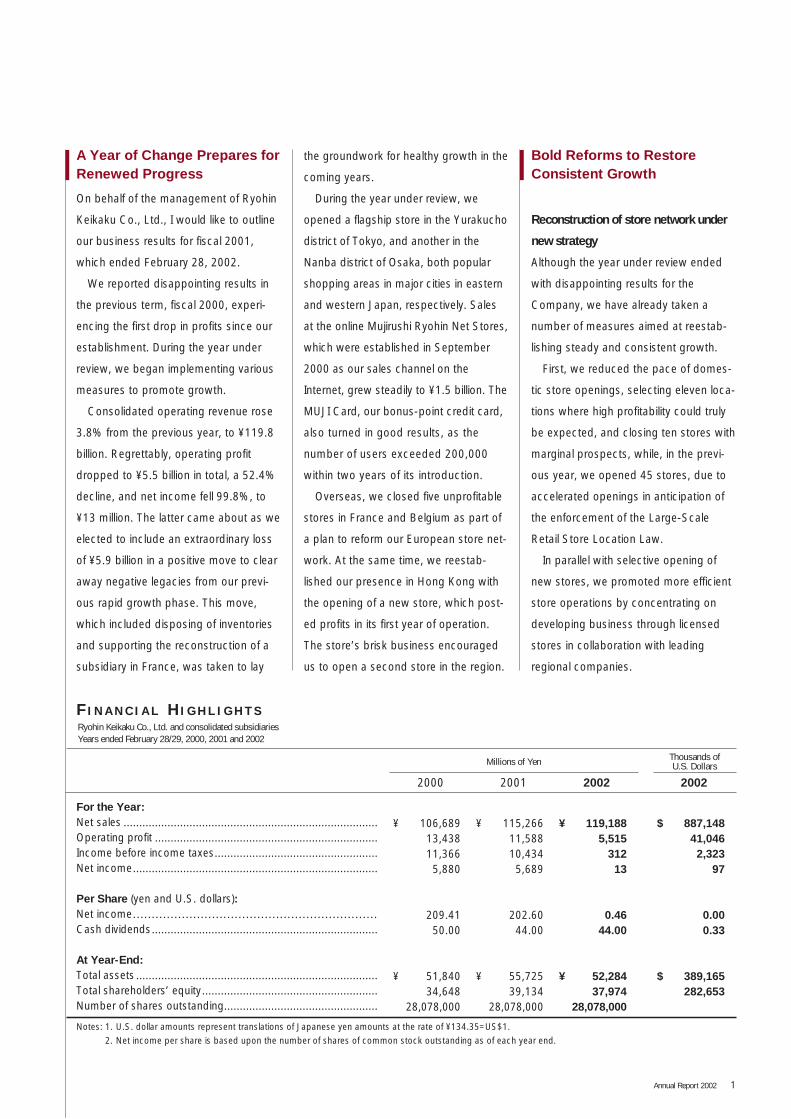
For the Year:Net sales .................................................................................Operating profit .......................................................................Income before income taxes....................................................Net income..............................................................................
Per Share (yen and U.S. dollars):Net income.................................................................Cash dividends........................................................................
At Year-End:Total assets .............................................................................Total shareholders’ equity........................................................Number of shares outstanding.................................................
Thousands of U.S. Dollars
2001 2002 20022000
Millions of Yen
¥ 115,26611,58810,4345,689
202.6044.00
¥ 55,72539,134
28,078,000
¥ 106,68913,43811,3665,880
209.4150.00
¥ 51,84034,648
28,078,000
¥ 119,1885,515
31213
0.4644.00
¥ 52,28437,974
28,078,000
$ 887,14841,0462,323
97
0.000.33
$ 389,165282,653
Notes: 1. U.S. dollar amounts represent translations of Japanese yen amounts at the rate of ¥134.35=US$1.
2. Net income per share is based upon the number of shares of common stock outstanding as of each year end.
F I N A N C I A L H I G H L I G H T SRyohin Keikaku Co., Ltd. and consolidated subsidiariesYears ended February 28/29, 2000, 2001 and 2002

2 Ryohin Keikaku Co., Ltd.
Building a framework for stronger sales
In one sense, the accelerated growth in
the previous terms exposed inefficien-
cies in sales functions. In response, we
have carried out programs to dramati-
cally change our operating procedures.
With delegation of merchandising
authority to the sales division, managers
from the nine regions and individual
store managers undertook sales plan-
ning and product allocation, which had
previously been drawn up by the prod-
uct division. We believe that such plan-
ning by individual stores will be more
effective as they are most in tune with
the tastes of customers in their regions.
At the same time, this measure is
expected to further improve the motiva-
tion of store staff.
We also reviewed our product supply
processes and concluded that it is indis-
pensable to control the flow of goods by
overseeing the store network in its
entirety. Accordingly, we established the
Controller Department in February 2002,
which is responsible for deciding on the
number of products initially supplied to
each store, taking the sales capability of
the store into account. After the initial
supply, the department monitors various
product sales trends and coordinates
the flow of goods, including additional
orders and suspension of production.
We developed and began the intro-
duction of an original automatic ordering
system called “PROFIT,” which is
expected to greatly contribute to an
improvement in store efficiency. The
system has already been put into opera-
tion at directly managed stores, with
respect to household goods other than
large items and some clothing and food
items. We plan to expand the system
into licensed stores in the coming years.
Automatic ordering, which eliminates the
most troublesome work at every store,
will enhance the flexibility of store staff
assignment. Moreover, sales staff will be
able to focus more on customer service,
thereby strengthening our sales ability.
Increasing links between sales
and production
The fundamental concept of MUJI prod-
ucts—offering items that are “lower
priced for a reason” through the careful
selection of materials, streamlining man-
ufacturing processes, and eliminating
non-essential functions, decoration and
packaging—has not lost its freshness
and luster. With our competitors improv-
ing their capability to procure goods,
however, competition is increasingly
heating up.
To sharpen our competitive edge, we
have begun to link more tightly the oper-
ations of sales and production. Under
this system, we select core items for
which large volumes of sales are expected
in the categories of apparel, household
goods and food. Then, we purposely
restrain the volume of these products’
initial production while retaining the
capability for rapid additional production
according to demand. This strategy will
enable us to sell out store merchandise
at full margin, minimizing low-margin
discounting and unsold inventories.
Meanwhile, to fortify our product
lineup, we initiated the Mujirushi Ryohin
Concept Factory (MCF) Project, which
involves outside designers at work
around the globe. This project aims to
deepen the concept of MUJI products
by melding the viewpoints of today’s
consumers with the solid origins of
our products.
Maintaining Firm Resolve toCarry Out Reform
During the year under review, we
squarely addressed a number of obsta-
cles to growth and carried out various
reform programs aimed at assuring
steady, continuous growth. Looking at
our performance on a quarterly basis,
signs of gradual improvement are clearly
to be seen. In the coming fiscal year,
ending February 2003, we are deter-
mined to show the solid results of these
ongoing reforms. To this end, we will not
slow the pace of reform or otherwise
jeopardize the realization of our plans.
The MUJI world has broadened into
various areas, including restaurants,
cafés, campgrounds and flower sales,
and we believe it has limitless possibili-
ties. The attractiveness of the product
lineup in our stores should further
enhance sales in fiscal 2002 as the MCF
Project and other programs begin to
produce new and appealing items. We
believe that as a result of the measures
outlined above, you will soon see Ryohin
Keikaku applying its proven ideals with
renewed strength and focus.
Tadamitsu Matsui
President and Representative Director
Annual Report 2002 3
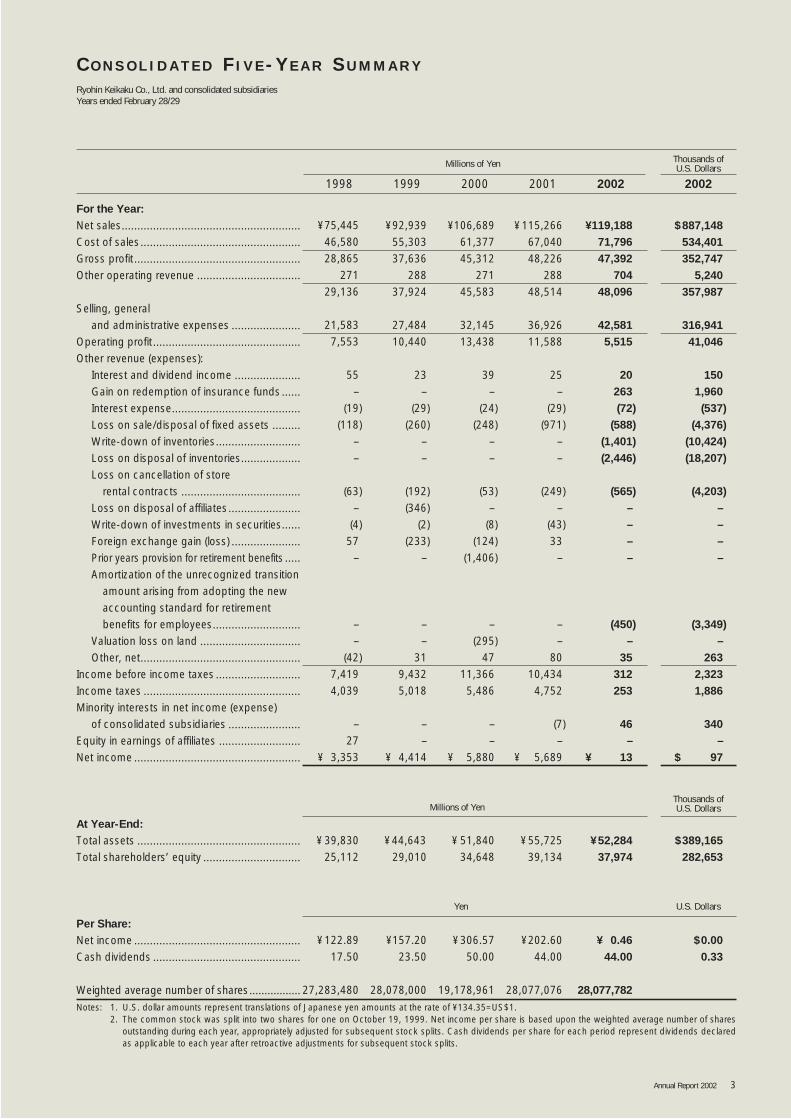
2002
Thousands of U.S. Dollars
2001200019991998 2002
Millions of Yen
For the Year:
Net sales.........................................................Cost of sales...................................................Gross profit.....................................................Other operating revenue .................................
Selling, general and administrative expenses ......................
Operating profit...............................................Other revenue (expenses):
Interest and dividend income .....................Gain on redemption of insurance funds ......Interest expense.........................................Loss on sale/disposal of fixed assets .........Write-down of inventories...........................Loss on disposal of inventories...................Loss on cancellation of store
rental contracts ......................................Loss on disposal of affiliates.......................Write-down of investments in securities......Foreign exchange gain (loss) ......................Prior years provision for retirement benefits .....Amortization of the unrecognized transition
amount arising from adopting the new accounting standard for retirement benefits for employees............................
Valuation loss on land ................................Other, net...................................................
Income before income taxes ...........................Income taxes ..................................................Minority interests in net income (expense)
of consolidated subsidiaries .......................Equity in earnings of affiliates ..........................Net income .....................................................
At Year-End:
Total assets ....................................................Total shareholders’ equity ...............................
Per Share:
Net income .....................................................Cash dividends ...............................................
Weighted average number of shares.................
¥106,68961,37745,312
27145,583
32,14513,438
39–
(24)(248)
––
(53)–
(8)(124)
(1,406)
–(295)
4711,3665,486
– –
¥ 5,880
¥ 51,84034,648
¥306.5750.00
19,178,961
¥92,93955,30337,636
28837,924
27,48410,440
23–
(29)(260)
––
(192)(346)
(2)(233)
–
––
319,4325,018
– –
¥ 4,414
¥44,64329,010
¥157.2023.50
28,078,000
¥119,188
71,796
47,392
704
48,096
42,581
5,515
20
263
(72)
(588)
(1,401)
(2,446)
(565)
–
–
–
–
(450)
–
35
312
253
46
–
¥ 13
¥52,284
37,974
¥ 0.46
44.00
28,077,782
¥115,26667,04048,226
28848,514
36,92611,588
25–
(29)(971)
––
(249)–
(43)33
–
––
8010,4344,752
(7) –
¥ 5,689
¥55,72539,134
¥202.6044.00
28,077,076
$887,148
534,401
352,747
5,240
357,987
316,941
41,046
1501,960
(537)
(4,376)
(10,424)
(18,207)
(4,203)
–
–
–
–
(3,349)
–
263
2,323
1,886
340
–
$ 97
$389,165
282,653
$0.00
0.33
Notes: 1. U.S. dollar amounts represent translations of Japanese yen amounts at the rate of ¥134.35=US$1.2. The common stock was split into two shares for one on October 19, 1999. Net income per share is based upon the weighted average number of shares
outstanding during each year, appropriately adjusted for subsequent stock splits. Cash dividends per share for each period represent dividends declaredas applicable to each year after retroactive adjustments for subsequent stock splits.
U.S. DollarsYen
Thousands of U.S. DollarsMillions of Yen
Ryohin Keikaku Co., Ltd. and consolidated subsidiariesYears ended February 28/29
C O N S O L I D A T E D F I V E - Y E A R S U M M A R Y
¥75,44546,58028,865
27129,136
21,5837,553
55–
(19)(118)
––
(63)–
(4)57
–
––
(42)7,4194,039
– 27
¥ 3,353
¥ 39,83025,112
¥122.8917.50
27,283,480
4 Ryohin Keikaku Co., Ltd.
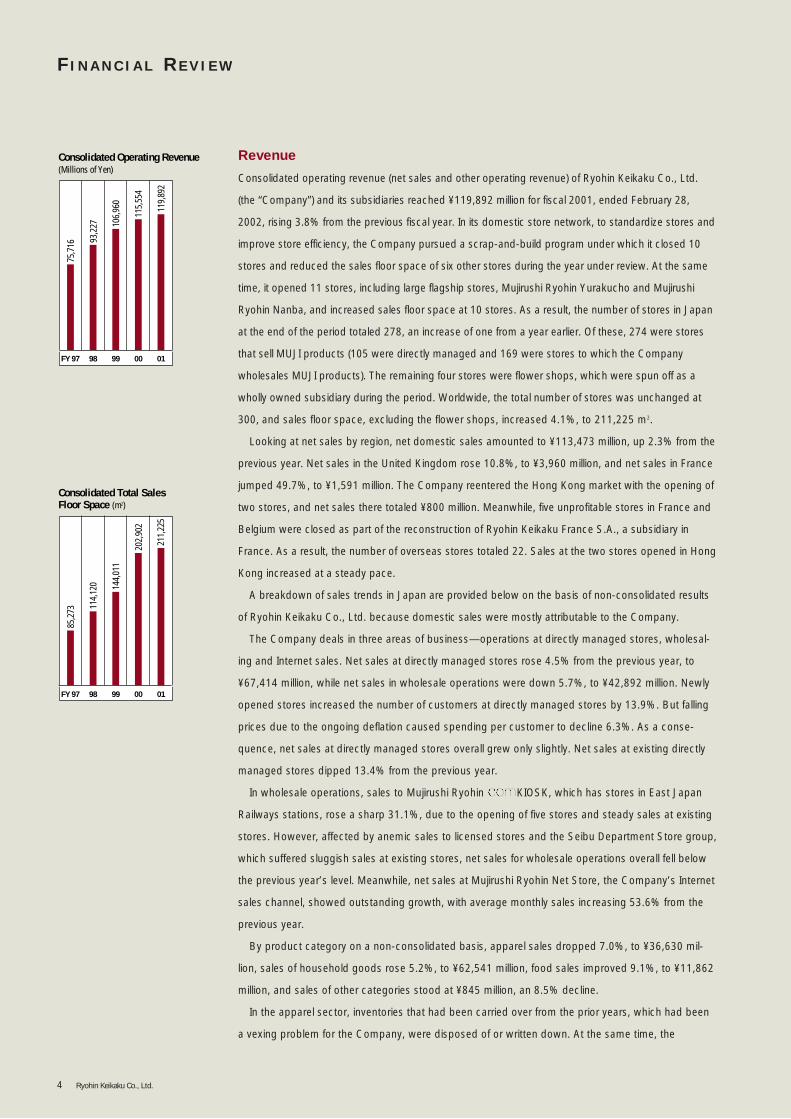
Revenue
Consolidated operating revenue (net sales and other operating revenue) of Ryohin Keikaku Co., Ltd.
(the “Company”) and its subsidiaries reached ¥119,892 million for fiscal 2001, ended February 28,
2002, rising 3.8% from the previous fiscal year. In its domestic store network, to standardize stores and
improve store efficiency, the Company pursued a scrap-and-build program under which it closed 10
stores and reduced the sales floor space of six other stores during the year under review. At the same
time, it opened 11 stores, including large flagship stores, Mujirushi Ryohin Yurakucho and Mujirushi
Ryohin Nanba, and increased sales floor space at 10 stores. As a result, the number of stores in Japan
at the end of the period totaled 278, an increase of one from a year earlier. Of these, 274 were stores
that sell MUJI products (105 were directly managed and 169 were stores to which the Company
wholesales MUJI products). The remaining four stores were flower shops, which were spun off as a
wholly owned subsidiary during the period. Worldwide, the total number of stores was unchanged at
300, and sales floor space, excluding the flower shops, increased 4.1%, to 211,225 m2.
Looking at net sales by region, net domestic sales amounted to ¥113,473 million, up 2.3% from the
previous year. Net sales in the United Kingdom rose 10.8%, to ¥3,960 million, and net sales in France
jumped 49.7%, to ¥1,591 million. The Company reentered the Hong Kong market with the opening of
two stores, and net sales there totaled ¥800 million. Meanwhile, five unprofitable stores in France and
Belgium were closed as part of the reconstruction of Ryohin Keikaku France S.A., a subsidiary in
France. As a result, the number of overseas stores totaled 22. Sales at the two stores opened in Hong
Kong increased at a steady pace.
A breakdown of sales trends in Japan are provided below on the basis of non-consolidated results
of Ryohin Keikaku Co., Ltd. because domestic sales were mostly attributable to the Company.
The Company deals in three areas of business—operations at directly managed stores, wholesal-
ing and Internet sales. Net sales at directly managed stores rose 4.5% from the previous year, to
¥67,414 million, while net sales in wholesale operations were down 5.7%, to ¥42,892 million. Newly
opened stores increased the number of customers at directly managed stores by 13.9%. But falling
prices due to the ongoing deflation caused spending per customer to decline 6.3%. As a conse-
quence, net sales at directly managed stores overall grew only slightly. Net sales at existing directly
managed stores dipped 13.4% from the previous year.
In wholesale operations, sales to Mujirushi Ryohin KIOSK, which has stores in East Japan
Railways stations, rose a sharp 31.1%, due to the opening of five stores and steady sales at existing
stores. However, affected by anemic sales to licensed stores and the Seibu Department Store group,
which suffered sluggish sales at existing stores, net sales for wholesale operations overall fell below
the previous year’s level. Meanwhile, net sales at Mujirushi Ryohin Net Store, the Company’s Internet
sales channel, showed outstanding growth, with average monthly sales increasing 53.6% from the
previous year.
By product category on a non-consolidated basis, apparel sales dropped 7.0%, to ¥36,630 mil-
lion, sales of household goods rose 5.2%, to ¥62,541 million, food sales improved 9.1%, to ¥11,862
million, and sales of other categories stood at ¥845 million, an 8.5% decline.
In the apparel sector, inventories that had been carried over from the prior years, which had been
a vexing problem for the Company, were disposed of or written down. At the same time, the
F I N A N C I A L R E V I E W
Consolidated Operating Revenue(Millions of Yen)
106,
960
115,
554
93,2
27
75,7
16
119,
892
FY 97 98 99 00 01
Consolidated Total Sales Floor Space (m2)
144,
011
202,
902
211,
225
114,
120
85,2
73
FY 97 98 99 00 01
Annual Report 2002 5
FY1999 FY2000 FY2001YOY YOY YOY(%) (%) (%)
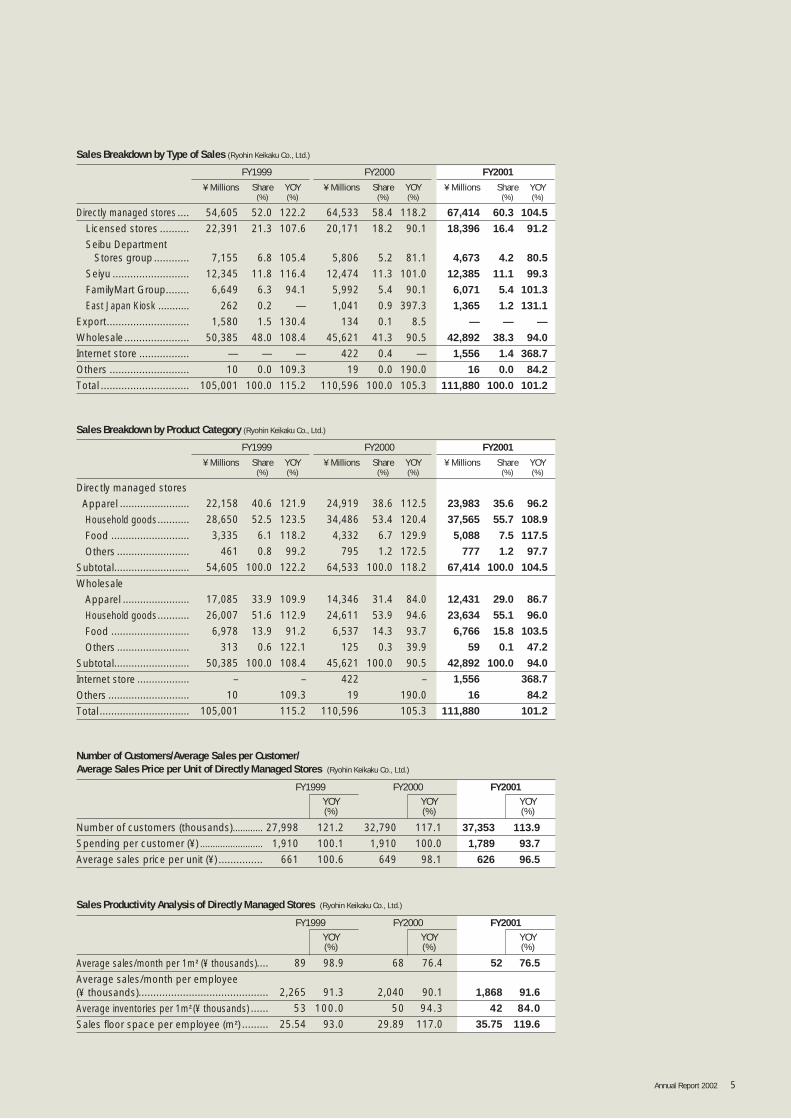
Number of Customers/Average Sales per Customer/Average Sales Price per Unit of Directly Managed Stores (Ryohin Keikaku Co., Ltd.)
Number of customers (thousands)............ 27,998 121.2 32,790 117.1 37,353 113.9
Spending per customer (¥) ......................... 1,910 100.1 1,910 100.0 1,789 93.7
Average sales price per unit (¥) ............... 661 100.6 649 98.1 626 96.5
Sales Breakdown by Type of Sales (Ryohin Keikaku Co., Ltd.)
Directly managed stores .... 54,605 52.0 122.2 64,533 58.4 118.2 67,414 60.3 104.5
Licensed stores .......... 22,391 21.3 107.6 20,171 18.2 90.1 18,396 16.4 91.2
Seibu Department Stores group............ 7,155 6.8 105.4 5,806 5.2 81.1 4,673 4.2 80.5
Seiyu .......................... 12,345 11.8 116.4 12,474 11.3 101.0 12,385 11.1 99.3
FamilyMart Group........ 6,649 6.3 94.1 5,992 5.4 90.1 6,071 5.4 101.3
East Japan Kiosk ........... 262 0.2 — 1,041 0.9 397.3 1,365 1.2 131.1
Export............................ 1,580 1.5 130.4 134 0.1 8.5 — — —
Wholesale ...................... 50,385 48.0 108.4 45,621 41.3 90.5 42,892 38.3 94.0
Internet store ................. — — — 422 0.4 — 1,556 1.4 368.7
Others ........................... 10 0.0 109.3 19 0.0 190.0 16 0.0 84.2
Total .............................. 105,001 100.0 115.2 110,596 100.0 105.3 111,880 100.0 101.2
FY1999 FY2000 FY2001¥ Millions Share YOY ¥ Millions Share YOY ¥ Millions Share YOY
(%) (%) (%) (%) (%) (%)
Sales Breakdown by Product Category (Ryohin Keikaku Co., Ltd.)
Directly managed stores
Apparel ........................ 22,158 40.6 121.9 24,919 38.6 112.5 23,983 35.6 96.2
Household goods........... 28,650 52.5 123.5 34,486 53.4 120.4 37,565 55.7 108.9
Food ........................... 3,335 6.1 118.2 4,332 6.7 129.9 5,088 7.5 117.5
Others ......................... 461 0.8 99.2 795 1.2 172.5 777 1.2 97.7
Subtotal.......................... 54,605 100.0 122.2 64,533 100.0 118.2 67,414 100.0 104.5
Wholesale
Apparel ....................... 17,085 33.9 109.9 14,346 31.4 84.0 12,431 29.0 86.7
Household goods........... 26,007 51.6 112.9 24,611 53.9 94.6 23,634 55.1 96.0
Food ........................... 6,978 13.9 91.2 6,537 14.3 93.7 6,766 15.8 103.5
Others ......................... 313 0.6 122.1 125 0.3 39.9 59 0.1 47.2
Subtotal.......................... 50,385 100.0 108.4 45,621 100.0 90.5 42,892 100.0 94.0
Internet store .................. – – 422 – 1,556 368.7
Others ............................ 10 109.3 19 190.0 16 84.2
Total ............................... 105,001 115.2 110,596 105.3 111,880 101.2
FY1999 FY2000 FY2001¥ Millions Share YOY ¥ Millions Share YOY ¥ Millions Share YOY
(%) (%) (%) (%) (%) (%)
FY1999 FY2000 FY2001YOY YOY YOY(%) (%) (%)
Sales Productivity Analysis of Directly Managed Stores (Ryohin Keikaku Co., Ltd.)
Average sales/month per 1m2 (¥ thousands).... 89 98.9 68 76.4 52 76.5
Average sales/month per employee(¥ thousands)............................................ 2,265 91.3 2,040 90.1 1,868 91.6
Average inventories per 1m2 (¥ thousands) ...... 53 100.0 50 94.3 42 84.0
Sales floor space per employee (m2) ......... 25.54 93.0 29.89 117.0 35.75 119.6
6 Ryohin Keikaku Co., Ltd.
Company introduced new items and reviewed existing products. Notably, the introduction of toddler
clothes sales contributed to a 69.0% growth in the sales of children’s wear. On the other hand, sales
of main items fell sharply, including knitwear, shirts and blouses, due to declines in unit prices. There
was also an unsuccessful introduction of the “On-Off” series, on which the company had put great
emphasis, promoting the concept of “going to the office without a tie.” The result was that apparel
sales overall were down from the previous year.
In the household goods sector, sales of linens and interior goods, electronics and electrical appli-
ances, housewares, and outdoor products were brisk. Among linens and interior goods, new prod-
uct lines in the areas of sheets and covers saw solid sales. Among electronics and electrical appli-
ances, sales of items having strong originality increased, including Good Design Award-winning
refrigerators, wall-hanging CD players and drum-type washing machines. Meanwhile, sales of stor-
age containers and bicycles grew sharply among housewares and outdoor goods, respectively.
Concerning food, PET-bottled beverages and other new products contributed to sales growth.
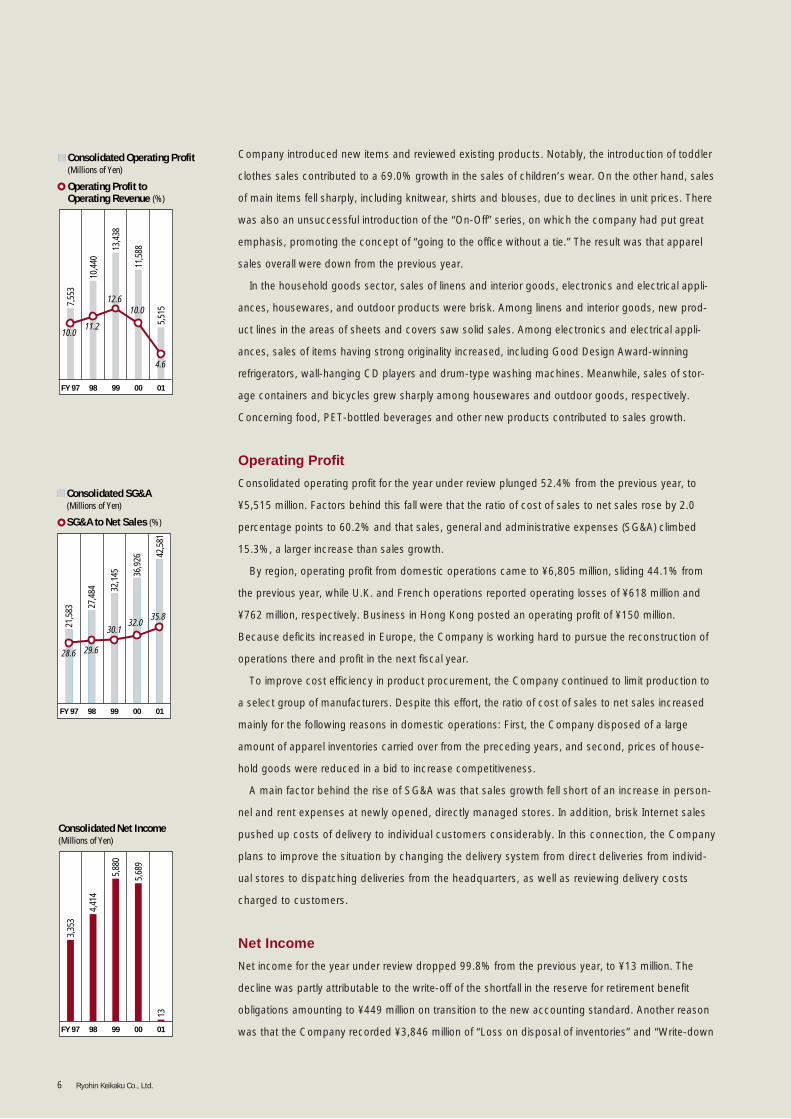
Operating Profit
Consolidated operating profit for the year under review plunged 52.4% from the previous year, to
¥5,515 million. Factors behind this fall were that the ratio of cost of sales to net sales rose by 2.0
percentage points to 60.2% and that sales, general and administrative expenses (SG&A) climbed
15.3%, a larger increase than sales growth.
By region, operating profit from domestic operations came to ¥6,805 million, sliding 44.1% from
the previous year, while U.K. and French operations reported operating losses of ¥618 million and
¥762 million, respectively. Business in Hong Kong posted an operating profit of ¥150 million.
Because deficits increased in Europe, the Company is working hard to pursue the reconstruction of
operations there and profit in the next fiscal year.
To improve cost efficiency in product procurement, the Company continued to limit production to
a select group of manufacturers. Despite this effort, the ratio of cost of sales to net sales increased
mainly for the following reasons in domestic operations: First, the Company disposed of a large
amount of apparel inventories carried over from the preceding years, and second, prices of house-
hold goods were reduced in a bid to increase competitiveness.
A main factor behind the rise of SG&A was that sales growth fell short of an increase in person-
nel and rent expenses at newly opened, directly managed stores. In addition, brisk Internet sales
pushed up costs of delivery to individual customers considerably. In this connection, the Company
plans to improve the situation by changing the delivery system from direct deliveries from individ-
ual stores to dispatching deliveries from the headquarters, as well as reviewing delivery costs
charged to customers.
Net Income
Net income for the year under review dropped 99.8% from the previous year, to ¥13 million. The
decline was partly attributable to the write-off of the shortfall in the reserve for retirement benefit
obligations amounting to ¥449 million on transition to the new accounting standard. Another reason
was that the Company recorded ¥3,846 million of “Loss on disposal of inventories” and “Write-down
Operating Profit to Operating Revenue (%)
Consolidated Operating Profit(Millions of Yen)
13,4
38
11,5
88
10.011.2
12.610.0
4.6
10,4
40
7,55
3
5,51
5
FY 97 98 99 00 01
SG&A to Net Sales (%)
Consolidated SG&A (Millions of Yen)
32,1
45 36,9
26
28.6 29.6
30.132.0
35.8
27,4
84
21,5
83
42,5
81
FY 97 98 99 00 01
Consolidated Net Income(Millions of Yen)
5,88
0
5,68
9
4,41
4
3,35
3
13
FY 97 98 99 00 01
Annual Report 2002 7
Consolidated Total Assets(Millions of Yen)
51,8
40 55,7
25
44,6
43
39,8
30
52,2
84
FY 97 98 99 00 01
Equity Ratio (%)
Consolidated Total Shareholders Equity (Millions of Yen)
34,6
48 39,1
34
63.065.0 66.8
70.2 72.6
29,0
10
25,1
12
37,9
74FY 97 98 99 00 01
Consolidated Cash Flow(Millions of Yen)
*Cash Flow=Net Income+Depreciation
7,88
4
8,21
4
5,79
0
4,22
5
3,07
0
FY 97 98 99 00 01
of inventories” as the Company cleared away inventories that had been carried over from the pre-
ceding years, most of which were apparel items.
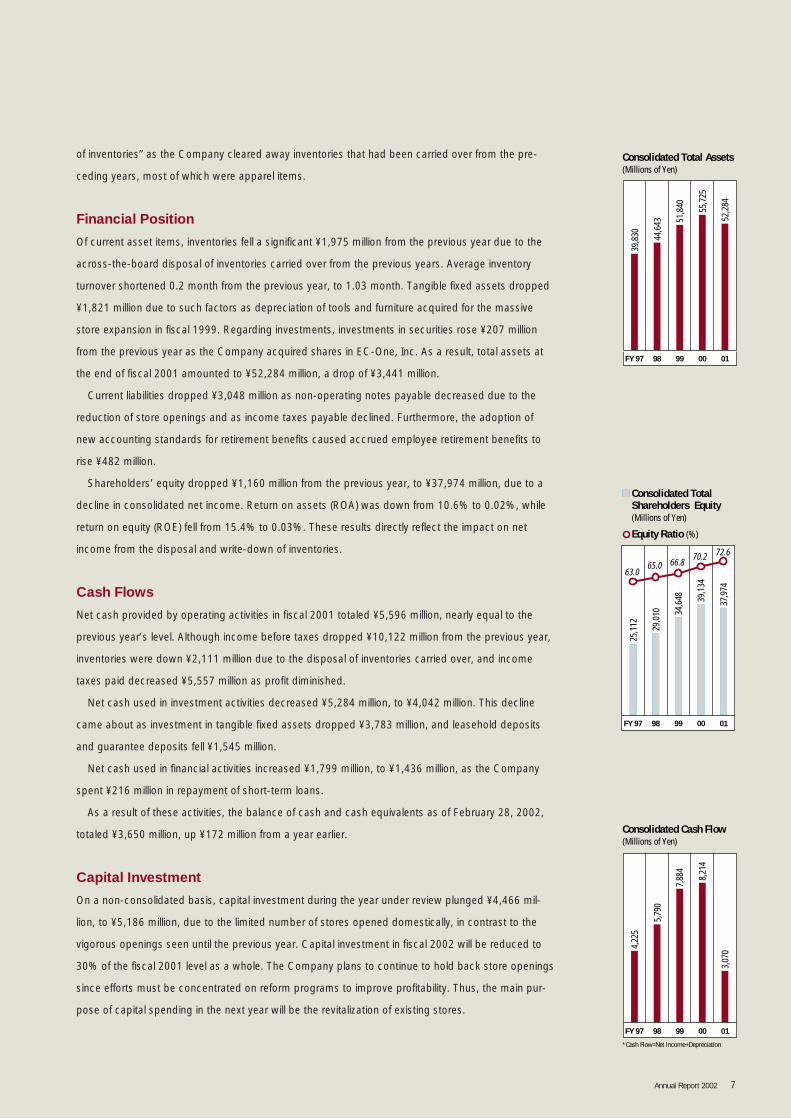
Financial Position
Of current asset items, inventories fell a significant ¥1,975 million from the previous year due to the
across-the-board disposal of inventories carried over from the previous years. Average inventory
turnover shortened 0.2 month from the previous year, to 1.03 month. Tangible fixed assets dropped
¥1,821 million due to such factors as depreciation of tools and furniture acquired for the massive
store expansion in fiscal 1999. Regarding investments, investments in securities rose ¥207 million
from the previous year as the Company acquired shares in EC-One, Inc. As a result, total assets at
the end of fiscal 2001 amounted to ¥52,284 million, a drop of ¥3,441 million.
Current liabilities dropped ¥3,048 million as non-operating notes payable decreased due to the
reduction of store openings and as income taxes payable declined. Furthermore, the adoption of
new accounting standards for retirement benefits caused accrued employee retirement benefits to
rise ¥482 million.
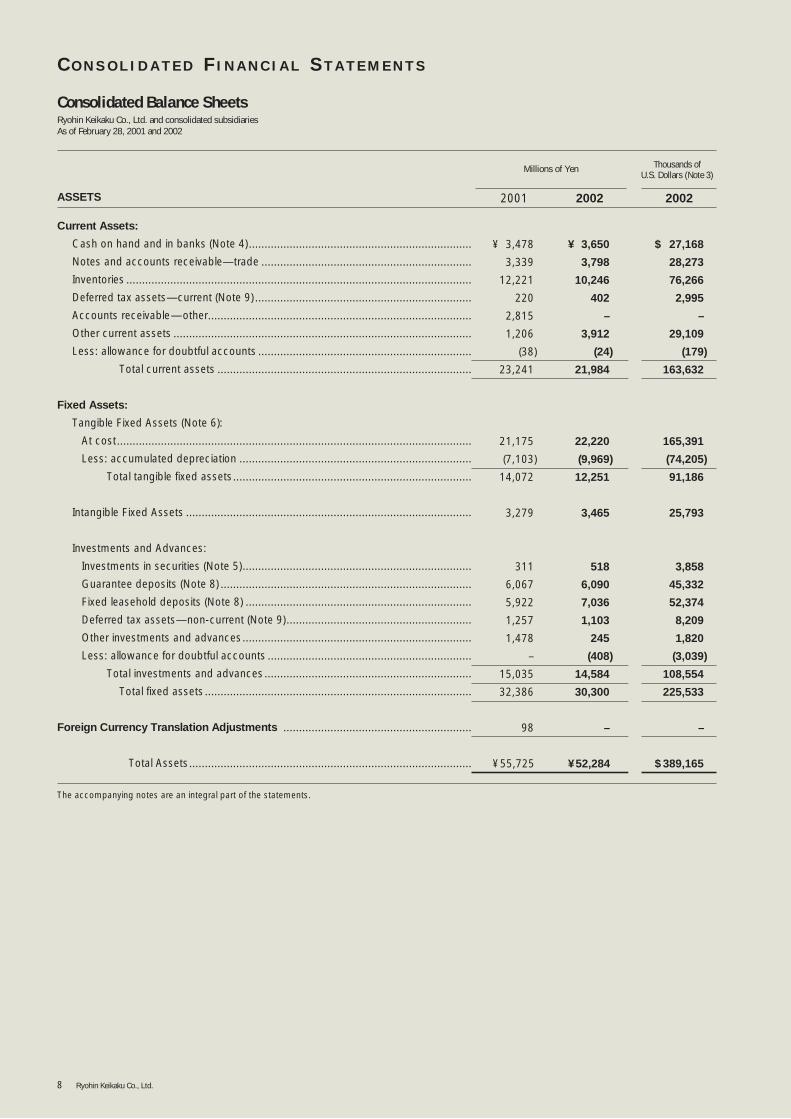
Shareholders’ equity dropped ¥1,160 million from the previous year, to ¥37,974 million, due to a
decline in consolidated net income. Return on assets (ROA) was down from 10.6% to 0.02%, while
return on equity (ROE) fell from 15.4% to 0.03%. These results directly reflect the impact on net
income from the disposal and write-down of inventories.
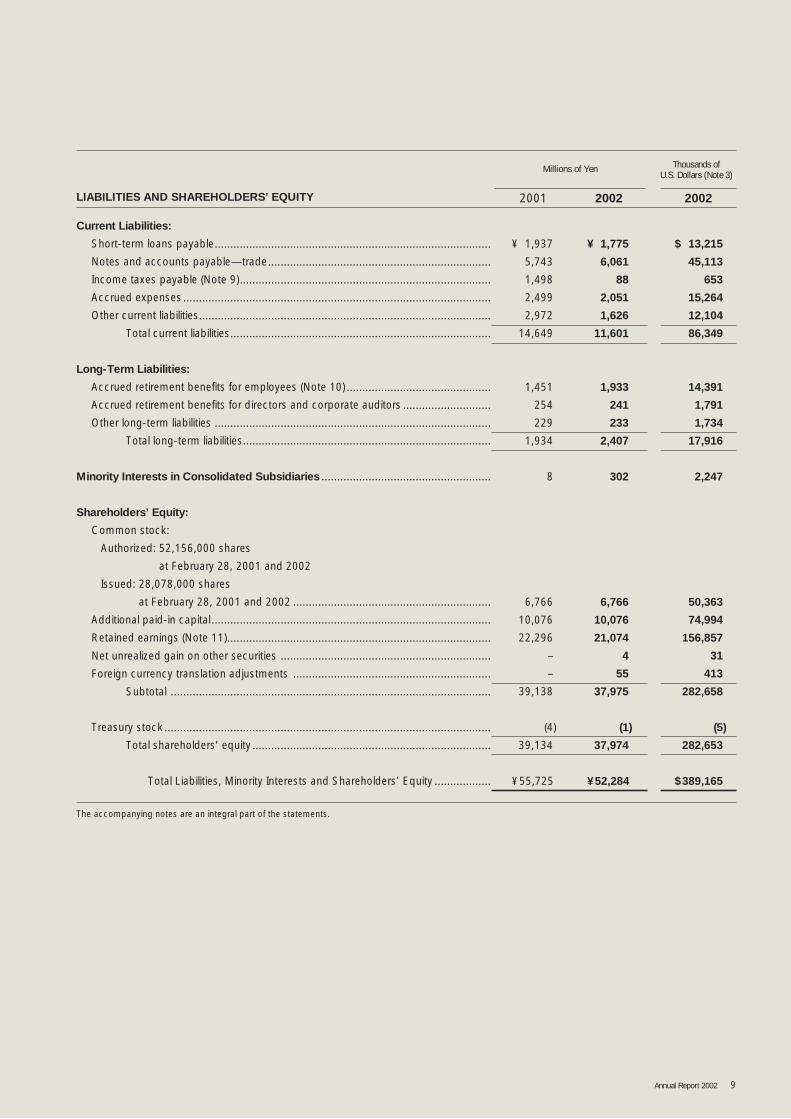
Cash Flows
Net cash provided by operating activities in fiscal 2001 totaled ¥5,596 million, nearly equal to the
previous year’s level. Although income before taxes dropped ¥10,122 million from the previous year,
inventories were down ¥2,111 million due to the disposal of inventories carried over, and income
taxes paid decreased ¥5,557 million as profit diminished.
Net cash used in investment activities decreased ¥5,284 million, to ¥4,042 million. This decline
came about as investment in tangible fixed assets dropped ¥3,783 million, and leasehold deposits
and guarantee deposits fell ¥1,545 million.
Net cash used in financial activities increased ¥1,799 million, to ¥1,436 million, as the Company
spent ¥216 million in repayment of short-term loans.
As a result of these activities, the balance of cash and cash equivalents as of February 28, 2002,
totaled ¥3,650 million, up ¥172 million from a year earlier.
Capital Investment
On a non-consolidated basis, capital investment during the year under review plunged ¥4,466 mil-
lion, to ¥5,186 million, due to the limited number of stores opened domestically, in contrast to the
vigorous openings seen until the previous year. Capital investment in fiscal 2002 will be reduced to
30% of the fiscal 2001 level as a whole. The Company plans to continue to hold back store openings
since efforts must be concentrated on reform programs to improve profitability. Thus, the main pur-
pose of capital spending in the next year will be the revitalization of existing stores.
8 Ryohin Keikaku Co., Ltd.
Current Assets:
Cash on hand and in banks (Note 4) .......................................................................
Notes and accounts receivable—trade ...................................................................
Inventories ..............................................................................................................
Deferred tax assets—current (Note 9) .....................................................................
Accounts receivable—other....................................................................................
Other current assets ...............................................................................................
Less: allowance for doubtful accounts ....................................................................
Total current assets .................................................................................
Fixed Assets:
Tangible Fixed Assets (Note 6):
At cost.................................................................................................................
Less: accumulated depreciation ..........................................................................
Total tangible fixed assets............................................................................
Intangible Fixed Assets ...........................................................................................
Investments and Advances:
Investments in securities (Note 5).........................................................................
Guarantee deposits (Note 8) ................................................................................
Fixed leasehold deposits (Note 8) ........................................................................
Deferred tax assets—non-current (Note 9)...........................................................
Other investments and advances.........................................................................
Less: allowance for doubtful accounts .................................................................
Total investments and advances..................................................................
Total fixed assets.....................................................................................
Foreign Currency Translation Adjustments ............................................................
Total Assets..........................................................................................
2002
Thousands of U.S. Dollars (Note 3)
20022001ASSETS
Millions of Yen
¥ 3,478
3,339
12,221
220
2,815
1,206
(38)
23,241
21,175
(7,103)
14,072
3,279
311
6,067
5,922
1,257
1,478
–
15,035
32,386
98
¥55,725
¥ 3,650
3,798
10,246
402
–
3,912
(24)
21,984
22,220
(9,969)
12,251
3,465
518
6,090
7,036
1,103
245
(408)
14,584
30,300
–
¥52,284
$ 27,168
28,273
76,266
2,995
–
29,109
(179)
163,632
165,391
(74,205)
91,186
25,793
3,858
45,332
52,374
8,209
1,820
(3,039)
108,554
225,533
–
$ 389,165
Ryohin Keikaku Co., Ltd. and consolidated subsidiariesAs of February 28, 2001 and 2002
The accompanying notes are an integral part of the statements.
Consolidated Balance Sheets
C O N S O L I D A T E D F I N A N C I A L S T A T E M E N T S
Annual Report 2002 9
200220022001
Thousands of U.S. Dollars (Note 3)
Millions of Yen
Current Liabilities:
Short-term loans payable........................................................................................
Notes and accounts payable—trade.......................................................................
Income taxes payable (Note 9)................................................................................
Accrued expenses ..................................................................................................
Other current liabilities.............................................................................................
Total current liabilities...................................................................................
Long-Term Liabilities:
Accrued retirement benefits for employees (Note 10) ..............................................
Accrued retirement benefits for directors and corporate auditors ............................
Other long-term liabilities ........................................................................................
Total long-term liabilities...............................................................................
Minority Interests in Consolidated Subsidiaries ......................................................
Shareholders’ Equity:
Common stock:
Authorized: 52,156,000 shares
at February 28, 2001 and 2002
Issued: 28,078,000 shares
at February 28, 2001 and 2002 ...............................................................
Additional paid-in capital .........................................................................................
Retained earnings (Note 11)....................................................................................
Net unrealized gain on other securities ...................................................................
Foreign currency translation adjustments ...............................................................
Subtotal ......................................................................................................
Treasury stock ........................................................................................................
Total shareholders’ equity ............................................................................
Total Liabilities, Minority Interests and Shareholders’ Equity ..................
LIABILITIES AND SHAREHOLDERS’ EQUITY
¥ 1,937
5,743
1,498
2,499
2,972
14,649
1,451
254
229
1,934
8
6,766
10,076
22,296
–
–
39,138
(4)
39,134
¥55,725
¥ 1,775
6,061
88
2,051
1,626
11,601
1,933
241
233
2,407
302
6,766
10,076
21,074
4
55
37,975
(1)
37,974
¥52,284
$ 13,215
45,113
653
15,264
12,104
86,349
14,391
1,791
1,734
17,916
2,247
50,363
74,994
156,857
31
413
282,658
(5)
282,653
$389,165
The accompanying notes are an integral part of the statements.
10 Ryohin Keikaku Co., Ltd.
Net Sales ..................................................................................................................
Cost of Sales ............................................................................................................
Gross profit ...........................................................................................................
Other Operating Revenue ........................................................................................
Selling, General and Administrative Expenses .......................................................
Operating profit .....................................................................................................
Other Income (Expenses):
Interest and dividend income.................................................................................
Gain on redemption of insurance funds ................................................................
Interest expenses ..................................................................................................
Loss on sale/disposal of fixed assets .....................................................................
Write-down of inventories .....................................................................................
Loss on disposal of inventories .............................................................................
Loss on cancellation of store rental contracts ........................................................
Write-down of investments in securities .................................................................
Amortization of the unrecognized transition amount arising from
adopting the new accounting standard for retirement benefits for
employees..........................................................................................................
Other, net ..............................................................................................................
Income before income taxes.......................................................................
Income Taxes (Note 9):
—Current ..............................................................................................................
—Deferred.............................................................................................................
Minority Interests in Net Income (Expense) of Consolidated Subsidiaries ...........
Net income............................................................................................................
Per Share (Note 12):
Net income............................................................................................................
Cash dividends......................................................................................................
Weighted average number of shares .....................................................................
¥115,266
67,040
48,226
288
48,514
36,926
11,588
25
–
(29)
(971)
–
–
(249)
(43)
–
113
10,434
4,703
49
4,752
(7)
¥ 5,689
¥202.60
44.00
28,077,076
¥119,188
71,796
47,392
704
48,096
42,581
5,515
20
263
(72)
(588)
(1,401)
(2,446)
(565)
–
(450)
35
312
284
(31)
253
46
¥ 13
¥0.46
44.00
28,077,782
Yen
200220022001
$887,148
534,401
352,747
5,240
357,987
316,941
41,046
150
1,960
(537)
(4,376)
(10,424)
(18,207)
(4,203)
–
(3,349)
263
2,323
2,114
(228)
1,886
340
$ 97
$0.00
0.33
The accompanying notes are an integral part of the statements.
Thousands of U.S. Dollars (Note 3)Millions of Yen
U.S. Dollars (Note 3)
Ryohin Keikaku Co., Ltd. and consolidated subsidiariesFor the years ended February 28, 2001 and 2002
Consolidated Statements of Income
Annual Report 2002 11
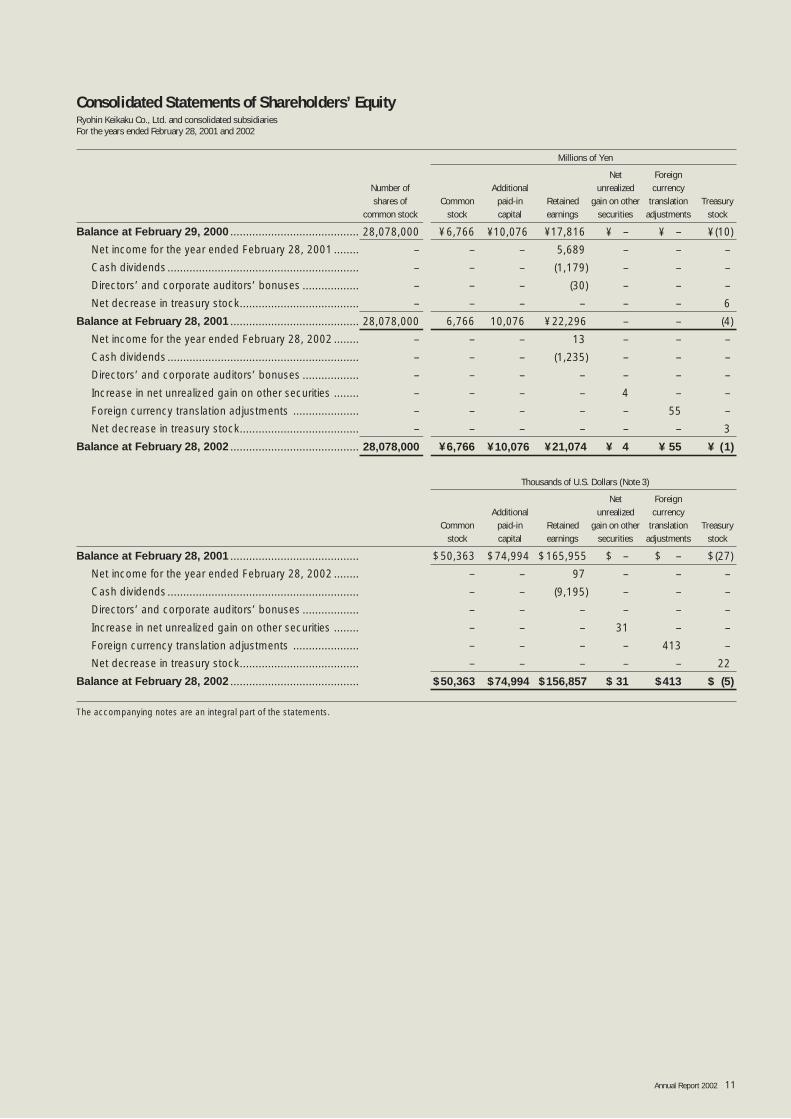
Millions of Yen
Net Foreign Number of Additional unrealized currencyshares of Common paid-in Retained gain on other translation Treasury
common stock stock capital earnings securities adjustments stock
Balance at February 29, 2000 .........................................
Net income for the year ended February 28, 2001 ........
Cash dividends .............................................................
Directors’ and corporate auditors’ bonuses ..................
Net decrease in treasury stock......................................
Balance at February 28, 2001 .........................................
Net income for the year ended February 28, 2002 ........
Cash dividends .............................................................
Directors’ and corporate auditors’ bonuses ..................
Increase in net unrealized gain on other securities ........
Foreign currency translation adjustments .....................
Net decrease in treasury stock......................................
Balance at February 28, 2002 .........................................
Thousands of U.S. Dollars (Note 3)
Net Foreign Additional unrealized currency
Common paid-in Retained gain on other translation Treasurystock capital earnings securities adjustments stock
Balance at February 28, 2001 .........................................
Net income for the year ended February 28, 2002 ........
Cash dividends .............................................................
Directors’ and corporate auditors’ bonuses ..................
Increase in net unrealized gain on other securities ........
Foreign currency translation adjustments .....................
Net decrease in treasury stock......................................
Balance at February 28, 2002 .........................................
¥17,816
5,689
(1,179)
(30)
–
¥22,296
13
(1,235)
–
–
–
–
¥21,074
$165,955
97
(9,195)
–
–
–
–
$156,857
¥(10)
–
–
–
6
(4)
–
–
–
–
–
3
¥ (1)
$(27)
–
–
–
–
–
22
$ (5)
The accompanying notes are an integral part of the statements.
28,078,000
–
–
–
–
28,078,000
–
–
–
–
–
–
28,078,000
¥6,766
–
–
–
–
6,766
–
–
–
–
–
–
¥6,766
$50,363
–
–
–
–
–
–
$50,363
¥10,076
–
–
–
–
10,076
–
–
–
–
–
–
¥10,076
$74,994
–
–
–
–
–
–
$74,994
Ryohin Keikaku Co., Ltd. and consolidated subsidiariesFor the years ended February 28, 2001 and 2002
¥ –
–
–
–
–
–
–
–
–
4
–
–
¥ 4
$ –
–
–
–
31
–
–
$ 31
¥ –
–
–
–
–
–
–
–
–
–
55
–
¥ 55
$ –
–
–
–
–
413
–
$413
Consolidated Statements of Shareholders’ Equity
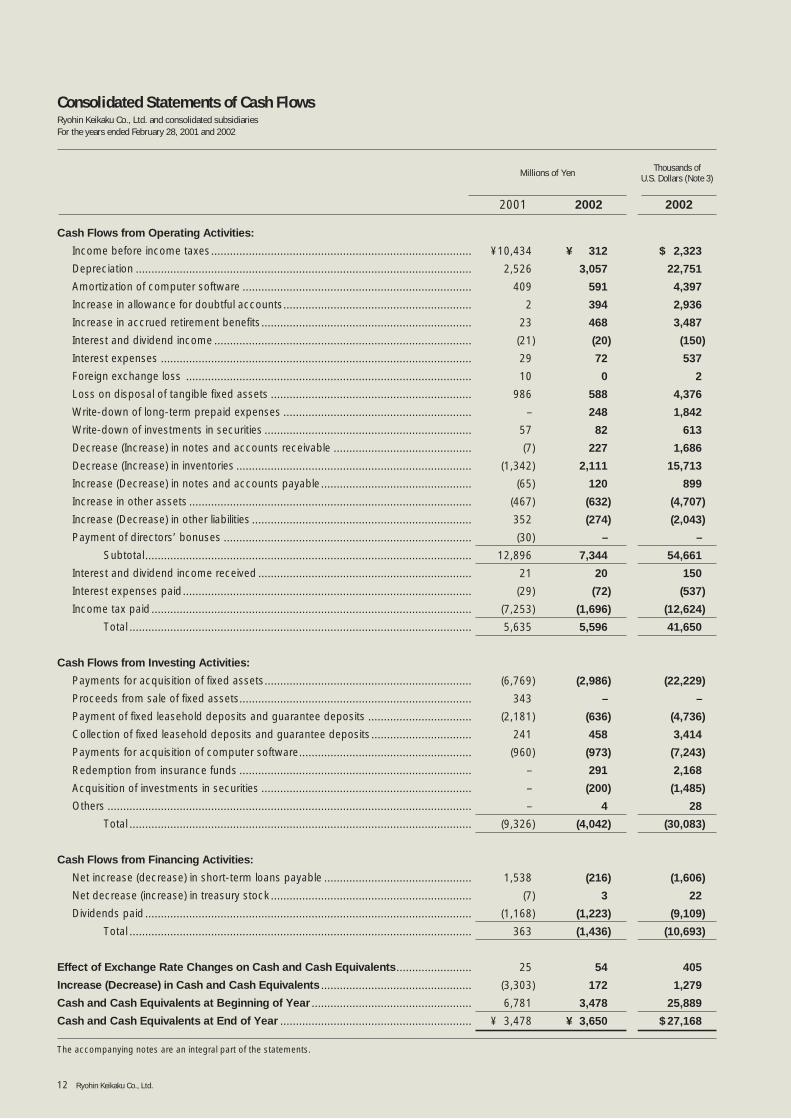
12 Ryohin Keikaku Co., Ltd.
Cash Flows from Operating Activities:
Income before income taxes...................................................................................
Depreciation ...........................................................................................................
Amortization of computer software .........................................................................
Increase in allowance for doubtful accounts............................................................
Increase in accrued retirement benefits...................................................................
Interest and dividend income ..................................................................................
Interest expenses ...................................................................................................
Foreign exchange loss ...........................................................................................
Loss on disposal of tangible fixed assets ................................................................
Write-down of long-term prepaid expenses ............................................................
Write-down of investments in securities ..................................................................
Decrease (Increase) in notes and accounts receivable ............................................
Decrease (Increase) in inventories ...........................................................................
Increase (Decrease) in notes and accounts payable................................................
Increase in other assets ..........................................................................................
Increase (Decrease) in other liabilities ......................................................................
Payment of directors’ bonuses ...............................................................................
Subtotal........................................................................................................
Interest and dividend income received ....................................................................
Interest expenses paid............................................................................................
Income tax paid ......................................................................................................
Total .............................................................................................................
Cash Flows from Investing Activities:
Payments for acquisition of fixed assets..................................................................
Proceeds from sale of fixed assets..........................................................................
Payment of fixed leasehold deposits and guarantee deposits .................................
Collection of fixed leasehold deposits and guarantee deposits................................
Payments for acquisition of computer software.......................................................
Redemption from insurance funds ..........................................................................
Acquisition of investments in securities ...................................................................
Others ....................................................................................................................
Total .............................................................................................................
Cash Flows from Financing Activities:
Net increase (decrease) in short-term loans payable ...............................................
Net decrease (increase) in treasury stock................................................................
Dividends paid ........................................................................................................
Total .............................................................................................................
Effect of Exchange Rate Changes on Cash and Cash Equivalents ........................
Increase (Decrease) in Cash and Cash Equivalents ................................................
Cash and Cash Equivalents at Beginning of Year ...................................................
Cash and Cash Equivalents at End of Year .............................................................
¥ 312
3,057
591
394
468
(20)
72
0
588
248
82
227
2,111
120
(632)
(274)
–
7,344
20
(72)
(1,696)
5,596
(2,986)
–
(636)
458
(973)
291
(200)
4
(4,042)
(216)
3
(1,223)
(1,436)
54
172
3,478
¥ 3,650
200220022001
$ 2,323
22,751
4,397
2,936
3,487
(150)
537
2
4,376
1,842
613
1,686
15,713
899
(4,707)
(2,043)
–
54,661
150
(537)
(12,624)
41,650
(22,229)
–
(4,736)
3,414
(7,243)
2,168
(1,485)
28
(30,083)
(1,606)
22
(9,109)
(10,693)
405
1,279
25,889
$ 27,168
The accompanying notes are an integral part of the statements.
¥10,434
2,526
409
2
23
(21)
29
10
986
–
57
(7)
(1,342)
(65)
(467)
352
(30)
12,896
21
(29)
(7,253)
5,635
(6,769)
343
(2,181)
241
(960)
–
–
–
(9,326)
1,538
(7)
(1,168)
363
25
(3,303)
6,781
¥ 3,478
Thousands of U.S. Dollars (Note 3)Millions of Yen
Ryohin Keikaku Co., Ltd. and consolidated subsidiariesFor the years ended February 28, 2001 and 2002
Consolidated Statements of Cash Flows
Annual Report 2002 13
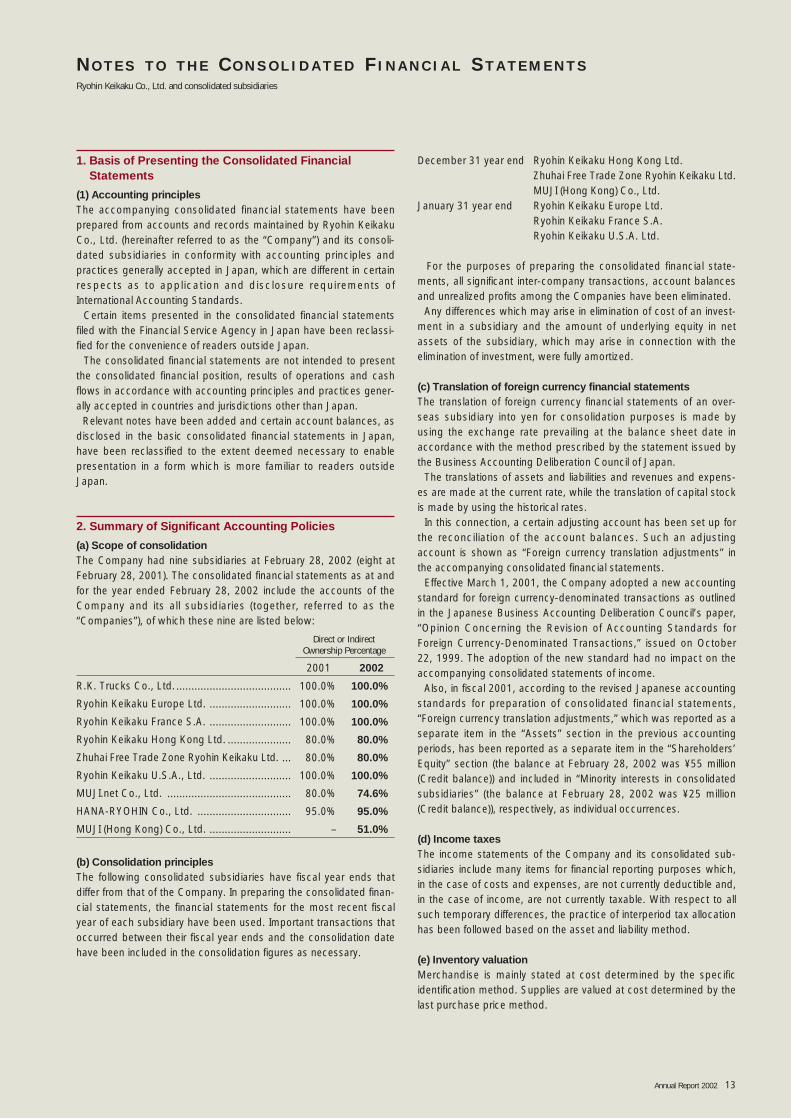
1. Basis of Presenting the Consolidated FinancialStatements
(1) Accounting principles The accompanying consolidated financial statements have beenprepared from accounts and records maintained by Ryohin KeikakuCo., Ltd. (hereinafter referred to as the “Company”) and its consoli-dated subsidiaries in conformity with accounting principles andpractices generally accepted in Japan, which are different in certainrespects as to application and disclosure requirements ofInternational Accounting Standards.
Certain items presented in the consolidated financial statementsfiled with the Financial Service Agency in Japan have been reclassi-fied for the convenience of readers outside Japan.
The consolidated financial statements are not intended to presentthe consolidated financial position, results of operations and cashflows in accordance with accounting principles and practices gener-ally accepted in countries and jurisdictions other than Japan.
Relevant notes have been added and certain account balances, asdisclosed in the basic consolidated financial statements in Japan,have been reclassified to the extent deemed necessary to enablepresentation in a form which is more familiar to readers outsideJapan.
2. Summary of Significant Accounting Policies
(a) Scope of consolidationThe Company had nine subsidiaries at February 28, 2002 (eight atFebruary 28, 2001). The consolidated financial statements as at andfor the year ended February 28, 2002 include the accounts of theCompany and its all subsidiaries (together, referred to as the“Companies”), of which these nine are listed below:
Direct or Indirect Ownership Percentage
2001 2002
R.K. Trucks Co., Ltd. ...................................... 100.0% 100.0%
Ryohin Keikaku Europe Ltd. ........................... 100.0% 100.0%
Ryohin Keikaku France S.A. ........................... 100.0% 100.0%
Ryohin Keikaku Hong Kong Ltd. ..................... 80.0% 80.0%
Zhuhai Free Trade Zone Ryohin Keikaku Ltd. ... 80.0% 80.0%
Ryohin Keikaku U.S.A., Ltd. ........................... 100.0% 100.0%
MUJI.net Co., Ltd. ......................................... 80.0% 74.6%
HANA-RYOHIN Co., Ltd. ............................... 95.0% 95.0%
MUJI (Hong Kong) Co., Ltd. ........................... – 51.0%
(b) Consolidation principlesThe following consolidated subsidiaries have fiscal year ends thatdiffer from that of the Company. In preparing the consolidated finan-cial statements, the financial statements for the most recent fiscalyear of each subsidiary have been used. Important transactions thatoccurred between their fiscal year ends and the consolidation datehave been included in the consolidation figures as necessary.
December 31 year end Ryohin Keikaku Hong Kong Ltd.Zhuhai Free Trade Zone Ryohin Keikaku Ltd.MUJI (Hong Kong) Co., Ltd.
January 31 year end Ryohin Keikaku Europe Ltd.Ryohin Keikaku France S.A.Ryohin Keikaku U.S.A. Ltd.
For the purposes of preparing the consolidated financial state-ments, all significant inter-company transactions, account balancesand unrealized profits among the Companies have been eliminated.
Any differences which may arise in elimination of cost of an invest-ment in a subsidiary and the amount of underlying equity in netassets of the subsidiary, which may arise in connection with theelimination of investment, were fully amortized.
(c) Translation of foreign currency financial statementsThe translation of foreign currency financial statements of an over-seas subsidiary into yen for consolidation purposes is made byusing the exchange rate prevailing at the balance sheet date inaccordance with the method prescribed by the statement issued bythe Business Accounting Deliberation Council of Japan.
The translations of assets and liabilities and revenues and expens-es are made at the current rate, while the translation of capital stockis made by using the historical rates.
In this connection, a certain adjusting account has been set up forthe reconciliation of the account balances. Such an adjustingaccount is shown as “Foreign currency translation adjustments” inthe accompanying consolidated financial statements.
Effective March 1, 2001, the Company adopted a new accountingstandard for foreign currency-denominated transactions as outlinedin the Japanese Business Accounting Deliberation Council’s paper,“Opinion Concerning the Revision of Accounting Standards forForeign Currency-Denominated Transactions,” issued on October22, 1999. The adoption of the new standard had no impact on theaccompanying consolidated statements of income.
Also, in fiscal 2001, according to the revised Japanese accountingstandards for preparation of consolidated financial statements,“Foreign currency translation adjustments,” which was reported as aseparate item in the “Assets” section in the previous accountingperiods, has been reported as a separate item in the “Shareholders’Equity” section (the balance at February 28, 2002 was ¥55 million(Credit balance)) and included in “Minority interests in consolidatedsubsidiaries” (the balance at February 28, 2002 was ¥25 million(Credit balance)), respectively, as individual occurrences.
(d) Income taxesThe income statements of the Company and its consolidated sub-sidiaries include many items for financial reporting purposes which,in the case of costs and expenses, are not currently deductible and,in the case of income, are not currently taxable. With respect to allsuch temporary differences, the practice of interperiod tax allocationhas been followed based on the asset and liability method.
(e) Inventory valuationMerchandise is mainly stated at cost determined by the specificidentification method. Supplies are valued at cost determined by thelast purchase price method.
Ryohin Keikaku Co., Ltd. and consolidated subsidiaries
N O T E S T O T H E C O N S O L I D A T E D F I N A N C I A L S T A T E M E N T S
14 Ryohin Keikaku Co., Ltd.
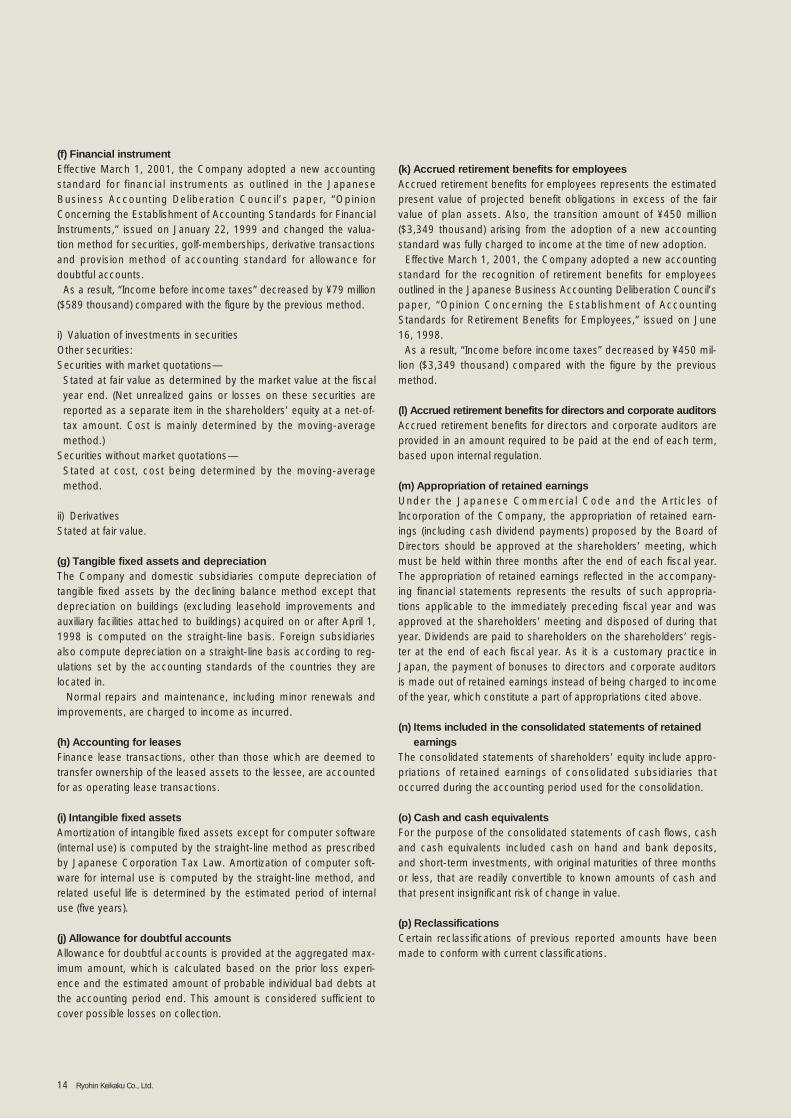
(f) Financial instrumentEffective March 1, 2001, the Company adopted a new accountingstandard for financial instruments as outlined in the JapaneseBusiness Accounting Deliberation Council’s paper, “OpinionConcerning the Establishment of Accounting Standards for FinancialInstruments,” issued on January 22, 1999 and changed the valua-tion method for securities, golf-memberships, derivative transactionsand provision method of accounting standard for allowance fordoubtful accounts.
As a result, “Income before income taxes” decreased by ¥79 million($589 thousand) compared with the figure by the previous method.
i) Valuation of investments in securitiesOther securities:Securities with market quotations—Stated at fair value as determined by the market value at the fiscalyear end. (Net unrealized gains or losses on these securities arereported as a separate item in the shareholders’ equity at a net-of-tax amount. Cost is mainly determined by the moving-averagemethod.)
Securities without market quotations—Stated at cost, cost being determined by the moving-averagemethod.
ii) DerivativesStated at fair value.
(g) Tangible fixed assets and depreciationThe Company and domestic subsidiaries compute depreciation oftangible fixed assets by the declining balance method except thatdepreciation on buildings (excluding leasehold improvements andauxiliary facilities attached to buildings) acquired on or after April 1,1998 is computed on the straight-line basis. Foreign subsidiariesalso compute depreciation on a straight-line basis according to reg-ulations set by the accounting standards of the countries they arelocated in.
Normal repairs and maintenance, including minor renewals andimprovements, are charged to income as incurred.
(h) Accounting for leasesFinance lease transactions, other than those which are deemed totransfer ownership of the leased assets to the lessee, are accountedfor as operating lease transactions.
(i) Intangible fixed assetsAmortization of intangible fixed assets except for computer software(internal use) is computed by the straight-line method as prescribedby Japanese Corporation Tax Law. Amortization of computer soft-ware for internal use is computed by the straight-line method, andrelated useful life is determined by the estimated period of internaluse (five years).
(j) Allowance for doubtful accountsAllowance for doubtful accounts is provided at the aggregated max-imum amount, which is calculated based on the prior loss experi-ence and the estimated amount of probable individual bad debts atthe accounting period end. This amount is considered sufficient tocover possible losses on collection.
(k) Accrued retirement benefits for employeesAccrued retirement benefits for employees represents the estimatedpresent value of projected benefit obligations in excess of the fairvalue of plan assets. Also, the transition amount of ¥450 million($3,349 thousand) arising from the adoption of a new accountingstandard was fully charged to income at the time of new adoption.
Effective March 1, 2001, the Company adopted a new accountingstandard for the recognition of retirement benefits for employeesoutlined in the Japanese Business Accounting Deliberation Council’spaper, “Opinion Concerning the Establishment of AccountingStandards for Retirement Benefits for Employees,” issued on June16, 1998.
As a result, “Income before income taxes” decreased by ¥450 mil-lion ($3,349 thousand) compared with the figure by the previousmethod.
(l) Accrued retirement benefits for directors and corporate auditorsAccrued retirement benefits for directors and corporate auditors areprovided in an amount required to be paid at the end of each term,based upon internal regulation.
(m) Appropriation of retained earningsUnder the Japanese Commercial Code and the Articles ofIncorporation of the Company, the appropriation of retained earn-ings (including cash dividend payments) proposed by the Board ofDirectors should be approved at the shareholders’ meeting, whichmust be held within three months after the end of each fiscal year.The appropriation of retained earnings reflected in the accompany-ing financial statements represents the results of such appropria-tions applicable to the immediately preceding fiscal year and wasapproved at the shareholders’ meeting and disposed of during thatyear. Dividends are paid to shareholders on the shareholders’ regis-ter at the end of each fiscal year. As it is a customary practice inJapan, the payment of bonuses to directors and corporate auditorsis made out of retained earnings instead of being charged to incomeof the year, which constitute a part of appropriations cited above.
(n) Items included in the consolidated statements of retainedearnings
The consolidated statements of shareholders’ equity include appro-priations of retained earnings of consolidated subsidiaries thatoccurred during the accounting period used for the consolidation.
(o) Cash and cash equivalentsFor the purpose of the consolidated statements of cash flows, cashand cash equivalents included cash on hand and bank deposits,and short-term investments, with original maturities of three monthsor less, that are readily convertible to known amounts of cash andthat present insignificant risk of change in value.
(p) ReclassificationsCertain reclassifications of previous reported amounts have beenmade to conform with current classifications.
Annual Report 2002 15
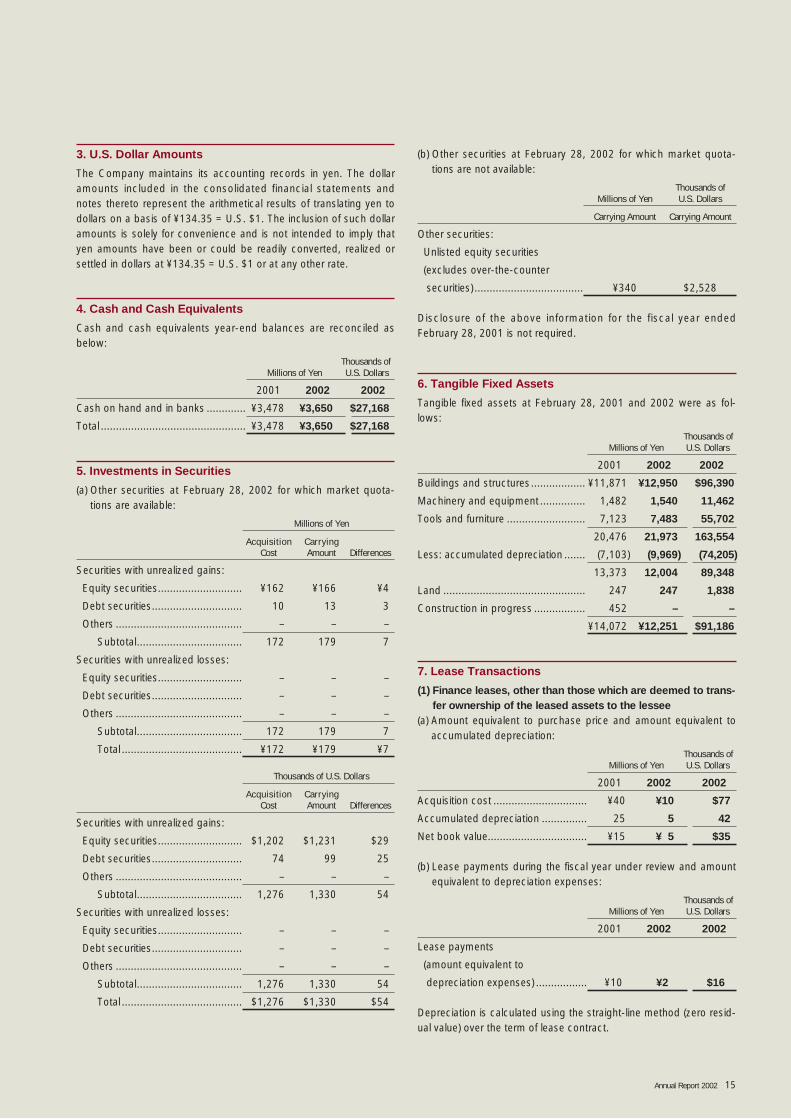
3. U.S. Dollar Amounts
The Company maintains its accounting records in yen. The dollaramounts included in the consolidated financial statements andnotes thereto represent the arithmetical results of translating yen todollars on a basis of ¥134.35 = U.S. $1. The inclusion of such dollaramounts is solely for convenience and is not intended to imply thatyen amounts have been or could be readily converted, realized orsettled in dollars at ¥134.35 = U.S. $1 or at any other rate.
4. Cash and Cash Equivalents
Cash and cash equivalents year-end balances are reconciled asbelow:
Thousands ofMillions of Yen U.S. Dollars
2001 2002 2002
Cash on hand and in banks ............. ¥3,478 ¥3,650 $27,168
Total ................................................ ¥3,478 ¥3,650 $27,168
5. Investments in Securities
(a) Other securities at February 28, 2002 for which market quota-tions are available:
Millions of Yen
Acquisition CarryingCost Amount Differences
Securities with unrealized gains:
Equity securities............................ ¥162 ¥166 ¥4
Debt securities.............................. 10 13 3
Others .......................................... – – –
Subtotal................................... 172 179 7
Securities with unrealized losses:
Equity securities............................ – – –
Debt securities.............................. – – –
Others .......................................... – – –
Subtotal................................... 172 179 7
Total ........................................ ¥172 ¥179 ¥7
Thousands of U.S. Dollars
Acquisition CarryingCost Amount Differences
Securities with unrealized gains:
Equity securities............................ $1,202 $1,231 $29
Debt securities.............................. 74 99 25
Others .......................................... – – –
Subtotal................................... 1,276 1,330 54
Securities with unrealized losses:
Equity securities............................ – – –
Debt securities.............................. – – –
Others .......................................... – – –
Subtotal................................... 1,276 1,330 54
Total ........................................ $1,276 $1,330 $54
(b) Other securities at February 28, 2002 for which market quota-tions are not available:
Thousands of Millions of Yen U.S. Dollars
Carrying Amount Carrying Amount
Other securities:
Unlisted equity securities
(excludes over-the-counter
securities) .................................... ¥340 $2,528
Disclosure of the above information for the fiscal year endedFebruary 28, 2001 is not required.
6. Tangible Fixed Assets
Tangible fixed assets at February 28, 2001 and 2002 were as fol-lows:
Thousands ofMillions of Yen U.S. Dollars
2001 2002 2002
Buildings and structures.................. ¥11,871 ¥12,950 $96,390
Machinery and equipment ............... 1,482 1,540 11,462
Tools and furniture .......................... 7,123 7,483 55,702
20,476 21,973 163,554
Less: accumulated depreciation ....... (7,103) (9,969) (74,205)
13,373 12,004 89,348
Land ............................................... 247 247 1,838
Construction in progress ................. 452 – –
¥14,072 ¥12,251 $91,186
7. Lease Transactions
(1) Finance leases, other than those which are deemed to trans-fer ownership of the leased assets to the lessee
(a) Amount equivalent to purchase price and amount equivalent toaccumulated depreciation:
Thousands ofMillions of Yen U.S. Dollars
2001 2002 2002
Acquisition cost ............................... ¥40 ¥10 $77
Accumulated depreciation ............... 25 5 42
Net book value................................. ¥15 ¥ 5 $35
(b) Lease payments during the fiscal year under review and amountequivalent to depreciation expenses:
Thousands ofMillions of Yen U.S. Dollars
2001 2002 2002
Lease payments
(amount equivalent to
depreciation expenses) ................. ¥10 ¥2 $16
Depreciation is calculated using the straight-line method (zero resid-ual value) over the term of lease contract.
16 Ryohin Keikaku Co., Ltd.
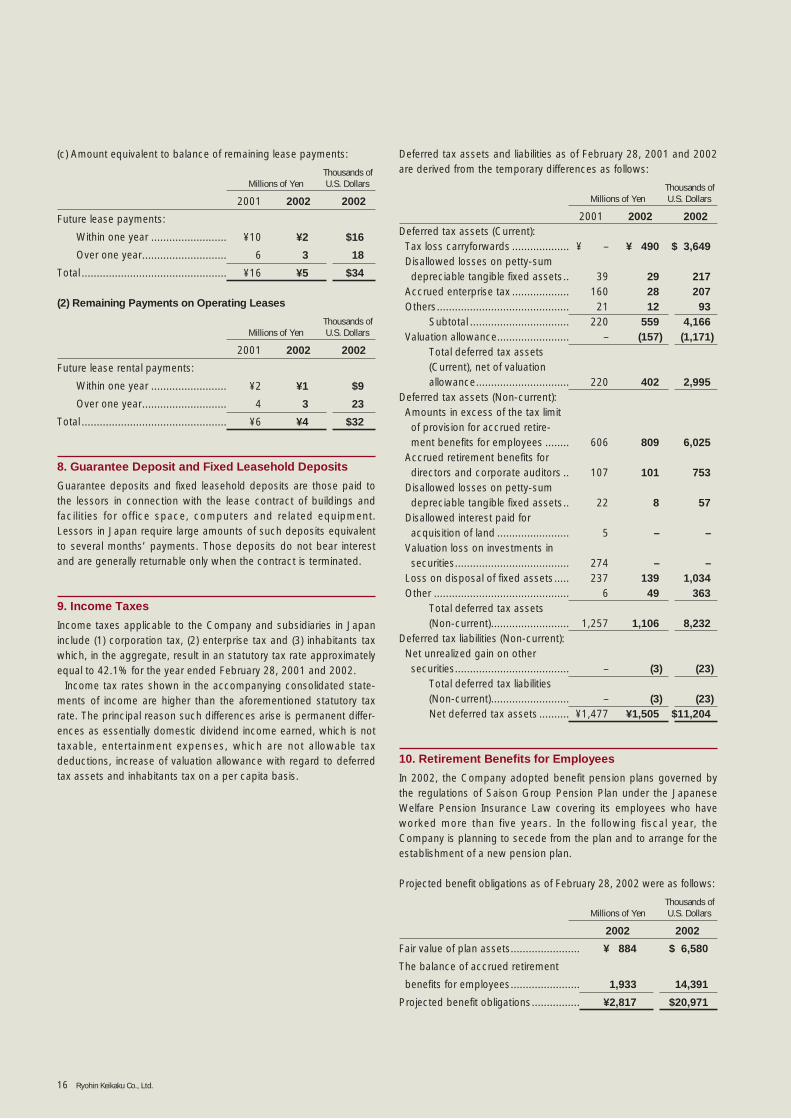
(c) Amount equivalent to balance of remaining lease payments:
Thousands ofMillions of Yen U.S. Dollars
2001 2002 2002
Future lease payments:
Within one year ......................... ¥10 ¥2 $16
Over one year............................ 6 3 18
Total ................................................ ¥16 ¥5 $34
(2) Remaining Payments on Operating Leases
Thousands ofMillions of Yen U.S. Dollars
2001 2002 2002
Future lease rental payments:
Within one year ......................... ¥2 ¥1 $9
Over one year............................ 4 3 23
Total ................................................ ¥6 ¥4 $32
8. Guarantee Deposit and Fixed Leasehold Deposits
Guarantee deposits and fixed leasehold deposits are those paid tothe lessors in connection with the lease contract of buildings andfacilities for office space, computers and related equipment.Lessors in Japan require large amounts of such deposits equivalentto several months’ payments. Those deposits do not bear interestand are generally returnable only when the contract is terminated.
9. Income Taxes
Income taxes applicable to the Company and subsidiaries in Japaninclude (1) corporation tax, (2) enterprise tax and (3) inhabitants taxwhich, in the aggregate, result in an statutory tax rate approximatelyequal to 42.1% for the year ended February 28, 2001 and 2002.
Income tax rates shown in the accompanying consolidated state-ments of income are higher than the aforementioned statutory taxrate. The principal reason such differences arise is permanent differ-ences as essentially domestic dividend income earned, which is nottaxable, entertainment expenses, which are not allowable taxdeductions, increase of valuation allowance with regard to deferredtax assets and inhabitants tax on a per capita basis.
Deferred tax assets and liabilities as of February 28, 2001 and 2002are derived from the temporary differences as follows:
Thousands ofMillions of Yen U.S. Dollars
2001 2002 2002Deferred tax assets (Current):Tax loss carryforwards ................... ¥ – ¥ 490 $ 3,649Disallowed losses on petty-sum depreciable tangible fixed assets.. 39 29 217
Accrued enterprise tax ................... 160 28 207Others............................................ 21 12 93
Subtotal ................................. 220 559 4,166Valuation allowance........................ – (157) (1,171)
Total deferred tax assets (Current), net of valuation allowance............................... 220 402 2,995
Deferred tax assets (Non-current):Amounts in excess of the tax limit of provision for accrued retire-ment benefits for employees ........ 606 809 6,025
Accrued retirement benefits for directors and corporate auditors .. 107 101 753
Disallowed losses on petty-sum depreciable tangible fixed assets.. 22 8 57
Disallowed interest paid for acquisition of land ........................ 5 – –
Valuation loss on investments in securities...................................... 274 – –
Loss on disposal of fixed assets..... 237 139 1,034Other ............................................. 6 49 363
Total deferred tax assets (Non-current).......................... 1,257 1,106 8,232
Deferred tax liabilities (Non-current):Net unrealized gain on other securities...................................... – (3) (23)
Total deferred tax liabilities (Non-current).......................... – (3) (23)Net deferred tax assets .......... ¥1,477 ¥1,505 $11,204
10. Retirement Benefits for Employees
In 2002, the Company adopted benefit pension plans governed bythe regulations of Saison Group Pension Plan under the JapaneseWelfare Pension Insurance Law covering its employees who haveworked more than five years. In the following fiscal year, theCompany is planning to secede from the plan and to arrange for theestablishment of a new pension plan.
Projected benefit obligations as of February 28, 2002 were as follows:
Thousands ofMillions of Yen U.S. Dollars
2002 2002
Fair value of plan assets....................... ¥ 884 $ 6,580
The balance of accrued retirement
benefits for employees....................... 1,933 14,391
Projected benefit obligations................ ¥2,817 $20,971
Annual Report 2002 17
Millions of Yen Thousands of U.S. Dollars
2001 2002 2002Contracted Contracted Contracted
amount Valuation amount Valuation amount Valuation(More than Market gain (More than Market gain (More than Market gain
Classification Type 1 year) Value (loss) 1 year) Value (loss) 1 year) Value (loss)
Transactions Forward exchange outside contracts of market Buying
U.S. Dollars ............... 2,421 (–) 2,786 365 7 (–) 10 3 57 (–) 80 23Total ........................ ¥2,421 (–) ¥2,786 ¥365 ¥7 (–) ¥10 ¥3 $57 (–) $80 $23
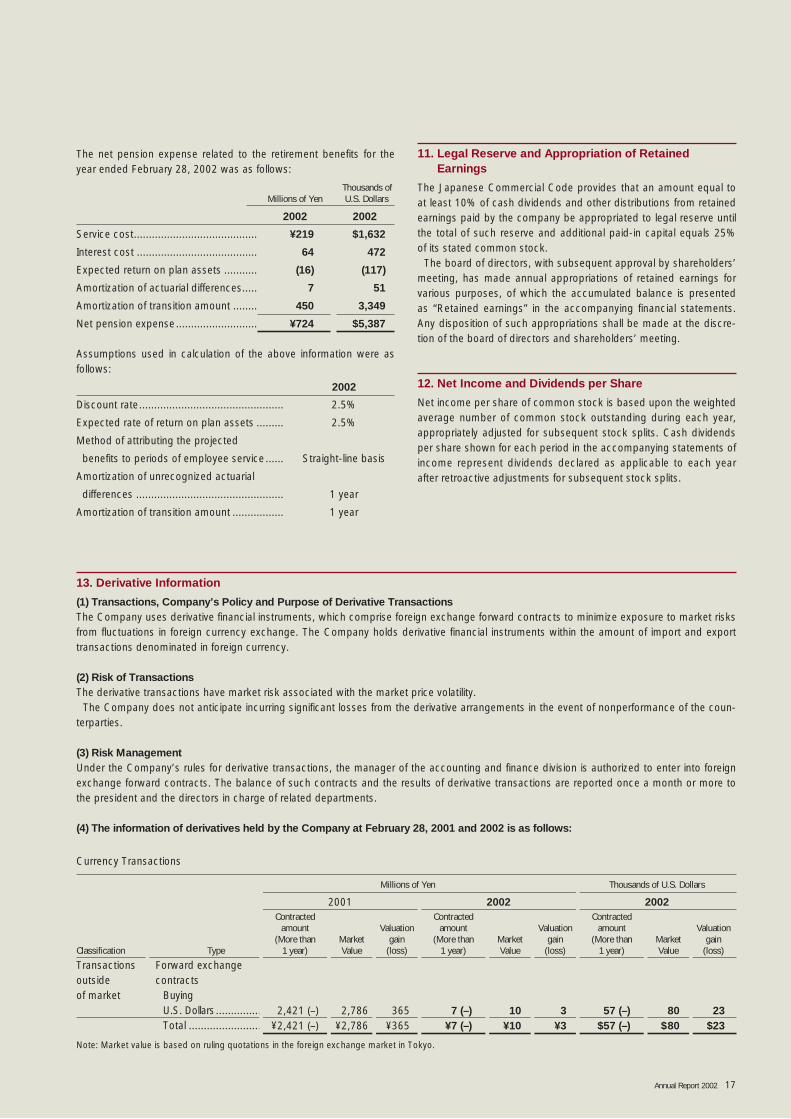
13. Derivative Information
(1) Transactions, Company’s Policy and Purpose of Derivative TransactionsThe Company uses derivative financial instruments, which comprise foreign exchange forward contracts to minimize exposure to market risksfrom fluctuations in foreign currency exchange. The Company holds derivative financial instruments within the amount of import and exporttransactions denominated in foreign currency.
(2) Risk of TransactionsThe derivative transactions have market risk associated with the market price volatility.
The Company does not anticipate incurring significant losses from the derivative arrangements in the event of nonperformance of the coun-terparties.
(3) Risk ManagementUnder the Company’s rules for derivative transactions, the manager of the accounting and finance division is authorized to enter into foreignexchange forward contracts. The balance of such contracts and the results of derivative transactions are reported once a month or more tothe president and the directors in charge of related departments.
(4) The information of derivatives held by the Company at February 28, 2001 and 2002 is as follows:
Currency Transactions
Note: Market value is based on ruling quotations in the foreign exchange market in Tokyo.
The net pension expense related to the retirement benefits for theyear ended February 28, 2002 was as follows:
Thousands ofMillions of Yen U.S. Dollars
2002 2002
Service cost......................................... ¥219 $1,632
Interest cost ........................................ 64 472
Expected return on plan assets ........... (16) (117)
Amortization of actuarial differences..... 7 51
Amortization of transition amount ........ 450 3,349
Net pension expense........................... ¥724 $5,387
Assumptions used in calculation of the above information were asfollows:
2002
Discount rate................................................ 2.5%
Expected rate of return on plan assets ......... 2.5%
Method of attributing the projected
benefits to periods of employee service ...... Straight-line basis
Amortization of unrecognized actuarial
differences ................................................. 1 year
Amortization of transition amount ................. 1 year
11. Legal Reserve and Appropriation of RetainedEarnings
The Japanese Commercial Code provides that an amount equal toat least 10% of cash dividends and other distributions from retainedearnings paid by the company be appropriated to legal reserve untilthe total of such reserve and additional paid-in capital equals 25%of its stated common stock.
The board of directors, with subsequent approval by shareholders’meeting, has made annual appropriations of retained earnings forvarious purposes, of which the accumulated balance is presentedas “Retained earnings” in the accompanying financial statements.Any disposition of such appropriations shall be made at the discre-tion of the board of directors and shareholders’ meeting.
12. Net Income and Dividends per Share
Net income per share of common stock is based upon the weightedaverage number of common stock outstanding during each year,appropriately adjusted for subsequent stock splits. Cash dividendsper share shown for each period in the accompanying statements ofincome represent dividends declared as applicable to each yearafter retroactive adjustments for subsequent stock splits.
18 Ryohin Keikaku Co., Ltd.
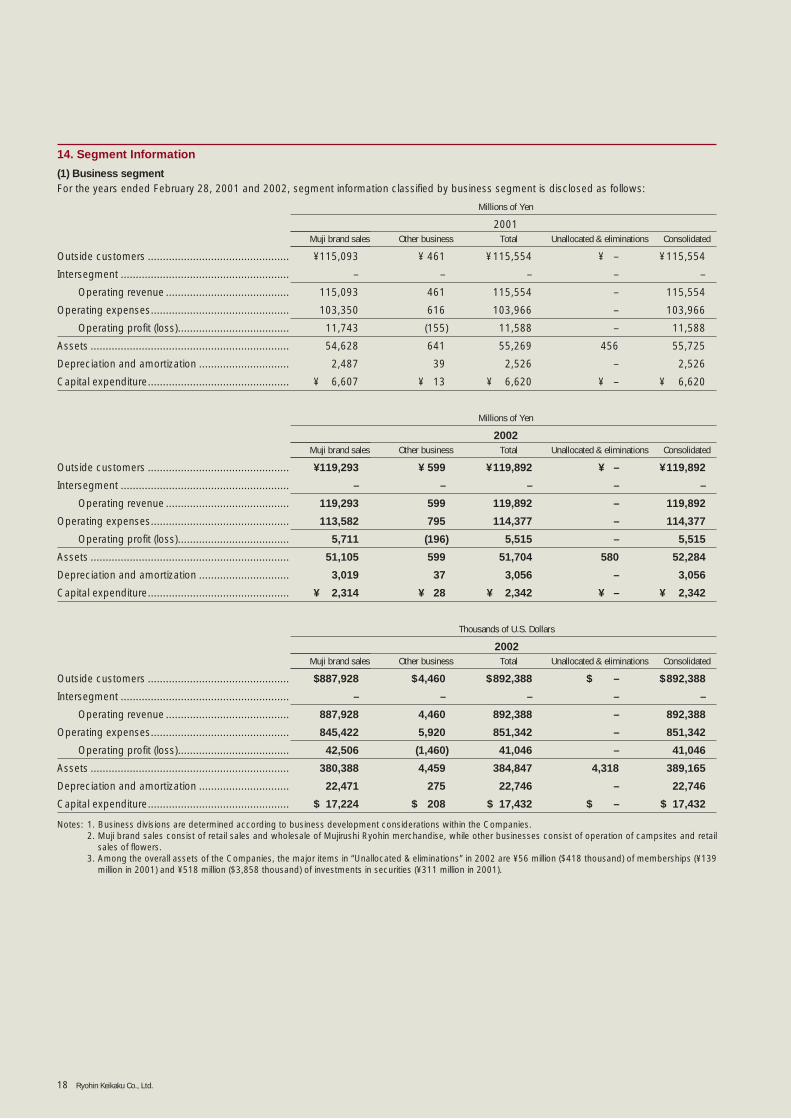
14. Segment Information
(1) Business segmentFor the years ended February 28, 2001 and 2002, segment information classified by business segment is disclosed as follows:
Millions of Yen
2001Muji brand sales Other business Total Unallocated & eliminations Consolidated
Outside customers ............................................... ¥115,093 ¥ 461 ¥115,554 ¥ – ¥115,554
Intersegment ........................................................ – – – – –
Operating revenue ......................................... 115,093 461 115,554 – 115,554
Operating expenses.............................................. 103,350 616 103,966 – 103,966
Operating profit (loss)..................................... 11,743 (155) 11,588 – 11,588
Assets .................................................................. 54,628 641 55,269 456 55,725
Depreciation and amortization .............................. 2,487 39 2,526 – 2,526
Capital expenditure............................................... ¥ 6,607 ¥ 13 ¥ 6,620 ¥ – ¥ 6,620
Millions of Yen
2002Muji brand sales Other business Total Unallocated & eliminations Consolidated
Outside customers ............................................... ¥119,293 ¥ 599 ¥119,892 ¥ – ¥119,892
Intersegment ........................................................ – – – – –
Operating revenue ......................................... 119,293 599 119,892 – 119,892
Operating expenses.............................................. 113,582 795 114,377 – 114,377
Operating profit (loss)..................................... 5,711 (196) 5,515 – 5,515
Assets .................................................................. 51,105 599 51,704 580 52,284
Depreciation and amortization .............................. 3,019 37 3,056 – 3,056
Capital expenditure............................................... ¥ 2,314 ¥ 28 ¥ 2,342 ¥ – ¥ 2,342
Thousands of U.S. Dollars
2002Muji brand sales Other business Total Unallocated & eliminations Consolidated
Outside customers ............................................... $887,928 $4,460 $892,388 $ – $892,388
Intersegment ........................................................ – – – – –
Operating revenue ......................................... 887,928 4,460 892,388 – 892,388
Operating expenses.............................................. 845,422 5,920 851,342 – 851,342
Operating profit (loss)..................................... 42,506 (1,460) 41,046 – 41,046
Assets .................................................................. 380,388 4,459 384,847 4,318 389,165
Depreciation and amortization .............................. 22,471 275 22,746 – 22,746
Capital expenditure............................................... $ 17,224 $ 208 $ 17,432 $ – $ 17,432
Notes: 1. Business divisions are determined according to business development considerations within the Companies.2. Muji brand sales consist of retail sales and wholesale of Mujirushi Ryohin merchandise, while other businesses consist of operation of campsites and retail
sales of flowers.3. Among the overall assets of the Companies, the major items in “Unallocated & eliminations” in 2002 are ¥56 million ($418 thousand) of memberships (¥139
million in 2001) and ¥518 million ($3,858 thousand) of investments in securities (¥311 million in 2001).
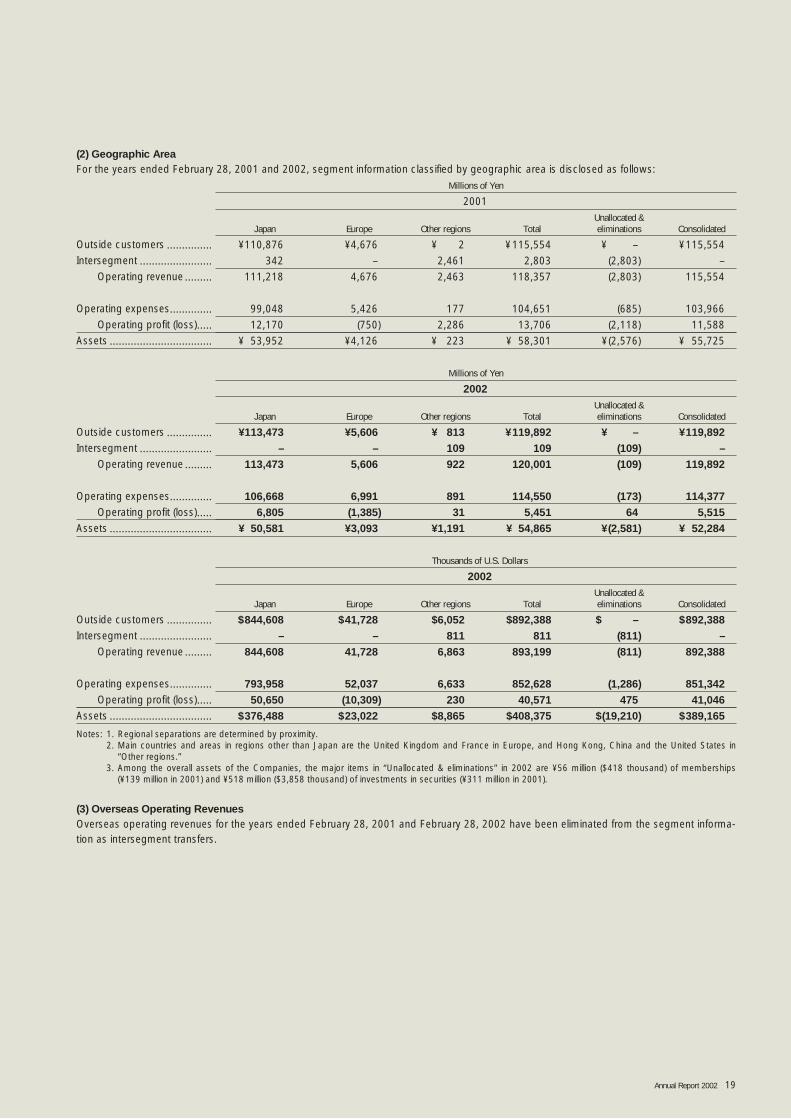
Annual Report 2002 19
Notes: 1. Regional separations are determined by proximity.2. Main countries and areas in regions other than Japan are the United Kingdom and France in Europe, and Hong Kong, China and the United States in
“Other regions.”3. Among the overall assets of the Companies, the major items in “Unallocated & eliminations” in 2002 are ¥56 million ($418 thousand) of memberships
(¥139 million in 2001) and ¥518 million ($3,858 thousand) of investments in securities (¥311 million in 2001).
(3) Overseas Operating RevenuesOverseas operating revenues for the years ended February 28, 2001 and February 28, 2002 have been eliminated from the segment informa-tion as intersegment transfers.
(2) Geographic AreaFor the years ended February 28, 2001 and 2002, segment information classified by geographic area is disclosed as follows:
Millions of Yen
2001Unallocated &
Japan Europe Other regions Total eliminations Consolidated
Outside customers ............... ¥110,876 ¥4,676 ¥ 2 ¥115,554 ¥ – ¥115,554Intersegment ........................ 342 – 2,461 2,803 (2,803) –
Operating revenue ......... 111,218 4,676 2,463 118,357 (2,803) 115,554
Operating expenses.............. 99,048 5,426 177 104,651 (685) 103,966Operating profit (loss)..... 12,170 (750) 2,286 13,706 (2,118) 11,588
Assets .................................. ¥ 53,952 ¥4,126 ¥ 223 ¥ 58,301 ¥(2,576) ¥ 55,725
Millions of Yen
2002Unallocated &
Japan Europe Other regions Total eliminations Consolidated
Outside customers ............... ¥113,473 ¥5,606 ¥ 813 ¥119,892 ¥ – ¥119,892Intersegment ........................ – – 109 109 (109) –
Operating revenue ......... 113,473 5,606 922 120,001 (109) 119,892
Operating expenses.............. 106,668 6,991 891 114,550 (173) 114,377Operating profit (loss)..... 6,805 (1,385) 31 5,451 64 5,515
Assets .................................. ¥ 50,581 ¥3,093 ¥1,191 ¥ 54,865 ¥(2,581) ¥ 52,284
Thousands of U.S. Dollars
2002Unallocated &
Japan Europe Other regions Total eliminations Consolidated
Outside customers ............... $844,608 $41,728 $6,052 $892,388 $ – $892,388Intersegment ........................ – – 811 811 (811) –
Operating revenue ......... 844,608 41,728 6,863 893,199 (811) 892,388
Operating expenses.............. 793,958 52,037 6,633 852,628 (1,286) 851,342Operating profit (loss)..... 50,650 (10,309) 230 40,571 475 41,046
Assets .................................. $376,488 $23,022 $8,865 $408,375 $(19,210) $389,165
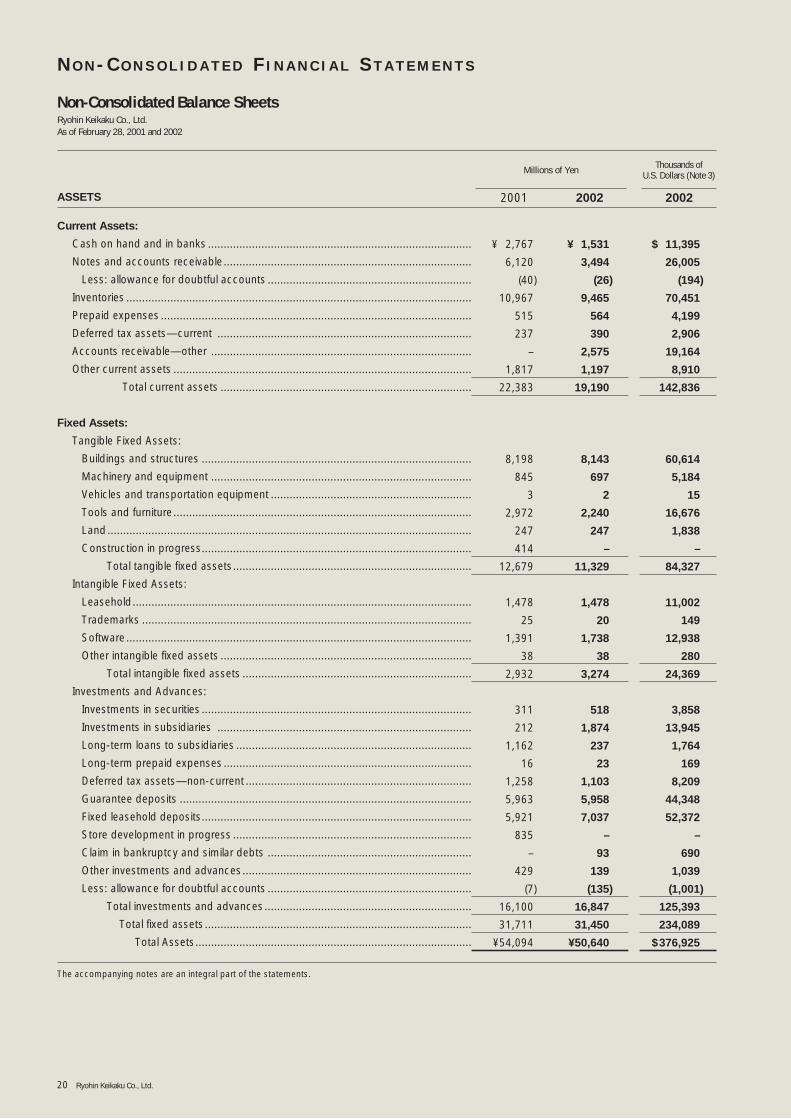
20 Ryohin Keikaku Co., Ltd.
Current Assets:
Cash on hand and in banks ....................................................................................
Notes and accounts receivable...............................................................................
Less: allowance for doubtful accounts .................................................................
Inventories ..............................................................................................................
Prepaid expenses ...................................................................................................
Deferred tax assets—current .................................................................................
Accounts receivable—other ...................................................................................
Other current assets ...............................................................................................
Total current assets ................................................................................
Fixed Assets:
Tangible Fixed Assets:
Buildings and structures ......................................................................................
Machinery and equipment ...................................................................................
Vehicles and transportation equipment ................................................................
Tools and furniture...............................................................................................
Land....................................................................................................................
Construction in progress......................................................................................
Total tangible fixed assets............................................................................
Intangible Fixed Assets:
Leasehold............................................................................................................
Trademarks .........................................................................................................
Software ..............................................................................................................
Other intangible fixed assets ................................................................................
Total intangible fixed assets .........................................................................
Investments and Advances:
Investments in securities ......................................................................................
Investments in subsidiaries .................................................................................
Long-term loans to subsidiaries ...........................................................................
Long-term prepaid expenses ...............................................................................
Deferred tax assets—non-current ........................................................................
Guarantee deposits .............................................................................................
Fixed leasehold deposits......................................................................................
Store development in progress ............................................................................
Claim in bankruptcy and similar debts .................................................................
Other investments and advances.........................................................................
Less: allowance for doubtful accounts .................................................................
Total investments and advances..................................................................
Total fixed assets.....................................................................................
Total Assets........................................................................................
2002
Thousands of U.S. Dollars (Note 3)
20022001ASSETS
Millions of Yen
¥ 2,767
6,120
(40)
10,967
515
237
–
1,817
22,383
8,198
845
3
2,972
247
414
12,679
1,478
25
1,391
38
2,932
311
212
1,162
16
1,258
5,963
5,921
835
–
429
(7)
16,100
31,711
¥54,094
¥ 1,531
3,494
(26)
9,465
564
390
2,575
1,197
19,190
8,143
697
2
2,240
247
–
11,329
1,478
20
1,738
38
3,274
518
1,874
237
23
1,103
5,958
7,037
–
93
139
(135)
16,847
31,450
¥50,640
$ 11,395
26,005
(194)
70,451
4,199
2,906
19,164
8,910
142,836
60,614
5,184
15
16,676
1,838
–
84,327
11,002
149
12,938
280
24,369
3,858
13,945
1,764
169
8,209
44,348
52,372
–
690
1,039
(1,001)
125,393
234,089
$376,925
The accompanying notes are an integral part of the statements.
Ryohin Keikaku Co., Ltd.As of February 28, 2001 and 2002
N O N - C O N S O L I D A T E D F I N A N C I A L S T A T E M E N T S
Non-Consolidated Balance Sheets
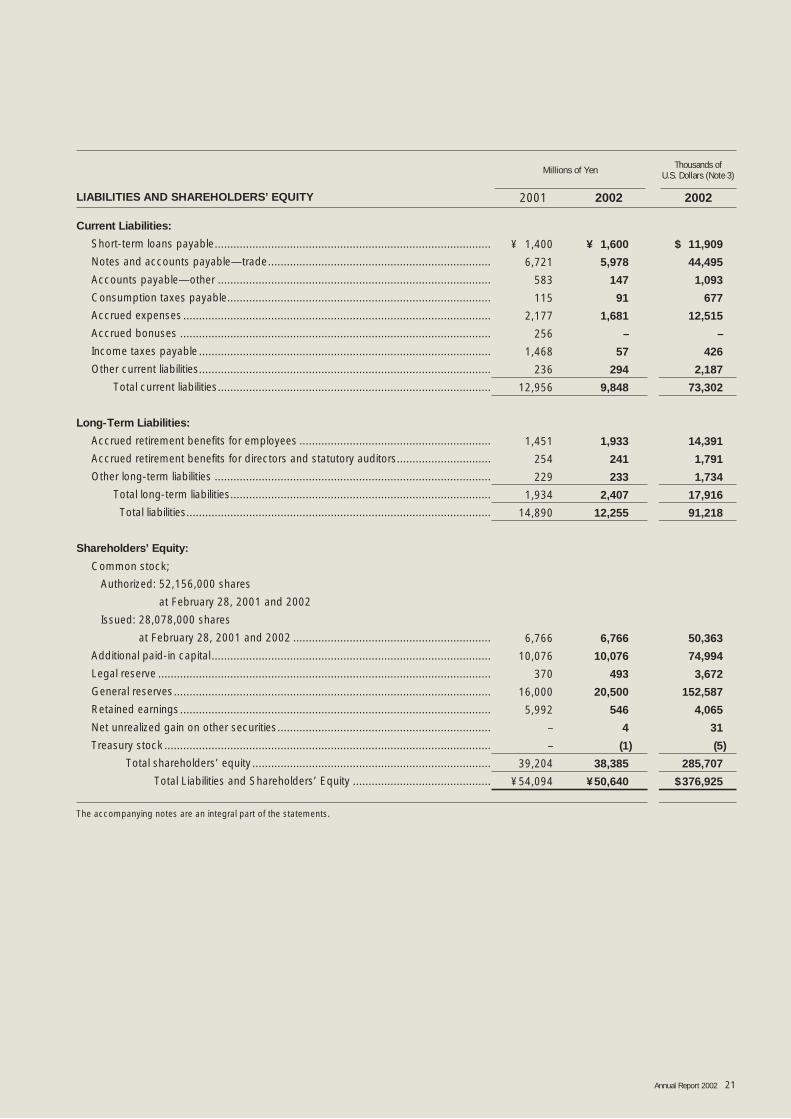
Annual Report 2002 21
Thousands of U.S. Dollars (Note 3)Millions of Yen
Current Liabilities:
Short-term loans payable........................................................................................
Notes and accounts payable—trade.......................................................................
Accounts payable—other .......................................................................................
Consumption taxes payable....................................................................................
Accrued expenses ..................................................................................................
Accrued bonuses ...................................................................................................
Income taxes payable .............................................................................................
Other current liabilities.............................................................................................
Total current liabilities.......................................................................................
Long-Term Liabilities:
Accrued retirement benefits for employees .............................................................
Accrued retirement benefits for directors and statutory auditors..............................
Other long-term liabilities ........................................................................................
Total long-term liabilities...................................................................................
Total liabilities.................................................................................................
Shareholders’ Equity:
Common stock;
Authorized: 52,156,000 shares
at February 28, 2001 and 2002
Issued: 28,078,000 shares
at February 28, 2001 and 2002 ...............................................................
Additional paid-in capital .........................................................................................
Legal reserve ..........................................................................................................
General reserves.....................................................................................................
Retained earnings...................................................................................................
Net unrealized gain on other securities....................................................................
Treasury stock ........................................................................................................
Total shareholders’ equity ............................................................................
Total Liabilities and Shareholders’ Equity ............................................
200220022001LIABILITIES AND SHAREHOLDERS’ EQUITY
¥ 1,400
6,721
583
115
2,177
256
1,468
236
12,956
1,451
254
229
1,934
14,890
6,766
10,076
370
16,000
5,992
–
–
39,204
¥54,094
¥ 1,600
5,978
147
91
1,681
–
57
294
9,848
1,933
241
233
2,407
12,255
6,766
10,076
493
20,500
546
4
(1)
38,385
¥50,640
$ 11,909
44,495
1,093
677
12,515
–
426
2,187
73,302
14,391
1,791
1,734
17,916
91,218
50,363
74,994
3,672
152,587
4,065
31
(5)
285,707
$376,925
The accompanying notes are an integral part of the statements.
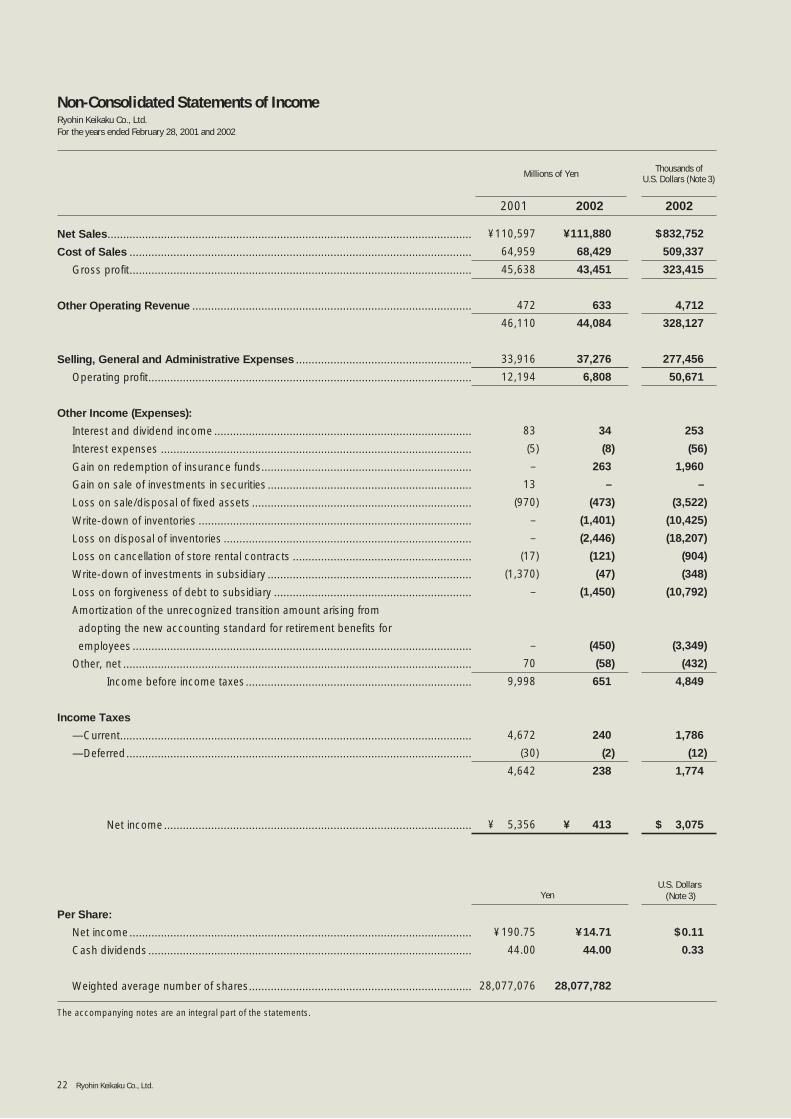
22 Ryohin Keikaku Co., Ltd.
Net Sales....................................................................................................................
Cost of Sales .............................................................................................................
Gross profit.............................................................................................................
Other Operating Revenue .........................................................................................
Selling, General and Administrative Expenses ........................................................
Operating profit.......................................................................................................
Other Income (Expenses):
Interest and dividend income ..................................................................................
Interest expenses ...................................................................................................
Gain on redemption of insurance funds...................................................................
Gain on sale of investments in securities .................................................................
Loss on sale/disposal of fixed assets ......................................................................
Write-down of inventories .......................................................................................
Loss on disposal of inventories ...............................................................................
Loss on cancellation of store rental contracts .........................................................
Write-down of investments in subsidiary .................................................................
Loss on forgiveness of debt to subsidiary ...............................................................
Amortization of the unrecognized transition amount arising from
adopting the new accounting standard for retirement benefits for
employees ............................................................................................................
Other, net ...............................................................................................................
Income before income taxes........................................................................
Income Taxes
—Current................................................................................................................
—Deferred..............................................................................................................
Net income..................................................................................................
Per Share:
Net income.............................................................................................................
Cash dividends .......................................................................................................
Weighted average number of shares.......................................................................
200220022001
¥110,597
64,959
45,638
472
46,110
33,916
12,194
83
(5)
–
13
(970)
–
–
(17)
(1,370)
–
–
70
9,998
4,672
(30)
4,642
¥ 5,356
¥190.75
44.00
28,077,076
¥111,880
68,429
43,451
633
44,084
37,276
6,808
34
(8)
263
–
(473)
(1,401)
(2,446)
(121)
(47)
(1,450)
(450)
(58)
651
240
(2)
238
¥ 413
¥14.71
44.00
28,077,782
$832,752
509,337
323,415
4,712
328,127
277,456
50,671
253
(56)
1,960
–
(3,522)
(10,425)
(18,207)
(904)
(348)
(10,792)
(3,349)
(432)
4,849
1,786
(12)
1,774
$ 3,075
$0.11
0.33
Thousands of U.S. Dollars (Note 3)Millions of Yen
YenU.S. Dollars
(Note 3)
The accompanying notes are an integral part of the statements.
Ryohin Keikaku Co., Ltd.For the years ended February 28, 2001 and 2002
Non-Consolidated Statements of Income

Annual Report 2002 23
Millions of Yen
Net Number of Additional unrealizedshares of Common paid-in Legal General Retained gain on other Treasury
common stock stock capital reserve reserves earnings securities stock
Balance at February 29, 2000 .......................................
Net income for the year ended February 28, 2001 ......
Cash dividends ...........................................................
Transfer to legal reserve ..............................................
Directors’ and corporate auditors’ bonuses ................
Transfer to general reserves ........................................
Balance at February 28, 2001 .......................................
Net income for the year ended February 28, 2002 ......
Cash dividends ...........................................................
Transfer to legal reserve ..............................................
Directors’ and corporate auditors’ bonuses ................
Transfer to general reserves ........................................
Increase in net unrealized gain on other securities.......
Net increase in treasury stock .....................................
Balance at February 28, 2002 .......................................
Thousands of U.S. Dollars (Note 3)
Net Additional unrealized
Common paid-in Legal General Retained gain on other Treasurystock capital reserve reserves earnings securities stock
Balance at February 28, 2001 .........................................
Net income for the year ended February 28, 2002 ........
Cash dividends .............................................................
Transfer to legal reserve................................................
Directors’ and corporate auditors’ bonuses ..................
Transfer to general reserves..........................................
Increase in net unrealized gain on other securities.........
Net increase in treasury stock.......................................
Balance at February 28, 2002 .........................................
The accompanying notes are an integral part of the statements.
¥11,000
–
–
–
–
5,000
16,000
–
–
–
–
4,500
–
–
¥21,500
$119,092
–
–
–
–
33,495
–
–
$152,587
¥ –
–
–
–
–
–
–
–
–
–
–
–
–
(1)
¥ (1)
$ –
–
–
–
–
–
–
(5)
$ (5)
28,078,000
–
–
–
–
–
28,078,000
–
–
–
–
–
–
–
28,078,000
¥6,766
–
–
–
–
–
6,766
–
–
–
–
–
–
–
¥6,766
$50,363
–
–
–
–
–
–
–
$50,363
¥10,076
–
–
–
–
–
10,076
–
–
–
–
–
–
–
¥10,076
$74,994
–
–
–
–
–
–
–
$74,994
¥ –
–
–
–
–
–
–
–
–
–
–
–
4
–
¥ 4
$ –
–
–
–
–
–
31
–
$ 31
¥248
–
–
122
–
–
370
–
–
123
–
–
–
–
¥493
$2,751
–
–
921
–
–
–
–
$3,672
¥6,967
5,356
(1,179)
(122)
(30)
(5,000)
5,992
413
(1,235)
(123)
–
(4,500)
–
–
¥ 546
$44,601
3,075
(9,195)
(921)
–
(33,495)
–
–
$ 4,065
Ryohin Keikaku Co., Ltd. For the years ended February 28, 2001 and 2002
Non-Consolidated Statements of Shareholders’ Equity
24 Ryohin Keikaku Co., Ltd.
1. Basis of Presenting the Non-Consolidated FinancialStatements
The accompanying non-consolidated financial statements havebeen prepared from accounts and records maintained by RyohinKeikaku Co., Ltd. (the “Company”) in accordance with the provi-sions set forth in the Japanese Commercial Code and in conformitywith accounting principles and practices generally accepted inJapan, which are different in certain respects as to application anddisclosure requirements of International Accounting Standards.
Certain items presented in the non-consolidated financial state-ments filed with the Financial Service Agency in Japan have beenreclassified for the convenience of readers outside Japan.
The non-consolidated financial statements are not intended to pre-sent the non-consolidated financial position and results of opera-tions in accordance with accounting principles and practices gener-ally accepted in countries and jurisdictions other than Japan.
2. Accounting Principles
Accounting principles and practices employed by the Company inpreparing the accompanying non-consolidated financial statements,which have significant effects thereon, are explained in Note 2 of theNotes to the Consolidated Financial Statements. Therefore, theaccompanying non-consolidated financial statements should beread in conjunction with such notes.
3. United States Dollar Amounts
The Company maintains its accounting records in yen. The dollaramounts included in the non-consolidated financial statements andnotes thereto represent the arithmetical results of translating yen todollars on a basis of ¥134.35=U.S. $1. The inclusion of such dollaramounts is solely for convenience and is not intended to imply thatyen amounts have been or could be readily converted, realized orsettled in dollars at ¥134.35=U.S. $1 or at any other rate.
The Board of Directors
Ryohin Keikaku Co., Ltd.
We have audited the accompanying consolidated balance sheets of Ryohin Keikaku Co., Ltd. (hereinafter referred to as
the “Company”) and its consolidated subsidiaries as of February 28, 2002 and 2001, and the related consolidated state-
ments of income, shareholders’ equity, and cash flows for the years then ended, all expressed in Japanese yen. Our
audits were made in accordance with auditing standards, procedures and practices generally accepted and applied in
Japan and, accordingly, included such tests of the accounting records and such other auditing procedures as we con-
sidered necessary in the circumstances.
In our opinion, the consolidated financial statements referred to above present fairly the consolidated financial posi-
tion of Ryohin Keikaku Co., Ltd. and its consolidated subsidiaries as of February 28, 2002 and 2001, and the consoli-
dated results of their operations and their cash flows for the years then ended in conformity with accounting principles
and practices generally accepted in Japan (see Note 1) applied on a consistent basis.
As described in Note 2., effective from the year ended February 28, 2002, the Company has adopted new Japanese
accounting standards for recognition of retirement benefits for employees, financial instruments and foreign currency-
denominated transactions.
The amounts expressed in U.S. dollars, which are provided solely for the convenience of the reader, have been trans-
lated on the basis set forth in Note 3 to the accompanying consolidated financial statements.
ChuoAoyama Audit Corporation
Tokyo, Japan
May 23, 2002
Ryohin Keikaku Co., Ltd.
N O T E S T O T H E N O N - C O N S O L I D A T E D F I N A N C I A L S T A T E M E N T S
R E P O R T O F T H E I N D E P E N D E N T C E R T I F I E D P U B L I C A C C O U N T A N T SO N T H E C O N S O L I D A T E D F I N A N C I A L S T A T E M E N T S
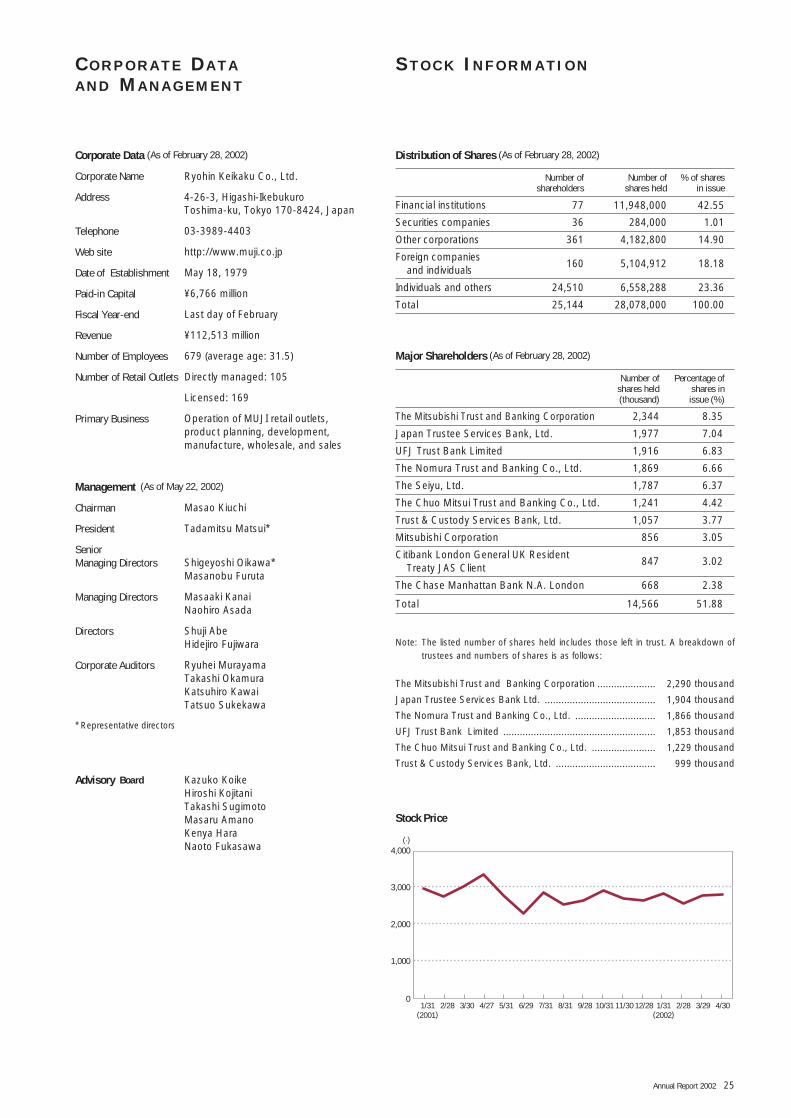
Annual Report 2002 25
0
2,000
1,000
3,000
4,000
1/31 2/28 3/30 4/27 5/31 7/31 9/28 11/30 1/31 2/28 3/29 4/3010/318/31 12/286/29
(·)
(2001) (2002)
Distribution of Shares (As of February 28, 2002)
Number of Number of % of sharesshareholders shares held in issue
Financial institutions 77 11,948,000 42.55
Securities companies 36 284,000 1.01
Other corporations 361 4,182,800 14.90
Foreign companies and individuals
160 5,104,912 18.18
Individuals and others 24,510 6,558,288 23.36
Total 25,144 28,078,000 100.00
Major Shareholders (As of February 28, 2002)
Number of Percentage ofshares held shares in (thousand) issue (%)
The Mitsubishi Trust and Banking Corporation 2,344 8.35
Japan Trustee Services Bank, Ltd. 1,977 7.04
UFJ Trust Bank Limited 1,916 6.83
The Nomura Trust and Banking Co., Ltd. 1,869 6.66
The Seiyu, Ltd. 1,787 6.37
The Chuo Mitsui Trust and Banking Co., Ltd. 1,241 4.42
Trust & Custody Services Bank, Ltd. 1,057 3.77
Mitsubishi Corporation 856 3.05
Citibank London General UK Resident Treaty JAS Client
847 3.02
The Chase Manhattan Bank N.A. London 668 2.38
Total 14,566 51.88
Corporate Data (As of February 28, 2002)
Corporate Name Ryohin Keikaku Co., Ltd.
Address 4-26-3, Higashi-Ikebukuro Toshima-ku, Tokyo 170-8424, Japan
Telephone 03-3989-4403
Web site http://www.muji.co.jp
Date of Establishment May 18, 1979
Paid-in Capital ¥6,766 million
Fiscal Year-end Last day of February
Revenue ¥112,513 million
Number of Employees 679 (average age: 31.5)
Number of Retail Outlets Directly managed: 105
Licensed: 169
Primary Business Operation of MUJI retail outlets,product planning, development,manufacture, wholesale, and sales
Management (As of May 22, 2002)
Chairman Masao Kiuchi
President Tadamitsu Matsui*
Senior Managing Directors Shigeyoshi Oikawa*
Masanobu Furuta
Managing Directors Masaaki KanaiNaohiro Asada
Directors Shuji AbeHidejiro Fujiwara
Corporate Auditors Ryuhei MurayamaTakashi OkamuraKatsuhiro KawaiTatsuo Sukekawa
* Representative directors
Advisory Board Kazuko KoikeHiroshi KojitaniTakashi SugimotoMasaru AmanoKenya HaraNaoto Fukasawa
Note: The listed number of shares held includes those left in trust. A breakdown oftrustees and numbers of shares is as follows:
The Mitsubishi Trust and Banking Corporation ..................... 2,290 thousand
Japan Trustee Services Bank Ltd. ........................................ 1,904 thousand
The Nomura Trust and Banking Co., Ltd. ............................. 1,866 thousand
UFJ Trust Bank Limited ....................................................... 1,853 thousand
The Chuo Mitsui Trust and Banking Co., Ltd. ....................... 1,229 thousand
Trust & Custody Services Bank, Ltd. .................................... 999 thousand
Stock Price
C O R P O R A T E D A T AA N D M A N A G E M E N T
S T O C K I N F O R M A T I O N
Printed in Japan
Ryohin Keikaku Co., Ltd.4-26-3, Higashi-Ikebukuro
Toshima-ku, Tokyo 170-8424, Japan