A newsletter following global environmental issues ...
8
A newsletter following global environmental issues alongside the cycle of the seasons in Southern England Prime Meridian (31) September 30, 2014 Arctic sea ice: summer minimum low, but not record-breaking. An Arctic polar cap of floating sea ice is an all-year-round feature of our planet, but there is a well-established long-term trend for summer's remnant ice cap to become ever smaller. This has fuelled speculation about the date at which the ice cap will essentially vanish during the summer. Should this happen, the Arctic Ocean will absorb more heat from the Sun and that could have a significant impact on global climate and weather patterns. Concerns have been raised that this might be a tipping point where climate would jump into a different state (see PM 26, May, 2014), with major impacts on human communities. 2014, however, was not to be the year that climate took this leap into the unknown. Nor, despite being amongst the lowest ever minima (it rated 6 th ), was there record-breaking ice loss. Top: Arctic ice floes photographed in early September 2014 during NASA's ARISE programme. Left: An image of the Greenland Sea taken on August 18, 2014, by NASA's Aqua satellite using its Moderate Resolution Imaging Spectroradiometer (MODIS). It is centred at about 77.5 o N, 9 o W. The MODIS website quoted Walt Meier of NASA’s Goddard Space Flight Center: “ Ice usually extends quite a bit further south in this region because the currents push older, thicker ice out from the Arctic. Even in the warmer, more southern region, it takes a while for that ice to melt. We’ve seen a few years recently with very little ice in the Greenland Sea. Thinner ice may be one factor, but it seems like the biggest issue is that winds have been blowing perpendicular to Fram Strait and limiting the amount of ice exiting the Arctic Ocean.” Global climate: August 2014 was the hottest on record – page 8
Transcript of A newsletter following global environmental issues ...

A newsletter following global environmental issues alongside the cycle of the seasons in Southern England
Prime Meridian (31) September 30, 2014
Arctic sea ice: summer minimum low, but not record-breaking.
An Arctic polar cap of floating sea ice is an all-year-round feature of our planet, but there is a well-established long-term trend for summer's remnant ice cap to become ever smaller. This has fuelled speculation about the date at which the ice cap will essentially vanish during the summer. Should this happen, the Arctic Ocean will absorb more heat from the Sun and that could have a significant impact on global climate and weather patterns. Concerns have been raised that this might be a tipping point where climate would jump into a different state (see PM 26, May, 2014), with major impacts on human communities. 2014, however, was not to be the year that climate took this leap into the unknown. Nor, despite being amongst the lowest ever minima (it rated 6th), was there record-breaking ice loss.
Top: Arctic ice floes photographed in early September 2014 during NASA's ARISE programme. Left: An image of the Greenland Sea taken on August 18, 2014, by NASA's Aqua satellite using its Moderate Resolution Imaging Spectroradiometer (MODIS). It is centred at about 77.5o N, 9o W.
The MODIS website quoted Walt Meier of NASA’s Goddard Space Flight Center: “Ice usually extends quite a bit further south in this region because the currents push older, thicker ice out from the Arctic. Even in the warmer, more southern region, it takes a while for that ice to melt. We’ve seen a few years recently with very little ice in the Greenland Sea. Thinner ice may be one factor, but it seems like the biggest issue is that winds have been blowing perpendicular to Fram Strait and limiting the amount of ice exiting the Arctic Ocean.”
Global climate: August 2014 was the hottest on record – page 8

Sea ice reached its minimum extent in on September 17, when it covered 5.02 million km2. According to the U.S.A.'s National Snow and Ice Data Center: “as in 2013, a large area in the East Siberian Sea remains ice covered, helping to keep the overall extent higher for this time of year than observed since 2007. Last summer that area was covered by first-year ice that did not melt out under cooler-than-average conditions. This year, a region of second-year ice appears to have helped stabilize ice loss there.” At the record 2012 minimum, sea ice extent was a mere 3.41 million km2.
Ice extent is the area over which ice coverage exceeds 15%. The effective disappearance of sea ice would be taken as de facto when its extent shrinks below one million square kilometres.
NASA's ARISE (Arctic Radiation - IceBridge Sea and Ice Experiment) research campaign is using a C-130 aircraft to make detailed studies of Arctic land and sea ice, clouds and climate. ARISE helps to fill in gaps in satellite coverage. When observations made from the aircraft coincide with those made by existing satellites which are passing overhead there is an opportunity to calibrate the accuracy of satellite measurements. Image: NASA.
The Sun at the autumn equinox, September 23, 2014.
By the date of the equinox, sea ice was already spreading again in the Arctic. Meanwhile, Southern England was enjoying sunshine and warm spells. Below left: Not long after solar noon, the Sun shines through the leaves of an English oak in South London.
Below right: Labelled Stellarium image showing the Sun and planets against the backdrop of constellations. As the Earth moves around the Sun during the year, the Sun follows a path (the ecliptic, in red), corresponding to the plane of our orbit. which corresponds to the plane of the Earth's orbit. Safety tip: Do not look directly at the Sun through a camera, telescope or binoculars.

Equinox Sun rises at South Pole.
Amundsen-Scott station is located at the South Pole, where the Sun is below the horizon for half a year and above it for the other half. It sits on the ice at an altitude of 2.835 km above sea level. The top picture from the South Pole web cam shows the ice cap in the brightening polar twilight on Sept.3. The scene had lightened noticeably by Sept. 22. The picture taken on Sept. 23, the day of Antarctica's spring equinox, was obscured by poor visibility. The bottom picture, however, taken on Sept. 25, shows direct sunlight finally catching the buildings.
Antarctic sea ice: record extent.
Whilst the summer sea ice in the Arctic following a long-term overall trend for shrinking, that surrounding the continent of Antarctica is expanding. This appears to be related to changing weather patterns. The maximum appears to have been reached on Sept. 19, near the end of the long polar night. At over 20 million km2, this was a record-breaking maximum, with ice extent exceeding the average in most areas around the continent, with particularly high ice concentrations in the northern Ross Sea and Indian Ocean sectors. Dates of the Arctic sea ice minimum and Antarctic maximum may yet be adjusted, depending on how ice distribution responds to weather.
2002 catastrophic collapse of Larsen B ice shelf attributed to global warming.
This is the conclusion of a study published in Science on September 12, 2014.
The dramatic 2002 event provided a graphic illustration of our changing climate and it grabbed the attention of scientists and environmentalists world wide. Until recent decades, three ice shelves, Larsen A, B and C, existed in embayments along the coast of the Antarctic Peninsula, facing the Weddell Sea. Larsen A disintegrated, with the loss of 1,500 km2 of ice. in January 1995, and in 2002, after a period of retreat, Larsen B finally underwent rapid collapse between January 31 and March 7, when an area of 3,250 km2 (similar to Rhode Island) broke up, leaving only a small remnant. Larsen C continues intact, but further to the SW along the Peninsula, the Wilkins Ice Shelf broke up between February, 2008 and April, 2009.

Understanding the ice shelf collapse.
The sequence of images left was obtained by the MODIS instrument aboard NASA's TERRA satellite. They document the rapid destruction of the Larson B ice shelf in 2002. In the top picture (Jan. 31, 2002) we see ponds of surface melt water aligned along parallel fissures crossing the ice shelf. Surface warming had produced a significant amount of melt-water on the ice and according to a team of researchers from the University of Chicago and Princeton (Alison Banwell et al., 2013) chaotic stresses caused by the draining of melt water from a single lake may have started a chain reaction leading to the break up of the ice shelf. This led to the draining of all of the lakes and satellite images taken immediately before the destruction of the ice sheet show them as empty. It is not clear what caused the first lake to drain. One possibility is that warmer water under the ice shelf caused thinning. The middle picture shows the state of break up on February 23, 2002 and in the lower picture, taken on April 13 (southern autumn) we see the space once occupied by the ice shelf now invaded by floating sea ice. Once the ice shelf had broken up, glaciers behind it, that used to feed into it, such as the Crane and Hektoria Glaciers, sped up bringing ice down to the sea at a faster rate (Rignot et al., 2004; Scambos et al., 2004; Skvarca et al., 2005).
The disappearance of the ice shelf also allowed scientists to study the sea floor and look for evidence that would cast light on its past history. The implications were explored in the new study by Michele Rebesco of Italy's Istituto Nazionale di Oceanografia e di Geofisica Sperimentale and 11 co-workers from institutions around the world. Of particular interest was the identification of former grounding zones, junctions between the floating part of the ice shelf and the part resting on bedrock. Geophysical data revealed a complex grounding area in front of Crane Fjord and radiometric dating of sediment cores showed that the ice shelf had not grounded here for the last 12,300 to 11,700 years. This may be related to the rise in sea level at the end of the last ice age and the retreat of ice sheets.
During the present interglacial, the Holocene, the Crane Glacier grounded within its fjord and retreated further only after 2002. According to Rebesco and colleagues (p. 1354): “This implies that the 2002 Larsen-B Ice Shelf collapse likely was a response to surface warming rather than to grounding zone instability, strengthening the idea that surface processes controlled the disintegration of the Larsen Ice Shelf.”
References: Banwell, A. et al. (2013). Geophysics Research Letters 40:, 5872-5876. DOI: 10.1002/2013GLO57694. Rebesco, M. et al. (2014). Science 345: 1354-1358. Rignot, E. et al. (2004). Geophys. Res. Lett. 31: L18401. Scambos, T. A. et al. (2004). Geophys. Res. Lett. 31: L18402. Skvarca, P. et al. (2005). Ann. Glaciol. 39: 557–562.

September 7, 2014. In a deep and shady hollow in Sydenham Hill Wood, South London, a robin (Erithacus rubecula) curious about a group of walkers, perches on a wood pile habitat where glistening ink cap fungus (Coprinellus micaceus) is flourishing (taken with flash). The site is managed by the London Wildlife Trust.
How badly drafted legislation could lead to “irreversible biodiversity loss” for British wildlife. Concerns that powers to control or eradicate invasive, non-native species in a proposed Infrastructure Bill for England and Wales could harm rather than protect biodiversity in the UK were aired in correspondence to Nature for August 21, 2014 (Nature 512: 253). The letter, signed by Sarah Durant of the Institute of Zoology, London, UK (full list of 24 correspondents from go.nature.com/9eembe) emphasised problems surrounding the definition of a non-native species. This, it was argued, “needs careful definition to ensure that any use of these powers is beneficial for conservation.” The definition is presently a species that is “not ordinarily resident in, or a regular visitor to, Great Britain,” which would include a native species which has become extinct, species which may be appropriate under changed future climate and species listed in Schedule 9 of the Wildlife and Countryside Act. The latter contains “native species, including some that have been reintroduced into the wild, such as the barn owl (Tyto alba), capercaillie (Tetrao urogallus), chough (Pyrrhocorax pyrrhocorax) and red kite (Milvus milvus).”
A potential problem foreseen in the letter was that any species classified as non-native might then be treated as invasive. Re-introductions to restore lost biodiversity may be prevented. “Proposed amendments to address these problems have been rejected. If the bill is passed in its present form, it could lead to an irreversible loss of native biodiversity.”
To be continued in future issues.
Prime Meridian is published as part the outreach programme of the Ecospheres Project – Earth Campaign.
The purpose of the Earth Campaign is to highlight the vital importance of scientific research for safeguarding human communities world wide from the impacts of environmental change.
This newsletter may be copied and distributed freely by any organisation engaged in raising awareness of environmental issues or for general educational purposes.
Email: [email protected] Website: http://www.ecospheresproject.wordpress.com/

Seasons in South East England
August, 2014
Above: August 23. Ruins of the Norman Castle at Eysnford, Kent surrounded by fields. Left: August 11. Plums and raspberries ripen on the hill side Rosendale allotments, South London.
Sunnier than average, but cool and wet. For the UK as a whole, this was the coolest August since 1993 (mean temperature of 13.9oC; 1.0oC below the average for the period 1981-2010). There was 156% rain and 107% the average hours of sunshine. During the first week, the SE was mostly spared showers which arrived in other parts of England. On Aug. 7, St James Park, central London saw the UK's maximum temperature of 27.2oC. East Anglia saw isolated showers in the afternoon. Heavy showers caused local flooding in Cambridgeshire on Aug. 8. By Aug. 10, the region was affected by the remains of Hurricane Bertha, accompanied by winds exceeding 80 km per hour in some eastern areas and 102 km per hour at the Needles Old Battery (Isle of Wight).
A depression noted near the Cape Verde Islands on July 26 qualified as Tropical Storm Bertha by Aug. 1. It swept across the Lesser Antilles, becoming a weak hurricane by the time that it had reached the Bahamas on Aug. 4 (below, left), when its winds reached their maximum strength at 130 km power hour. Bertha travelled N and then NE. On Aug. 6, it merged with a trough and arrived at the UK four days later. Below right: Bertha having reached the North Sea on Aug. 11, 2014.

The UK's Met Office News Blog reported that: “The heaviest rainfall overnight was recorded at Balatasound in Shetland where 48.8mm of rain was recorded as a previous low pressure system moved away from the UK, while Bute Park in Cardiff saw 40.6mm as the remnants of ex-hurricane Bertha move in from the southwest.” However, “The highest hourly total was 18.4mm at Wisley in Surrey between 9 and 10am this morning and Coventry in the West Midlands seeing 18.2mm in the same time.”
On Aug.11, the heaviest rainfall occurred in southern England. The Met Office reported that stormy weather associated with ex-Hurricane Bertha “established the theme for a generally unsettled and wet month for many. A northerly flow resulted in some particularly cool nights from the 20th. The late August bank holiday on the 25th saw some high rainfall totals across the south of England.” On August 24, parts of Dorset in SW England experienced temperatures as low as 3oC. On August 25, 35 mm of rain was received over London and Kent, rain persisting on August 26. August 25 saw the UK's lowest temperature of -2.1oC at Braemar in Aberdeenshire.
SE and central S England, mean max. temp.: 20.5oC (-1.3oC); mean min. temp.: 11.2oC (-0.9oC). Hours of sunshine: 198.9 (98%). Rain: 102.8 mm (179%). Anomalies re. 1981-2010 norm in brackets. Source for weather summaries: Met Office online reports.
Top: Honeybee and comma butterfly on burdock in field margin, West Kingsdown, Kent. Aug. 23. Top right: caterpillar of poplar hawk moth (Laothoe populi), Aug. 10. Middle right: A harvested field beside St Paul's and St Peter's Church, Ash, Kent. Aug. 16, 2014. Bottom right: Cornflowers (Centaurea cyanus) growing in wild flower area in Brockwell Park, South London. Aug. 17. Below: Brockwell Park, South London Aug. 17.
An August 27 article in the Farmers Weekly (Olivier Cooper) reported a farmer from Aldington in Kent as saying “It’s been very frustrating – we started harvest on 2 July and will still be harvesting on 2 September; it’s just been very stop-start”. He reported, notwithstanding, that wheat yields on his fields had been encouraging. Claire winter wheat had produced 10.4 tonnes per hectare and Hereward had produced 8.6 tonnes per hectare. Although harvesting of had been hit by wet weather, the UK's yield was about 20% about the average for the last half decade and might amount to 17 million tonnes, with an exportable surplus of 3 million tonnes.
Left: Weather over the UK at 13:20 GMT on Aug. 10 from the NOAA-19 satellite. Courtesy Geoff Hamilton. Skies over London on Aug. 11. View from Rosendale Allotments. On Aug. 9, scentless mayweed (Tripleurospermum inodorum) and poppy (Papaver rhoeas) along field margin near West Kingsdown. On Aug. 17: Ornamental garden, Brockwell Park, London. Below: Aug. 25: A downpour of rain in Kent.
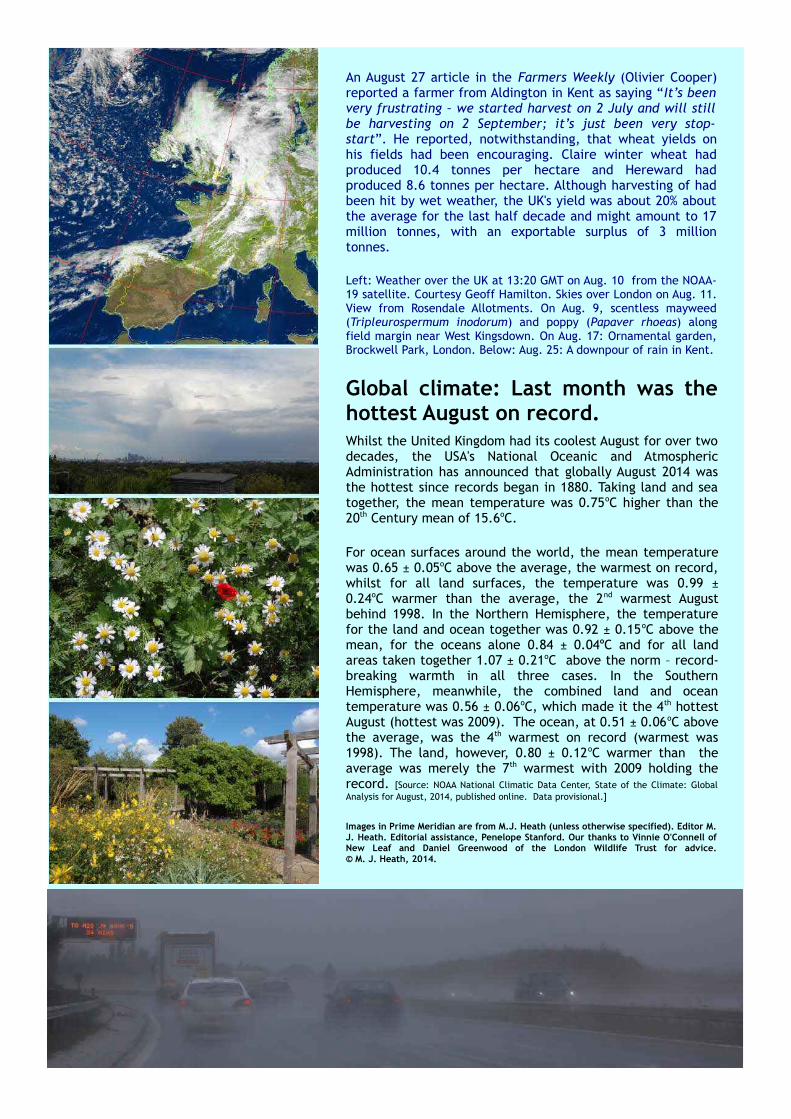
Global climate: Last month was the hottest August on record. Whilst the United Kingdom had its coolest August for over two decades, the USA's National Oceanic and Atmospheric Administration has announced that globally August 2014 was the hottest since records began in 1880. Taking land and sea together, the mean temperature was 0.75oC higher than the 20th Century mean of 15.6oC.
For ocean surfaces around the world, the mean temperature was 0.65 ± 0.05oC above the average, the warmest on record, whilst for all land surfaces, the temperature was 0.99 ± 0.24oC warmer than the average, the 2nd warmest August behind 1998. In the Northern Hemisphere, the temperature for the land and ocean together was 0.92 ± 0.15oC above the mean, for the oceans alone 0.84 ± 0.04oC and for all land areas taken together 1.07 ± 0.21oC above the norm – record-breaking warmth in all three cases. In the Southern Hemisphere, meanwhile, the combined land and ocean temperature was 0.56 ± 0.06oC, which made it the 4th hottest August (hottest was 2009). The ocean, at 0.51 ± 0.06oC above the average, was the 4th warmest on record (warmest was 1998). The land, however, 0.80 ± 0.12oC warmer than the average was merely the 7th warmest with 2009 holding the record. [Source: NOAA National Climatic Data Center, State of the Climate: Global Analysis for August, 2014, published online. Data provisional.]
Images in Prime Meridian are from M.J. Heath (unless otherwise specified). Editor M. J. Heath. Editorial assistance, Penelope Stanford. Our thanks to Vinnie O'Connell of New Leaf and Daniel Greenwood of the London Wildlife Trust for advice. © M. J. Heath, 2014.