
A New Thermodynamic Model for Paraffin Precipitation in Highly ... · 1 A New Thermodynamic Model...
40
Heriot-Watt University Research Gateway Heriot-Watt University A New Thermodynamic Model for Paraffin Precipitation in Highly Asymmetric Systems at High Pressure Conditions Ameri Mahabadian, Mohammadreza; Chapoy, Antonin; Tohidi Kalorazi, Bahman Published in: Industrial and Engineering Chemistry Research DOI: 10.1021/acs.iecr.6b02804 Publication date: 2016 Document Version Peer reviewed version Link to publication in Heriot-Watt University Research Portal Citation for published version (APA): Ameri Mahabadian, M., Chapoy, A., & Tohidi Kalorazi, B. (2016). A New Thermodynamic Model for Paraffin Precipitation in Highly Asymmetric Systems at High Pressure Conditions. Industrial and Engineering Chemistry Research, 55(38), 10208–10217. DOI: 10.1021/acs.iecr.6b02804 General rights Copyright and moral rights for the publications made accessible in the public portal are retained by the authors and/or other copyright owners and it is a condition of accessing publications that users recognise and abide by the legal requirements associated with these rights. If you believe that this document breaches copyright please contact us providing details, and we will remove access to the work immediately and investigate your claim.
Transcript of A New Thermodynamic Model for Paraffin Precipitation in Highly ... · 1 A New Thermodynamic Model...

Heriot-Watt University Research Gateway
Heriot-Watt University
A New Thermodynamic Model for Paraffin Precipitation in Highly Asymmetric Systems at HighPressure ConditionsAmeri Mahabadian, Mohammadreza; Chapoy, Antonin; Tohidi Kalorazi, Bahman
Published in:Industrial and Engineering Chemistry Research
DOI:10.1021/acs.iecr.6b02804
Publication date:2016
Document VersionPeer reviewed version
Link to publication in Heriot-Watt University Research Portal
Citation for published version (APA):Ameri Mahabadian, M., Chapoy, A., & Tohidi Kalorazi, B. (2016). A New Thermodynamic Model for ParaffinPrecipitation in Highly Asymmetric Systems at High Pressure Conditions. Industrial and Engineering ChemistryResearch, 55(38), 10208–10217. DOI: 10.1021/acs.iecr.6b02804
General rightsCopyright and moral rights for the publications made accessible in the public portal are retained by the authors and/or other copyright ownersand it is a condition of accessing publications that users recognise and abide by the legal requirements associated with these rights.
If you believe that this document breaches copyright please contact us providing details, and we will remove access to the work immediatelyand investigate your claim.

Subscriber access provided by Heriot-Watt | University Library
Industrial & Engineering Chemistry Research is published by the American ChemicalSociety. 1155 Sixteenth Street N.W., Washington, DC 20036Published by American Chemical Society. Copyright © American Chemical Society.However, no copyright claim is made to original U.S. Government works, or worksproduced by employees of any Commonwealth realm Crown government in the courseof their duties.
Article
A New Thermodynamic Model for Paraffin Precipitation inHighly Asymmetric Systems at High Pressure Conditions
Mohammadreza Ameri Mahabadian, Antonin Chapoy, and Bahman TohidiInd. Eng. Chem. Res., Just Accepted Manuscript • DOI: 10.1021/acs.iecr.6b02804 • Publication Date (Web): 06 Sep 2016
Downloaded from http://pubs.acs.org on September 7, 2016
Just Accepted
“Just Accepted” manuscripts have been peer-reviewed and accepted for publication. They are postedonline prior to technical editing, formatting for publication and author proofing. The American ChemicalSociety provides “Just Accepted” as a free service to the research community to expedite thedissemination of scientific material as soon as possible after acceptance. “Just Accepted” manuscriptsappear in full in PDF format accompanied by an HTML abstract. “Just Accepted” manuscripts have beenfully peer reviewed, but should not be considered the official version of record. They are accessible to allreaders and citable by the Digital Object Identifier (DOI®). “Just Accepted” is an optional service offeredto authors. Therefore, the “Just Accepted” Web site may not include all articles that will be publishedin the journal. After a manuscript is technically edited and formatted, it will be removed from the “JustAccepted” Web site and published as an ASAP article. Note that technical editing may introduce minorchanges to the manuscript text and/or graphics which could affect content, and all legal disclaimersand ethical guidelines that apply to the journal pertain. ACS cannot be held responsible for errorsor consequences arising from the use of information contained in these “Just Accepted” manuscripts.

1
A New Thermodynamic Model for Paraffin
Precipitation in Highly Asymmetric Systems at
High Pressure Conditions
Mohammadreza Ameri Mahabadian1, Antonin Chapoy
1, 2*, Bahman Tohidi
1
1Hydrates, Flow Assurance & Phase Equilibria Research Group, Institute of Petroleum
Engineering, Heriot-Watt University, Edinburgh, Scotland, UK
2Mines Paristech, CTP – Centre Thermodynamique des procédés, 35 rue St Honoré 77305
Fontainebleau, France
KEYWORDS
Solid-fluid equilibrium, Paraffin wax, High pressure, Asymmetric systems, Clausius-
Clapeyron equation, Thermophysical properties
ABSTRACT
The predictions of the crystallization temperature and the amount of precipitates of paraffin
waxes at high pressure conditions may be inaccurate using existing thermodynamic models.
This is mainly due to the lack of experimental data on the molar volume of solid paraffins at
high pressures. This inaccuracy is even more pronounced for mixtures of high asymmetry.
The present work provides a new accurate modelling approach for solid-fluid equilibrium
(SFE) at high pressure conditions, more specifically, for highly asymmetric systems. In
Page 1 of 38
ACS Paragon Plus Environment
Industrial & Engineering Chemistry Research
123456789101112131415161718192021222324252627282930313233343536373839404142434445464748495051525354555657585960

2
contrast to the conventional methods for high pressure SFE modelling which define Poynting
molar volume correction term, to calculate the paraffin solid phase non-ideality at high
pressures, the new method exploits the values of thermophysical properties of importance in
SFE modelling (temperatures and enthalpies of fusion and solid-solid transition) evaluated at
the high pressure condition using a new insight to the well-known Clausius-Clapeyron
equation. These modified parameters are then used for evaluation of the fugacity in the solid
phase at higher pressure using the fugacity of pure liquid at the same pressure and applying
the well-established formulation of the Gibbs energy change during melting. Therefore, the
devised approach does not require a Poynting correction term. The devised approach coupled
with the well-tested UNIQAC activity coefficient model is used to describe the non-ideality
of the solid phase. For the fluid phases, the fugacities are obtained with the SRK EoS with
binary interaction parameters calculated with a group contribution scheme. The model is
applied to highly asymmetric systems with SFE experimental data over a wide range of
pressures. It is first used to predict crystallization temperature in binary systems at high
pressures and then verified by applying it on multicomponent mixtures resembling
intermediate oil and natural gas condensates.
Page 2 of 38
ACS Paragon Plus Environment
Industrial & Engineering Chemistry Research
123456789101112131415161718192021222324252627282930313233343536373839404142434445464748495051525354555657585960

3
1. Introduction
Formation of paraffinic solids is well documented to be able to impose considerable
operational costs due to decreasing flow efficiency and, in the worst case, pipeline blockage.
Due to high expenses of the remediation approaches for wax deposition problem (such as
chemical dissolution and pigging), prevention is always the best option which in turn calls for
accurate risk assessment of the wax formation problem, i.e. identifying the
temperature/pressure conditions under which the waxes form. Although not as important as
temperature, the pressure can have a significant effect on the wax phase boundary (see for
example the work of Pan et al.1). In fact, as outlined by Pauly et al.
2, in mixtures with
significant light end proportions, the pressure change can considerably affect the chance of
wax formation through retrograde condensation, depressurization and Joule-Thomson effect.
Several thermodynamic models have been proposed in the literature for estimating wax
precipitation onset and the amount of wax formed inside the wax phase boundary. The
performance of existing models are (as will be shown later) good at low pressure conditions
as long as accurate thermodynamic models for the description of fluid and solid phases as
well as a precise correlation for calculating thermophysical properties of alkanes are utilised.
Paraffinic SFE calculations at high pressures using existing methodologies may show high
deviations compared to experimental data, more visibly in systems of high asymmetry with
high proportions of the light end which are the main subject of this study. The main motive
for studying such systems is their resemblance of volatile oils and gas condensates which
might form wax1,3
. With similar intention, a handful of experimental studies in the literature,
mainly on binaries, have been focused on SFE in highly asymmetric systems. The purpose of
the current study is the development of a new thermodynamic model for the extension of one
of the accurate existing schemes for SFE modelling to high pressures. The next section
provides the background on the modelling wax precipitation at high pressures and the
Page 3 of 38
ACS Paragon Plus Environment
Industrial & Engineering Chemistry Research
123456789101112131415161718192021222324252627282930313233343536373839404142434445464748495051525354555657585960

4
complete formulation of the developed model. It also presents a modification of an existing
method. An extensive comparison of the devised methodology with the existing models is
then provided in the Results and Discussions Section.
2. Methodology
2.1. Background
The equilibrium calculations in the paraffin wax forming systems require evaluation of the
fugacity of precipitating components in the solid phase(s) which, consequently, calls for the
evaluation of fugacity of pure components in the solid state. The fugacity of pure paraffins in
the solid state, ��∗�, are well-established to be related to the pure components’ liquid
fugacity, ��∗�, by4:
��∗���∗� = ��Δ �f�� �1 − ���f� + Δ �tr�� �1 − ���tr�� (1)
It is assumed here that the Gibbs free energy change due to thermal contributions during
phase changes (heat capacity effect) are negligible, as confirmed through sensitivity
analysis5. In the equilibrium calculations, the pure components fugacities in the solid state
are then used to calculate the fugacity of components in the solid solution by:
��S = �S��∗���S (2)
Using Eq. 1 and Eq. 2 as well as an accurate thermodynamic model to describe fluid phases
and a robust activity coefficient model to calculate activity coefficient of components in the
solid solution, ��S, one can easily specify the solid-fluid equilibrium state characteristics
applying a robust multiphase flash algorithm. The application of Eq. 1 requires accurate
values of thermophysical properties which are normally measured at components triple point
Page 4 of 38
ACS Paragon Plus Environment
Industrial & Engineering Chemistry Research
123456789101112131415161718192021222324252627282930313233343536373839404142434445464748495051525354555657585960

5
pressure. Therefore, precise evaluation of wax phase boundary (or more accurately, wax
disappearance temperatures, WDT) at sufficiently low pressures near to the reference state
pressure (in this work 0.1 MPa) is an easy task, provided that a combination of strong
thermodynamic models are utilized. One such combination, as applied in the current work
consists of:
i. Thermodynamic model for fluid phases: Soave-Redlich-Kwong (SRK) EoS6 is used
to describe fluid phases and binary interaction parameters are calculated by Jaubert
and Mutelet7 group contribution scheme (JMGC) as presented by Qian et al.
8. This
method was originally developed for the Peng and Robinson9 (PR) EoS and then
extended to the SRK EoS as presented by Jaubert and Privat10
is used. In the absence
of associating fluid, which is the case for the mixtures investigated here, the SRK-
JMGC model has a proven capability to accurately describe fluid-fluid equilibria10
.
Jaubert and Mutelet7 combined their group contribution method with a cubic EoS to
model VLE in highly asymmetric systems. They found that their group contribution
scheme coupled with a cubic EoS gives better results compared to EoS/GE approaches
of LCVM11
(which is widely used for describing fluid in solid-fluid equilibria of
waxy systems in several example works3,12–16
) and MHV217
. The JMGC method for
binary interaction parameters in modelling wax forming systems has been applied in
some publications18,19
. In order to be consistent, in this work, the fugacity of pure
components in the liquid state are also calculated with the SRK EoS.
ii. Thermophysical properties estimation correlation: Experimental evidence has shown
that for pure odd alkanes, the dominant crystalline structures in multicomponent solid
solutions is orthorhombic20–23
. This observation is also valid for cases where solid
solution consists only of even alkanes24
. In this regard, except for cases where the
solid solution is a pure even heavy paraffin, the thermophysical properties of
Page 5 of 38
ACS Paragon Plus Environment
Industrial & Engineering Chemistry Research
123456789101112131415161718192021222324252627282930313233343536373839404142434445464748495051525354555657585960

6
compounds, i.e., fusion temperature, ��f, solid-solid transition temperature, ��tr, enthalpy of fusion Δ �f and enthalpy of solid-solid transition, Δ �tr, are evaluated
using the correlations of Coutinho and Daridon25
. In these set of correlations, the odd
paraffins properties are extended by extrapolation to the even alkane properties26
.
Using these correlations, the values of thermophysical parameters are evaluated at
reference pressure,�� (assuming that the thermophysical properties of pure
components at the triple point pressure and the reference pressure are the same24
). In
the cases of binary asymmetric systems, where the solid phase is a pure even paraffin,
the thermophysical properties of the paraffin used are those reported in the
comprehensive work of Dirand et al.27
.
iii. Activity coefficient model for the solid solution: In this work the UNIQUAC activity
coefficient model in its original form as developed by Abrams and Prausnitz28
(later
utilized by Coutinho29
for the non-ideality of paraffinic solid phase(s)) is used to
evaluate paraffinic solid components activity coefficients in solid solution, ��S. Details
of this model and its formulation and parameterization can be found elsewhere26
.
Finally, accurate values for critical properties and acentric factor of components, especially
the heavy alkanes, are required. In this work, the critical properties and acentric factor pure
components are taken from the DIPPR database [35].
2.2. Modeling wax phase boundary at high pressures
For high pressures, generally, two approaches can be utilized to evaluate fugacity of
components in the solid solutions in complex multicomponent waxy mixtures:
1- Poynting term models: In these models, the fugacities of the solid phase(s) evaluated at
the reference pressure (using Eq. 1 and Eq. 2) are translated to higher pressures using a
Poynting correction term i.e.:
Page 6 of 38
ACS Paragon Plus Environment
Industrial & Engineering Chemistry Research
123456789101112131415161718192021222324252627282930313233343536373839404142434445464748495051525354555657585960
7
�����, �, �� = �����, ��, ����� �̅�����
� !�� = �S��∗���S��� �̅����
��
!�� (3)
Here, �̅�� is the molar volume of component " in solid solution and ��is the reference
pressure (0.1 MPa). Examples of this type are the works of Pauly et al.12
, Morawski et
al.30
, Ghanaei et al.31,32
and Nasrifar et al.19
. Correct calculation of the Poynting
correction term requires an accurate model to evaluate the molar volume of components
in the solid solution. Due to scarcity of experimental data to develop such a model,
different authors have presented a variety of methods to estimate the Poynting term.
Pauly et al.12
have assumed that the molar volume of components in solid solution is
equal to the pure component molar volume in the liquid state multiplied by a pressure
independent constant variable# through:
� �̅�����
� !� = � #�����
��
!� = # $%���∗�����$%���∗������ (4)
Where ��� and ��� are the molar volume of the pure normal alkane " in the solid and liquid
states, respectively. The assumption of a constant pressure-independent # contradicts the
fact that by increasing pressure, reduction in liquid the molar volume of a component is to
higher extents than in the solid state. Morawski et al.30
used Clausius-Clapeyron equation
to modify#, though again # is considered to be pressure independent. They also
assumed that enthalpies of fusion and solid-solid transition of normal alkanes are pressure
independent. Furthermore, Morawski et al. 30
model requires evaluation of a
composition-dependant adjustable parameter and in this sense is not fully predictive. The
works of Nasrifar and Fani-Kheshty19
and Ghanaei et al.31
are a modification of the
Page 7 of 38
ACS Paragon Plus Environment
Industrial & Engineering Chemistry Research
123456789101112131415161718192021222324252627282930313233343536373839404142434445464748495051525354555657585960

8
Morawski et al.30
model, attempting to remove the adjustable parameter. Accordingly,
Nasrifar and Fani-Kheshty19
proposed the following formulation for the Poynting term:
� �̅�����
� !� = −& '( �f + ( �tr�)�) * �� − ��� (5)
Here, & is constant equal to 0.002 m3/kmol obtained by fitting WDT of pure normal
paraffins. However, Ghanaei et al.31
, by assuming constant slopes for fusion and solid-
solid transition temperatures of pure paraffins by increasing pressure, developed the
following formulation for the Poynting term:
� �̅�����
� !� = � − ����) + Δ �f,!�∗!�-. +
Δ �tr/!�∗!�0123 (6)
Based on Ghanaei et al.31
, with an accurate estimate and regardless of the carbon number
of the pure alkane the values of 4.5 MPa.K-1
and 3.5 MPa.K-1
can be assigned to
saturation pressure slope changes with temperature for fusion, 4�∗456, and solid-solid
transition, 4�∗4578, for all heavy alkanes. To obtain this the authors have assessed a large
database of experimental fusion and solid-solid transition temperatures of pure alkanes at
high pressure reported in the literature 27,33–39
. Based on the current study evaluations and
some work in the literature30
this assumption is indeed precise (it will be shown later on,
utilized in a different scheme). This way they removed the need for parameter & defined
in Nasrifar and Fani-Kheshty19
work. However in both methods the same assumptions, as
that of Morawski et al.31
hold. It should be noted that Ghanaei and co-authors have also
presented another high pressure wax model32
, again by devising a formulation for the
Poynting term, developed a few years prior to their latest approach described here. In our
Page 8 of 38
ACS Paragon Plus Environment
Industrial & Engineering Chemistry Research
123456789101112131415161718192021222324252627282930313233343536373839404142434445464748495051525354555657585960

9
evaluations, only the performance of their recent model is assessed. Finally, there are
other works in the literature estimating the Poynting term by assuming the solid phase to
be incompressible and the liquid molar volumes are evaluated at average pressures. Due
to these questionable assumptions, especially in the cases studied here, such works are not
assessed here.
2- No-Poynting term models: In the second approach, the pure components solid fugacities
are calculated at high pressure using Eq. 1 with the thermophysical properties evaluated at
the same high pressure�, i.e. no Poynting correction term is required. The method of Ji
et al.40
belongs to this group. In this method, a linear correlation is used to evaluate ��f of
alkanes at higher pressure, with an accurate estimate that the slope of change of fusion
temperature by increasing pressure,4�∗456 is a constant value for heavy alkanes (as discussed
earlier). Therefore, one can write:
�-���� = �-����� + +� − ��,!�∗!�-.3 (7)
A constant of 5.0 MPa.K-1
for4�∗456 is suggested by Ji et al. 40
. In the original work of Ji et
al. 40
the parameter �- is the only thermophysical property of pure heavy alkane for
which updated values are evaluated at higher pressures and the rest are held constant.
Based on our experience if �- is the only thermophysical properties modified at�, the
model deviations from experimental behaviour can be significant at high pressures. The
same observation is made in the evaluations made by Nasrifar and Fani-Kheshty19
.
Therefore, here, apart from the new model developed, first, a modified version of Ji et
Page 9 of 38
ACS Paragon Plus Environment
Industrial & Engineering Chemistry Research
123456789101112131415161718192021222324252627282930313233343536373839404142434445464748495051525354555657585960

10
al.40
model is presented, in which not only the fusion temperatures but also the solid-
solid transition temperatures of pure alkanes are updated at high pressure similarly by:
�01���� = �01����� + +� − ��/!�∗!�0123 (8)
It will be shown later that, despite the simplicity of the approach, the modified Ji method
provides better results compared to that of “Poynting term” methods. In the modified Ji
model the value of slopes 4�∗456 and
4�∗4578 are those suggested by Ghanaei et al.31
i.e. 4.5
MPa.K-1
and 3.5 MPa.K-1
, respectively. As a final note to the methods in the second
category, it is assumed that the activity coefficient of components in the solution is fairly
constant with pressure. This is a reasonable assumption. In fact, differentiation of the
logarithm of activity coefficient with respect to pressure yields4:
�9�$%:��S;�9� �5,< = ��̅�=��� (9)
To see the effect of pressure on the activity coefficient the example case of binary n-
pentane + n-hexadecane is considered. For this highly asymmetric system, the absolute
value of excess molar volume is reported41
to be as high as -1.1581 cm3.mol
-1 (for
0.7034:0.2966 molar ratio). Using this value in Eq. 9, at room temperature, a pressure
change of 100 MPa is translated into only about 4.5% change in activity coefficient.
Furthermore, the volume effect of mixing is decreasing by increasing pressure in
paraffinic systems (see for example42
) and, obviously, the excess molar volume of solid
solutions are smaller than that of liquid solutions, therefore one would expect even much
smaller changes in activity coefficient in the solid solution at high pressures and hence
the assumption of independency of activity coefficient from pressure is plausible.
Page 10 of 38
ACS Paragon Plus Environment
Industrial & Engineering Chemistry Research
123456789101112131415161718192021222324252627282930313233343536373839404142434445464748495051525354555657585960

11
Based on several investigations, (and as will be shown for modified Ji, Pauly et al.12
, Nasrifar
and Fani-Kheshty19
and Ghanaei et al.31
models) the performance of the methods in both
categories are comparatively acceptable for mixtures of low asymmetry with overall
compositions having a low amount of light ends. The efficiency of the aforesaid methods,
however, is poor in mixtures of high asymmetry which have high proportions of light ends, as
will be presented later on. The deviations become even more as the pressure increases. This
issue is addressed in some works 2 and seemingly has prevented the authors accurately
modelling the experimental data. In this work, the aim is to tackle the problem of wax phase
boundary estimation at higher pressure, especially for highly asymmetric systems, by
developing a new model. Therefore, the work presents two new solid-liquid equilibrium high
pressure models based on “No-Poynting term” approach i.e. (i) the modified Ji model,
described earlier and (ii) a new accurate scheme described in the next section. The reason
why two new methods are presented here will be discussed in the results section.
2.3. New proposed method
In the current study, a new method based on the “No-Poynting term” approach is developed
to model the non-ideality of paraffinic solid phases at high pressures. The aim here is to have
accurate estimations of thermophysical properties of pure paraffins at high pressure, using
their values in the reference state and a proper formulation to modify them to account for
high pressure effect. Prior to discussing the development of the model, to have a better
understanding the of solid-fluid equilibrium behaviour of highly asymmetric systems,
investigations are first carried out for simple binary systems of high asymmetry, for which
experimental solid-fluid phase boundary data are available. According to Seiler et al.43
the
combination of Eq. 1 and Eq. 2 can be extended to high pressure range if the pressure
dependence of both enthalpies of fusion and the solid-solid transition is taken into
Page 11 of 38
ACS Paragon Plus Environment
Industrial & Engineering Chemistry Research
123456789101112131415161718192021222324252627282930313233343536373839404142434445464748495051525354555657585960

12
consideration. Here, the Clausius-Clapeyron equation44
is used to take the dependency of
Δ - to pressure into consideration. Using Clausius-Clapeyron equation, for the fusion:
∆ -���� = ������� − ��������-���� �!�∗!�-�� (10)
As mentioned, for n-alkanes, with an accurate estimate, the fusion temperature�-changes
linearly with pressure and the slope is a constant value independent of pressure and the
carbon number of the pure paraffin. Therefore, using Eq. 10, one can easily relate the
enthalpy of fusion at high pressure � to the same property in reference pressure �� by:
∆ -����∆ -����� = � ������ − ������������� − �������� �-�����-����� (11)
Here, as described, the fusion temperature of pure alkane at reference pressure (�-������ is calculated by the correlations proposed by Coutinho and Daridon
25 except for the cases of
binary asymmetric systems where the solid solution is a pure even normal alkane in which
case for the heavy alkane ", �-����� is taken from the work of Dirand et al.27
. Eq. 7 with 4�∗456
of 4.5 MPa.K-1
as suggested by Ghanaei et al.31
is used to calculate fusion temperature of pure
alkane "at high pressure,�-����. As mentioned, based on Pauly et al.
12 one can relate the molar volume of heavy alkanes in the
liquid state to the same value in the solid state by multiplying it with constant value, i.e.:
��� = #��� (12)
Where, according to Pauly et al. 12
, for pure alkanes # is equal to 0.86 and is assumed to be
pressure independent. For mixtures, due to excess volume effect they have suggested the
value of 0.9 for#. A constant, pressure independent value, assigned for # is questionable as
Page 12 of 38
ACS Paragon Plus Environment
Industrial & Engineering Chemistry Research
123456789101112131415161718192021222324252627282930313233343536373839404142434445464748495051525354555657585960

13
obviously the effect of compaction due to high pressure is less in the solid state compared to
liquid state. Hence, one would expect that by increasing the pressure the value of #should
increase. Accordingly, in this work, # is defined to be pressure dependent, hereafter denoted
as#- for fusion, assuming to increase linearly with pressure (in the simplest possible way)
i.e.:
#-��� = #-���� + ?�� − ��� (13)
Here ? is a positive constant. Despite the simplicity of Eq. 13, as will be presented later on,
the formulation devised proves very accurate. Using the data reported by Schaerer et al.45
an
average value of 0.895 is assigned to#-���� which is representing the ratio of pure alkane
liquid state to solid state molar volume at reference pressure (very similar to Pauly et al.12
value of#). In this way Eq. 11 can be reduced to:
∆ -����∆ -����� = �1 − #-���1 − #-����� �-�����-����� (14)
Using the same approach, however with a different variable named #01 to make a distinction,
for alkanes showing order-disorder solid-solid transitions, the following formula can be
written to update ∆ 01at high pressures:
∆ 01����∆ 01����� = �1 − #01���1 − #01����� �01�����01����� (15)
Again by using Schaerer et al.45
data the value of 0.958 is assigned to #01���� which
represents the ratio of pure alkane disordered to ordered solid state molar volume at reference
pressure. Similar to fusion, as mentioned, the same trend in change of �01 of a pure alkane
by pressure is observed, i.e. increasing with constant 4�∗4578 of 3.5 MPa.K
-1 as suggested by
Page 13 of 38
ACS Paragon Plus Environment
Industrial & Engineering Chemistry Research
123456789101112131415161718192021222324252627282930313233343536373839404142434445464748495051525354555657585960

14
Ghanaei et al.31
. Therefore, Eq. 8 is used to evaluate�01����. With the same approach
applied for fusion as presented in Eq. 13, for solid-solid transition it is proposed that:
#01��� = #01���� + ?�� − ��� (16)
In theory, the value of ? in Eq. 16 should be different from that of Eq. 13. However, the aim
here is to have one adjustable parameter, and as will be shown later on, a single value of ? for
both of the equations can accurately model highly asymmetric systems. Having adjustable
parameters to model solid-fluid equilibrium at high pressures is acceptable (see for example
Morawski et al. 30
and Rodriguez-Reartes et al. 46
models for paraffinic binary systems).
To sum-up in the current approach the following steps should be taken to calculate non-
ideality in the solid phase at high pressure�:
1- Using proper correlations/database the thermophysical properties of pure components
i.e. ��f, ��tr, Δ �f, Δ �tr are evaluated at the reference pressure��.
2- With values of 4.5 MPa.K-1
for 4�∗456 and 3.5 MPa.K
-1 for4�∗4578, Eq. 7 and Eq. 8 are used
to evaluate ��f and ��tr , respectively, at high pressure�.
3- Adjusting the value of? and using values of 0.895 for #-���� and 0.958 for#01���� , Eq. 13 and Eq. 16 are used to evaluate#- and#01, respectively, at high pressure�.
Guidelines for assigning a correct value for ?will be presented in the results section.
4- Using (i) the values of ��f and ��trat reference pressure ��and their values at high
pressure �, calculated in Step 2, (ii) the values of #- and#01 at reference pressure
��(i.e. 0.895 and 0.958) and their values at high pressures � (calculated in Step 3)
and (iii) Δ �f and Δ �tr at reference pressure ��, (calculated in Step 1), Eq. 14 and Eq.
15 are used to evaluate Δ �f and Δ �tr, respectively at high pressure �.
Page 14 of 38
ACS Paragon Plus Environment
Industrial & Engineering Chemistry Research
123456789101112131415161718192021222324252627282930313233343536373839404142434445464748495051525354555657585960

15
5- Having calculated the value of all thermophysical properties at high pressure P, Eq. 1
and Eq. 2 are directly used to evaluate the fugacity of components in the solid solution
at high pressure.
As described earlier, for the modified Ji method, steps 3 and 4, are not required. In fact, the
modified Ji method is a special form of the, more general, new model proposed here for
which:
∆ -����∆ -����� = 1 (17)
And:
∆ 01����∆ 01����� = 1 (18)
As both modified Ji and the new model are proposed here, to make the distinction, hereafter,
the term “this work model” refers to the newly developed method, not the modified Ji.
3. Results and Discussions
In this section, the performance of the developed model is compared with the modified Ji,
Pauly et al. 12
, Nasrifar and Fani-Kheshty19
and Ghanaei et al. 31
models. To have fair
evaluations of the models, the SRK+JMGC model and UNIQUAC activity coefficient model
are used to describe the non-idealities of fluid and solid phase, respectively, for all high-
pressure methods. The SRK+JMGC model used here to describe fluids is fully predictive
and no tuning of model parameters to match saturation pressure data is made prior to wax
calculations. It will be shown that the performance of all these existing models in systems
with lower proportions of the light end in moderate pressure ranges is good, provided the
requirement discussed earlier in the Background Section. Therefore, the main focus here is
on highly asymmetric systems of high proportions of the light end at high pressures,
resembling gas condensates and volatile oils, for which experimental wax phase boundary
Page 15 of 38
ACS Paragon Plus Environment
Industrial & Engineering Chemistry Research
123456789101112131415161718192021222324252627282930313233343536373839404142434445464748495051525354555657585960

16
data are available. Data on such systems are scarce. The uncertainty in the experimental wax
phase boundary data used here to evaluate models is low as they are corresponding to wax
disappearance points. It is well established that wax disappearance temperature (WDT) data
are better representatives of true thermodynamic melting point compared to wax appearance
temperature (WAT)47,48
. The evaluations are first carried out for binary asymmetric systems,
then synthetic multicomponent asymmetric wax mixtures and are graphically represented for
selected systems with low, moderate and high proportions of methane. Furthermore,
reporting model errors from low to high pressure range using Average Relative Error (ARE)
percent, i.e. by: AB∑ DEF�GHI�JEF�KLM�DEF�GHI�B� × 100 can be misleading as the high temperature ranges
would result is small AREs regardless of the model utilized. Therefore, instead, the Average
Absolute Error (AAE) is used for the comparisons which is defined by (P: number of points):
QQR% = 1PT DT��VWX� − T��YZ[�DB� × 100 (19)
3.1. Binary methane + heavy alkane mixtures
Here, the models results for binary asymmetric systems (with experimental wax phase
boundary data available) methane + n-hexadecane49
, methane + n-heptadecane35
, methane +
n-eicosane39
, methane + n-docosane50
, methane + n-tetracosane51
and methane + n-
triacontane52
are presented. A total of 457 data points of WDT in binary asymmetric mixtures
are used for evaluations. In this study the WDT data of asymmetric systems for which the
data are not reported at high pressures of at least 50 MPa (e.g. 53–58
for which the solid-fluid
phase boundary data are reported up to 12 MPa), or the systems for which the uncertainty in
the critical/physical properties of the heavy end component is high (e.g. 59
) are not used in
evaluations. In all the systems evaluated wax phase boundary data in low to very high
proportions of methane with a variety of molar ratios were measured. The graphical
Page 16 of 38
ACS Paragon Plus Environment
Industrial & Engineering Chemistry Research
123456789101112131415161718192021222324252627282930313233343536373839404142434445464748495051525354555657585960
17
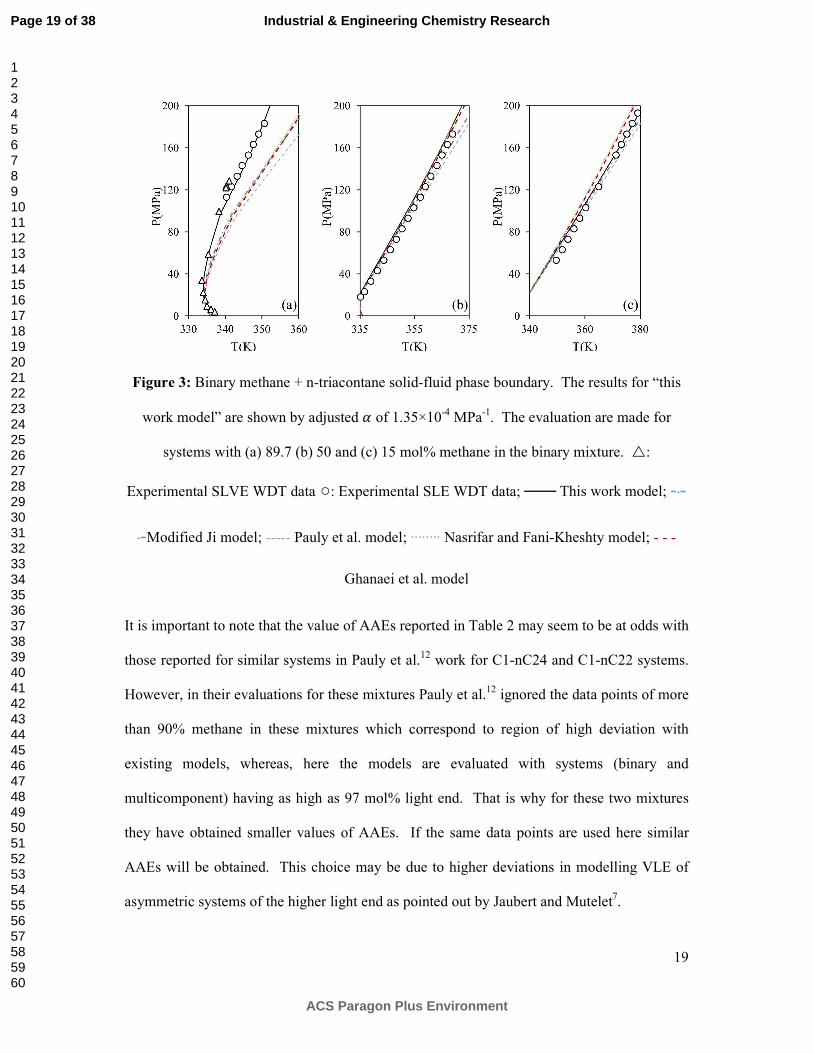
comparisons are shown for selected low, moderate and high proportions of methane in
example binary mixtures methane + n-heptadecane, methane + n-eicosane and methane + n-
triacontane in Figure 1 to Figure 3. As the deviations of existing models are very high in the
case of systems methane + n-triacontane, depicting evaluation results in all proportions in a
single graph makes interpretations difficult, therefore it was decided to show them separately
in the way presented in Figure 3. As the first major observation in the model evaluations
(and as observed in Figure 1 to Figure 3), for the binary systems tested, adjusting a single
value of ? can accurately model the wax phase boundary, in a fixed binary system regardless
of the proportion of the methane in the mixture. As an example, as shown in Figure 3, the ?
equal to 1.38×10⁻⁴
MPa-1
gives an accurate match in low to high proportions of methane in
binary mixture methane + n-triacontane. The adjusted value of ? for each case is presented
in Table 1. As shown in this table, except for the case of methane + n-hexadecane system the
value of ? have almost the same order of magnitude in all the binary system. The models
deviations are presented in Table 2 in terms of AAE for all the data points. According to this
table, the results of “this work model” with a single ? for each case in very low to very high
proportions of light end (methane) are accurate. The superiority of the proposed model is
clearer in binary systems of higher asymmetry (see results for methane + n-tetracosane and
methane + n-triacontane in Table 2 where the deviation of existing models are very high at
high pressures. Interestingly, even if the average value of ? over the binary systems i.e.
1.23×10⁻⁴
MPa-1
is used for all the cases, still the performance of the proposed method is
much better than the alternative methods.
Page 17 of 38
ACS Paragon Plus Environment
Industrial & Engineering Chemistry Research
123456789101112131415161718192021222324252627282930313233343536373839404142434445464748495051525354555657585960

18
Figure 1: Binary methane + n-heptadecane solid-fluid phase boundary. The results for “this
work model” are shown by adjusted ? of 1.18×10⁻⁴
MPa-1
Figure 2: Binary methane + n-eicosane solid-fluid phase boundary. The results for “this
work” model are shown by adjusted ? of 1.34×10⁻⁴
MPa-1
0
20
40
60
80
100
285 295 305 315 325
P (
MP
a)
T(K)
80.09 mol% C1-Experimental
60.14 mol% C1-Experimental
20.21 mol% C1-Experimental
This work model
Modified Ji model
Pauly et al. model
Ghanaei et al. model
Nasrifar and Fani-Kheshty model
0
20
40
60
80
100
300 305 310 315 320 325 330 335 340 345 350
P(M
Pa)
T(K)
9.9 mol% nC20-Experimental
36.3 mol% nC20-Experimental
84.8 mol% nC20-Experimental
Experimental SLVE data
This work model
Modified Ji model
Pauly et al. model
Ghanaei et al. model
Nasrifar and Fani-Kheshty model
Page 18 of 38
ACS Paragon Plus Environment
Industrial & Engineering Chemistry Research
123456789101112131415161718192021222324252627282930313233343536373839404142434445464748495051525354555657585960
19
Figure 3: Binary methane + n-triacontane solid-fluid phase boundary. The results for “this
work model” are shown by adjusted ? of 1.35×10⁻⁴
MPa-1
. The evaluation are made for
systems with (a) 89.7 (b) 50 and (c) 15 mol% methane in the binary mixture. �:
Experimental SLVE WDT data ○: Experimental SLE WDT data; ─── This work model; -·-
·-Modified Ji model; ----- Pauly et al. model; ········ Nasrifar and Fani-Kheshty model; - - -
Ghanaei et al. model
It is important to note that the value of AAEs reported in Table 2 may seem to be at odds with
those reported for similar systems in Pauly et al.12
work for C1-nC24 and C1-nC22 systems.
However, in their evaluations for these mixtures Pauly et al.12
ignored the data points of more
than 90% methane in these mixtures which correspond to region of high deviation with
existing models, whereas, here the models are evaluated with systems (binary and
multicomponent) having as high as 97 mol% light end. That is why for these two mixtures
they have obtained smaller values of AAEs. If the same data points are used here similar
AAEs will be obtained. This choice may be due to higher deviations in modelling VLE of
asymmetric systems of the higher light end as pointed out by Jaubert and Mutelet7.
Page 19 of 38
ACS Paragon Plus Environment
Industrial & Engineering Chemistry Research
123456789101112131415161718192021222324252627282930313233343536373839404142434445464748495051525354555657585960

20
Table 1: The adjusted values of parameter ? (MPa-1
) for the binary asymmetric systems
investigated
Binary system C1-nC16 C1-nC17 C1-nC20 C1-nC22 C1-nC24 C1-nC30
Adjusted ? 0.74×10⁻⁴
1.18×10⁻⁴
1.34×10⁻⁴
1.34×10⁻⁴
1.43×10⁻⁴
1.35×10⁻⁴
Average 1.23×10⁻⁴
Table 2: Average Absolute Error (AAE) of wax phase boundary calculated by different
models compared to experimental values for binary asymmetric systems
AAE (K)
Bin
ary
Mix
ture
Num
ber
of
dat
a p
oin
ts
Pre
ssure
ran
ge
(MP
a)
Th
is w
ork
mod
el
(? adju
sted
)
Th
is w
ork
mod
el
(?= 1.2
3×
10
-4 M
Pa-1
)
Mod
ifie
d J
i
(Pro
po
sed h
ere)
Pau
ly e
t al
. 12
Ghanae
i et
al.
31
Nas
rifa
r an
d
Fan
i-K
hes
hty
19
C1-nC30 115 3.189-86.80 1.07 1.17 2.76 3.95 3.02 3.00
C1-nC24 136 1.820-95.62 0.67 1.18 4.34 3.97 4.38 4.06
C1-nC22 13 4.520-97.68 0.19 0.72 5.75 5.32 6.79 6.24
C1-nC20 81 95.66-160.19 0.44 0.47 1.12 1.57 1.64 2.26
C1-nC17 49 10.11-257.50 0.53 0.54 1.16 1.65 1.74 1.87
C1-nC16 63 6.540-193.10 0.25 0.43 0.34 0.51 0.84 1.43
Total 457 Average 0.53 0.75 2.58 2.83 3.07 3.14
3.2. Multicomponent Mixtures
Similar to binary systems, here the evaluations are made only for systems of high asymmetry,
where the light end is methane, as all of the existing models perform fairly well for low
asymmetric systems. For multicomponent systems again it is observed that a constant value
of ? is capable of accurately representing the wax phase boundary in a system with fixed
Page 20 of 38
ACS Paragon Plus Environment
Industrial & Engineering Chemistry Research
123456789101112131415161718192021222324252627282930313233343536373839404142434445464748495051525354555657585960
21
light and heavy ends, regardless of their proportions. This is shown for selected systems of
different low to high proportion of methane combined with (i) a ternary mixture of nC16 to
nC18 (experimental data from60
) in Figure 4 and (ii) multicomponent wax of nC13 to nC22
(wax2 with experimental data taken from2) presented in Figure 5. For all the systems tested,
the complete results are presented in Table 3. A set of 403 data points for 5 highly
asymmetric mixtures are used for evaluations. As it is shown in this table, by assigning a
special ? for each system, compared to other models, very small values of AAE would be
achieved. For all the data points for multicomponent systems, a common value of 0.95×10⁻⁴
is assigned to?. Using this value, again very small values of overall AAE are achieved as
shown in Table 3. Furthermore, according to the results, similar to what was observed for
binary systems, the modified Ji model performs much better than the other models. This
signifies the superiority of the “No-Poynting term” models over “Poynting term” models,
when thermophysical properties of heavy alkanes (most significantly, fusion and solid-solid
transition temperatures) are correctly evaluated at high pressures. Among the two “No-
Poynting-term” methods proposed, the new approach in which the parameter α is introduced
is outperforming the modified Ji method as all parameters T\f, T\tr, ΔH\f, ΔH\tr are calculated at
higher pressure while in the “modified Ji” method only T\f, T\tr are calculated at higher
pressure.
Page 21 of 38
ACS Paragon Plus Environment
Industrial & Engineering Chemistry Research
123456789101112131415161718192021222324252627282930313233343536373839404142434445464748495051525354555657585960

22
Figure 4: Multicomponent methane + (nC16-nC18) solid phase boundary. The results for
“this work model” are shown by adjusted ? of 1.71×10⁻⁴
MPa-1
for (a) 89.48 (b) 59.97 and (c)
19.9 mol% methane in the mixture. ○: Experimental WDT data; ─── This work model; -·-
·-Modified Ji model; ----- Pauly et al. model; ········ Nasrifar and Fani-Kheshty model; - - -
Ghanaei et al. model
Page 22 of 38
ACS Paragon Plus Environment
Industrial & Engineering Chemistry Research
123456789101112131415161718192021222324252627282930313233343536373839404142434445464748495051525354555657585960

23
Figure 5: Multicomponent methane + (nC13-nC22) solid phase boundary (“wax2” from the
work of Pauly et al.2. The results for “this work model” are shown by adjusted ? of 0.55×10
-
4 MPa
-1 (a) 89.76 (b) 79.73 (c) 69. 95 mol% methane in the mixture. ○: Experimental WDT
data; ─── This work model; -·-·-Modified Ji model; ----- Pauly et al. model; ········ Nasrifar
and Fani-Kheshty model; - - - Ghanaei et al. model
Page 23 of 38
ACS Paragon Plus Environment
Industrial & Engineering Chemistry Research
123456789101112131415161718192021222324252627282930313233343536373839404142434445464748495051525354555657585960

24
Table 3: Average Absolute Error (AAE) of wax phase boundary calculated different models
compared to experimental values for multicomponent asymmetric systems
AAE (K)
Mixture
Nu
mber
of
dat
a p
oin
ts
Pre
ssu
re r
ang
e (M
Pa)
Ad
just
ed
? (MP
a-1)
This
work
*
This
work
**
Mo
dif
ied Ji
(P
rop
ose
d
her
e)
Pau
ly e
t al
. 12
Gh
anae
i et
al.
31
Nas
rifa
r an
d
Fan
i-
Kh
esh
ty 1
9
C1+(nC16-nC18)60 41 4.22-
95.94
1.71×10⁻⁴
0.34 1.09 1.81 5.03 2.66 3.19
C1+(nC22+nC24)50 119 96.96-
171.4
1.36×10⁻⁴
1.32 2.22 5.29 8.51 6.82 6.82
C1+(nC24+nC30)38 105 103.1-
193.1
1.17×10⁻⁴ 1.16 1.99 6.22 11.24 7.69 6.22
C1+(nC13-nC22)2 99 0.1-
98.59
0.55×10⁻⁴
1.10 1.44 1.15 1.67 1.69 1.72
C1+(Multi-paraffin)61 39 0.1-45 0.32×10⁻⁴
0.38 0.85 0.49 0.93 1.03 1.03
Total 403 0.1-
193.1
Average 0.86 1.68 2.99 5.48 3.99 3.80
*Adjusted ? for each case
**Common?equal to 0.95×10⁻⁴
MPa-1
3.3. Notes on the adjustable parameter ^ Comparing the results presented in Table 2 and Table 3, it is observed that a smaller common
value can be assigned for parameter ? in binary systems compared to multicomponent
systems. This difference can be attributed to the excess volume effects in solid solutions in
comparison to pure solids, which results in having non-unity values for activity coefficients.
Yet the common values of ? are in the same order. Furthermore there is insufficient
published experimental data at very high pressures (in orders of 100 MPa) and for a diverse
range of asymmetry in the systems. Also, the experimental data used here for model
evaluations and adjusting ? for each system are measured by different methods (for the data
Page 24 of 38
ACS Paragon Plus Environment
Industrial & Engineering Chemistry Research
123456789101112131415161718192021222324252627282930313233343536373839404142434445464748495051525354555657585960

25
presented here, visual and calorimetric techniques), coupled with the general uncertainty with
wax phase boundary data62
. Accordingly, it was not possible to check if more intricate
functions can model the behaviour of parameters #- and #01at high pressure or if ? can be
defined as a normal alkane dependant parameter or as a function of the heaviness and/or
degree of asymmetry of the system. In absence of wax phase boundary data for systems of
low to moderate asymmetry, the modified Ji model, is suggested. Overall as a general
guideline, based on the characteristics of a mixture it is advised to assign a value for ? within
in the lower and upper boundaries of 0.3×10⁻⁴
MPa-1
to 1.4×10⁻⁴
MPa-1
with a common value
of 0.95×10⁻⁴
MPa-1
as discussed earlier. The performance of this value is shown for an
example system of high asymmetry with about 95.96 mol% methane (mixture “wax3” in the
work of Pauly et al.2) in Figure 6. The grey region in this figure corresponds to the upper and
lower wax boundary change using the minimum and maximum values of?. Using these
values, at pressures as high as 100 MPa an absolute error of ±2.5 K can be observed,
depending on the value of? specified. For this system the best value for ? is 0.64×10⁻⁴
MPa-
1. However, using both “this work model” with common value of 0.95×10
-4 MPa
-1 and
modified Ji method, very similar AAE compared to experimental data is achieved, though
“this work model” performs better than modified Ji at higher pressures as presented in Figure
6 compared to “Poynting term” methods which have almost similar performances. This
figure, again confirms that between methods without adjustable parameters the method of
modified Ji is the one offering the highest accuracy.
Page 25 of 38
ACS Paragon Plus Environment
Industrial & Engineering Chemistry Research
123456789101112131415161718192021222324252627282930313233343536373839404142434445464748495051525354555657585960

26
Figure 6: Wax phase boundary modelled with different methods for the “wax3” system of
Pauly et al.2 with 95.96 mol% methane. The grey region corresponds to the upper and lower
wax boundary change using the minimum and maximum values of?, i.e. 0.3×10⁻⁴
MPa-1
and
1.4×10⁻⁴
MPa-1
, respectively. For this system the best value of ? is 0.64×10⁻⁴
MPa-1
The performance of modified Ji model is not only comparably good at wax phase boundary
modelling but also in measuring the wax content and composition. Due to scarcity of such
data at high pressure, the comparisons are only made for a single system of nC10+(nC18-
nC30), though with much lower degree of asymmetry compared to the rest of the systems
investigated here, for which the experimental wax content and composition are measured by
Daridon and Dauphin63
at 293.15 K and at different pressures as high as 50 MPa (see Figure
7). For this system, the best value of ? to match wax composition data is 0.35×10⁻⁴
MPa-1
.
This small value (compared to the common value of 0.95×10⁻⁴
MPa-1
) for this system of
lower asymmetry points to the possible correlation of ? with the heaviness of the light-end
or, generally speaking, degree of asymmetry of system. Devising such a correlation requires
sufficient experimental solid-liquid equilibrium data to be obtained for a vast range of
systems with different asymmetry and proportions of light end.
0
20
40
60
80
285 295 305 315
P(M
Pa)
T(K)
Experimental WDT data
This work model (α=0.64E-4)
This work model (α=0.95E-4)
Modified Ji model
Ghanaei et al. model
Pauly et al. model
Nasrifar et al. model
Page 26 of 38
ACS Paragon Plus Environment
Industrial & Engineering Chemistry Research
123456789101112131415161718192021222324252627282930313233343536373839404142434445464748495051525354555657585960

27
Figure 7: Composition of solid wax evaluated with different models for nC10+(nC18-nC30)
mixture of Daridon and Dauphin63
. The results for “this work model” are shown by adjusted
? of 0.35×10⁻⁴
MPa-1
Page 27 of 38
ACS Paragon Plus Environment
Industrial & Engineering Chemistry Research
123456789101112131415161718192021222324252627282930313233343536373839404142434445464748495051525354555657585960

28
Now, it is justified why here two models were proposed. The new model, by comparison
with the modified Ji and other models evaluated here, is capable of accurately modelling the
behaviour of solid-liquid equilibria in highly asymmetric systems at high pressure, though it
does have an adjustable parameter. Using a common value for this parameter the new model
is still superior in a variety of cases. However, in the absence of high pressure WDT data and
when the uncertainty in choosing value of adjustable parameter is high or when it is not
desirable to use a model with an adjustable parameter the modified Ji model is suggested. As
presented earlier, the modified Ji prediction of wax phase boundary as well as wax
composition was more accurate than all of the “Poynting term” methods evaluated here.
4. Conclusions and Suggestions
A new model for the most problematic systems in the area of solid-liquid equilibrium
modelling of the paraffinic waxy mixture, i.e. highly asymmetric mixtures at high pressure
conditions, is developed. The model is based on the “No Poynting term” approach and is
shown to be capable of accurately capturing the wax phase boundary behaviour of such
systems with a single adjustable parameter which can be fixed regardless of the proportion of
light and heavy ends in a mixture of variable ratios of fixed light end and heavy end. The
value of the adjustable parameter can vary from one mixture to another. Therefore, using a
total of 860 data points for evaluation, common values for the adjustable parameter are
assigned. Due to lack of experimental data, it is not possible at present to correlate the value
of the adjustable parameter with the degree of asymmetry of the mixture or even assign a
more complex form of function to the ratio of molar volume of n-alkanes in the solid state to
the same value in the liquid state (here a linear function was used, in the simplest form, with
the slope to be the adjustable parameter). Therefore it is suggested to measure more
experimental solid-fluid experimental data in systems with a wide range of asymmetry.
Page 28 of 38
ACS Paragon Plus Environment
Industrial & Engineering Chemistry Research
123456789101112131415161718192021222324252627282930313233343536373839404142434445464748495051525354555657585960

29
Using common values for the adjustable parameter, the model works very well at high
pressures. Meanwhile, if it is not desirable to use a model with an adjustable parameter
(when uncertainty in its value is high) the modified Ji model, in the way revised in the current
study, is suggested as it was clearly shown that the “No Poynting term” methods performance
are superior to that of “Poynting term” methods for such problematic systems.
AUTHOR INFORMATION
Corresponding Author
* Tel: +44(0)1314513797 E-mail: [email protected] (Antonin Chapoy)
Author Contributions
The manuscript was written through contributions of all authors. All authors have given
approval to the final version of the manuscript.
Funding Sources
This work was funded by the Ali Danesh scholarship of Heriot-Watt University provided for
the first author.
ACKNOWLEDGMENT
The Ali Danesh scholarship of Heriot-Watt University provided for the first author is greatly
appreciated.
ABBREVIATIONS
SFE, Solid-fluid equilibrium; WDT, Wax disappearance temperature; SRK, Soave-Redlich-
Kwong equation of state; PR, Peng-Robinson equation of state; JMGC, Jaubert-Mutelet
group contribution method; VLE, Vapour-liquid equilibrium; LCVM, Linear combination of
Vidal and Michelsen mixing rules; MHV2, Second-order modified Huron-Vidal mixing rule;
Page 29 of 38
ACS Paragon Plus Environment
Industrial & Engineering Chemistry Research
123456789101112131415161718192021222324252627282930313233343536373839404142434445464748495051525354555657585960

30
UNIQUAC, Universal quasi-chemical activity coefficient model; WAT, Wax appearance
temperature; AAE, Average absolute error; ARE, Average relative error; SLE, Solid-liquid
equilibrium; SLVE, Solid-liquid-vapour equilibrium.
REFERENCES
(1) Pan, H.; Firoozabadi, A.; Fotland, P. Pressure and Composition Effect on Wax
Precipitation: Experimental Data and Model Results. SPE Prod. Facil. 1997, 12 (4),
250–258.
(2) Pauly, J.; Coutinho, J. A. P.; Daridon, J. L. High Pressure Phase Equilibria in
Methane+waxy Systems. 3. Methane+a Synthetic Distribution of Paraffin Ranging
from N-C13 to N-C22. Fluid Phase Equilib. 2012, 313, 32–37.
(3) Daridon, J. L.; Pauly, J.; Coutinho, J. A. P.; Montel, F. Solid-Liquid-Vapor Phase
Boundary of a North Sea Waxy Crude: Measurement and Modeling. Energy and Fuels
2001, 15 (3), 730–735.
(4) Prausnitz, J. M.; Lichtenthaler, R. N.; de Azevedo, E. G. Molecular Thermodynamics
of Fluid-Phase Equilibria; Pearson Education, 1998.
(5) Ghanaei, E.; Esmaeilzadeh, F.; Fathikaljahi, J. Wax Formation from Paraffinic
Mixtures: A Simplified Thermodynamic Model Based on Sensitivity Analysis
Together with a New Modified Predictive UNIQUAC. Fuel 2012, 99, 235–244.
(6) Soave, G. Equilibrium Constants from a Modified Redlich-Kwong Equation of State.
Chem. Eng. Sci. 1972, 27 (6), 1197–1203.
(7) Jaubert, J. N.; Mutelet, F. VLE Predictions with the Peng-Robinson Equation of State
and Temperature Dependent Kij Calculated through a Group Contribution Method.
Page 30 of 38
ACS Paragon Plus Environment
Industrial & Engineering Chemistry Research
123456789101112131415161718192021222324252627282930313233343536373839404142434445464748495051525354555657585960

31
Fluid Phase Equilib. 2004, 224 (2), 285–304.
(8) Qian, J.-W.; Jaubert, J. N.; Privat, R. Prediction of the Phase Behavior of Alkene-
Containing Binary Systems with the PPR78 Model. Fluid Phase Equilib. 2013, 354,
212–235.
(9) Peng, D.-Y.; Robinson, D. B. A New Two-Constant Equation of State. Ind. Eng.
Chem. Fundam. 1976, 15 (1), 59–64.
(10) Jaubert, J. N.; Privat, R. Relationship between the Binary Interaction Parameters (Kij)
of the Peng-Robinson and Those of the Soave-Redlich-Kwong Equations of State:
Application to the Definition of the PR2SRK Model. Fluid Phase Equilib. 2010, 295
(1), 26–37.
(11) Boukouvalas, C.; Magoulas, K. G.; Stamataki, S. K.; Tassios, D. P. Prediction of
Vapor−liquid Equilibria with the LCVM Model: Systems Containing Light Gases with
Medium and High Molecular Weight Compounds. Ind. Eng. Chem. Res. 1997, 36 (12),
5454–5460.
(12) Pauly, J.; Daridon, J. L.; Coutinho, J. A. P.; Lindeloff, N.; Andersen, S. I. Prediction of
Solid-Fluid Phase Diagrams of Light Gases-Heavy Paraffin Systems up to 200 MPa
Using an Equation of State-GE Model. Fluid Phase Equilib. 2000, 167 (2), 145–159.
(13) Pauly, J.; Daridon, J. L.; Coutinho, J. A. P. Measurement and Prediction of
Temperature and Pressure Effect on Wax Content in a Partially Frozen Paraffinic
System. Fluid Phase Equilib. 2001, 187-188, 71–82.
(14) Pauly, J.; Daridon, J. L.; Sansot, J. M.; Coutinho, J. A. P. The Pressure Effect on the
Wax Formation in Diesel Fuel. Fuel 2003, 82 (5), 595–601.
Page 31 of 38
ACS Paragon Plus Environment
Industrial & Engineering Chemistry Research
123456789101112131415161718192021222324252627282930313233343536373839404142434445464748495051525354555657585960
32
(15) Pauly, J.; Daridon, J. L.; Coutinho, J. A. P. Solid Deposition as a Function of
Temperature in the nC10 + (nC24-nC25-nC26) System. Fluid Phase Equilib. 2004,
224 (2), 237–244.
(16) Coutinho, J. A. P.; Pauly, J.; Daridon, J. L. Modelling Phase Equilibria in Systems
with Organic Solid Solutions. Comput. Aided Prop. Estim. Process Prod. Des. 2004,
229–249.
(17) Dahl, S.; Fredenslund, A.; Rasmussen, P. The MHV2 Model: A UNIFAC-Based
Equation of State Model for Prediction of Gas Solubility and Vapor-Liquid Equilibria
at Low and High Pressures. Ind. Eng. Chem. Res. 1991, 30 (8), 1936–1945.
(18) Nasrifar, K.; Moshfeghian, M. Multiphase Equilibria of Waxy Systems with Predictive
Equations of State and a Solid Solution Model. Fluid Phase Equilib. 2012, 314, 60–68.
(19) Nasrifar, K.; Fani-Kheshty, M. Effect of Pressure on the Solid-Liquid Equilibria of
Synthetic Paraffin Mixtures Using Predictive Methods. Fluid Phase Equilib. 2011, 310
(1-2), 111–119.
(20) Craig, S. R.; Hastie, G. P.; Roberts, K. J.; Gerson, A. R.; Sherwood, J. N.; Tack, R. D.
Investigation into the Structures of Binary-, Tertiary- and Quinternary-Mixtures of N-
Alkanes and Real Diesel Waxes Using High-Resolution Synchrotron X-Ray Powder
Diffraction. J. Mater. Chem. 1998, 8 (4), 859–869.
(21) Dirand, M.; Chevallier, V.; Provost, E.; Bouroukba, M.; Petitjean, D. Multicomponent
Paraffin Waxes and Petroleum Solid Deposits: Structural and Thermodynamic State.
Fuel 1998, 77 (12), 1253–1260.
(22) Chevallier, V.; Provost, E.; Bourdet, J. B.; Bouroukba, M.; Petitjean, D.; Dirand, M.
Page 32 of 38
ACS Paragon Plus Environment
Industrial & Engineering Chemistry Research
123456789101112131415161718192021222324252627282930313233343536373839404142434445464748495051525354555657585960

33
Mixtures of Numerous Different N-Alkanes: 1. Structural Studies by X-Ray
Diffraction at Room Temperature Correlation between the Crystallographic Long c
Parameter and the Average Composition of Multi-Alkane Phases. Polymer 1999, 40
(8), 2121–2128.
(23) Chevallier, V.; Petitjean, D.; Bouroukba, M.; Dirand, M. Mixtures of Numerous
Different N-Alkanes: 2. Studies by X-Ray Diffraction and Differential Thermal
Analyses with Increasing Temperature. Polymer 1999, 40 (8), 2129–2137.
(24) Coutinho, J. A. P.; Stenby, E. H. Phase Equilibria in Petroleum Fluids: Multiphase
Regions and Wax Formation, PhD Thesis. Technical University of Denmark, 1995.
(25) Coutinho, J. A. P.; Daridon, J. L. Low-Pressure Modeling of Wax Formation in Crude
Oils. Energy and Fuels 2001, 15 (6), 1454–1460.
(26) Coutinho, J. A. P.; Mirante, F.; Pauly, J. A New Predictive UNIQUAC for Modeling
of Wax Formation in Hydrocarbon Fluids. Fluid Phase Equilib. 2006, 247 (1-2), 8–17.
(27) Dirand, M.; Bouroukba, M.; Briard, A. J.; Chevallier, V.; Petitjean, D.; Corriou, J.-P.
Temperatures and Enthalpies of (Solid + Solid) and (Solid + Liquid) Transitions of N-
Alkanes. J. Chem. Thermodyn. 2002, 34 (8), 1255–1277.
(28) Abrams, D. S.; Prausnitz, J. M. Statistical Thermodynamics of Liquid Mixtures : A
New Expression for the Excess Gibbs Energy of Partly or Completely Miscible
Systems. AIChE J. 1975, 21 (1), 116–128.
(29) Coutinho, J. A. P. Predictive UNIQUAC: A New Model for the Description of
Multiphase Solid-Liquid Equilibria in Complex Hydrocarbon Mixtures. Ind. Eng.
Chem. Res. 1998, 37 (12), 4870–4875.
Page 33 of 38
ACS Paragon Plus Environment
Industrial & Engineering Chemistry Research
123456789101112131415161718192021222324252627282930313233343536373839404142434445464748495051525354555657585960

34
(30) Morawski, P.; Coutinho, J. A. P.; Domańska, U. High Pressure (Solid + Liquid)
Equilibria of N-Alkane Mixtures: Experimental Results, Correlation and Prediction.
Fluid Phase Equilib. 2005, 230 (1-2), 72–80.
(31) Ghanaei, E.; Esmaeilzadeh, F.; Fathikaljahi, J. High Pressure Phase Equilibrium of
Wax: A New Thermodynamic Model. Fuel 2014, 117, 900–909.
(32) Ghanaei, E.; Esmaeilzadeh, F.; Fathikaljahi, J. A New Predictive Thermodynamic
Model in the Wax Formation Phenomena at High Pressure Condition. Fluid Phase
Equilib. 2007, 254 (1-2), 126–137.
(33) Milhet, M.; Pauly, J.; Coutinho, J. A. P.; Dirand, M.; Daridon, J. L. Liquid–solid
Equilibria under High Pressure of Tetradecane+pentadecane and
Tetradecane+hexadecane Binary Systems. Fluid Phase Equilib. 2005, 235 (2), 173–
181.
(34) Tanaka, Y.; Kawakami, M. Solid-Liquid Phase Equilibria in Binary (Benzene,
Cyclohexane + N-Tetradecane, N-Hexadecane) Systems at Temperatures 230–323 K
and Pressures up to 120 MPa. Fluid Phase Equilib. 1996, 125 (1-2), 103–114.
(35) Pauly, J.; Coutinho, J. A. P.; Daridon, J. L. High Pressure Phase Equilibria in Methane
+ Waxy Systems. 1. Methane + Heptadecane. Fluid Phase Equilib. 2007, 255 (2),
193–199.
(36) Machado, J. J. B.; de Loos, T. W.; Christian Ihmels, E.; Fischer, K.; Gmehling, J. High
Pressure Solid-Solid and Solid-Liquid Transition Data for Long Chain Alkanes. J.
Chem. Thermodyn. 2008, 40 (12), 1632–1637.
(37) Machado, J. J. B.; de Loos, T. W.; Ihmels, E. C.; Fischer, K.; Gmehling, J. Erratum to
Page 34 of 38
ACS Paragon Plus Environment
Industrial & Engineering Chemistry Research
123456789101112131415161718192021222324252627282930313233343536373839404142434445464748495051525354555657585960

35
“High Pressure Solid–solid and Solid–liquid Transition Data for Long Chain Alkanes
[J. Chem. Thermodyn. 40 (2008) 1632–1637].” J. Chem. Thermodyn. 2009, 41 (5),
716.
(38) Machado, J. J. B.; de Loos, T. W. High Pressure Solid-Fluid and Vapour-Liquid
Equilibria in Model Hyperbaric Fluids: The System Methane + Tetracosane +
Triacontane. Fluid Phase Equilib. 2004, 226 (1-2), 83–90.
(39) van der Kooi, H. J.; Flöter, E.; Loos, T. W. d. High-Pressure Phase Equilibria of
{(1−x)CH4+xCH3(CH2)18CH3}. J. Chem. Thermodyn. 1995, 27 (8), 847–861.
(40) Ji, H.; Tohidi, B.; Danesh, A.; Todd, A. C. Wax Phase Equilibria: Developing a
Thermodynamic Model Using a Systematic Approach. Fluid Phase Equilib. 2004, 216
(2), 201–217.
(41) Aucejo, A.; Burguet, M. C.; Munoz, R.; Marques, J. L. Densities, Viscosities, and
Refractive Indices of Some N-Alkane Binary Liquid Systems. J. Chem. Eng. Data
1995, 40 (1), 141–147.
(42) Dzida, M.; Cempa, M. Thermodynamic and Acoustic Properties of
(Heptane+dodecane) Mixtures under Elevated Pressures. J. Chem. Thermodyn. 2008,
40 (10), 1531–1541.
(43) Seiler, M.; Gross, J.; Bungert, B.; Sadowski, G.; Arlt, W. Modeling of Solid/fluid
Phase Equilibria in Multicomponent Systems at High Pressure. Chem. Eng. Technol.
2001, 24 (6), 607–612.
(44) Smith, J. M.; Van Ness, H. C.; Abbott, M. M. Introduction to Chemical Engineering
Thermodynamics, 5th ed.; McGraw-Hill: New York, 1996.
Page 35 of 38
ACS Paragon Plus Environment
Industrial & Engineering Chemistry Research
123456789101112131415161718192021222324252627282930313233343536373839404142434445464748495051525354555657585960

36
(45) Schaerer, A. A.; Busso, C. J.; Smith, a. E.; Skinner, L. B. Properties of Pure Normal
Alkanes in the C17 to C36 Range. J. Am. Chem. Soc. 1955, 77 (7), 2017–2019.
(46) Rodriguez-Reartes, S. B.; Cismondi, M.; Zabaloy, M. S. Modeling Approach for the
High Pressure Solid-Fluid Equilibrium of Asymmetric Systems. Ind. Eng. Chem. Res.
2011, 50 (5), 3049–3059.
(47) Bhat, N. V.; Mehrotra, A. K. Measurement and Prediction of the Phase Behavior of
Wax - Solvent Mixtures : Significance of the Wax Dis Appearance Temperature. Ind.
Eng. Chem. Res. 2004, 43, 3451–3461.
(48) Hammami, A.; Ratulowski, J.; Coutinho, J. A. P. Cloud Points: Can We Measure or
Model Them? Pet. Sci. Technol. 2003, 21 (3-4), 345–358.
(49) Glaser, M.; Peters, C. J.; van der Kooi, H. J.; Lichtenthaler, R. N. Phase Equilibria of (
Methane +n-Hexadecane) and (p,Vm,T) of N-Hexadecane. J. Chem. Thermodyn. 1985,
17, 803–815.
(50) Flöter, E.; Hollanders, B.; de Loos, T. W.; de Swaan Arons, J. The Effect of the
Addition of Water, Propane, or Docosane on the Vapour–liquid and Solid–fluid
Equilibria in Asymmetric Binary N-Alkane Mixtures. Fluid Phase Equilib. 1998, 143
(1-2), 185–203.
(51) Flöter, E.; de Loos, T. W.; de Swaan Arons, J. High Pressure Solid-Fluid and Vapour-
Liquid Equilibria in the System (Methane + Tetracosane). Fluid Phase Equilib. 1997,
127 (1-2), 129–146.
(52) Machado, J. J. B.; de Loos, T. W. Liquid-Vapour and Solid-Fluid Equilibria for the
System Methane + Triacontane at High Temperature and High Pressure. Fluid Phase
Page 36 of 38
ACS Paragon Plus Environment
Industrial & Engineering Chemistry Research
123456789101112131415161718192021222324252627282930313233343536373839404142434445464748495051525354555657585960

37
Equilib. 2004, 222-223, 261–267.
(53) Rodrigues, A. B.; Kohn, J. P. Three Phase Equilibria in the Binary Systems Ethane-N-
Docosane and Ethane-N-Octacosane. J. Chem. Eng. Data 1967, 12 (2), 191–193.
(54) Puri, S.; Kohn, J. P. Solid-Liquid-Vapor Equilibrium in the Methane-N-Eicosane and
Ethane-N-Eicosane Binary Systems. J. Chem. Eng. Data 1970, 15 (3), 372–374.
(55) Estrera, S. S.; Luks, K. D. Liquid-Liquid-Vapor Equilibria Behavior of Certain
Ethane+ N-Paraffin Mixtures. J. Chem. Eng. Data 1987, 32 (2), 201–204.
(56) Peters, C. J.; Spiegelaar, J.; de Swaan Arons, J. Phase Equilibria in Binary Mixtures of
Ethane+ Docosane and Molar Volumes of Liquid Docosane. Fluid Phase Equilib.
1988, 41 (3), 245–256.
(57) Peters, C. J.; De Roo, J. L.; Lichtenthaler, R. N. Measurements and Calculations of
Phase Equilibria in Binary Mixtures of Ethane+ Eicosane: Part 3. Three-Phase
Equilibria. Fluid Phase Equilib. 1991, 69, 135–143.
(58) Peters, C. J.; De Roo, J. L.; de Swaan Arons, J. Measurements and Calculations of
Phase Equilibria in Binary Mixtures of Propane+ Tetratriacontane. Fluid Phase
Equilib. 1992, 72, 251–266.
(59) Gregorowicz, J. Phase Behaviour in the Vicinity of the Three-Phase Solid-Liquid-
Vapour Line in Asymmetric Nonpolar Systems at High Pressures. Fluid Phase
Equilib. 2006, 240 (1), 29–39.
(60) Pauly, J.; Coutinho, J. A. P.; Daridon, J. L. High Pressure Phase Equilibria in
Methane+waxy Systems. 2. Methane+waxy Ternary Mixture. Fluid Phase Equilib.
2010, 297 (1), 149–153.
Page 37 of 38
ACS Paragon Plus Environment
Industrial & Engineering Chemistry Research
123456789101112131415161718192021222324252627282930313233343536373839404142434445464748495051525354555657585960

38
(61) Daridon, J. L.; Xans, P.; Montel, F. Phase Boundary Measurement on a Methane +
Decane + Multi-Paraffins System. Fluid Phase Equilib. 1996, 117 (1-2), 241–248.
(62) Coutinho, J. A. P.; Daridon, J. L. The Limitations of the Cloud Point Measurement
Techniques and the Influence of the Oil Composition on Its Detection. Pet. Sci.
Technol. 2005, 23 (9-10), 1113–1128.
(63) Daridon, J. L.; Dauphin, C. Measurement of Pressure Effect on Wax Content in
Partially Frozen Paraffinic Systems. Meas. Sci. Technol. 1999, 10 (12), 1309–1314.
TOC Graphic
Page 38 of 38
ACS Paragon Plus Environment
Industrial & Engineering Chemistry Research
123456789101112131415161718192021222324252627282930313233343536373839404142434445464748495051525354555657585960


