
A NEW REGIONAL POLICY FOR THE UK - Université du...
128
A NEW REGIONAL POLICY FOR THE UK John Adams, Peter Robinson and Anthony Vigor
Transcript of A NEW REGIONAL POLICY FOR THE UK - Université du...
A NEWREGIONALPOLICY FORTHE UK
John Adams, Peter Robinsonand Anthony Vigor

30-32 Southampton Street, London WC2E 7RATel: 020 7470 6100 Fax: 020 7470 [email protected] charity 800065
The Institute for Public Policy Research (ippr), established in 1988, is Britain’s leadingindependent think tank on the centre left. The values that drive our work include deliveringsocial justice, deepening democracy, increasing environmental sustainability and enhancinghuman rights. Through our well-researched and clearly argued policy analysis, our publications,our media events, our strong networks in government, academia and the corporate andvoluntary sector, we play a vital role in maintaining the momentum of progressive thought.
ippr’s aim is to bridge the political divide between the social democratic and liberal traditions,the intellectual divide between the academics and the policy makers and the cultural dividebetween the policy-making establishment and the citizen. As an independent institute, we havethe freedom to determine our research agenda. ippr has charitable status and is funded by amixture of corporate, charitable, trade union and individual donations.
Research is ongoing, and new projects being developed, in a wide range of policy areas includingsustainability, health and social care, social policy, citizenship and governance, education,economics, democracy and community, media and digital society and public private partnerships.We shall shortly open an office in Newcastle: ippr north.
For further information you can contact ippr’s external affairs department on [email protected], youcan view our website at www.ippr.org and you can buy our books from Central Books on 0845458 9910 or email [email protected].
Trustees
Production & design by E M P H A S I SISBN 1 86030 224 6© IPPR 2003
Chris Powell (Chairman)
Professor KumarBhattacharyya
Lord BrookeLord EatwellLord GavronChris Gibson SmithProfessor Anthony
Giddens
Chai Patel (Secretary)
Lord HollickJane HumphriesRoger Jowell Neil Kinnock Richard LambertProfessor David
MarquandFrances O’Grady
Jeremy Hardie (Treasurer)
David Pitt-WatsonDave PrentisLord PuttnamSir Martin ReesJan Royall Ed SweeneyBaroness WilliamsBaroness Young of
Old Scone

Contents
ForewordAcknowledgementsAbout the authors
Executive summary i
1. Introduction 1
2. The scale of the challenge 12
3. Employment and regional policy 30
4. The regional skills, education and training agenda 49
5. Science, innovation and the regions 61
6. Enterprise policy 71
7. Public spending and investment 79
8. Governance issues 93
9. A modern regional economic policy 102
References 105

The regional skills, education and training agenda
There is a fairly clear ‘north-south gap’ across the English regions in terms ofqualifications: London and the South East have significantly higher proportions of theworking age population with higher education qualifications and lower proportions ofthe population with no qualifications.
This gap is a consequence of differences in educational attainment at 16 andstaying on rates post-16, but is also a consequence of out-migration of the betterqualified to more prosperous regions, where a higher proportion of better jobs is onoffer.
Recent moves to regionalise the local Learning and Skills Councils’ budgets are ared herring: it is impossible for the public sector to plan to match the skills of theworkforce to the demands of employers. Individuals should make their own decisionsover further education and training. RDAs should focus on increasing the demand forskills from employers, in itself a very difficult agenda.
One recent issue flagged up by the Chancellor is whether the UK has sufficientregional and local variation in pay. Although national pay setting is the norm inboth the private and the public sector, in practice there is much local discretion toreflect local circumstances.
In general the labour market does not seem to be failing in a profound way toallocate labour efficiently across the regions, although there are specific problemsincluding parts of the public sector. Successful congested regions should bear thecosts of higher pay for public sector workers.
Science, innovation and the regions
Innovation policy has been driven by vague concepts, such as the creation of a‘knowledge-based economy’. An evidence-based approach should replace the ‘guru-led’ approach we have at present.
One of the reasons why this has not happened is the paucity of goodevidence from rigorous evaluation. A large element of innovation policy shouldbe focused on dissemination and on what must seem rather mundane initiatives,such as human resource management or modest improvements in managementpractice. At present we do not even have a methodology by which to measuresuch things.
The most common proxy for innovation is spending on Research andDevelopment (R&D) and there are clear regional differences in business, highereducation and directly government-funded R&D.
A different picture emerges from the UK Innovation Survey, which concluded thatthere were few substantial differences between regions. This survey is still in its infancy
iv A new regional policy for the UK
Acknowledgements
The Institute for Public Policy Research (ippr) would like to thank our project partnersand sponsors. Without their willingness to invest and contribute to our research thisproject could not have been undertaken. Our thanks go to ESRC DevolutionProgramme; Housing Corporation; London Development Agency; North EastAssembly; Northern Ireland Government Departments; North West DevelopmentAgency; One NorthEast; Yorkshire Forward.
The findings of our research are, however, the responsibility of the authors aloneand do not necessarily represent the views of our funding partners or any otherindividual or organisation involved with the project.
We would like to thank all those who have contributed to the ideas contained inthis report, through seminars and informal discussions. In particular: HarveyArmstrong (University of Sheffield); John Bachtler (Strathclyde University); DavidCharles (University of Newcastle); Steve Fothergill (Sheffield Hallam University);Andrew Glyn (Oxford University); Mark Goodwin (University of Aberystwyth); CllrSteve Houghton (Leader of Barnsley Council); Alan Hughes (Cambridge Centre forBusiness Research); Andrew Hughes-Hallett (University of Cardiff); Charlie Jeffery(University of Birmingham); Iain McLean (Oxford University); Kevin Morgan(University of Cardiff); Neil Mundy (One NorthEast); Tom Riordan (YorkshireForward); Fred Robinson (University of Durham); David Storey (Warwick BusinessSchool); Adam Tickell (University of Bristol) and Michael Ward (LondonDevelopment Agency).
Many officials in Whitehall and devolved and regional institutions providedsignificant contributions to the seminars and helpful general discussions. We aregrateful they were able to find time within their busy schedules to contribute theirknowledge. We respect their wish to remain anonymous.
We would also like to thank the following individuals from within ippr: RichardBrooks, Jesse Caplan, Tony Grayling, James Hulme, Rachel O’Brien, Sue Regan,Beatrice Stern, Helena Scott, and Matthew Taylor.

About the authors
John Adams is a Senior Research Fellow at the Institute for Public Policy Research(ippr). He is responsible for research in the areas of devolution and regional policyand is co-ordinating the creation of ippr north – ippr’s new office in Newcastle.
John helped draw up the Labour Party proposals for a Welsh Assembly in the run-up to the 1997 General Election, and was a Special Advisor at the Welsh Office in1997-98. He was a co-editor of the joint ippr/ESRC publication Devolution inPractice. He is a member of the Advisory Board of the ESRC Devolution programmeand the Board of the Campaign for the English Regions (CFER) and is a VisitingFellow at CURDS at the University of Newcastle.
Peter Robinson has been Senior Economist at the ippr since 1997. He leads the ipprteam dealing with economic and employment policy issues and is also closely involvedin the Institute’s work on education and training policy.
He was co-author of ippr’s report Opportunity for Whom? on the funding andstructure of post-16 education; and co-author of Building Better Partnerships, the finalreport resulting from ippr’s Commission on Public Private Partnerships. He is aResearch Associate at the Centre for Economic Performance at the London School ofEconomics.
Anthony Vigor is Research Assistant in devolution and regional policy at the ippr.He joined ippr earlier this year from the University of Manchester were he undertooka PhD in the politics of regional economic development within the UK and US.
Anthony is particularly interested in issues of devolution, economic development,urban regeneration and community development, and has published articles in LocalEconomy and the Municipal Journal. Anthony has also worked extensively on theopening of ippr’s new office in Newcastle.

Executive summary
The ‘North’ is poorer than the ‘South’. Although some dispute the existence of a‘north-south gap’ in prosperity, it is clear that within the UK there is a ‘winner’scircle’ in the Greater South East of the UK (consisting of London, the East of Englandand South East regions and parts of the South West). The rest of the country has lowerlevels of prosperity, and three regions lag significantly: Northern Ireland, Wales andthe North East of England.
There is a growing consensus that these regional disparities need to be tackled anda variety of reasons have forced this issue up the political agenda:
� the gap in regional prosperity has been growing since the economic recoverybegan in 1992-93;
� the enlargement of the EU will mean that after 2006 the poorer UK regionswill cease to receive the same degree of EU Structural Funds on which theycurrently rely so heavily;
� the sustained regional voice provided by the Deputy Prime Minister has beensupplemented by the rise of HM Treasury as champions of Labour’s ‘NewRegional Policy’.
In the Spending Review of 2002, the Chancellor announced a new Public SpendingAgreement (PSA) target to ‘over the long term reduce the persistent gap in growthrates between the regions’. This is a highly significant shift in Government policy andis to be welcomed. However, it only applies to England when it should apply to thewhole of the UK. Furthermore, it is a target to reduce the gap in growth rates, not toclose absolute disparities. The Government might meet this target at the same time asregional economic disparities continue to grow.
The scale of the challenge
The headline measure of output or Gross Value Added (GVA) per head is not the onlyuseful indicator for analysing regional economic disparities.
1. GVA is a function of differences in productivity and employment. The relativeimportance of each will vary from region to region. In lagging regions thenumbers claiming benefits relating to sickness and disability dwarf thoseclaiming benefits relating to unemployment.
2. There are clearly differences in prosperity within as well as between regions.However, GVA is an unreliable measure at this smaller spatial scale. A moreobvious measure of economic prosperity at this scale is levels of employment.
i

3. GVA is a measure of output, not a measure of income available to households.Transfer payments through the tax and benefit system reduce but do noteliminate regional disparities.
4. The use of GVA fails to highlight London’s high levels of child poverty, but taxand benefit policies are more important than regional policy instruments intackling this problem.
5. Using only GVA does nothing to indicate an individual’s ‘happiness’. Thisdepends on such factors as income, employment and health. Significantregional disparities exist in each of these areas. Claims that the ‘North’ ispoorer but happier than the ‘South’ are profoundly mistaken.
6. Using GVA fails to take account of the condition of the natural environment.The Greater South East needs to address the immediate problems of successsuch as congestion. In lagging regions, the need to boost growth rates cannotprivilege economic over environmental concerns.
The market is not acting effectively to reduce regional economic disparities. Highcosts in the ‘South’ should generate incentives for firms and people to locate todisadvantaged regions but public policy is currently blunting incentives to relocate byoffsetting the problems faced by successful congested regions.
It is as unhelpful to argue that the ‘South should be left to stew’ as it is to arguethat London ‘drives’ the UK economy. The role of London in the UK economy needsto be carefully addressed: most employment in London is not directly associated withinternational markets and there is a relationship of interdependence with the rest of theUK. Worrying about whether London drives the UK economy or vice-versa ispointless. The housing and transport needs of the Greater South East should beaddressed, but this should be paid for within the region.
Employment and regional policy
Levels of employment vary significantly within and between regions. In the GreaterSouth East there is a broad swathe of areas with close to full employment. Manylagging regions have much lower employment rates. Major cities, including London,also have low employment rates.
The most important dispute in regional economic policy is to what extentdifferences in employment rates reflect ‘demand-side’ or ‘supply-side’ problems. Thatis, whether there are differences in employment opportunities or whether unemployedpeople are unable to get the jobs which do exist. The Government would emphasisethe latter and would claim that areas of high unemployment lie within easy travellingdistance of areas where vacancies are plentiful.
ii A new regional policy for the UK

However, there are areas with low levels of employment not within easy travellingdistance of anywhere with a tight labour market. For example, Hartlepool bordersMiddlesborough and Stockton, and Sunderland and Durham. Similar observationscan be made of Northern Ireland, West Wales and the Valleys and industrial WestCumbria.
On the other hand, the Treasury argument does carry some force in largemetropolitan areas like London or Glasgow. Concentrations of non-employment inHackney are not due to a lack of jobs locally. This misunderstands the way that thehousing and labour markets work in London. Individuals who face barriers tosecuring employment are concentrated in certain areas where housing is cheaper orsocially provided. They need support to help them overcome these barriers.
Worklessness in Hackney is different to worklessness in Hartlepool. There is noHackney labour market, but there is a distinct Hartlepool labour market. Theresidents of Hackney need a robust London labour market and supply-sidemeasures to help them access jobs across the whole of the metropolitan labourmarket. The residents of Hartlepool require similar supply-side measures, butcombined with policy instruments designed to create more jobs within easytravelling distance.
Full employment requires a strong national economy, a strong regional policy,supply-side measures and measures to reduce residential segregation and the linksbetween segregation and disadvantage.
For those regions with a concentration of Travel-To-Work Areas (TTWAs) withlow employment rates, demand for labour needs to be stimulated. Assisted Areasshould be defined on TTWAs (not wards) – nearby areas of potential growth shouldnot be cut off from support. More emphasis needs to be placed on allocating RSAgrants to service sector companies, to redress the bias towards manufacturing. Thereshould be fewer prestige inward investment projects and more support for the creationand expansion of smaller indigenous enterprises
Eastward expansion of the EU after 2006 is likely to cut the Structural Fundsavailable to lagging regions. The UK Government has advocated a ‘renationalisation’of regional policy and has guaranteed that domestic regional funding would beincreased (although it is unclear to what extent). The European Commission shouldsupport this approach. The EU target of 70 per cent of the adult workforce inemployment by 2010 should provide an important ‘floor target’ for domestic regionalpolicy. UK Government resources could then be targeted on those TTWAs withemployment rates at or below 70 per cent. This could consist of extra resources forRSA, but there should be the flexibility for regional and local agencies to choose whatto fund.
Executive Summary iii

The regional skills, education and training agenda
There is a fairly clear ‘north-south gap’ across the English regions in terms ofqualifications: London and the South East have significantly higher proportions of theworking age population with higher education qualifications and lower proportions ofthe population with no qualifications.
This gap is a consequence of differences in educational attainment at 16 andstaying on rates post-16, but is also a consequence of out-migration of the betterqualified to more prosperous regions, where a higher proportion of better jobs is onoffer.
Recent moves to regionalise the local Learning and Skills Councils’ budgets are ared herring: it is impossible for the public sector to plan to match the skills of theworkforce to the demands of employers. Individuals should make their own decisionsover further education and training. RDAs should focus on increasing the demand forskills from employers, in itself a very difficult agenda.
One recent issue flagged up by the Chancellor is whether the UK has sufficientregional and local variation in pay. Although national pay setting is the norm in boththe private and the public sector, in practice there is much local discretion to reflectlocal circumstances. In general the labour market does not seem to be failing in aprofound way to allocate labour efficiently across the regions, although there arespecific problems including parts of the public sector. Successful congested regionsshould bear the costs of higher pay for public sector workers.
Science, innovation and the regions
Innovation policy has been driven by vague concepts, such as the creation of a‘knowledge-based economy’ and by a small number of individuals who have becomeskilled at promoting their ideas: Michael Porter and ‘cluster theory’; Richard Floridaand the ‘creative class’ and the Boho index; the Work Foundation and ‘Ideopolis’. Anevidence-based approach should replace the ‘guru-led’ approach we have at present.
One of the reasons why this has not happened is the paucity of good evidencefrom rigorous evaluation. A large element of innovation policy should be focused ondissemination and on what must seem rather mundane initiatives, such as humanresource management or modest improvements in management practice. At presentwe do not even have a methodology by which to measure such things.
The most common proxy for innovation is spending on Research andDevelopment (R&D) and there are clear regional differences in business, highereducation and directly government-funded R&D.
A different picture emerges from the UK Innovation Survey, which concluded thatthere were few substantial differences between regions. This survey is still in its infancy
iv A new regional policy for the UK

but its results should not be dismissed as too counter-intuitive. It may be that firms inthe ‘North’ are not less innovative but that there are less of them.
There are very clear regional divides in science spending. A common question iswhether the science base should be regionalised with spending more evenly spreadacross the UK? This is not an easy issue and difficult trade-offs need to be managed:funding science in the Greater South East might exacerbate regional economicdifferentials; regionalising the science base could harm the standing of UK science.There will not always be a ‘win-win’ situation. A centre-left government shouldprioritise regional policy and full-employment.
Some science institutions should be relocated from the Greater South East tolagging regions. This would help create jobs, and it may lead to a culture change thatwould address the concentration of science spending in the South East. Suggestedinstitutions include the seven research councils and the Higher Education FundingCouncil for England. New investment in science could also be ‘top-sliced’ to create aregional science fund.
Enterprise policy
In the UK, debates about enterprise are too focused on small and medium sizedenterprises (SMEs). In truth, enterprise policy is as relevant to large firms as to smallfirms. While SMEs create a large number of new jobs, it is also subject to large-scalejob losses. Notably, a higher proportion of the workforce is employed in SMEs inlagging Northern Ireland and Wales than in ‘prosperous’ London. There seems littlecorrelation between firm size and regional prosperity.
Nearly £8 billion is spent on public sector support for SMEs: £3 billion by DEFRAon agricultural support, £2.6 billion by the Treasury on revenue foregone through taxmeasures, and £2.2 billion on other initiatives. This £2.2 billion is spent on acomplicated and inefficient array of initiatives, particularly external business advice. Apilot scheme is currently in operation where four RDAs are leading the co-ordinationand management of Business Links. It may be too early to judge their success, but thecase for RDAs assuming responsibility is strong.
A great deal of research has tried to establish the characteristics of the moresuccessful entrepreneur. One conclusion is that age is an important determinant, andthe easiest way to promote enterprise is to focus on individuals in their 30s or 40swho are well educated and who have experience of working in a particular sector.
Social enterprise has moved up the political and policy agenda in recent years, butit is not clear how useful it is in improving economic activity or creating jobs.Enterprise Areas are also a recent creation. Their boundaries are drawn at the wardlevel (postcode level in Scotland). However, these deprived areas are unlikely to havea high proportion of the professionals likely to make successful entrepreneurs. A focus
Executive Summary v

on broader TTWAs would be more likely to ensure that Enterprise Areas coverpotential entrepreneurs. Those in ‘hard-to-reach’ communities may start a businessbut, crucially, they would also be within travelling distance should other entrepreneurscreate job opportunities.
Public spending and investment
Despite the significant variations in public expenditure across the nations and regionsof the UK, there is little political likelihood of reforming the so-called Barnett formula.Nevertheless, this debate will not go away and there are many other publicexpenditure issues which are relevant to current debates.
The basic principle of fiscal equalisation must be that any particular area should beable to offer its residents broadly the same level of public services as another arearegardless of its economic prosperity or the tax base. From each region according totheir means, to each according to their ‘needs’.
Defining ‘needs’ is an inherently difficult task but any fair formula would takeinto account:
� the total population
� well-recognised needs such as child poverty or ill-health
� other needs such as the problems posed by high levels of mobility andtransience
� the higher costs of delivering public services in rural areas
� more controversially, the higher costs of delivering public services in congestedregions
Some elements of higher spending will, however, reflect conscious policy choices andthese costs should be borne locally, for example in relation to free personal care inScotland.
It is important to recognise that central government can ensure fiscal equalisationwithout controlling a majority of public expenditure. It can balance ‘needs’ acrossdifferent territories with only 25-30 per cent of total funding, allowing more revenueto be raised locally.
Policy is nudging in this direction, and there do seem to be moves to get some of theproblems of congestion paid for locally. Congestion charging in London is the highestprofile initiative, and it has been suggested that some of the costs of Crossrail could befunded regionally. Furthermore, it seems as if the Office of the Deputy Prime Minister(ODPM) wishes to try to capture more of the increased value of development in housingfor the public purse. Such moves are welcome and should be further developed.
vi A new regional policy for the UK

The Lyons Review of public sector relocation for HM Treasury has to be done ina manner compatible with the needs of the lagging regions. As they have a shortageof high-quality graduate jobs, back-room posts cannot be all that is relocated. If entiredepartments or agencies, for example the Office of the Deputy Prime Minister, theDepartment for Education and Skills and the Department of Health, are moved seniorposts would have to be relocated. Lagging regions also need higher levels of R&D, soinstitutions which could be relocated in this field include the Higher EducationFunding Council and the seven Research Councils. This would be an important jobcreation measure, but it would also help change the cultural attitudes thatdisproportionately fund science in the Greater South East.
Governance issues
One of the distinguishing features of the current renaissance in regional economic policyhas been its emphasis on increased capacity at the regional level: bottom-up not top-down. This is clearly correct, as regional policy cannot be solely run from the centre.However, regional assemblies are a necessary but not sufficient reform for reducingeconomic disparities. The record of Whitehall in this field is far from distinguished.
A bottom-up regional economic policy does not mean that central governmentdoes not retain a responsibility for all parts of the UK: it cannot merely ‘pass thebuck’. The commitment by central government to a target of reducing regionaleconomic disparities is a welcome recognition of this.
Policies must be designed and administered at the best spatial scale if we are to havethe effective delivery of public policy. Otherwise, services will poorly delivered andtaxpayers money wasted: square pegs do not fit round holes. ‘Joined-up government’has received much attention in recent years. However, the spatial debate has receivedmuch less attention, and needs to precede debates on joined-up governance.
For example, it is wrong to try to create jobs in deprived localities as thismisunderstands the way in which the labour market works. It is more effective tocreate jobs in areas attractive to employers but within travelling distance of deprivedcommunities. Good quality transport links would ensure job opportunities areavailable to individuals in areas with high levels of economic inactivity.
Whitehall has a well-deserved reputation for being regionally insensitive. Its role ofbalancing the different and often competing interests of the different parts of the UKis difficult. On balance, it seems as if Whitehall does not sufficiently prioritise theneeds of lagging regions although we do recognise the needs of London particularlyin the area of child poverty. Whitehall must ‘mainstream’ the regional agenda intotheir spending decisions so that policies in areas such as housing, transport andscience policy reduce regional disparities, not reinforce them. The 2004 SpendingReview will be the key test as to whether it is moving in the right direction.
Executive Summary vii

A modern regional economic policy
The ten-point plan for regional economic policy outlined below is deliberately not aset of new spending commitments as we recognise that in the context of the 2004Spending Review resources are constrained. Instead, it flags up some difficult issuesthat need to be addressed and priorities that need to be established.
viii A new regional policy for the UK
Ten point plan for regional economic policy
1 The 2004 Spending Review should set out an unambiguous target to narrowdisparities in output per head across the UK nations and regions. The JointMinisterial Committee on the Economy taking place later in 2003 should beused to agree a target between the Government and devolved administrations.
2 Employment should be given equal weight with productivity as the focus forregional economic policy. Policies are required to increase the demand forlabour in the Assisted Areas, which should be re-defined to cover groups ofTravel-To-Work Areas in lagging regions with employment rates at or below 70per cent so that regional policy instruments can be concentrated.
3 The EU should back the UK position of ‘renationalising’ regional policy. HMTreasury needs to commit significant additional resources to compensate laggingregions for lower levels of EU spending. Regional and local institutions mustdecide how that funding is allocated across different areas of spending.
4 More good quality jobs need to be created in lagging regions to retain graduates.Increasing the proportion of young people and adults with adequate basic skillsand level 2 qualifications are the correct priorities for promoting employment. Aperiod of stability in the administration of learning and skills policy is required.
5 The Government should ‘regionalise the science base’ by relocating keyinstitutions and by ‘top-slicing’ new spending on science for lagging regions.The current concentration of government R&D spending and science institutionsin the Greater South East is inequitable.
6 The Government needs to rationalise services for small and medium sizedenterprises as the number of initiatives and bodies in this area are impossiblycomplex. In particular, if the current pilots are successful the case for RDAsassuming responsibility for Business Links will be very strong.
7 All Whitehall departments need to ‘mainstream’ the regional dimension intotheir spending decisions. Decisions in areas such as housing, transport andscience policy need to reduce regional disparities not reinforce them.

Executive Summary ix
8 Prosperous regions and localities should bear more of the costs of extraspending required to deal with the problems of success. Congestion chargingand capturing increases in land values can only be the start of something biggerin terms of fiscal reform.
9 Several Departments and Agencies should be relocated from the Greater SouthEast to the lagging regions, such as the ODPM, the Higher Education FundingCouncil for England and the seven Research Councils. The Lyons Review mustrelocate senior staff as well as back-room staff.
10 A central research unit for the RDAs and the Core Cities should be created tohelp promote evidence-based policy-making. This should be located in one of thelagging regions.

x A new regional policy for the UK
1. Introduction
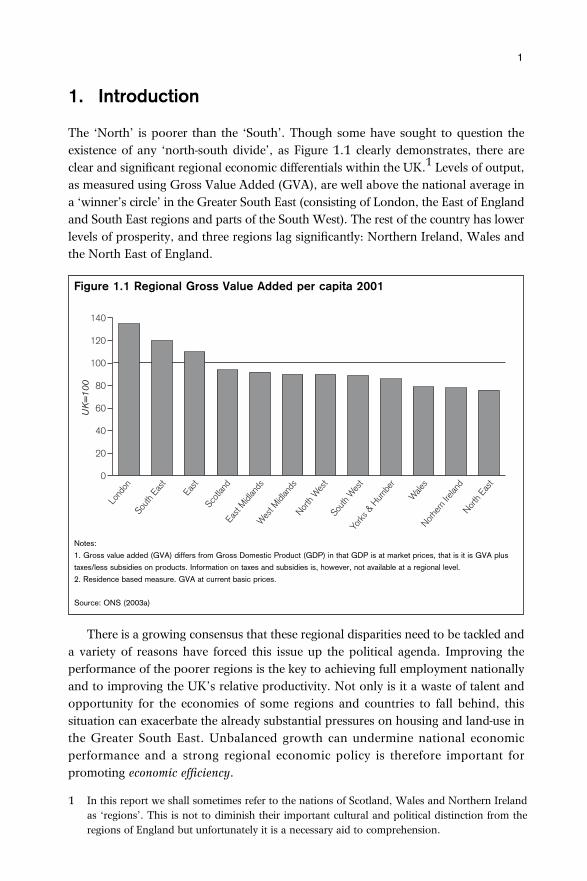
The ‘North’ is poorer than the ‘South’. Though some have sought to question theexistence of any ‘north-south divide’, as Figure 1.1 clearly demonstrates, there areclear and significant regional economic differentials within the UK.1 Levels of output,as measured using Gross Value Added (GVA), are well above the national average ina ‘winner’s circle’ in the Greater South East (consisting of London, the East of Englandand South East regions and parts of the South West). The rest of the country has lowerlevels of prosperity, and three regions lag significantly: Northern Ireland, Wales andthe North East of England.
There is a growing consensus that these regional disparities need to be tackled anda variety of reasons have forced this issue up the political agenda. Improving theperformance of the poorer regions is the key to achieving full employment nationallyand to improving the UK’s relative productivity. Not only is it a waste of talent andopportunity for the economies of some regions and countries to fall behind, thissituation can exacerbate the already substantial pressures on housing and land-use inthe Greater South East. Unbalanced growth can undermine national economicperformance and a strong regional economic policy is therefore important forpromoting economic efficiency.
1
Figure 1.1 Regional Gross Value Added per capita 2001
Notes:
1. Gross value added (GVA) differs from Gross Domestic Product (GDP) in that GDP is at market prices, that is it is GVA plus
taxes/less subsidies on products. Information on taxes and subsidies is, however, not available at a regional level.
2. Residence based measure. GVA at current basic prices.
Source: ONS (2003a)
1 In this report we shall sometimes refer to the nations of Scotland, Wales and Northern Irelandas ‘regions’. This is not to diminish their important cultural and political distinction from theregions of England but unfortunately it is a necessary aid to comprehension.

However, there is also a straightforward equity case for a strong regional economicpolicy: reducing disparities in prosperity across the UK is important for improving thequality of life of individuals. It is unacceptable, particularly for the centre-left, that lifechances should be different depending on which region of the country a person isborn in. Those in the lagging regions suffer from a shorter life and fewer economicopportunities, while those in the Greater South East suffer from a lower quality of lifethan necessary due to overcrowding and congestion.
While not all inequalities are unjust, those that are need to be tackled andeliminated. The systemic regional economic disparities that have existed in the UK forgenerations are quite clearly inequitable. The perception that national UK-wideinstitutions have systematically failed to address this problem exacerbates the sense ofinjustice. This also undermines our solidarity as a nation, as sharp disparitiesundermine the sense of citizenship and cohesion that create a national polity.
In the last few years there has been a remarkable renewal of interest in regionaleconomic policy (for example, Balls and Healey 2000, Regional Studies Association
2 A new regional policy for the UK
Figure 1.2 Regional GVA per capita 1989-2001
Note: Figures for 1997 to 2001 are provisional. GVA at current basic prices.
Source: ONS (2003a)
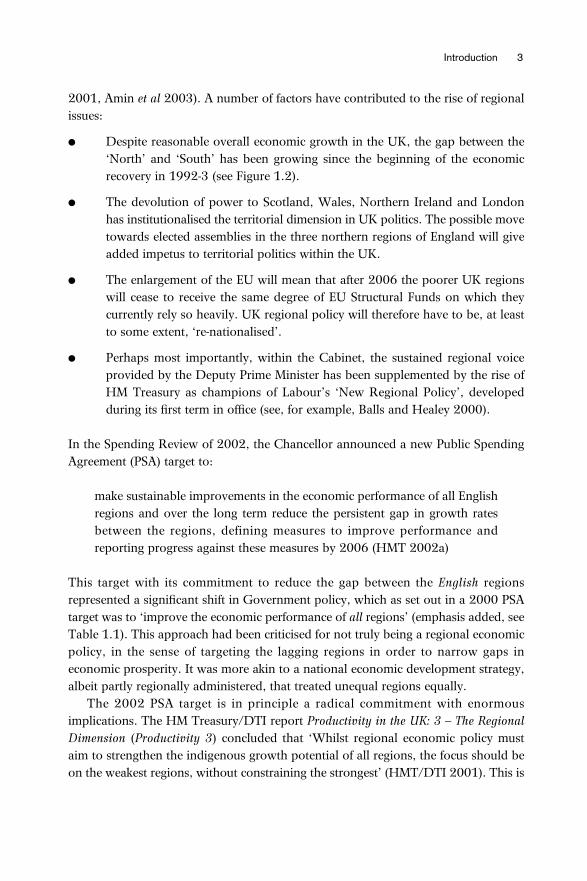
2001, Amin et al 2003). A number of factors have contributed to the rise of regionalissues:
� Despite reasonable overall economic growth in the UK, the gap between the‘North’ and ‘South’ has been growing since the beginning of the economicrecovery in 1992-3 (see Figure 1.2).
� The devolution of power to Scotland, Wales, Northern Ireland and Londonhas institutionalised the territorial dimension in UK politics. The possible movetowards elected assemblies in the three northern regions of England will giveadded impetus to territorial politics within the UK.
� The enlargement of the EU will mean that after 2006 the poorer UK regionswill cease to receive the same degree of EU Structural Funds on which theycurrently rely so heavily. UK regional policy will therefore have to be, at leastto some extent, ‘re-nationalised’.
� Perhaps most importantly, within the Cabinet, the sustained regional voiceprovided by the Deputy Prime Minister has been supplemented by the rise ofHM Treasury as champions of Labour’s ‘New Regional Policy’, developedduring its first term in office (see, for example, Balls and Healey 2000).
In the Spending Review of 2002, the Chancellor announced a new Public SpendingAgreement (PSA) target to:
make sustainable improvements in the economic performance of all Englishregions and over the long term reduce the persistent gap in growth ratesbetween the regions, defining measures to improve performance andreporting progress against these measures by 2006 (HMT 2002a)
This target with its commitment to reduce the gap between the English regionsrepresented a significant shift in Government policy, which as set out in a 2000 PSAtarget was to ‘improve the economic performance of all regions’ (emphasis added, seeTable 1.1). This approach had been criticised for not truly being a regional economicpolicy, in the sense of targeting the lagging regions in order to narrow gaps ineconomic prosperity. It was more akin to a national economic development strategy,albeit partly regionally administered, that treated unequal regions equally.
The 2002 PSA target is in principle a radical commitment with enormousimplications. The HM Treasury/DTI report Productivity in the UK: 3 – The RegionalDimension (Productivity 3) concluded that ‘Whilst regional economic policy mustaim to strengthen the indigenous growth potential of all regions, the focus should beon the weakest regions, without constraining the strongest’ (HMT/DTI 2001). This is
Introduction 3

clearly the correct approach. It is sometimes argued that development controls in the‘South’ could be tightened to induce capital to move north (Morgan 2002). At theheart of this ‘donor-recipient’ model is the influential Barlow Report (1940) whichargued that over- and under- development are two sides of the same coin. However,restricting the supply of land in the ‘South’, for whatever reason, cannot guaranteethat capital will indeed travel north but can guarantee that land and house prices inthe ‘South’ will increase.
It will be the poor who would suffer from such a policy: in the ‘South’ it would bethe least advantaged who would have the greatest difficulty in paying increasedhousing costs, and for those in the ‘North’ the option of inter-regional migration willbe even less likely. The wealthy (from both ‘North’ and ‘South’) would be better ableto cope with the implications of development controls. There may be very validenvironmental reasons to restrict some development in the ‘South’ to maintain andenhance quality of life, but we have to question the implications for economicdevelopment. Therefore (with the exception of public sector institutions discussed inChapter 7) the emphasis should not be on ‘push’ factors but on ‘pull’ factors.
In the words of the Nine English Regional Development Agencies (2003) in theirresponse to the ODPM Select Committee inquiry into reducing regional disparities,‘There will, however, inevitably be the need to exercise some forms of positivediscrimination in certain policy areas to help raise the performance of the laggingregions’ (emphasis added). The form of desirable positive discrimination that might berequired in certain policy areas is discussed throughout this report.
A framework for analysis
Before examining the detail of policy, it is necessary to set out a clear conceptualframework for thinking about and accounting for regional disparities in prosperity.Much of the Government’s focus on regional economic disparities seems to stem fromits concern with the UK’s productivity gap in relation to some comparable countries.This is why it is important to view the regional PSA target in the light of the target tonarrow the productivity gap (see Table 1.1). We think this is a fundamentally limitingapproach in terms of both the analysis of the regional problem and the range ofpolicies necessary to address that problem. Most importantly, it downgrades theimportance of disparities in employment across the UK’s regions, though increasingemployment rates is also a key Government target.
It is also clear that the framework used by the Government to think aboutdifferences in productivity across countries has severe limitations as a way of thinkingabout differences in prosperity across regions. When addressing national economicperformance, the Government makes much use of the five drivers of productivity it hasidentified: skills, enterprise, innovation, competition and investment. However,
4 A new regional policy for the UK

Introduction 5
Table 1.1 PSA targets and regional policy
1998 Spending Review
‘to put in place policies tonarrow the productivity gaprelative to otherindustrialised countries overthe cycle’
DTI, HMT
‘helping people into work; inparticular by helping youngpeople, the long-termunemployed and others at adisadvantage in the labourmarket, including loneparents, to move intosustainable jobs, within a fairand diverse employmentmarket.’
DfES
2000 Spending Review
‘improve the economicperformance of all regionsmeasured by the trend ingrowth of each region’sGDP per capita’
DETR, DTI
‘improve UKcompetitiveness bynarrowing the productivitygap with the US, France,Germany and Japan over theeconomic cycle’
DTI, HMT
‘over the 3 years to 2004increase the employmentrates of disadvantaged areasand groups, taking accountof the economic cycle –people with disabilities, loneparents, ethnic minoritiesand the over 50s, the 30local authority districts withthe poorest initial labourmarket position - and reducethe difference between theiremployment rates and theoverall rate’
DfES
2002 Spending Review
‘make sustainableimprovements in theeconomic performance of allEnglish regions and over thelong term reduce thepersistent gap in growthrates between the regions,defining measures toimprove performance andreporting progress againstthese measures by 2006’
ODPM, DTI, HMT
‘demonstrate progress by2006 on the Government’slong-term objective of raisingthe rate of UK productivitygrowth over the economiccycle, improvingcompetitiveness andnarrowing the productivitygap with the US, France andGermany’
DTI, HMT
‘over the three years toSpring 2006, increase theemployment rates ofdisadvantaged areas andgroups, taking account ofthe economic cycle – loneparents, ethnic minorities,people aged 50 and over,those with the lowestqualifications, and the 30local authority districts withthe poorest initial labourmarket position, andsignificantly reduce thedifference between theiremployment rates and theoverall employment rate.’
DWP

Government documents (including the Productivity 3 report) seem to struggle to makethis framework fit easily with an analysis of regional disparities. Furthermore, thesefive productivity drivers miss out some of the most important drivers of prosperity ata regional and local level, specifically, the efficiency with which labour and housingmarkets operate. We should aim to have a conceptual framework that allows thesetwo critical issues to be addressed.
Our framework is set out in Figure 1.3. In the most straightforward framework,
6 A new regional policy for the UK
Figure 1.3 The drivers of (regional) prosperity
Notes:
1. Gross Value Added (GVA) per head
2. Proportion of working age population in employment and working age population as a proportion of total population
3. GVA per hour worked multiplied by hours of work per employee

differences in overall prosperity as measured by output per head are accounted for bydifferences in productivity and in employment. In turn, it is useful to think about thedrivers of those two important outcomes, which would include the Government’sfive productivity drivers and also the efficient operation of labour and housingmarkets. It is important to stress that a driver like skills may be important for bothproductivity and employment. We can also think of a wide range of policyinstruments, of which only a few are shown in Figure 1.3, that might impact on thedrivers of employment and productivity. We think this represents a much fuller picturefor thinking about the causes of and potential solutions to regional economicdisparities.
The principles of regional policy
There are five key objectives that must be at the heart of future regional policy for theUK as a whole.
1. Making territorial justice an integral part of delivering social andeconomic justice for individuals
The territorial dimension is of vital importance to effective public policy.Although the welfare of individuals is at the core of the concept of socialjustice, the argument that ‘it’s people who are poor, not places’ misses theimpact that geographical situation can have on life chances. If we are todevelop a clear understanding of the different regional economies within theUK and how the gaps in prosperity might be narrowed then we must start withan understanding of the role of territory in public policy.
2. Reducing the long-term differentials in regional economic performance
As we have argued above, reducing regional economic differentials is importantfor promoting economic efficiency, for producing a more equitable distributionof prosperity and for underpinning our solidarity as a nation.
3. Designing industrial and urban policies to meet different regional needs
It is right that governments should have the twin objectives of both increasingthe economic performance of the nation as a whole and striving to ensureequity in regional economic performance. This implies both effective nationaleconomic and regional economic policies. However, it is equally importantthat governments understand the interaction between these different policies,that there may be times when they conflict, and come to terms with the difficulttrade-offs that this entails. Furthermore, national and regional economicpolicies also interact with other policy tools. For example, regeneration
Introduction 7

initiatives such as the Neighbourhood Renewal Fund and the New Deal forCommunities are in large part focused on poorer regions, and so couldcontribute towards reducing regional economic disparities.
4. Developing a more sophisticated understanding of regional disparities,and not simply relying on GDP/GVA per head
GDP or GVA per head is the best measure of regional economic performancethat exists. It is, however, only a relatively narrow measure of economicperformance. In addition to maintaining economic growth and improvingliving standards, we must address the social and environmental problemsfacing our society. Ultimately, the state of our society should be judged, not interms of economic goals alone but in terms of quality of life. Regional policy inthe future must have a more subtle understanding of issues such asenvironmental sustainability, individual welfare or ‘happiness’.
5. Developing the quasi-federal role of the UK government to balance theneeds of the UK’s nations and regions
The Government must develop its quasi-federal role if it is to effectively addressinter-regional disparities (Adams and Robinson 2002). Such a role is entirelycompatible with the principle of devolution and the Government’s ‘bottom-up’approach to regional development. But there will be relative winners and losersif regional policy is to adequately address inter-regional disparities.
Current regional economic priorities
We have acknowledged that the Government has made considerable progress indeveloping its regional economic policy. In particular the setting of a Public ServiceAgreement target for narrowing the persistent gap in growth rates has been a majorstep forward. There has been much criticism of the Whitehall culture of target-setting,with observers rightly pointing out that targets can create some perverse incentives forpublic service organisations to concentrate on what is being measured and with thepotential for some unintended adverse side effects. However, PSA targets are animportant indicator of the Government’s policy priorities and have a major impact interms of concentrating minds in Whitehall. The 2002 PSA target of narrowingregional disparities has led to questions being asked about the regional impact ofpolicies across a range of Whitehall departments. This in itself is a positive outcome.
It has also led to questions being asked about the statistical and evidence base forregional economic policy. The Office for National Statistics had to suspend theirregional output statistics before publishing a new series in August 2003. A majorenquiry into the quality of ONS regional statistics being conducted by Christopher
8 A new regional policy for the UK
Allsopp, a former member of the Monetary Policy Committee, was due to bepublished in Autumn 2003. One issue on which there is wide consensus is the needfor a significant improvement in the quality of regional data.
Unfortunately Whitehall has a habit of setting PSA targets and only then figuringout how to measure progress towards them. The current target on narrowing regionaldisparities has also been criticised for lacking ambition. To see why we have to lookcarefully at its wording.
The 2002 PSA target has three key components:
1. Make sustainable improvements in the economic performance of all Englishregions (emphasis added)
2. Over the long term reduce the persistent gap in growth rates between theregions (emphasis added)
3. Define measures to improve performance and report progress against thesemeasures by 2008.
The first component of the 2002 target is a rewording of the heavily criticised 2000PSA target. This was criticised because it seemed to encourage all the English regionsto improve their trend growth rates and so was not about narrowing regionaldisparities at all. The South East region could increase its growth rate by 0.5 per centand the North East by 0.25 per cent and the target could be met, but of courseregional economic disparities would continue to get worse.
Additionally, the first component only refers to the English regions. Of the threedepartments that own the PSA target, HM Treasury is a UK department and the DTIis a ‘hybrid’ department, exercising significant reserved powers on behalf of the UK.However, the target to narrow the gaps in regional prosperity excludes Scotland,Wales and Northern Ireland. If a commitment to equity between the regions of theUK is at the heart of the Government’s approach – and as a centre-left government, itshould be – then the exclusion of some national territories is puzzling.
The second component of the 2002 target appears to answer the criticism of the2000 target, as it focuses on reducing the gap in growth rates between the regions.However, it should be emphasised that the target is not a commitment to reduceabsolute disparities in prosperity between the regions, though HM Treasury and theDTI have elsewhere committed themselves to reducing absolute disparities in regionalprosperity. The Productivity 3 report identifies ‘the Government’s long-term ambitionof reducing the persistent gap between regions by increasing the growth rate of theworst performing regions’ (HMT/DTI 2001: 55). This ambition does not, however,have the impact of a PSA target.
To see why the 2002 PSA target does not commit the Government to reducingabsolute disparities we must look at the estimates of trend growth rates in GVA per
Introduction 9

head in the regions contained in Table 1.2. The first column shows DTI estimatesmade in the first half of 2003 of trend growth rates for the English regions. Twopoints can be made. First, it is worrying that as a UK department the DTI feels underno obligation to provide statistical evidence on a consistent basis for all the UK’snations and regions: federal departments in all federal countries are obliged to producedata consistently for all parts of that country.
Second, if these estimates are correct, if the South East increased its growth rate by0.25 per cent and the North East by 0.5 per cent, this would narrow regionaldisparities in growth rates as the second component of the 2002 PSA target demands.However, GVA per head in the South East would still be growing at 2.75 per cent perannum compared with 1.75 per cent in the North East, so absolute disparities inGVA per head would still be widening. The Government would claim to be meetingits PSA target and its critics would point out that the ‘north-south gap’ was stillgrowing. In fact this seems a rather likely outcome.
However, there is a further point to be made about the 2002 PSA target.Estimating trend growth rates is an art even at the national level; at the regional level
10 A new regional policy for the UK
Table 1.2 Estimated trend growth rate in GVA per head in the English regionsand the UK's nations
UK nations and regions % per annum over the 1990s
DTI EBS
South East 2.5 2.5East 2.25 2.25London 2.0 1.5Average 2.25 2.05
West Midlands 2.0 2.0East Midlands 2.0 2.0Yorkshire and Humber 2.0 2.0South West 1.75 2.0North West 1.50 1.75North East 1.25 1.75Average 1.75 1.95
Scotland Not available 2.0Northern Ireland Not available 2.0Wales Not available 1.5
UK/England average 2.0 2.0
Note: These estimates were made before the August 2003 revisions to GVA data.
Source: DTI; Experian Business Strategies (2003)

where the data is so poor this is even more the case. There is in fact little agreementover what the trend rates of growth of GVA per head are in the English regions. Thesecond column of Table 1.2 has different estimates of growth rates for the Englishregions and also for the other nations of the UK. There is a particularly big gapbetween the two different estimates for London and for the North East, that is for theUK’s richest and poorest regions. Also if we average out the estimates for the trendgrowth rates in the three regions making up the Greater South East and for the ratesin the six lagging regions, the DTI estimates suggest there is some ground to make upbetween the two sets of regions. However, if we average out the estimates in thesecond column, there is in fact little difference in the trend growth rates between thetwo sets of regions.
So the Government has given itself a target to meet where:
a. there is little agreement about how to measure whether the target is being met,and
b. even if the target is met, in theory and probably in practice absolute disparitiesin prosperity between the ‘North’ and ‘South’ could get worse.
Conclusion: a new PSA target for 2004?
This leads to the obvious conclusion that the Government needs to develop a newPSA target for the 2004 Spending Review. Although the Office for National Statisticshas had a troubling period with regard to its numbers on levels of GVA per headacross the regions, this measure is likely to be much less difficult to get agreement onthan a measure of the trend rate of growth. The level of GVA per head across theregions – a measure of the absolute ‘north-south divide’ – is also the measure that issalient politically, along with, as we argue in Chapter 2, differences in employment.
The Government has made considerable progress in developing its regionaleconomic policy, but it needs to go further. The 2004 Spending Review should set outan unambiguous target to narrow disparities in GVA per head across the UK’sregions. This should involve discussions between HMT and the DTI and the DWP,and the Scottish Executive and Welsh Assembly Government (and the political processpermitting, the Northern Ireland Executive) and the ODPM and English regionalbodies. The Joint Ministerial Committee on the Economy proposed to take place laterin 2003 would provide an obvious venue for these discussions and a test case of howthe UK’s new system of governance can link the reserved and devolved economicpolicy agendas. What such a target would mean and what policy levers would beneeded to deliver this, or indeed the current, PSA target, is the focus of the rest of thisreport.
Introduction 11

2. The scale of the challenge
In Chapter 1 we argued that the UK Government and the devolved administrationsshould adopt a target that would address closing absolute disparities in prosperityacross the UK’s regions. This would be measured using the indicator of GVA per headat the level of the 12 nations and regions of the UK, a measure that is very close to thefamiliar indicator of GDP per head. Even if this, at first sight rather traditional,approach was to be accepted, a number of questions still need to be answered.
� Why does this report choose GDP or GVA per head as the key measure ofprogress, if one of the five key objectives of a strong regional economic policyis ‘developing a more sophisticated understanding of regional disparities, andnot simply relying on GDP/GVA per head’. In this chapter we wish to startexploring what this means, and will consider regional economic disparitiesfrom other perspectives.
� Why choose the region as the unit of analysis given that there is considerablevariation in economic prosperity within regions? A variant of this concern iswhether we should give more attention to the role of cities within our regions.
� How far is GDP or GVA per head a good measure of actual living standardsin the regions, especially given the widely observed differences in the cost ofliving across the regions?
� Should we focus more on measures such as levels of relative poverty in theregions, especially important given the Government’s flagship objective ofabolishing child poverty by 2020?
� What can we learn from using other measures of wellbeing, including thegrowing literature on ‘happiness’, in particular with regard to health andespecially mental health?
� How can the regional policy debate take more seriously the range of issuesrelating to environmental sustainability?
GVA per head, employment and productivity
Table 2.1 uses the most up-to-date figures that were available from official sources inthe summer of 2003 to examine how differences in GVA per head across the UK’sregions in 2001 were a function of differences in productivity and employment. Thedata reveals the well known ‘north-south divide’ at the regional level. It alsodemonstrates that the relative importance of employment and productivity inexplaining disparities in GVA per head differs from region to region. The Productivity
12

3 report argued that, on average, productivity differentials accounted for around 60per cent of regional differences in GVA per head, with the implication that theremaining 40 per cent reflected differences in employment. However, it alsoacknowledged that a striking feature of the UK regions with the lowest GVA per head– Wales, the North East and Northern Ireland – was a particularly poor labour marketperformance, with very low employment rates. On the other hand, the South West hasabove average levels of employment, but relatively poor productivity (and a lowworking age population share). London’s relative prosperity is due to its very highlevels of productivity and its high working age population share, despite mediocrerates of employment for those of working age.
There do seem to be wider disparities between the regions in terms of productivitythan in employment, but it is not worth having a heated dispute about which accountsfor more of the gaps in regional prosperity. Both are important in terms of analysingthe problem. However, politically it seems clear that employment is viewed as themore pressing problem by those that live in the disadvantaged regions, for whomclosing the productivity gap with the French is not obviously a salient issue.
The similar levels of employment in London and some of the northern Englishregions are somewhat deceptive: the problem of an area of low employment in anotherwise prosperous region is different in character to the problem of lowemployment in a disadvantaged region. As Chapter 3 will explore in detail,unemployed people in Hartlepool face very different hurdles to unemployed people in
The scale of the challenge 13
Table 2.1 Three indices for regional prosperity (UK=100)
UK nations and regions Employment rate Productivity levels Output levelsas proportion of working GDP per person GVA per person of
age population 2001 employed, 2001 working age, 2001,residence based
London 95 134 127South East 108 111 120East 106 103 111Scotland 98 95 93East Midlands 102 90 92South West 107 86 92West Midlands 100 92 91North West 96 94 91Yorkshire & Humberside 99 88 87Wales 93 87 81Northern Ireland 91 88 79North East 92 84 77United Kingdom 100 100 100
Source: Labour Force Survey 2001, ONS
Hackney. As the UK’s richest region London best exemplifies the problem of a healthyoverall jobs market co-existing with pockets of high unemployment. The barriers toemployment here might include a lack of skills, a lack of information, poor transportor discrimination. Many government policy instruments are designed to tackle suchsupply-side problems: the New Deals and other active labour market policies; skills,education and training measures; and measures to tackle discrimination and promoteequality. On the other hand, in Hartlepool such supply-side policies will not be fullyeffective in the absence of measures to raise the demand for labour, in the context ofthe simple observation that there are fewer job opportunities within reasonable travel-to-work distance.
This is not the only way in which the employment problem differs between theregions. Table 2.2 shows that the make up of the unemployed and inactive variessignificantly across the UK’s regions. In February 2003, nearly 15 per cent of adultsof working age in Northern Ireland, nearly 14 per cent in Wales, nearly 13 per centin the North East and 12 per cent in the North West were claiming benefits related tosickness and disability. These numbers dwarf those claiming benefits related to beingunemployed and the contrast with the numbers in the East and South East regions isstark. Higher levels of claims related to sickness and disability account for nearlythree-quarters of the gap between Northern Ireland and the South East in the overallproportion of working age adults claiming benefits. By contrast, London had thehighest proportion of lone parent benefit claimants.
Another key feature of London’s employment problem relates to the differences inemployment by ethnic group. The employment rates for white adults and for allminority ethnic groups in London are strikingly similar to the employment rates forthese groups for the UK as a whole. The employment rates for particular ethnicgroups, including Indian, Pakistani and Bangladeshi, Black African and BlackCaribbean are also very similar in the capital to the national average. Given thatnearly half of all ethnic minority people live in London, this is not really surprising.However, it does lead to the observation that, in a strict accounting sense, London’srelatively low employment rate is explained by having a much higher proportion ofthe working age population from minority ethnic backgrounds. This begs another setof questions about the range of barriers faced by minority ethnic groups in terms oftheir labour market participation in London and nationally (ippr 2003).
There are of course some obvious policy implications that result from theseobservations about how the nature of employment problems varies across the regions.The various New Deals – aimed at disabled people or lone parents for example – willbe of differing importance in different regions, even if they are not explicitly targetedregionally. The differential effectiveness of the New Deals could have importantregional implications. Active labour market policies are one type of policy instrumentthat need a regional perspective.
14 A new regional policy for the UK

Why regions and not sub-regions or cities?
It is clear that there are significant differences in prosperity within as well as betweenregions. It is also clear that any ‘north-south gap’ in prosperity is overlaid and partlyexplained by an ‘urban-rural’ split, which is explored in more detail in Chapter 3 inrelation to employment.
If, however, the focus for any policy is to narrow disparities in GDP or GVA perhead, this should lead one to focus on the region as the correct unit of analysis, for thesimple reason that GVA per head as a measure makes little sense below this level. Thisis partly because the EU defines sub-regions (NUTS level 2 in EU terminology) in sucha manner that:
a. leaves cities cut off from their hinterlands where much of their workingpopulation lives. This problem tends to exaggerate the GDP or GVA per headof many cities including, for example, Paris, Hamburg and Brussels (Boldrinand Canova 2001).
b. cuts strange boundaries within cities such as London where Inner London is sodefined as to include the financial and business services districts.
The scale of the challenge 15
Table 2.2 Claimants of key benefits by statistical group and region, February2003, as a percentage of the working age population
UK nations and regions Statistical Group
all unemployed sick/ lone othersdisabled parents
North East 20.3 3.8 12.9 2.9 0.8Wales 19.5 2.8 13.6 2.5 0.6North West 18.1 2.9 11.9 2.7 0.6Scotland 17.8 3.4 11.4 2.3 0.7Yorkshire & Humberside 15.0 3.0 9.1 2.3 0.6West Midlands 14.9 3.0 8.8 2.4 0.6London 14.6 3.5 7.1 3.4 0.6East Midlands 12.9 2.4 8.1 1.9 0.5South West 10.9 1.8 7.0 1.7 0.4East 10.0 1.8 5.9 1.9 0.4South East 8.8 1.6 5.2 1.7 0.3
Great Britain 14.2 2.7 8.7 2.3 0.5
Northern Ireland 21.8 3.3 14.6 2.8 1.2
Note: Northern Ireland data had not been formally published at the time of writing, and was obtained directly from Northern Ireland
Government Departments by the authors.
Source: DWP (2003: Table 6.2)

This problem is recognised by the UK Government. In Productivity in the UK: 4 – thelocal dimension (Productivity 4) (HMT/ODPM 2003) it was acknowledged, withregard to GDP per head, ‘that comparisons of economic performance between areasbecome less precise as the areas under examination become geographically smaller’.This paper went on to say that ‘it may be preferable to concentrate on other indicatorswhen looking at living standards at a local level – for example, comparisons ofhousehold income’. We make this comparison at the regional level below.
For the cities of the UK, the more obvious measure of economic prosperity toconcentrate on is employment, precisely because the main problem facing the cities isrelatively low employment rates. Of the large English cities only Bristol (or strictlyspeaking the Travel-To-Work Area encompassing Bristol) could be described as a cityat full employment, with an employment rate of over 80 per cent in 2001 (see Table2.3). Of the remaining seven English ‘core cities’ only Leeds had an above averageemployment rate in 2001, along with Edinburgh. For employment it is indeedlegitimate to look at one level of analysis below the region – the Travel-To-Work Area– and this forms the basis for much of the discussion in Chapter 3.
The differences in employment rates between cities in Table 2.3 illustrate evidencefor both a ‘north-south gap’ – with the low employment rates of Liverpool, Newcastleand Glasgow and Belfast standing out – but also emphasises the relative success ofsome northern cities (notably Leeds and Edinburgh) and the unique status of London.This clearly raises an important set of issues.
16 A new regional policy for the UK
Table 2.3 Employment rates in the Core Cities, and other UK major cities, 2001
% of working age (16-59/64)population in employment
Bristol 80.9Leeds 77.9Nottingham 73.2Sheffield 72.4Manchester 72.4Birmingham 70.8Newcastle (Tyneside) 69.3Liverpool 64.0
London 71.4Cardiff 70.6Glasgow 67.6Belfast 67.2Edinburgh 78.3
Note: Travel-To-Work Areas
Source: Labour Force Survey Local Area Database

If it is correct that sub-regions (NUTS level 2) are not the right unit of analysis forlooking at differences in GDP or GVA per head, this also allows us to clear up thestrange point made in the Productivity 3 report and elsewhere that regional disparitiesare worse in the UK than in other EU countries. Before looking at the evidence on thisit is worth employing some intuition. A piece of analysis that tells us that the UK’sregional disparities are worse than those in Italy makes little real sense. However, thisis the conclusion that the analysis presented in Productivity 3 leads us to, although itdid acknowledge that ‘Additional work needs to be done in this area’.
One way around the problems posed by the administrative boundaries that areused to define regions and sub-regions in the EU is presented below in Figure 2.1.This compares GDP per head for the most affluent regions where about 25 per centof the population lives and the poorest regions where a further 25 per cent or so of thepopulation lives, in the UK, Italy, France and Germany. It leads to the much moreintuitively appealing result that Italy has the most severe regional disparities inprosperity, but that the UK, France and Germany face similar regional problems.
The scale of the challenge 17
Figure 2.1 Regional disparities in prosperity in the EU (GDP per head atpurchasing parity) 1999
Notes:
a. Highest/lowest income regions contain approximately one-quarter of the national population each. The relevant regions are
UK: Northern Ireland, North East, Wales and North West (lowest income), London and South East (highest income);
France – Nord-Pas-de-Calais, Ouest and Med (lowest income), Ile de France and Centre-Est (highest income);
Italy – Campania, Sud and Sicilia (lowest income), Lombardia and Emilia-Romagna (highest income);
Germany – Niedersachsen, Brandenberg, Mecklenburg-Vorpommern, Saschen, Saschen-Anhalt, Thuringen (lowest income) and
Hamburg, Bremen, Bayern and Hessen (highest income).
b. Workplace based estimates are used, where the income of commuters is allocated to where they work.
c. UK estimates are provisional.
Source: Eurostat (2002); ONS (2002: Table 2.3) and authors’ calculations

Part of the problem here seems to be that comparative analysis has trapped somepolicy makers into thinking that only if you can show the UK is worse off comparedwith other countries in some area of policy will this help justify taking action. Weshould want to address regional disparities in prosperity in the UK because of thesocial costs those disparities imply, not because of an – incorrect – assertion that theproblem is so much worse in the UK than anywhere else.
Living standards and the cost of living
In the final analysis we are of course interested in the individual welfare of people asthe ultimate policy goal. GVA is in principle a measure of the output being producedin each region. It is not, however, a measure of the income available to households inthose regions. A significant source of household income in all the UK’s regionsconsists of transfer payments through the tax and benefits system. A smoothlyfunctioning modern welfare state will act to redistribute income from more prosperousindividuals and regions towards poorer individuals and regions, thereby smoothingout economic disparities. GVA does not measure these payments, which are, ofcourse, disproportionately important in the disadvantaged regions.
One measure which does take into account transfer payments is ‘gross disposablehousehold income per head’, and the regional breakdown (for the late 1990s) isdetailed in Table 2.4. This shows that the transfer payments managed by centralgovernment do have the effect of significantly reducing regional disparities. The gap of
18 A new regional policy for the UK
Table 2.4 Gross disposable household income per head, three-year average,1997-1999
UK region Household income per head, average 1997-99(UK=100)
London 121South East 110East 105South West 100Scotland 95East Midlands 93North West 93West Midlands 93Yorkshire & Humberside 93North East 89Wales 88Northern Ireland 88
Note: Scotland’s figure is for 1997 only.
Source: ONS (2002: Tables 12.1, 12.8)
nearly 60 percentage points in GVA per head between the North East region andLondon is reduced to a gap in household income per head of just over 30 percentagepoints. However, very significant disparities remain and there is little impact upon therelative ranking of the regions.
It is of course consistent with the values and analysis of all the political parties thatregions, like individuals, should be able to stand on their own two feet. GVA per headis a measure of the economic output of a region; if that region’s prosperity is overlyreliant on transfer payments from elsewhere, this is unlikely to be regarded assatisfactory by either the recipient or the donor regions. So although transfers are avitally important component of social policy, economic policy should clearly focus onimproving the output of the regions.
The data on household income in Table 2.4 do not take into account differencesin the cost of living between the regions. Indeed another of the key deficiencies in theavailability of regional statistics is the absence of any regional deflators that could beused to adjust the data to reflect differences in price levels. We can, however,approximate the impact that having such deflators would have on the size of the‘north-south gap’. A report prepared for the Corporation of London made a plausibleeffort to calculate the difference in the cost of living between the capital and the restof the country (Gordon et al 2002). Key to this effort of course is taking into accountdifferences in housing costs, especially for owner-occupiers. It was estimated that onaverage the cost of living in London was about 10-12 per cent above the UK averagein 2000-01. Applying this estimate to the figures on household income in Table 2.4would about halve the advantage of London households in terms of income per head
The scale of the challenge 19
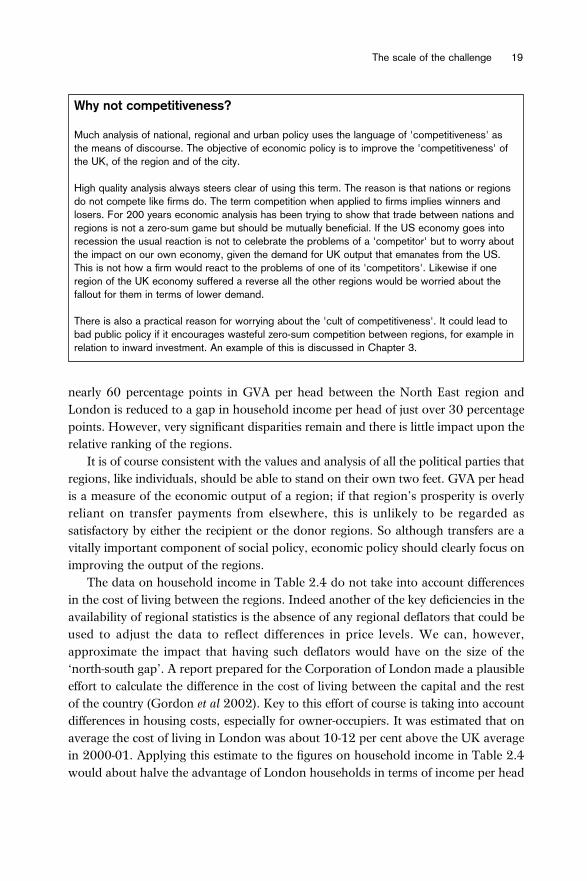
Why not competitiveness?
Much analysis of national, regional and urban policy uses the language of 'competitiveness' asthe means of discourse. The objective of economic policy is to improve the 'competitiveness' ofthe UK, of the region and of the city.
High quality analysis always steers clear of using this term. The reason is that nations or regionsdo not compete like firms do. The term competition when applied to firms implies winners andlosers. For 200 years economic analysis has been trying to show that trade between nations andregions is not a zero-sum game but should be mutually beneficial. If the US economy goes intorecession the usual reaction is not to celebrate the problems of a 'competitor' but to worry aboutthe impact on our own economy, given the demand for UK output that emanates from the US.This is not how a firm would react to the problems of one of its 'competitors'. Likewise if oneregion of the UK economy suffered a reverse all the other regions would be worried about thefallout for them in terms of lower demand.
There is also a practical reason for worrying about the 'cult of competitiveness'. It could lead tobad public policy if it encourages wasteful zero-sum competition between regions, for example inrelation to inward investment. An example of this is discussed in Chapter 3.

to around 9-11 per cent above the UK average. We do not have similar estimates forthe disadvantaged regions, but it is plausible to think that the lower cost of living inthe North East, for example, would move household income per head in that regionsomewhat closer to the UK average. A significant gap of somewhere around 15percentage points in real gross disposable household income per head betweenLondon and the North East would be likely to remain, however. This is clearly an areafor further work.
Poverty: assigning the right instruments to the right problem
London does have one particular social problem that sets it apart, namely high levelsof child poverty. The commonly accepted indicator used in current debates onpoverty is a relative measure: 60 per cent of contemporary median householdincome. A goal of reducing the proportion of people living in households with lessthan 60 per cent of contemporary median income is widely agreed to be right inprinciple and has been accepted by the European Union (EU) and the UKGovernment (Palmer et al 2002). It is the measure that the UK Government haschosen to assess progress against its ambitious target to ‘reduce the number ofchildren in low income households by at least a quarter by 2004, as a contributiontowards the broader target of halving child poverty by 2010 and eradicating it by2020’ (HMT 2002a).
20 A new regional policy for the UK
Table 2.5 Regional breakdown of percentage of children living in householdswith an income of less than 60% (after housing costs) of the national median
GB region 1999-00 2000-01 2001-02excludes self-employed includes self-employed includes self-employed
London 43 41 35North West 34 32 32West Midlands 32 37 32Yorks & Humber 36 29 32Wales 36 33 31North East 35 37 31Scotland 29 30 30East Midlands 27 29 29South West 30 27 28East 25 22 24South East 25 22 24
Great Britain 32 31 30
Note: Unfortunately the Family Resources Survey (FRS) only started to be collated in Northern Ireland in 2002-03. Figures should
be available in the next publication of Households Below Average Income, expected in Spring 2004.
Source: DWP (2003: Table 4.8)

Table 2.5 provides the regional breakdown of child poverty rates over the period1999-2002. There are quite significant regional differentials in child poverty. Childrenare at a much lower risk of poverty in regions such as the East of England or the SouthEast than in the North East or the North West, but the highest child poverty rate is tobe found in London. The figures suggest that levels of child poverty have declined overthis period and that regional differences have diminished. It seems, therefore, that theGovernment’s anti-child poverty strategy has been having some success. However, theGovernment is clearly not yet at a stage where it can be assured that it will meet itstarget of abolishing child poverty by 2020.
Anti-poverty campaigners have rightly argued that unless the Government commitssignificant extra resources via such instruments as benefit payments and the child taxcredit the target simply cannot be met (Brewer et al 2002). However, the Governmentalso needs levels of employment to continue rising and recognises the importance ofactive labour market policies and other measures in this respect. Bearing in mind thesignificant regional disparities in employment, a strong regional policy would make asignificant contribution to the commitment to eradicate child poverty by 2020.
However, we must be careful to match specific policy instruments to specificproblems. The main solution to London’s child poverty problem does not lie withregional economic policy instruments. Further significant falls in child poverty arelikely to result from tax and benefit policies that channel more resources to familiesand policies that help heads of households with children (including lone parents)make the transition to stable employment while balancing their caring responsibilities.Regional policy instruments are necessary to address regional economic disparities,and other policy instruments are necessary to deal with other forms of inequality andexclusion.
‘Happiness’ and quality of life
The relevance of economic performance is that it may be a means to an end.That end is not the consumption of beefburgers, nor the accumulation oftelevision sets, not the vanquishing of some high level of interest rates, butrather the enrichment of mankind’s feeling of well-being. Economic thingsmatter only in so far as they make people happier (Oswald 1997).
It is sometimes argued that while the ‘North’ may not have the prosperity of the‘South’, people are on the whole ‘happier’. Over the last 20 years there has been asignificant growth in the academic literature exploring ‘happiness’, but despite suchthemes having some influence in public debate little of the literature has addressed theregional dimension.
The scale of the challenge 21

Western countries have been experiencing rising real incomes for generations,and the UK approached the 21st century approximately twice as rich as it was in1960 and three times more affluent than at the end of World War II. Despite this,happiness and satisfaction with life has increased only marginally (Oswald 1997).One reason for this must be that happiness is dependent not only on absolute levelsof income, but also relative levels of income. However, this can only be part of theanswer and other factors also fundamentally affect happiness. Richard Layard(2003) surveyed the literature in a series of lectures in 2003 and concluded that,alongside income, the research pointed to six other factors which have a significantimpact on people’s happiness: work, private life, community, health, freedom andphilosophy of life.
Both Layard and Oswald stress that employment is crucial to an individual’shappiness and argue that the focus of economic policy should move from economicgrowth to full employment, which further justifies the emphasis on employment in thisreport. Lower levels of employment in the ‘North’ would lead one to infer that the‘South’ is likely to be happier than the ‘North’. However, we have more directevidence to draw on.
Self-reported health is strongly related to happiness (Layard 2003). Survey datafor 2000-01 on this is contained in Figure 2.2. With the exception of reasonablyhigh levels in Wales, the expected pattern of regional disparities is largely
22 A new regional policy for the UK
Figure 2.2 Proportion of population reporting ‘good’ state of general health by gender, 2000-1
Source: ONS (2002: Table 7.4)
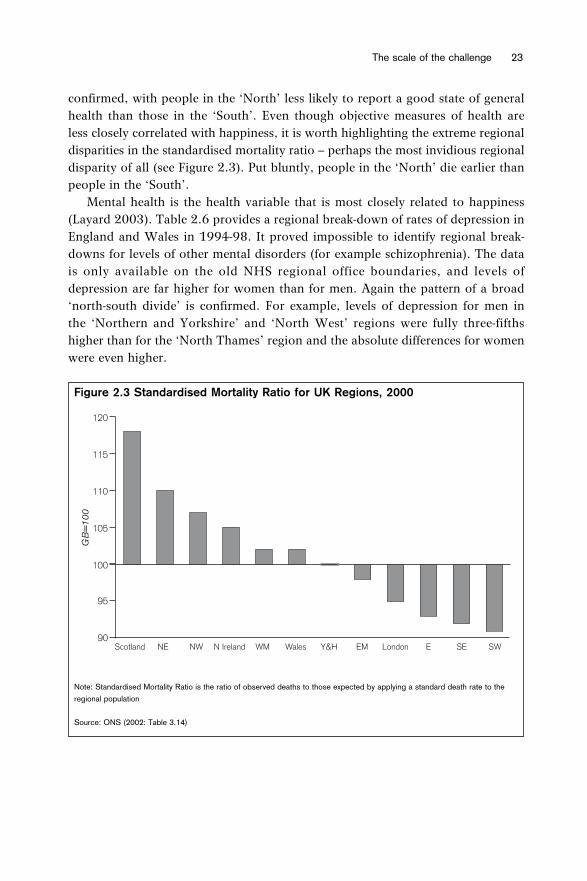
confirmed, with people in the ‘North’ less likely to report a good state of generalhealth than those in the ‘South’. Even though objective measures of health areless closely correlated with happiness, it is worth highlighting the extreme regionaldisparities in the standardised mortality ratio – perhaps the most invidious regionaldisparity of all (see Figure 2.3). Put bluntly, people in the ‘North’ die earlier thanpeople in the ‘South’.
Mental health is the health variable that is most closely related to happiness(Layard 2003). Table 2.6 provides a regional break-down of rates of depression inEngland and Wales in 1994-98. It proved impossible to identify regional break-downs for levels of other mental disorders (for example schizophrenia). The datais only available on the old NHS regional office boundaries, and levels ofdepression are far higher for women than for men. Again the pattern of a broad‘north-south divide’ is confirmed. For example, levels of depression for men inthe ‘Northern and Yorkshire’ and ‘North West’ regions were fully three-fifthshigher than for the ‘North Thames’ region and the absolute differences for womenwere even higher.
The scale of the challenge 23
Figure 2.3 Standardised Mortality Ratio for UK Regions, 2000
Note: Standardised Mortality Ratio is the ratio of observed deaths to those expected by applying a standard death rate to the
regional population
Source: ONS (2002: Table 3.14)

Many issues highlighted as important in the happiness literature are outside thescope of this report (such as personal freedom and philosophy of life). However, it isclear from this brief examination of the topic that there are significant regionaldisparities in the factors like employment and health that seem to contribute to amore rounded understanding of individual happiness. Those who claim that the‘North’ may be poorer but is generally happier would seem to be profoundlymisguided.
The environment
In the 21st century, the objective of promoting ‘sustainable development’ permeatesmuch of the public policy debate. One of the RDAs’ five statutory purposes is ‘tocontribute to sustainable development’ and each English region has a sustainabledevelopment framework. The Government has established 15 headline indicatorsdesigned to provide a review of progress towards achieving sustainable development(ONS/DEFRA 2002). These indicators relate to a range of environmental, social andeconomic ‘outcomes’.
And there’s the rub. Because the term ‘sustainability’ is so widely used and withdifferent meanings by different people and because it has become such an allencompassing concept, it is threatening to lose its usefulness as the basis for thinkingabout public policy. The Government’s headline indicators of sustainabledevelopment illustrate the problem. The economic indicators manage to confuseoutcomes (GDP per head and employment rates) with one of the drivers of thoseoutcomes (investment). The social indicators are broadly sensible and include childpoverty and life expectancy at birth. However, we concentrate here on theenvironmental indicators, as economic and social indicators are discussed elsewhere.
24 A new regional policy for the UK
Table 2.6 Treatment of depression by NHS Regional Office Area, 1994-1998(rates per 10,000 patients)
English and Welsh regions Males Females
Northern and Yorkshire 29.6 70.6North West 30.4 70.3Trent 24.7 61.2Anglia and Oxford 23.7 61.1South and West 24.1 60.5Wales 24.0 58.6West Midlands 21.6 58.6South Thames 20.6 49.7North Thames 18.8 46.5
England and Wales 24.9 61.3
Source: ONS (2002: Table 7.5)
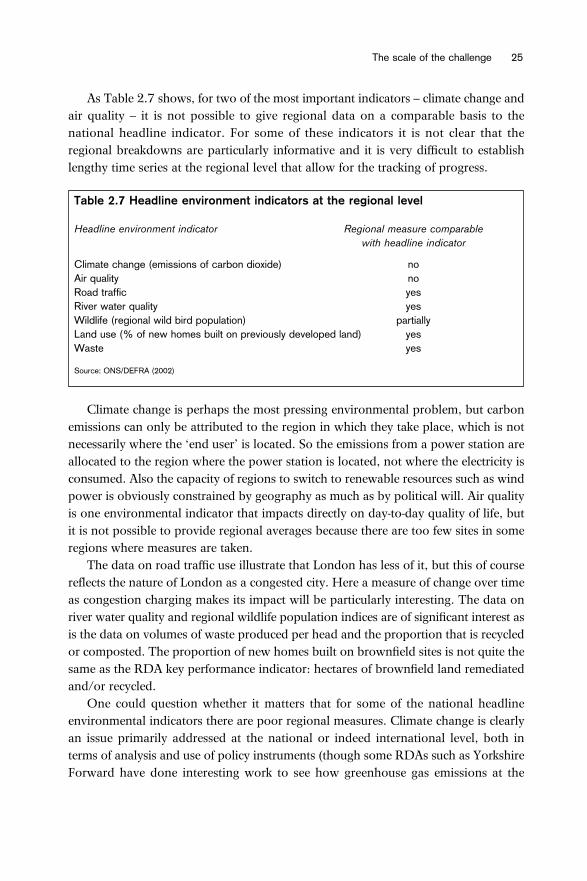
As Table 2.7 shows, for two of the most important indicators – climate change andair quality – it is not possible to give regional data on a comparable basis to thenational headline indicator. For some of these indicators it is not clear that theregional breakdowns are particularly informative and it is very difficult to establishlengthy time series at the regional level that allow for the tracking of progress.
Climate change is perhaps the most pressing environmental problem, but carbonemissions can only be attributed to the region in which they take place, which is notnecessarily where the ‘end user’ is located. So the emissions from a power station areallocated to the region where the power station is located, not where the electricity isconsumed. Also the capacity of regions to switch to renewable resources such as windpower is obviously constrained by geography as much as by political will. Air qualityis one environmental indicator that impacts directly on day-to-day quality of life, butit is not possible to provide regional averages because there are too few sites in someregions where measures are taken.
The data on road traffic use illustrate that London has less of it, but this of coursereflects the nature of London as a congested city. Here a measure of change over timeas congestion charging makes its impact will be particularly interesting. The data onriver water quality and regional wildlife population indices are of significant interest asis the data on volumes of waste produced per head and the proportion that is recycledor composted. The proportion of new homes built on brownfield sites is not quite thesame as the RDA key performance indicator: hectares of brownfield land remediatedand/or recycled.
One could question whether it matters that for some of the national headlineenvironmental indicators there are poor regional measures. Climate change is clearlyan issue primarily addressed at the national or indeed international level, both interms of analysis and use of policy instruments (though some RDAs such as YorkshireForward have done interesting work to see how greenhouse gas emissions at the
The scale of the challenge 25
Table 2.7 Headline environment indicators at the regional level
Headline environment indicator Regional measure comparablewith headline indicator
Climate change (emissions of carbon dioxide) noAir quality noRoad traffic yesRiver water quality yesWildlife (regional wild bird population) partiallyLand use (% of new homes built on previously developed land) yesWaste yes
Source: ONS/DEFRA (2002)

regional level could be reduced). The environmental issues that matter at the locallevel are those which directly impact on daily quality of life. These can include airquality and road traffic levels, but also the quality of local public spaces, includingpublic parks, the cleanliness of the streets, noise levels, the efficiency of refusecollection services and so on. These are, of course, some of the major servicesdelivered by local government and illustrate the importance of this tier of governmentto securing a better environment and quality of life.
Despite the development of these headline indicators and the imposition ofstatutory duties on regional agencies, it is as yet unclear that the Government hasadequately reconciled environmental and economic needs within its overallapproach to development. The Government’s favoured strategy is to improveproductivity whilst using fewer resources. This ‘more from less’ approach is,according to Porritt (2003) ‘a very seductive strategy. It appears to offer an almostpain-free route to a ‘cleaner environment’ without jeopardising normal economicpriorities’. Yet it also presents difficult trade-offs that need to be confronted if theimpact of economic activity upon the environment is to be addressed. For example,the imposition of the climate change levy will have had a disproportionate impacton manufacturing industry, which is disproportionately concentrated in thedisadvantaged regions.
The development needs of different regions is one area where such issues comeinto sharp focus. Unfortunately, the data available through the 15 headline indicators,and other government sources, does not allow us to adequately capture the differentenvironmental problems and pressures faced by different regions. As each regionpursues its development objectives, so different environmental considerations must beaddressed.
For example, London and the South East must address the ‘problems of success’.As the Regional Economic Strategy for South East England (SEEDA 2002: 3) argued,
We cannot build our way out of the congestion problem. We do needurgent investment to provide new transport infrastructure for the region.However, we must also be prepared to tackle the seemingly insatiabledemand for road transport.
Such a ‘smart growth’ approach should be applauded, and, moreover, encouraged inother areas. A more sensitive regional policy would take demand-managementpolicies, such as congestion charging and waste-management, seriously.
Moreover, such a ‘smart growth’ approach would need to address issues acrossand between regions as well. For example, the Communities Plan has beencharacterised as ‘bulldozing the North and concreting the South’. Seriousconsideration must be given to the environmental impacts of the proposed
26 A new regional policy for the UK

developments across London and the East and South East regions. Moreover, theCommunities Plan might only be seen as a short-term solution to nationaldevelopment pressures.
A more medium- to long-term approach that recognises the development needs ofthe northern regions is an imperative. However, the need to boost employment andgrowth rates within such regions must not privilege economic over environmentalconcerns. Those within these regions who argue that development on greenbelt landis necessary to secure future regional prosperity need to be challenged. As the‘Happiness’ section above demonstrated, economic development in itself does notsecure an improving quality of life. So although regions such as the North East requirepolicy mechanisms that help economic growth and promote full employment, a keychallenge for regional policy is to do this in a way that has as minimal an impact uponthe environment as possible. Demolishing homes in urban areas while building newhouses on greenfield sites does not seem sustainable in any sense of the word, even ifit might seem imperative as a means of meeting the needs of middle England.
Adequately integrating environmental concerns into development practicespresents some tough political challenges. As such, developing a greater regionalsensitivity to the environmental pressures generated by development is a key challengefor regional policy. There must be some doubt as to whether the Government, with itsover-riding concern with labour productivity, currently has the policy framework ordata in place to meet that challenge. Indeed at times it seems that policy makers seethe environment in purely instrumental terms: a good environment and quality of lifeis a means to the end of attracting more economic activity. This is to get mattersprecisely the wrong way round.
Conclusion: how the market would do it
One obvious question to ask is why normal market mechanisms would not worktowards reducing the significant regional economic disparities that we have identifiedhere. It is a question to answer in order to provide a clear justification for publicpolicy to address the problem.
The market should work like this. High costs as the result of tight labour andhousing markets in the successful regions should generate incentives for firms andpeople to relocate to the disadvantaged regions, where the availability of surpluslabour and lower costs should prove attractive. In practice there are a number ofreasons why such market pressures will not work effectively to even out regionalimbalances. However, it is worth emphasising that public policy itself can prevent themarket from working. Much attention has been given to factors such as national paysetting that could prevent wages from adjusting in the regions, an issue taken up inChapter 4. However, an issue less often raised is the possibility that government
The scale of the challenge 27

action to offset the problems faced by successful congested regions will make thoseregions even more attractive to economic activity. If resources are channelled to buildmore houses in the successful regions and to improve the transport infrastructure, thevery incentives for firms and people to relocate are blunted.
Of course that is exactly how some people would characterise the policies of thecurrent Government in relation to housing and transport. Within a single governmentdepartment such as the Office of the Deputy Prime Minister there are conflictingpressures to reduce regional disparities and to deliver ambitious aspirations forpopulation and employment growth in the Greater South East. Critics contend thatnot only is Government policy inconsistent, it runs counter to the one sure way toaddress the UK’s regional economic disparities. This is to ‘let the South stew’. Allowcongestion and costs to become so disabling in the Greater South East that firms andpeople are forced to consider relocation.
The usual riposte of course is that firms will relocate abroad, not to the ‘North’and that London in particular plays such a vital and irreplaceable role in the nationaleconomy, if its development is held back in any way, national economic performancewill suffer. At this point the debate usually ends up as a dialogue of the deaf.
Is there any way to reconcile these apparent opposites? The first step is to beclearer about the role that London does play in the UK economy. There is,undoubtedly, some economic activity located in the capital that would be unlikely tobe efficiently located anywhere else in the UK. The international financial serviceslocated in the City are only the most obvious example. Some business services andelements of the creative industries also probably derive significant benefits from theirlocation in the capital.
However, the unique nature of London’s economy should not be over-stated.Figure 2.4 shows the proportions of employment in London that serve differentoverseas and domestic markets, drawn from employer surveys that have been analysedon behalf of the Corporation of London. About 12 per cent of jobs in London weredependent on markets in the EU and the rest of the world in 1999-2000. Bycomparison, nearly 29 per cent of jobs served local and borough markets and around31 per cent served markets across Greater London and the South East. A further 29per cent of jobs derived from serving markets in the rest of the UK.
So most employment in London is not directly associated with servinginternational markets. If we could measure output in the same way, we could probablyshow that a higher level of economic activity served international markets, in thatvalue-added is likely to be higher in sectors like international finance. However, Figure2.5 shows that the relationship between London and the rest of the UK is not onesimply of dependence of the latter on the former to generate prosperity. It is also arelationship of interdependence, with London reliant on demand in the rest of thecountry to sustain a high proportion of its jobs. Overall, worrying about whether the
28 A new regional policy for the UK

London economy drives the UK or vice-versa is about as pointless as worryingwhether it was the chicken or the egg that came first.
As for ‘letting the South stew’, improvements to the transport infrastructure in theGreater South East, or measures to deliver more homes may well have broad socialbenefits for people living in those regions. Political reality and social justice demandsthat these issues are addressed in some fashion. It is reasonable to ask whether thecosts of addressing the problems of success should be borne not by the centralExchequer but by the beneficiaries of that success. The realistic political agenda is tofind ways of raising revenue within the Greater South East to address the problems ofsuccess there. These issues are addressed further in Chapter 7.
The scale of the challenge 29
Figure 2.4 Distribution of Greater London employment by main market area,1999-2000
Source: Derived from Gordon et al (2002: Table 4.2).
3. Employment and regional policy
For many people living in the lagging regions of the UK the proposition that a keyproblem facing those regions is a lack of jobs would seem so obvious that they mightfind it hard to believe that this is in fact a matter of serious contention.
It is not in dispute that the proportion of the working age population inemployment varies significantly across and within regions. While the employmentrate in the UK as a whole in 2003 was higher than in many other OECD countries,some parts of the country suffer from unacceptably low levels of employment. TheGovernment would stress that every region in the UK has an employment rate abovethe EU average, and that even the lowest employment region has an employmentrate higher than most EU countries, including France, Spain and Italy (DfES 1999).However, this does not mean that there is full employment across and within all UKregions, if a definition of over 80 per cent of the working age population inemployment is used (Burkitt and Robinson 2001).
Figure 3.1 graphically illustrates regional and local variations in employment,detailing the proportion of the working age population in employment by Travel-To-Work Area (TTWA) across the UK, where the TTWAs approximate relatively self-contained local labour markets where people both live and work. Figure 3.1 shows thebroad swathe of TTWAs in the Greater South East, including that part of the SouthWest region along the M4 corridor where employment rates are close to 80 per cent,and the low employment rates in many TTWAs located in the lagging regions. It alsoshows that this broad ‘north-south divide’ is overlaid by an urban-rural split withrelatively high employment rates in areas such as North Yorkshire and generally lowemployment rates in the major cities, including London.
The most important dispute in regional economic policy debates is over how farthese patterns reflect differences in the employment opportunities or jobs available indifferent localities, or whether they simply reflect the inability or unwillingness ofthose not in employment to access the jobs that are available. Much of the analysispresented by the Government emphasises the latter supply-side explanation ofconcentrations of unemployment; the critics prefer the former demand-sideexplanation focusing on the existence of jobs-gaps across the UK. Without someresolution of this dispute it is hard to see the regional economic policy debateprogressing.
The first thing to emphasise about the Government’s analysis is that it begs thequestion as to why we have policy instruments such as Regional Selective Assistance(RSA), one aim of which is to create or preserve jobs in the Assisted Areas. The RDAsare set as one of their key targets the creation or safeguarding of jobs. If there is noshortage of jobs and low employment rates are a supply-side problem there wouldseem to be a major disjuncture between the analysis and policy.
30

Employment and regional policy 31
Figure 3.1 Employment rates for people of working age by Travel-to-work area
Source: ONS Labour Force Survey

What we might refer to as the ‘Treasury/Department for Work and Pensions’view was well articulated in a paper published in February 2000.
Almost without exception, areas of high unemployment lie within easytravelling distance of areas where vacancies are plentiful. This is particularlyclear cut in London (HMT/DWP 2000).
This statement with its emphasis on travelling distance does at least appear to back thenotion that TTWAs are the appropriate spatial scale to look at employment problems.But critically it juxtaposes two measures, unemployment and vacancies, suggesting ananalysis of these is critical to an understanding of the employment problem.
The analysis of unemployment and vacancies does indeed have a long history ineconomics. At the heart of the analysis is the notion that the level of vacancies can betaken as a proxy for labour demand. The ‘Treasury/DWP’ argument is then quitestraightforward. Following the sharp recession of the early 1980s, by 1986 reportedvacancies had recovered to their level in 1979. It follows that labour demand musthave recovered to its 1979 level. If unemployment was by 1986 three times higherthan in 1979, this had to be a supply-side or structural problem to be dealt with bysupply-side measures not measures to increase labour demand. Moreover, vacanciesseem pretty evenly spread across the country so that a shortage of jobs cannot explaingeographical concentrations of unemployment.
What is interesting is that the Government’s critics by and large do not dispute theargument that job vacancies are a good proxy for labour demand. They emphasisethat job vacancies are higher in relation to employment or unemployment in the‘South’ than in the ‘North’ and therefore that labour demand is relatively lower in the‘North’. If you compare some measure of the overall level of vacancies with the overalllevel of non-employment across different areas you can illustrate the existence of ‘jobsgaps’ in many disadvantaged areas (see for example, Turok and Edge 1999; Erdemand Glyn 2001 for different ways of calculating jobs gaps). Eliminating these jobsgaps requires demand-side measures to increase the numbers of jobs in those areas.
A significant problem in testing these different arguments is the lack of goodquality data on the scale of vacancies across the country. For many years we relied ona measure of vacancies reported to Jobcentres, which were then multiplied by a factorof three based on the assumption that the Employment Service received about one-third of all vacancies. This rough-and-ready measure was always controversial; it wassuspended in April 2001 after the reliability of the data was increasingly questioned.An enterprise-based survey of job vacancies was adopted as a new series of nationalstatistics in the summer of 2003, with data going back to April 2001 (Machin 2003).Unfortunately there is no regional breakdown of this series available so it will provideno intelligence to help resolve the dispute over the nature of geographical
32 A new regional policy for the UK

concentrations of low employment (another example of the problem of inadequateregional statistics).
Figure 3.2 is drawn from another employer-based survey that does allow for someregional and local area disaggregation, although unfortunately it was only conductedin England. Interestingly, the 2002 Employers Skills Survey does not yield astraightforward north-south pattern in the scale of overall vacancies, hard-to-fillvacancies or skill shortage vacancies. The South East, East and South West regionshad the highest incidence of overall and hard-to-fill vacancies. However, the incidenceof vacancies and especially skill shortage vacancies fell sharply in London in 2002compared with 2001 and 1999. This begs an obvious question: if a modest slowingdown in the London economy in 2002 can see skill shortage vacancies so quicklydissipate how binding a problem can such skill shortages be and what exactly is beingmeasured by these indicators?
A more detailed analysis of the 2001 Employers Skills Survey concluded that ‘at abroad regional scale a north-south divide is evident’ (Green and Owen 2002), afinding that was stronger in 2001 when London was still reporting an above averageincidence of overall, hard-to-fill and skill shortage vacancies. The sample of the 2001survey was boosted to permit analysis of vacancy patterns at the level of the 47 local
Employment and regional policy 33
Figure 3.2 Vacancies and skill shortages by English region, as a percentage ofemployment, 2002
Note: The extent of skills shortage vacancies in the North East and East Midlands was not statistically significant.
Source: Employers Skills Survey 2002

Learning and Skills Councils (LSCs) in England. This is not because the LSCs are thebest unit for labour market analysis, but rather that they were key customers for thisparticular analysis. The analysis showed that most of the LSCs with a high incidenceof overall, hard-to-fill and skill shortage vacancies lay in the three southern regions andthe South West; by contrast all the local LSCs in the North East and Yorkshire andHumber recorded a lower than average incidence of vacancies. However, there wasalso evidence for an ‘urban-rural’ divide, with the sharpest contrasts between‘prosperous England’ and remoter rural areas on the one hand and areas of existingor past concentrations of mining and manufacturing. It also revealed interestingdifferences in the type of vacancies that proved hard-to-fill in different parts ofEngland, with three-fifths of the hard-to-fill vacancies in East and Central London in2001 being for managerial, professional and technical occupations. By contrast in‘remoter rural’ areas such as Cumbria over two-thirds were concentrated in theadministrative, sales and personal service occupations.
This discussion certainly leaves us with a great deal of scepticism about the utilityof the data on vacancies. However, we should perhaps ask questions about how farvacancies really measure the demand for labour as opposed to the turnover in labourthat is a constant feature of any working labour market. Turnover in labour is largelydriven by voluntary quits as people choose to move on in the labour market. Peoplefeel more confident to move on when the economy is doing quite well, which is animportant reason why the incidence of vacancies moves with the cycle. The fact thatin the ‘Treasury/DWP’ story vacancies had by 1986 recovered to their 1979 levelsillustrates only that with the economic recovery the labour market was registering ahealthy rate of turnover once again, not that the absolute demand for labour hadreturned to its previous levels.
In 2003 another official measure was launched publicly, purporting to offer anindicator of labour demand across the regions and local areas of the UK. The jobsdensity ratio measures the number of jobs in each region or local area as a proportionof the resident working age population (see Figure 3.3). This measure seems to makelittle sense at the local authority level, particularly in cities where commuting patternsmean that we should not expect the number of jobs and the number of residents toshow much of a match. To learn that in 2001 there were 473 jobs for every 100residents of working age in Westminster but only 46 jobs per 100 residents inLewisham is to learn very little, other than confirming that lots of people in Lewishamcommute to work in boroughs such as Westminster. At the regional level the newofficial measure if anything seems to confirm the arguments of those who suggestthat there are bigger jobs gaps in the lagging regions, with only 70 jobs for each 100residents of working age in the North East in 2001 versus 87 in the South East.
Unfortunately, there is as yet no meeting of minds between the Treasury/DWPand its critics over how far geographical concentrations of low employment reflect a
34 A new regional policy for the UK

supply-side or a demand-side problem. Intuitively a glance at Figure 3.1 might bemore illuminating that any amount of analysis of unemployment and inadequatevacancy data. The official assertion is that ‘Almost without exception, areas of highunemployment lie within easy travelling distance of areas where vacancies areplentiful’. Figure 3.1 does not really bear this out. The Hartlepool TTWA with anemployment rate of 66.5 per cent in 2001-02 has on its borders the lagging labourmarkets of Middlesbrough and Stockton (employment rate 66 per cent) andSunderland and Durham (employment rate 67 per cent). Hartlepool is not withineasy travelling distance of anywhere with a tight labour market. The same would gofor other groups of TTWAs with low employment rates in, for example, West Walesand the Valleys, industrial West Cumbria or Northern Ireland. In other words manyof the traditional Assisted Areas consist of a set of local labour markets next to oneanother all of which have relatively low employment rates.
The origins of these concentrations of low employment are not hard to find. Theystem from the decline of traditional heavy industries, a sectoral decline that wasdramatically speeded up in the early 1980s recession, with further restructuring laterthat decade and into the 1990s. Clearly, these jobs are not going to return. Theresulting concentrations of people with redundant skills and often poor formalqualifications can lead to a somewhat dispiriting analysis that such concentrations will
Employment and regional policy 35
Figure 3.3 Jobs density ratio, 2001
Source: ONS (2003b)

be hard to shift. It has been pointed out that in the disadvantaged regions,employment rates are particularly low for the least well qualified (Erdem and Glyn2001). Of course this is precisely what one would expect to see in conditions ofoverall low demand for labour, where the effects of general demand deficiency will getconcentrated on the lower tiers of the labour market. It does not necessarily followthat such people could not get jobs if the aggregate labour market was not muchtighter. In tighter labour markets the employment rates for the less well qualified aremuch higher: a tight regional labour market will vacuum up many of those that in lesstight labour markets face forbiddingly high non-employment rates.
We should also not get trapped into thinking that the concentration ofunemployment amongst the less well qualified means that we should try to create lotsof less well qualified jobs. What is most striking about the disadvantaged regions istheir relative lack of well-paid managerial, professional and technical jobs requiringrelatively high levels of qualifications (see Figure 3.4). In the North East less than onein three of those in employment in 1999 worked in these higher occupations,compared with nearly half in London. As we will discuss further in Chapter 4 this iswhy the well qualified in regions such as the North East tend to migrate to the ‘South’
36 A new regional policy for the UK
Figure 3.4 Proportion of working age population employed in differentoccupations, 1999
Note: Higher Occupations refers to Standard Occupational Classification (SOC) categories 1-3 (managerial, professional and
technical occupations); Middle Occupations to SOC categories 4-5 (administrative, secretarial and skilled manual occupations);
and Lower Occupations to SOC categories 6-9 (sales, personal service, operatives and elementary occupations).
Source: Institute of Employment Research (2001)

where more of the ‘good’ jobs are located. The ‘North’ needs more good jobs – inbusiness and financial services for example – to retain the well qualified in the region.The existence of such well-paid jobs in traded services such as business services will inturn generate jobs in the generally less well-paid sheltered services such as retailing orthe personal services. This seems to be a key reason for the relative success inemployment terms of cities such as Leeds and Edinburgh.
Housing and labour mobility
These comments also help clarify what elements of the geographical mobility of labourthat we need to concentrate on. The public policy debate had of course been trappedin the 1980s by unhelpful rhetoric about the need for jobseekers to ‘get on their bikes’to look for work. Graduates are very mobile across the UK labour market as a whole(Gregg, Machin and Manning 2001). By contrast, unemployed people only appear tomove between regions once they find a job; speculative moves in search of work byunemployed people are rare in the UK.
Much of the residential mobility that we observe is unrelated to labour marketfactors and is over relatively short distances (Dixon 2003) but inter-regional shiftsin population can occur as the aggregate outcome of sets of shorter distance moves.For many types of labour there is no doubt that house price differentials betweenthe ‘North’ and ‘South’ are an impediment to inter-regional labour mobility. Highlevels of prosperity and employment in the ‘South’ are reflected in high levels ofhousing wealth and high house prices, which then impedes inter-regional mobility.But for most jobseekers the relevant labour market horizon is more local. Therelevance of major transport investments to patterns of regional prosperity isexplored in Chapter 7, but a focus on local labour markets puts the emphasis onmaking sure that local public transport connects areas of population with areas ofemployment. Buses are the most important source of public transport for the lesswell-off (Grayling 2001).
The Treasury/DWP argument does carry some force in any analysis ofconcentrations of unemployment in a large metropolitan area like Glasgow orLondon. To point out the concentrations of non-employment in a borough such asHackney and to then suggest that the problem is a lack of jobs in Hackney is tomisunderstand the way that the labour and housing markets work in a city likeLondon. This has been forcefully argued in a number of important contributions byIan Gordon (Gordon 1999, Gordon 2003). Many individuals in London have a mixof adverse individual characteristics and face a series of barriers to securingemployment. The London housing market operates so as to concentrate theseindividuals in certain areas where housing is either cheaper or socially provided. Theresult is concentrations of low employment in these areas.
Employment and regional policy 37

These concentrations may in turn exacerbate the problems faced by individuals.For example, local schools may be handicapped by having to deal with heavyconcentrations of children from disadvantaged backgrounds, with the ‘peer group’effect compounding the impact of disadvantage for any one pupil (Feinstein 1998).High concentrations of disadvantaged adolescents may have negative consequences interms of higher levels of delinquency, with a criminal record one of the biggest barriersto employment (Gregg 2002). Interestingly, this suggests that local people have agood sense of priorities when they report that having opportunities and facilities forchildren and young people is the aspect of their area that they would most like to seeimproved (ONS 2003c).
The correct response to these concentrations, however, is not to create jobs inHackney for Hackney residents, but to equip those residents and break down thebarriers they might face so that they can access jobs across the whole of themetropolitan labour market. As Figure 3.1 shows, in London’s case this extends evenbeyond the boundaries of the Greater London Authority.
The supply-side barriers faced by individuals could include:
� a lack of appropriate skills and qualifications or recent work experience
� problems in accessing information about job vacancies or ineffective forms ofjob search
� employer’s recruitment practices that may directly or indirectly discriminateagainst certain jobseekers
� very specific barriers such as insufficient affordable elder and childcare or poorlocal transport links
� benefit traps of various kinds that make it difficult for people to make asustained transition into employment.
This analysis re-emphasises the importance of choosing the right spatial scale at whichto analyse labour markets. There is no such thing as the Hackney labour market –daily flows of people across borough boundaries in London and indeed across thewhole metropolitan labour market make this notion a nonsense. Special measures tocreate jobs in a local area like Hackney will induce flows of commuting andpopulation that will negate most of the impact on residents. Hartlepool, however,does constitute a relatively self-contained labour market and one that is far from anyother booming labour markets. This insight offers the best chance of trying toreconcile the sharply different characterisations of the employment problem that wehave discussed. For the residents of Hackney what is required is a robust overallLondon labour market allied to supply-side measures to help them access jobs acrossthe whole of the metropolitan labour market. For the residents of Hartlepool what is
38 A new regional policy for the UK

required are similar supply-side measures to help improve their ability to compete inthe labour market combined with policy instruments designed to create more jobswithin easy travelling distance.
It might help therefore if the Treasury/DWP modified its position so that it read:
Some areas of high unemployment lie within easy travelling distance ofareas where vacancies are plentiful. This is particularly clear cut in London,but much less obvious elsewhere.
The policy response
Before identifying the precise policy response suggested by this analysis it is worthlooking at Table 3.1. This details the trends in employment rates across the UKregions from 1997 to 2002, a period of reasonably steady growth in output andemployment. This resulted in an increase in the employment rate in all of the UK’sregions. More detailed work by Evans et al (2002) has shown that over the period1995-2000, every area in England benefited from the decline in the proportion of theworking age population drawing income related benefits. A rising tide does tend to liftall boats.
This suggests a four-fold policy response to the problem of low employment in theUK’s regions:
Employment and regional policy 39
Table 3.1 Employment rates for UK nations and regions for 1997 and 2002
UK nations and regions 1997 2002
South East 78.4 79.7South West 77.1 79.0East 76.6 79.0East Midlands 75.6 76.4West Midlands 73.2 74.2Scotland 71.0 73.7Yorks and Humberside 71.4 73.3North West 70.2 72.3London 69.9 70.5Wales 68.2 69.8North East 67.3 68.4Northern Ireland 67.1 67.7
UK 73.1 74.7
Source: Labour Force Survey
1 A strong national economy
It goes without saying that a strong national economy is an imperative. Indeed for aregion such as London this is much more important than any ‘regional policy’ per se.For the less advantaged regions a rising tide does lift all boats: strong growth inoutput and employment nationally will be reflected in higher employment in all theregions. Fortunately the macro-economic policy framework that has evolved since1992 has given the UK a better opportunity than in past decades and arguably insome other countries to maintain the steady growth in output and employmentnecessary to help resolve regional imbalances.
2 A strong regional policy
A strong national economy is a necessary but not sufficient condition for closingregional disparities in prosperity and crucially those that stem from differences inemployment rates. For those regions and sub-regions where there is a concentration ofTTWAs with low employment rates, a set of policy instruments is required to helpstimulate the demand for labour across the board. The rest of this chapter will exploresome of the most visible of those instruments: Regional Selective Assistance and EUStructural Funds. The aim would be to increase labour demand across broad areas oflow employment not close to tight labour markets. This is not the same as locallytargeted job creation. One issue that needs to be further discussed is whether withinthe lagging regions, the promotion of employment within specific ‘growth areas’ is abetter tactic than trying to promote employment everywhere. Another tricky issue iswhether very localised concentrations of low employment within advantaged regions– such as Thanet in the South East – are best dealt with by trying to generateemployment there or in TTWAs close by (for example, Ashford), with improved localtransport links connecting the two. These are the kinds of issues best left to localdecision-makers.
3 Supply-side measures
Policy instruments designed to help individuals access employment across the locallabour market are relevant to all the UK’s regions and localities. For cities like Londonthey are the most important set of instruments. They include measures to reduce thenumbers of young people leaving the education system with low skills andqualifications and helping more disadvantaged adults to access a range of learningopportunities. Some of these skills related issues are taken up in the Chapter 4. Alsorelevant are the battery of active labour market policies and tax/benefit reformsdesigned to help people access employment and to sharpen the incentives to do so.
40 A new regional policy for the UK

Those elements of government policy targeted at priority groups such as disabledpeople, over-50s, lone parents and ethnic minorities will have specific regional impactsas we have seen. Given the concentrations of inactivity due to long-term sickness anddisability in the less advantaged regions, measures to improve the employment ratesof this group are of particular relevance to tackling regional disparities in prosperity.Some of the strengths and weaknesses of the Government’s current approach in thisarea are addressed in a recent ippr report by Stanley and Regan (2003). Theannouncement in Budget 2003 to give Jobcentre Plus districts greater flexibility anddiscretion is very welcome, though it raises questions about the structure of JobcentrePlus. This UK-wide agency needs to be structured geographically in a way that betterfits other regional and local boundaries. Indeed the setting up of Jobcentre Plus wasa missed opportunity to align its boundaries with other institutions, such as theLearning and Skills Councils in England.
4 Measures to reduce residential segregation and the links between segregation and disadvantage
The analysis presented in this report does not suggest a focus only on the efficiencywith which labour markets function. We have seen that the way that housing marketsfunction leads to concentrations of non-employment and associated deprivation thatmay compound the problems faced by disadvantaged jobseeekers. There is clearly anagenda here for housing policy: housing authorities have to take seriously the objectiveof trying as far as possible to create mixed neighbourhoods, mixed by tenure,ethnicity, class and educational background. But there is also an agenda for otherareas of social policy especially in relation to children and adolescents. The evidencefor the adverse outcomes that result from heavily segregated schools is perhaps clearerthan anywhere else. The appropriate policy response is to look at all those issuesrelating to catchment areas and to formal and informal methods of selection thatresult in polarised intakes. ‘No selection and less polarisation under Labour’ might bea mantra that it is time to resurrect. There is an important set of supply-side policiesthat pose real challenges for middle England.
A strong regional policy: creating jobs in the regions
1 Regional Selective Assistance
For those regions and sub-regions where there is a concentration of TTWAs with lowemployment rates, what set of policy instruments can be used to help stimulate thedemand for labour across the board? The Government already possesses one policy
Employment and regional policy 41
tool that has the aim of creating or safeguarding jobs within the disadvantagedregions. Regional Selective Assistance (RSA), according to Harvey Armstrong‘remains the most important of the national regional policy instruments in Britain.Alongside the European Union’s Structural Funds programmes, it forms the backboneof regional policy in Britain’ (Armstrong 2001, original emphasis).
RSA is a discretionary grant awarded to projects within Assisted Areas wherecapital expenditure exceeds £500,000, and where it can be proven that theexpenditure would not have happened without the provision of grant funding. Forprojects where the capital expenditure is lower than £500,000, another discretionaryscheme, the Enterprise Grant Scheme, was established in 2000 and is run by theSmall Business Service. In England, RSA grants of under £2 million are administeredby the RDAs, but for grants of over £2 million the DTI has retained control. RSAgrants can be provided to: establish a new business; expand, modernise and/orrationalise an existing business; set up research and development facilities; or enablebusinesses to take the next step from development to production (DTI 2003). TheGovernment has since 1998 emphasised the need for RSA to support ‘high quality,knowledge-based’ projects in line with its productivity agenda, but in practice as theNational Audit Office (NAO) (2003) noted, in regions such as the North East,securing jobs has continued to be the main objective for the scheme.
RSA has had somewhat of a chequered history in meeting its three objectives ofattracting or retaining internationally mobile investment, improving thecompetitiveness of firms in disadvantaged areas, and creating or safeguardingemployment. The NAO (2003) argued that RSA had a poor record in terms ofpromoting productivity and ‘competitiveness’, though to be fair these were not theobjectives of the scheme over the periods when it has been subject to evaluation.However, the NAO also acknowledged that RSA had made important contributionsto the attraction of mobile international investment and, importantly, increasing levelsof employment in Assisted Areas.
It is unfortunate that the media seized upon the NAO report’s argument that thelevels of employment created or secured by RSA had been less than expected. Threecomments could be made in relation to this observation.
First, it has been observed by commentators such as Armstrong (2003) that RSAsuffers from the problem of ‘asymmetric evaluation’. Other policies that are ‘flavour ofthe month’ such as business clusters have not been subjected to the same robustevaluations as RSA has. The NAO explicitly acknowledged this, noting that ‘the depthand frequency of evaluations [of RSA] compared well with other Departmentalschemes and with evaluation practices for similar schemes run by other countries’(NAO 2003, para 16)
Second, it could be argued that RSA remains a fairly cost-effective job-creationtool. Indeed, both Armstrong (2001) and Wren (2002) argue that this cost-
42 A new regional policy for the UK

effectiveness has significantly improved in recent years, not least because regionalassistance has operated on a selective rather than an automatic basis since the 1980s.The most recently published DTI evaluation of RSA, covering the period 1991-1995,supported this conclusion. An Arup report indicated that RSA grants made during thisperiod created or safeguarded 40,000 net additional permanent job equivalents, at anet cost per job of £17,500 in 1995 terms (Arup Economics and Planning 2000). TheNAO argued that the evaluation over-estimated the additional net jobs created andtherefore underestimated the net cost per job. However, even their revised estimates of21,000 extra jobs at a net cost per net job of nearly £21,000 (at 2002 prices) over1991-1995 represented much needed jobs in areas of high unemployment.
Finally, portrayals of RSA as a grant which has ‘wasted millions’ (Blitz and Chung2003) fails to appreciate the necessity of an instrument that is geared towardsgenerating jobs in the UK’s lagging regions. In the absence of other instrumentsgeared to this end, the abandonment of RSA or an equivalent scheme would send allthe wrong signals. So rather than trying to dismantle RSA, we should concentrate onenhancing the effectiveness of this important policy tool within the regions that requirea stimulation to labour demand.
There are several ways in which RSA itself or any revised instrument that mightreplace RSA (and Enterprise Grants) could be re-structured to enhance its effectiveness.
� We need to return to a more rational basis for defining the Assisted Areaswhere RSA would be available
� More assistance should be channelled to service industries than at present
� Less RSA should be used to support big inward investment projects as opposedto indigenous enterprises
� Consideration should be given to increasing the amount of spending allocatedto RSA
Defining the Assisted Areas
The decision was made in 2000 to use wards rather than TTWAs to define theboundaries for the Assisted Areas. The subsequent creation of a patchwork of smallareas eligible for assistance was a quite deliberate political decision to spread theregional jam thinly. However, wards are an inappropriate spatial scale at which toaddress the issue of creating employment. As Gordon (1999) has emphasised tryingto create employment in a small geographical area is like ‘targeting a leaky bucket’:most of the jobs created will not necessarily go to local residents. The boundaries usedmust more adequately reflect the spatial pattern of low employment areas if RSA is tomeet its job-creation objective more effectively. TTWA boundaries will themselves
Employment and regional policy 43

need to be adjusted following the 2001 Census, but they remain the best availableway of mapping spatial variations in employment. Most critically we need to re-concentrate effort on those regions and sub-regions where there is a concentration ofTTWAs with low employment rates.
By being targeted at the ward level, RSA grants are often focused on the areas ofhighest unemployment and deprivation, potentially excluding nearby areas ofpotential employment growth. By redrawing the map along TTWA lines, this ‘patchy’coverage would be reduced, and the Assisted Area boundaries would more ofteninclude areas more likely to attract new employment. Indeed having a smaller numberof Assisted Areas each drawn with somewhat wider boundaries would better fit theGovernment’s own emphasis on encouraging wider travel-to-work horizons and allowfor some concentration of effort. The corollary of course is that the patchwork quilt ofwards with Assisted Area status outside of the disadvantaged regions would disappear.But isolated wards in London do not need instruments to promote job creation; theirresidents need supply-side measures designed to help them access jobs across themetropolitan labour market alongside measures to promote physical regeneration. Inshort they need urban policy and welfare-to-work initiatives, not regional policy.
Redressing the manufacturing bias
The NAO highlighted that the majority of RSA grants are allocated to themanufacturing sector (about 90 per cent of the value of grant offered over the period1994-2002). The manufacturing sector is important and should not be neglected. Butas a recent ippr report (Brooks and Robinson 2003) argued, it is a sector that is likelyto continue to decline as a proportion of total output and employment. For thoseregions still disproportionately dependent on manufacturing, a critical objective is tohelp them diversify their employment base by attracting a higher proportion of ‘non-local’ or traded services including, for example, business services. RSA should,therefore, be more aggressively marketed to service sector companies. More emphasisshould also be placed on the use of RSA to support Research and Development andother forms of innovative activity that may not involve really big programmes ofcapital spending.
Fewer prestige inward investment projects
One of the most important ways of making RSA more cost-effective would be to useit less for attracting large ‘prestige’ inward investment projects and to steer it morefirmly to supporting the creation and expansion of smaller indigenous enterprises. TheNAO report pointed out that 53 per cent of the value of grant awarded over theperiod 1992-2002 went to foreign owned companies. Furthermore, Foreign Direct
44 A new regional policy for the UK
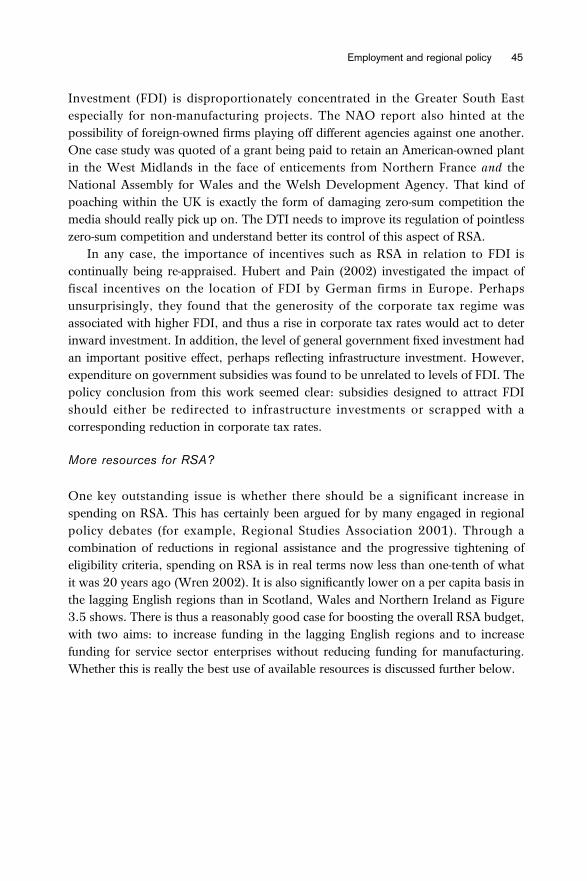
Investment (FDI) is disproportionately concentrated in the Greater South Eastespecially for non-manufacturing projects. The NAO report also hinted at thepossibility of foreign-owned firms playing off different agencies against one another.One case study was quoted of a grant being paid to retain an American-owned plantin the West Midlands in the face of enticements from Northern France and theNational Assembly for Wales and the Welsh Development Agency. That kind ofpoaching within the UK is exactly the form of damaging zero-sum competition themedia should really pick up on. The DTI needs to improve its regulation of pointlesszero-sum competition and understand better its control of this aspect of RSA.
In any case, the importance of incentives such as RSA in relation to FDI iscontinually being re-appraised. Hubert and Pain (2002) investigated the impact offiscal incentives on the location of FDI by German firms in Europe. Perhapsunsurprisingly, they found that the generosity of the corporate tax regime wasassociated with higher FDI, and thus a rise in corporate tax rates would act to deterinward investment. In addition, the level of general government fixed investment hadan important positive effect, perhaps reflecting infrastructure investment. However,expenditure on government subsidies was found to be unrelated to levels of FDI. Thepolicy conclusion from this work seemed clear: subsidies designed to attract FDIshould either be redirected to infrastructure investments or scrapped with acorresponding reduction in corporate tax rates.
More resources for RSA?
One key outstanding issue is whether there should be a significant increase inspending on RSA. This has certainly been argued for by many engaged in regionalpolicy debates (for example, Regional Studies Association 2001). Through acombination of reductions in regional assistance and the progressive tightening ofeligibility criteria, spending on RSA is in real terms now less than one-tenth of whatit was 20 years ago (Wren 2002). It is also significantly lower on a per capita basis inthe lagging English regions than in Scotland, Wales and Northern Ireland as Figure3.5 shows. There is thus a reasonably good case for boosting the overall RSA budget,with two aims: to increase funding in the lagging English regions and to increasefunding for service sector enterprises without reducing funding for manufacturing.Whether this is really the best use of available resources is discussed further below.
Employment and regional policy 45
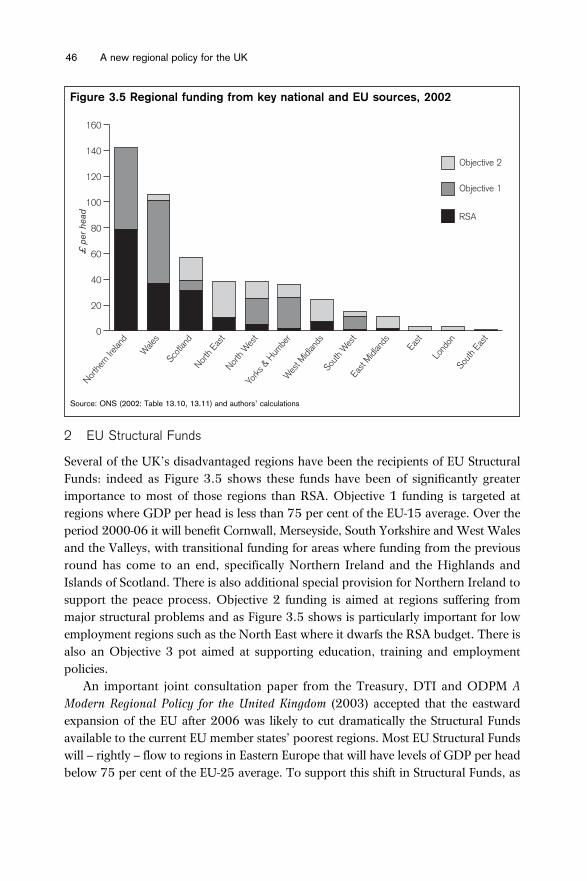
2 EU Structural Funds
Several of the UK’s disadvantaged regions have been the recipients of EU StructuralFunds: indeed as Figure 3.5 shows these funds have been of significantly greaterimportance to most of those regions than RSA. Objective 1 funding is targeted atregions where GDP per head is less than 75 per cent of the EU-15 average. Over theperiod 2000-06 it will benefit Cornwall, Merseyside, South Yorkshire and West Walesand the Valleys, with transitional funding for areas where funding from the previousround has come to an end, specifically Northern Ireland and the Highlands andIslands of Scotland. There is also additional special provision for Northern Ireland tosupport the peace process. Objective 2 funding is aimed at regions suffering frommajor structural problems and as Figure 3.5 shows is particularly important for lowemployment regions such as the North East where it dwarfs the RSA budget. There isalso an Objective 3 pot aimed at supporting education, training and employmentpolicies.
An important joint consultation paper from the Treasury, DTI and ODPM AModern Regional Policy for the United Kingdom (2003) accepted that the eastwardexpansion of the EU after 2006 was likely to cut dramatically the Structural Fundsavailable to the current EU member states’ poorest regions. Most EU Structural Fundswill – rightly – flow to regions in Eastern Europe that will have levels of GDP per headbelow 75 per cent of the EU-25 average. To support this shift in Structural Funds, as
46 A new regional policy for the UK
Figure 3.5 Regional funding from key national and EU sources, 2002
Source: ONS (2002: Table 13.10, 13.11) and authors’ calculations

the UK government does, is consistent with the aims of a pro-European centre-leftgovernment. Yet even if this is accepted, there is still the question of how the pressingneeds of the UK’s lagging regions can be addressed. After 2006 perhaps onlyCornwall will remain eligible for Objective 1 status. The loss of the resources providedby this other major instrument of regional policy within the UK – along with RSA –could have serious implications for the lagging regions.
To address this issue, the Government has proposed a ‘re-nationalisation’ ofregional policy within the existing higher income member states. Specifically thiswould be a re-nationalisation of Objective 2 funding. In essence the UK Governmentwants to see policy separated from funding – regional policy would remain an area ofcompetence for the EU Commission. Under a ‘EU Framework for Devolved RegionalPolicy’ richer member states with the financial and institutional strength to do sowould resource regional policy domestically, whilst supporting EU Frameworkobjectives. The Government has guaranteed that domestic regional funding would beincreased. However, it should be noted that this guarantee does not mean acontinuation of the existing level of receipts – rather it covers those receipts that UKregions might have been eligible for if the current allocation criteria were appliedacross an enlarged EU.
Given the emphasis we have given to the need to tackle low levels of employmentin the disadvantaged regions there is an obvious way to ‘re-nationalise’ regional policyin a manner that would continue to emphasise the Government’s commitment to theEU’s agenda. The Lisbon summit in 2000 had a twin focus on employment andproductivity. However, its clearest headline goal was the objective of ensuring that allparts of the EU meet a target of at least 70 per cent of the adult workforce inemployment by 2010. One way of emphasising the UK’s commitment to thisobjective would be to concentrate additional UK government resources on thoseTTWAs in the disadvantaged regions with employment rates at or below 70 per cent.This would provide a useful ‘floor target’ for regional policy. The Assisted Areas mapwould be re-drawn in the manner suggested above.
It is not, however, necessarily the case that the additional UK governmentspending designed to compensate for the withdrawal of EU Structural Funds wouldonly go on instruments such as RSA. It might well be more effective to use the fundingfor regional or local transport improvements for example, or for additional activelabour market programmes. The most effective use of additional resources would bebest left to local and regional agencies.
Conclusion
An important explanation for regional disparities in prosperity is the low employmentrates in the less advantaged regions of the UK. The nature of the employment
Employment and regional policy 47

problem, however, is different across labour markets. For the residents of deprivedareas within otherwise prosperous cities, what is required are supply side measures tohelp them access jobs across the whole of the metropolitan labour market. For thelarge set of Travel-To-Work Areas in the disadvantaged regions where employmentrates are uniformly low, what is required are similar supply-side measures to helppeople improve their ability to compete in the labour market, combined with policyinstruments designed to create more jobs within easy travelling distance.
Addressing low employment rates requires a four-fold policy response:
� A strong national economy
� A strong regional policy
� Supply side measures
� Measures to reduce residential segregation and the links between segregationand disadvantage
The desirable re-focusing of EU Structural Funds after enlargement in 2006 offers theopportunity to re-invigorate regional policy in the UK. The Assisted Areas map shouldbe re-drawn and regional instruments such as RSA concentrated to focus on the set ofTTWAs in the disadvantaged regions with employment rates at or below the 70 percent ‘floor’ identified by the Lisbon process. More resources would be made available,though not only through Regional Selective Assistance. RSA itself needs to berebalanced so it focuses less on big inward investment projects and more on tradedservices.
48 A new regional policy for the UK

4. The regional skills, education and training agenda
One of the important advantages of giving employment as much consideration asproductivity in the regional policy agenda is that it allows for a much more detaileddiscussion of the role of skills, education and training to that agenda. Indeed it allowsone to immediately clarify that different elements of education and training policy arelikely to be relevant to employment on the one hand and to productivity on the other.The current policy debate is often confused on this point, with government prioritiesin relation to the attainment of basic skills and lower level qualifications for example,sold in official policy documents in relation to their contribution to productivity, whentheir contribution to employment is actually much more obvious. To reiterate thepoint, documents like Productivity 3 remove emphasise the role of skills as one of thedrivers of productivity, but do not emphasise the role of education and training as oneof the drivers of employability.
There are other confusions in the debate. The term ‘workforce development’ isused loosely to describe all adult education and training activity outside of highereducation. It thus confuses the training that firms undertake with the education andtraining that individuals undertake. This distinction is of vital importance in policyterms. Policies aimed at individuals are likely to differ significantly from policies aimedat firms; if the two are confused, the result could be confusing policies. Firmsundertake training as part of their wider plans for the development of their workforceto meet their core business objectives; the demand for training is derived from thoseobjectives. The economic motivation for individuals to undertake their own learningactivities is to secure progression in the labour market and higher lifetime earnings.For the individual securing this progression may mean leaving their current employer,the point being that the motivations of firms and of individuals may not always orindeed often converge.
Most public funding of education and training follows the individual learner,covering all or part of the direct costs of courses at a range of institutions andsometimes helping with the indirect costs (like materials or transport) and withmaintenance too. Much more modest sums go towards policy instruments aimedspecifically at employers. This is clearly right in principle. Public policy should beaimed first and foremost at lowering those barriers, including financial, that preventindividuals from obtaining the qualifications and skills they need to progress. Publicpolicy should avoid subsidising firms to do what they should be doing anyway interms of developing their workforce to meet their business objectives. Unfortunately,the public policy debate has been blown off course by – largely unsubstantiated –arguments that the learning chosen by individuals somehow does not fit therequirements of employers, leading to widespread skill shortages, with the additionalargument that planning bodies could do a better job of matching the two.
49
This debate is in turn linked to the discussions about the right spatial scale atwhich to organise post-compulsory education and training policy in England. FromApril 2003 two pilot schemes were launched to give some RDAs a leading role in themanagement and co-ordination of Business Links, and also responsibilities for co-managing with local Learning and Skills Councils (LSCs) funding for post-19education and training outside of higher education. This would involve ‘pooling’ theRDAs’ very modest skills budgets (largely aimed directly at employers) with the muchbigger budgets for education and training held by the local LSCs (aimed atindividuals). These developments were seen, rightly, as another indication of therelative influence of the RDAs on policy makers at the Treasury, with the suspicionthat this ‘pooling’ could be the precursor to the RDAs taking over responsibilityentirely for the funding of post-19 education and training outside of Higher Education.However, the Skills White Paper (DfES 2003a) signalled a much more modest agendaof the RDAs leading on the establishment of Regional Skills Partnerships which wouldbe unlikely to control budgets and therefore have much power.
From September 2002 a range of Employer Training Pilots has also beenunderway in a number of local LSC areas to test out a range of incentives to employersto release staff to undertake learning aimed at achieving better basic skills andqualifications at level 2. These pilots are well targeted at helping existing employees toobtain the skills and qualifications likely to improve their employability. The results ofa thorough evaluation of these pilots will become available from 2004. It will be agood test of the model of evidence-based policy making to see if the Government canwait that long to see how well the different incentives have worked in practice beforelaunching any policy nationwide.
We will return to some of these important policy agendas later in the chapter, butfirst it is important to set out how the regions vary in terms of the qualifications andskills of their workforces. This will be the result both of the outputs of the educationand training systems within each region and, as importantly, patterns of selectivemigration of labour between the regions.
How the regions compare
Generally qualifications are used as a proxy for skills in much analysis and policydebate, for the simple reason that the holding of qualifications is something that we canmore easily measure. Overall there is a fairly clear ‘north-south gap’ across the Englishregions in terms of the stock of qualifications held by people of working age (Figure4.1). In particular London and the South East have significantly higher proportions ofthe working age population with higher education (level 4+) qualifications and lowerproportions of the population with no qualifications. The three northern Englishregions and the Midlands regions have fewer graduates and more unqualified people.
50 A new regional policy for the UK
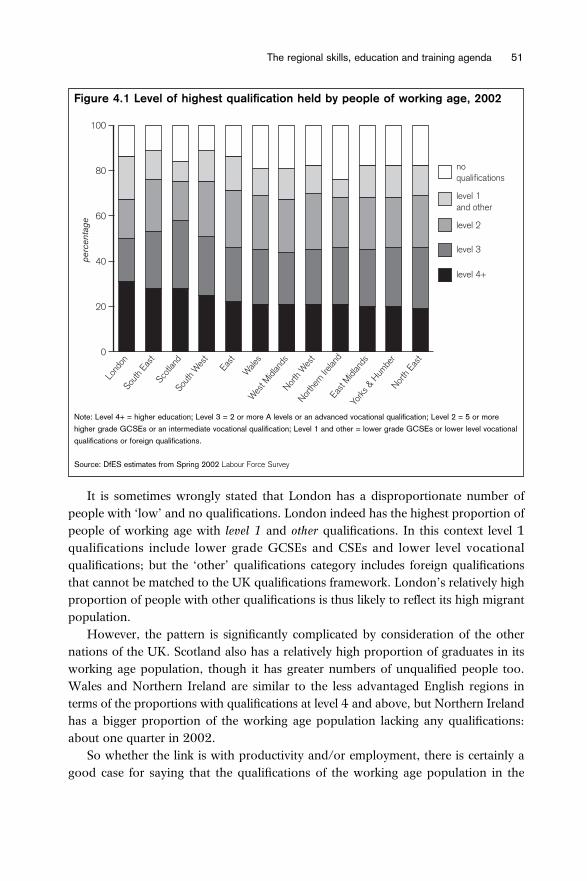
It is sometimes wrongly stated that London has a disproportionate number ofpeople with ‘low’ and no qualifications. London indeed has the highest proportion ofpeople of working age with level 1 and other qualifications. In this context level 1qualifications include lower grade GCSEs and CSEs and lower level vocationalqualifications; but the ‘other’ qualifications category includes foreign qualificationsthat cannot be matched to the UK qualifications framework. London’s relatively highproportion of people with other qualifications is thus likely to reflect its high migrantpopulation.
However, the pattern is significantly complicated by consideration of the othernations of the UK. Scotland also has a relatively high proportion of graduates in itsworking age population, though it has greater numbers of unqualified people too.Wales and Northern Ireland are similar to the less advantaged English regions interms of the proportions with qualifications at level 4 and above, but Northern Irelandhas a bigger proportion of the working age population lacking any qualifications:about one quarter in 2002.
So whether the link is with productivity and/or employment, there is certainly agood case for saying that the qualifications of the working age population in the
The regional skills, education and training agenda 51
Figure 4.1 Level of highest qualification held by people of working age, 2002
Note: Level 4+ = higher education; Level 3 = 2 or more A levels or an advanced vocational qualification; Level 2 = 5 or more
higher grade GCSEs or an intermediate vocational qualification; Level 1 and other = lower grade GCSEs or lower level vocational
qualifications or foreign qualifications.
Source: DfES estimates from Spring 2002 Labour Force Survey
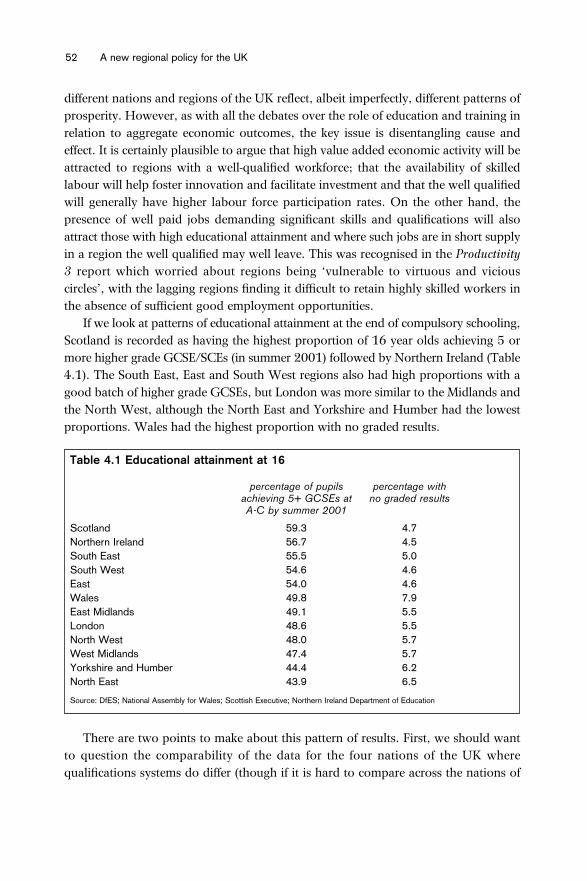
different nations and regions of the UK reflect, albeit imperfectly, different patterns ofprosperity. However, as with all the debates over the role of education and training inrelation to aggregate economic outcomes, the key issue is disentangling cause andeffect. It is certainly plausible to argue that high value added economic activity will beattracted to regions with a well-qualified workforce; that the availability of skilledlabour will help foster innovation and facilitate investment and that the well qualifiedwill generally have higher labour force participation rates. On the other hand, thepresence of well paid jobs demanding significant skills and qualifications will alsoattract those with high educational attainment and where such jobs are in short supplyin a region the well qualified may well leave. This was recognised in the Productivity3 report which worried about regions being ‘vulnerable to virtuous and viciouscircles’, with the lagging regions finding it difficult to retain highly skilled workers inthe absence of sufficient good employment opportunities.
If we look at patterns of educational attainment at the end of compulsory schooling,Scotland is recorded as having the highest proportion of 16 year olds achieving 5 ormore higher grade GCSE/SCEs (in summer 2001) followed by Northern Ireland (Table4.1). The South East, East and South West regions also had high proportions with agood batch of higher grade GCSEs, but London was more similar to the Midlands andthe North West, although the North East and Yorkshire and Humber had the lowestproportions. Wales had the highest proportion with no graded results.
There are two points to make about this pattern of results. First, we should wantto question the comparability of the data for the four nations of the UK wherequalifications systems do differ (though if it is hard to compare across the nations of
52 A new regional policy for the UK
Table 4.1 Educational attainment at 16
percentage of pupils percentage with achieving 5+ GCSEs at no graded resultsA-C by summer 2001
Scotland 59.3 4.7 Northern Ireland 56.7 4.5 South East 55.5 5.0 South West 54.6 4.6 East 54.0 4.6 Wales 49.8 7.9 East Midlands 49.1 5.5 London 48.6 5.5 North West 48.0 5.7 West Midlands 47.4 5.7 Yorkshire and Humber 44.4 6.2 North East 43.9 6.5
Source: DfES; National Assembly for Wales; Scottish Executive; Northern Ireland Department of Education

the UK this might also counsel caution about easy comparisons of qualificationsbetween the UK and other countries).
Second, the results should remind us that a range of background factors such associal class and parental education and experience of child poverty are majordeterminants of educational attainment. It could be argued that given its relativelyhigh levels of child poverty and all the challenges posed by such a diverse pupil base,the results posted by London’s schools are creditable (Johnson 2003). Although‘value-added’ analysis of educational attainment is in its relative infancy and is muchcontested, the finding reported in the Cabinet Office Strategy Unit Analytical Reporton London (Cabinet Office 2003a) that London’s schools appear to add more valueto individual pupil performance between Key Stage 3 and GCSE is very interesting.This same analysis also suggested that North East schools added less value. Relativelyhigh levels of child poverty, a significantly higher proportion of parents from lowersocial class backgrounds and without higher education will help explain the positionof the North East at the bottom of Table 4.1, but the relatively poor performance ofNorth East schools may also be a factor.
There is thus the potential of a further vicious circle here: less advantaged regions,where fewer parents have experience of higher education and more childrenexperience poverty, will have lower levels of educational attainment. Then thoseyoung people who do attain good qualifications may migrate out of the region in theabsence of enough good jobs locally. Both processes will help explain the correlationbetween economic success and the attainment of qualifications.
The proportion of 16 year olds staying on in full-time education or in governmentsupported training in 1999-2000 was significantly higher in Scotland, but varies onlymodestly across the English regions (Table 4.2). This, however, hides a pattern thatregions with high proportions going into full-time education tend to have lowerproportions going into training and vice-versa, with the three most advantaged Englishregions having higher staying-on rates in full-time education. These patterns are partlyrelated to differences in industrial structure and partly to differences in attainment at 16,with a solid batch of GCSE results a good predictor of staying on in full-time education.However, even adjusting for GCSE results, strong regional differences in staying onrates in full-time education have persisted for many years (Payne 1998, 2001). Usingdata pooled from the Youth Cohort Study for 1988-1995 and controlling for a rangeof background factors, Payne (1998) found the odds of staying on were highest inLondon and the South East. Payne (2001) emphasised that the links between the locallabour market, local social and economic conditions, local cultural norms and localstructures of education and training provision need to be much better understood ifgeographical inequalities in educational participation were to be tackled.
There is plenty of evidence for the selective out-migration of the better qualifiedfrom the lagging English regions. Figure 4.2 provides a snapshot based on data from
The regional skills, education and training agenda 53

the Labour Force Survey for 2000-02 and shows the five northern and midlandsregions losing people with post-school qualifications to the southern regions, thoughScotland and Wales also show up as modest net importers of the better qualified.Highly qualified people who leave the less advantaged English regions are,unsurprisingly, acting quite rationally. For example, there is evidence that graduatesfrom North East universities that leave the region after graduation do better thanthose who choose to remain (Belt et al 2002). This finding is based on data on thefirst destinations of graduates, but the drifting away of the better qualified is likely tobe a cumulative affair. Public agencies in regions such as the North East give greatattention to graduate retention programmes, but in the absence of a sufficient supplyof ‘good’ jobs to retain the highly qualified, such programmes face an uphill struggle.
The data on the qualifications held by young people and the working agepopulation reflect wholly or largely the outputs of the formal, publicly funded,education and training system, from the schools and further and higher education.Firms also provide more specific job-related training, occasionally including provisionpurchased from outside the firm. Figure 4.3 shows the standard measure drawn fromthe Labour Force Survey of the percentage of male and female employees of working
54 A new regional policy for the UK
Table 4.2 16 year olds participating in post-compulsory education andgovernment-supported training, 1999-2000
In further education1 Government- All in full-timeat school2 full-time part-time supported education
training (GST)3 and GST3,4
Scotland 69.0 11.7 8.9 9.0 89.8 South West 39.0 35.1 5.6 7.1 80.6 South East 39.8 35.4 4.2 5.4 80.2 East 40.8 34.0 5.2 6.0 80.2 London 40.3 34.6 4.6 4.2 78.9 Wales 37.9 33.3 5.7 7.1 78.3 East Midlands 37.7 31.7 8.8 9.2 78.0 North West 24.6 42.5 6.8 11.1 77.1 West Midlands 31.9 37.0 7.6 8.8 76.8 Yorks & Humber 30.9 35.0 9.1 11.6 76.7 North East 26.3 37.5 8.7 not available not available Northern Ireland 47.8 28.7 8.7 not available not availableUnited Kingdom 38.5 33.6 6.6 8.3 79.6
Notes:
1 students on courses outside of school but below higher education level, including sixth form colleges in England and a small
element of further education in higher education institutions in England and Scotland.
2 residence-based.
3 GST figures for Tees Valley, and therefore the North East, were not available at the time of data collection. Figures in the UK
row refer to GB.
4 Figures for England exclude overlap between full-time education and government-supported training.
Source: ONS (2002: Table 4.8)

age receiving any job-related training in the previous four weeks. It shows nosignificant variation by region and what variations there are will almost certainly beexplained by differences in industrial structure.
The regional skills, education and training agenda 55
Figure 4.2 Net migration to British nations and regions by those with post-school qualifications, 2000-02
Source: Labour Force Survey in ONS (2003)
Figure 4.3 Employees of working age receiving any job-related training, 2003
Source: Labour Force Survey Spring 2002
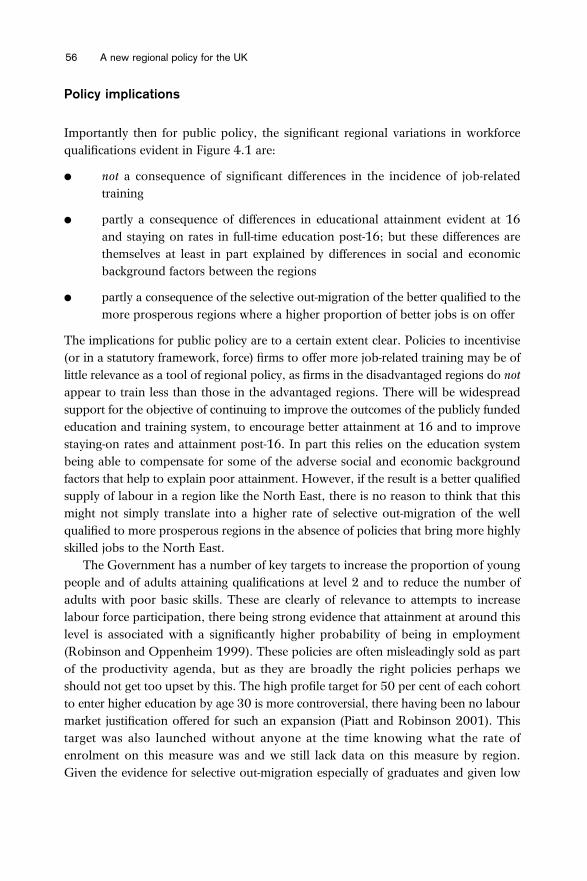
Policy implications
Importantly then for public policy, the significant regional variations in workforcequalifications evident in Figure 4.1 are:
� not a consequence of significant differences in the incidence of job-relatedtraining
� partly a consequence of differences in educational attainment evident at 16and staying on rates in full-time education post-16; but these differences arethemselves at least in part explained by differences in social and economicbackground factors between the regions
� partly a consequence of the selective out-migration of the better qualified to themore prosperous regions where a higher proportion of better jobs is on offer
The implications for public policy are to a certain extent clear. Policies to incentivise(or in a statutory framework, force) firms to offer more job-related training may be oflittle relevance as a tool of regional policy, as firms in the disadvantaged regions do notappear to train less than those in the advantaged regions. There will be widespreadsupport for the objective of continuing to improve the outcomes of the publicly fundededucation and training system, to encourage better attainment at 16 and to improvestaying-on rates and attainment post-16. In part this relies on the education systembeing able to compensate for some of the adverse social and economic backgroundfactors that help to explain poor attainment. However, if the result is a better qualifiedsupply of labour in a region like the North East, there is no reason to think that thismight not simply translate into a higher rate of selective out-migration of the wellqualified to more prosperous regions in the absence of policies that bring more highlyskilled jobs to the North East.
The Government has a number of key targets to increase the proportion of youngpeople and of adults attaining qualifications at level 2 and to reduce the number ofadults with poor basic skills. These are clearly of relevance to attempts to increaselabour force participation, there being strong evidence that attainment at around thislevel is associated with a significantly higher probability of being in employment(Robinson and Oppenheim 1999). These policies are often misleadingly sold as partof the productivity agenda, but as they are broadly the right policies perhaps weshould not get too upset by this. The high profile target for 50 per cent of each cohortto enter higher education by age 30 is more controversial, there having been no labourmarket justification offered for such an expansion (Piatt and Robinson 2001). Thistarget was also launched without anyone at the time knowing what the rate ofenrolment on this measure was and we still lack data on this measure by region.Given the evidence for selective out-migration especially of graduates and given low
56 A new regional policy for the UK

employment rates in the less advantaged regions, for them the focus on attainment ofbasic skills and level 2 qualifications is surely the right priority.
The question then arises as to which specific policy instruments and whichstructures of funding and delivery should different regions and local areas have to meettheir objectives for improving the attainment of skills and qualifications, especially atlower levels.
The debate over whether to ‘regionalise’ the local Learning and Skills Councils’budgets for adult education and training is driven by the notion that the result wouldbe a better match between the skills of the workforce and the demands of employersthrough the operation of some form of planning mechanism. This aspiration isembodied in the Frameworks for Regional Employment and Skills Action (FRESAs)drawn up by the RDAs in consultation with other stakeholders. In fact suchdocuments tend to be very general in nature, with little attention to priority setting: theLondon FRESA identifies sectors for priority action that make up 95 per cent ofemployment in the capital.
The debate also treats subliminally the key issue involved in any attempt to givegreater priority to ‘planning’. Currently, public funding follows the adult learner,creating a quasi-market where the individual reads the signals from the labour marketand chooses a course from a provider that would best secure individual progression.Good quality information and guidance, a competitive provider network and a rangeof actions to tackle barriers facing individual learners are necessary to make such aquasi-market work effectively. If the criticism of this quasi-market is that the existenceof widespread skill shortages shows that too many individuals are making the ‘wrong’decisions, the alternative would presumably involve the planners constraining thosechoices and encouraging individuals to make different decisions. This boils down toa belief that the planners could make better decisions than adults could about theirown individual learning. This would seem peculiar logic: 18 year olds are assumed tobe able to take their own informed decisions in relation to higher education; why aremature adults assumed not to be able to take their own informed decisions in relationto further education and training?
The debate over regionalisation is therefore to a certain extent a bit of a redherring. The real issue is whether we want to continue to empower individuals tomake their own informed choices or whether we want to ‘plan’ to meet the ‘needs’ ofthe labour market as identified by bodies such as the RDAs. As most jobseekers arereading their signals from the local labour market and given that information andguidance are best provided and practical barriers to learning best tackled at a locallevel, and it is generally desirable to avoid unnecessary administrative upheaval, thecurrent arrangements might be best left alone. The Government’s current emphasis onestablishing entitlements for individuals to access education and training if they lackskill and qualifications should imply that the funding continues to follow the learner.
The regional skills, education and training agenda 57
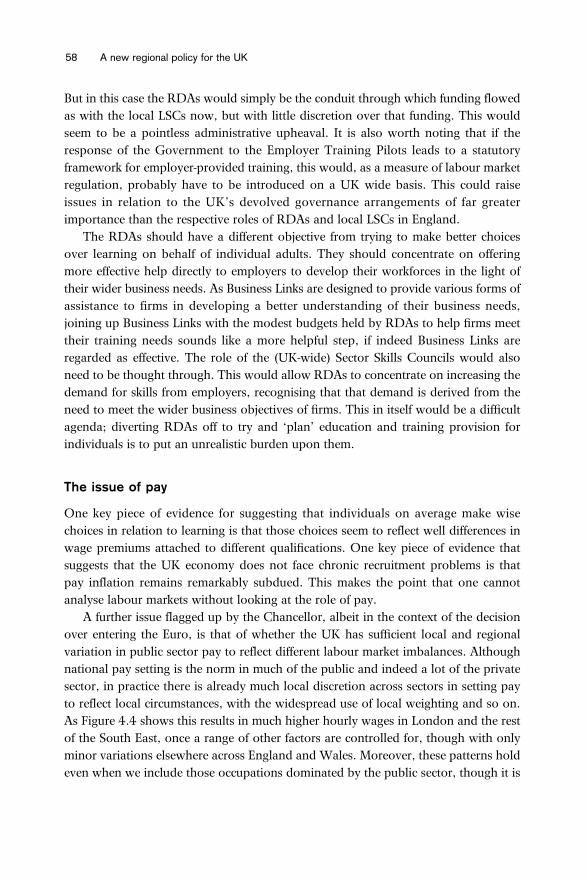
But in this case the RDAs would simply be the conduit through which funding flowedas with the local LSCs now, but with little discretion over that funding. This wouldseem to be a pointless administrative upheaval. It is also worth noting that if theresponse of the Government to the Employer Training Pilots leads to a statutoryframework for employer-provided training, this would, as a measure of labour marketregulation, probably have to be introduced on a UK wide basis. This could raiseissues in relation to the UK’s devolved governance arrangements of far greaterimportance than the respective roles of RDAs and local LSCs in England.
The RDAs should have a different objective from trying to make better choicesover learning on behalf of individual adults. They should concentrate on offeringmore effective help directly to employers to develop their workforces in the light oftheir wider business needs. As Business Links are designed to provide various forms ofassistance to firms in developing a better understanding of their business needs,joining up Business Links with the modest budgets held by RDAs to help firms meettheir training needs sounds like a more helpful step, if indeed Business Links areregarded as effective. The role of the (UK-wide) Sector Skills Councils would alsoneed to be thought through. This would allow RDAs to concentrate on increasing thedemand for skills from employers, recognising that that demand is derived from theneed to meet the wider business objectives of firms. This in itself would be a difficultagenda; diverting RDAs off to try and ‘plan’ education and training provision forindividuals is to put an unrealistic burden upon them.
The issue of pay
One key piece of evidence for suggesting that individuals on average make wisechoices in relation to learning is that those choices seem to reflect well differences inwage premiums attached to different qualifications. One key piece of evidence thatsuggests that the UK economy does not face chronic recruitment problems is thatpay inflation remains remarkably subdued. This makes the point that one cannotanalyse labour markets without looking at the role of pay.
A further issue flagged up by the Chancellor, albeit in the context of the decisionover entering the Euro, is that of whether the UK has sufficient local and regionalvariation in public sector pay to reflect different labour market imbalances. Althoughnational pay setting is the norm in much of the public and indeed a lot of the privatesector, in practice there is already much local discretion across sectors in setting payto reflect local circumstances, with the widespread use of local weighting and so on.As Figure 4.4 shows this results in much higher hourly wages in London and the restof the South East, once a range of other factors are controlled for, though with onlyminor variations elsewhere across England and Wales. Moreover, these patterns holdeven when we include those occupations dominated by the public sector, though it is
58 A new regional policy for the UK

clear that regional variations in public sector pay are much lower than for privatesector pay. Thus there is already a great deal of regional variation in pay. But is thereenough?
The regional skills, education and training agenda 59
Figure 4.4 Regional wage differences in England and Wales, 1996-2001 (Tyne & Wear = 0)
Note: Log hourly wage controlling for age and gender, ethnicity, qualifications, hours of work, job tenure and industry. NB Public sec-
tor defined as occupation likely to be dominated by public sector but including some private employers as well, eg care workers.
Source: Blanchflower, Oswald and Williamson (2002), from Labour Force Survey 1996-2001

If there was too little regional or local variation in pay we might expect a very clearregional pattern to emerge in the incidence of recruitment problems as reported byemployers. However, as Figure 3.1 showed, there was little evidence in 2002 ofwidespread persistent recruitment problems or skills shortages across England:vacancies in England as reported by employers totalled 3.1 per cent of employment,with just under half of these vacancies reported as hard-to-fill and a fifth representingskill shortages. The regional pattern was not glaringly obvious, though with the East,the South East and the South West generally reporting the biggest problems in termsof hard-to-fill vacancies. On the other hand the North West and the West Midlandsalso had relatively high incidences of skill shortage vacancies. Since this particularsurvey began in 1999 there has been little in the way of any significant trends, thoughthe incidence of skill shortage vacancies fell sharply in London in 2002. What Figure3.1 did not reveal is such an obvious ‘north-south gap’ that would tell us that thelabour market was somehow failing in a profound way to allocate labour efficiently inresponse to recruitment problems across the regions.
This general observation is of course consistent with specific problems such assome public sector organisations having particular difficulties recruiting certain typesof labour in certain localities. One question is whether the labour market generally andthe public sector specifically is able to respond adequately to recruitment problemswhen they emerge? A second question is who should bear the higher costs ofrecruitment to public services in successful congested areas? The paper from whichFigure 4.4 is drawn was commissioned by local authorities in the Greater South Eastto help demonstrate how much more costly it was to recruit staff and to make the casefor an enhanced area cost adjustment to the funds made available by centralgovernment to help public agencies recruit people in order to provide services. Thiscritical issue is discussed further in Chapter 7.
60 A new regional policy for the UK

5. Science, innovation and the regions
The support of innovation would be a key part of any government’s national andregional economic policies but debates in this area have the same tendency as othersto produce more ‘heat than light’. As in many policy areas the Government has beenhighly active and has brought forward an impressive number of initiatives, but therestill remains a sense that there is no strong central narrative in this field(HMT/DTI/DfES 2002). Instead, policy seems to have been driven by vague conceptssuch as the creation of a ‘knowledge-based economy’ and by a small number ofindividuals who have become skilled at promoting their own ideas.
Professor Michael Porter of Harvard Business School, who developed – but moreimportantly promoted – cluster theory, is only the most famous example of such a‘guru-led’ approach. Other examples are Professor Richard Florida of Carnegie MellonUniversity in Pittsburgh who brought us the ‘creative class’ and the ‘Boho Index’; andthe Work Foundation who are promoting the concept of the ‘Ideopolis’. Without astrong direction in innovation policy policy-makers will adopt too many of these ideasbefore they are rigorously analysed. It is imperative that an ‘evidence-based’ approachto innovation policy replaces the ‘guru-led’ approach we have at present.
The evaluation of innovation
One of the reasons for the lack of an evidence-based approach to innovation policy isthe paucity of good evidence from rigorous evaluation. Most genuinely newtechnologies and cutting edge production processes are produced in relatively fewcountries by a few world-leaders in companies and research institutions. These arethen disseminated and adopted by other firms and across other countries and regions(Griliches 1996). This would suggest that a large element of innovation policy mustbe a focus on dissemination and on what must seem rather mundane initiatives, suchas advances in human resource management or modest improvements in managementpractice. Evaluation of the true outcome measures of this type of activity is inherentlydifficult.
Economists would prefer a strict definition of innovation that is susceptible togrowth accounting analysis, and are unhappy that we cannot be precise about thecontribution of innovation to Total Factor Productivity (TFP). Geographers andregional policy researchers also find that innovation policy does not lend itself to theevaluative mechanisms that they are most used to dealing with, where the focus is on‘jobs created’ or ‘jobs safeguarded’.
Even given these difficulties, there is an appalling paucity of publicly availableevidence evaluating the effectiveness of schemes and what exists is often of limitedvalue. Self-selecting surveys, ‘cherry-picking’ companies and isolating heroic
61

individuals does not provide robust evaluation. The DTI’s Innovation Review (due inthe latter half of 2003) needs to take a tough line on the evaluation of programmesdesigned to support innovation, but it also needs to understand the unique nature ofinnovation policy. At the very least it should start to develop a methodology by whichoutcomes can sensibly be measured. As Brooks and Robinson (2003) have argued,the evaluation of innovation is a young science.
How the regions compare
We have argued that innovation should be regarded as a broad concept, which makesit even more difficult to measure differences between the 12 UK regions. The mostcommon proxy used is expenditure on Research and Development (R&D), but thiscannot capture all innovative activity. R&D spending is heavily concentrated inmanufacturing, and particular parts of manufacturing such as aerospace andpharmaceuticals. This is a key reason why London, for example, has relatively lowlevels of R&D spending, but this measure almost certainly fails to capture the kind ofinnovative activity taking place in the traded services sector in London.
There are now attempts to measure outputs, by means of patents and trademarks.However, this is problematic at the regional level. If a car plant in the West Midlandsdevelops a product it wishes to patent, this may be done by the headquarters of aninternational company in, for example, Germany; by the UK headquarters of thisinternational firm in London; or by the British consortium in the West Midlands thatrecently purchased the plant. The choice of office to register the patent may have littleconnection to the region in which the innovative activity is taking place.
The DTI have also recently tried to develop a broader measure of innovativeactivity by means of a postal survey. Similar surveys are being conducted in all EUcountries and the EU Commission has a co-ordinating role. We shall use this surveyand the R&D figures to explore regional innovative activity.
Business dominates R&D expenditure: 67 per cent of the total in the UK in 2000.Of the remaining 33 per cent which is public expenditure, 21 per cent is by highereducation institutions and 12 per cent by government itself. The regional breakdownfor these figures is contained in Figure 5.1. There are clear regional differences inexpenditure in each of these three sectors, for example total expenditure in the NorthEast per head was only 18 per cent of that in the East of England. It is withinGovernment spending that the sharpest divides are found: £1 per head in the NorthEast and £78 per head in the South East.
There is, therefore, a fairly clear ‘north-south divide’ in patterns of expenditure onR&D. Expenditure on R&D is a clearly not a perfect proxy for innovative activity: itis not even a useful measure of innovation inputs. The UK Innovation Survey tries tomeasure outputs and comes to a very different conclusion. This survey was funded by
62 A new regional policy for the UK

the DTI, conducted by the ONS and is part of the Community Innovation Surveycovering the EU. The data is contained in Table 5.1, and the conclusion that the DTIcame to was that there were ‘few substantial differences between regions on this broad
Science, innovation and the regions 63
Figure 5.1 Expenditure on R&D per head by nation and region, 2000
Source: ONS (2002: Table 13.9) and authors’ calculations
Table 5.1 Proportion of firms reporting innovative activity, by region
Percentage of all enterprises Size of enterprises 90% confidence interval
SME Large All All
East Midlands 47 66 47 +/-5 Eastern 44 71 45 +/-4 London 44 49 44 +/-4 North East 49 89 51 +/-6 North West 43 62 44 +/-4 South East 50 67 51 +/-4 South West 45 68 46 +/-5 West Midlands 51 78 52 +/-4 Yorks & Humber 42 70 43 +/-4 Northern Ireland 45 76 46 +/-9 Wales 45 82 47 +/-5 Scotland 42 73 44 +/-3 UK 46 67 47 +/-1
Source: DTI (2002a)

measure of innovation’ (DTI 2002a). This is obviously a different conclusion to thatarrived at via examining R&D expenditure, but it is also contrary to perceivedwisdom.
Postal surveys do not provide the strongest methodology. It is possible that thesurvey was unable to control for subjective opinion in its attempts to objectivelymeasure innovation. It is possible that firms in the ‘North’ have lower expectationsthan firms in the ‘South’ and regard certain activities as innovative when theirsouthern counterparts would not and that this affected the survey responses. However,the UK Innovation Survey cannot be simply dismissed as too counter-intuitive withoutfurther research.
It may be impossible to come to a firm conclusion on this issue as both sets of dataare too flawed to allow us to draw solid conclusions. Some may feel that it is ‘obvious’that levels of innovation in the ‘North’ are lower than in the ‘South’, simply inferringthis from regional differentials in output, employment and productivity. However, itmay not be that firms in the ‘North’ are less innovative, but that there are simply lessof them. (Enterprise policy is discussed in Chapter 6). In any case, whether or notthere are regional disparities in innovation, the prosperity gap between ‘North’ and‘South’ demands that central government target lagging regions in all the seven driversof regional prosperity, including innovation.
Public policy implications
In this chapter we do not propose to discuss all innovation initiatives of theGovernment. Rather, we shall focus on three key areas: science policy, the R&D taxcredit; and regional innovation policy (including regional innovation strategies, clusterpolicy, University-Business links and so on).
1 The science base
Science policy is not innovation policy. There is a very strong argument that theGovernment ought to fund science to expand the sum of human knowledge ratherthan to improve the productivity of firms. The theory is that, over time, any publicmoney spent on basic research would contribute to the well-being and prosperity ofthe nation – and that one should not worry too much about exactly what benefitsmight take place or when they occur.
The Government does not wholly adopt this approach. It demands a more directrelationship between economic or social benefits and funding for science – perhapsbecause of the increased resources they have been allocated, most recently in the 2002Spending Review (HMT 2002b). However, government can never be in a position tosecond-guess which research will be important once completed, and the current
64 A new regional policy for the UK
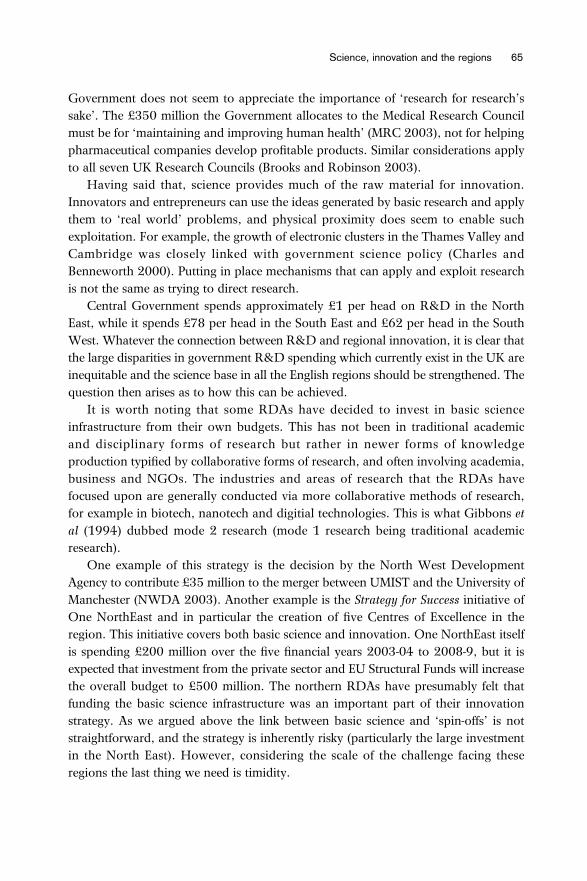
Government does not seem to appreciate the importance of ‘research for research’ssake’. The £350 million the Government allocates to the Medical Research Councilmust be for ‘maintaining and improving human health’ (MRC 2003), not for helpingpharmaceutical companies develop profitable products. Similar considerations applyto all seven UK Research Councils (Brooks and Robinson 2003).
Having said that, science provides much of the raw material for innovation.Innovators and entrepreneurs can use the ideas generated by basic research and applythem to ‘real world’ problems, and physical proximity does seem to enable suchexploitation. For example, the growth of electronic clusters in the Thames Valley andCambridge was closely linked with government science policy (Charles andBenneworth 2000). Putting in place mechanisms that can apply and exploit researchis not the same as trying to direct research.
Central Government spends approximately £1 per head on R&D in the NorthEast, while it spends £78 per head in the South East and £62 per head in the SouthWest. Whatever the connection between R&D and regional innovation, it is clear thatthe large disparities in government R&D spending which currently exist in the UK areinequitable and the science base in all the English regions should be strengthened. Thequestion then arises as to how this can be achieved.
It is worth noting that some RDAs have decided to invest in basic scienceinfrastructure from their own budgets. This has not been in traditional academicand disciplinary forms of research but rather in newer forms of knowledgeproduction typified by collaborative forms of research, and often involving academia,business and NGOs. The industries and areas of research that the RDAs havefocused upon are generally conducted via more collaborative methods of research,for example in biotech, nanotech and digitial technologies. This is what Gibbons etal (1994) dubbed mode 2 research (mode 1 research being traditional academicresearch).
One example of this strategy is the decision by the North West DevelopmentAgency to contribute £35 million to the merger between UMIST and the University ofManchester (NWDA 2003). Another example is the Strategy for Success initiative ofOne NorthEast and in particular the creation of five Centres of Excellence in theregion. This initiative covers both basic science and innovation. One NorthEast itselfis spending £200 million over the five financial years 2003-04 to 2008-9, but it isexpected that investment from the private sector and EU Structural Funds will increasethe overall budget to £500 million. The northern RDAs have presumably felt thatfunding the basic science infrastructure was an important part of their innovationstrategy. As we argued above the link between basic science and ‘spin-offs’ is notstraightforward, and the strategy is inherently risky (particularly the large investmentin the North East). However, considering the scale of the challenge facing theseregions the last thing we need is timidity.
Science, innovation and the regions 65

Notwithstanding these initiatives, the key question over the medium term iswhether the science base should be ‘regionalised’, that is, government spending onscience should be spread more evenly across the UK. A recent decision from centralgovernment is in fact likely to further centralize the science base. The Future of HigherEducation, the Government’s recent White Paper, committed the Government to thecreation of a ‘6*’ rating in the Research Assessment Exercise (the research fundingmechanism administered by the four UK Higher Education Funding Councils) (DfES2003b). The Government’s aim was to concentrate resources on the country’s‘leading’ universities in an explicit attempt to enhance the UK’s international position.The universities the Government has in mind are disproportionately located inLondon and the South East. The research element of the Government’s HigherEducation policy will work against its regional economic policy.
These are hard decisions to make: do you fund research in the Greater South Eastand risk exacerbating regional economic disparities; or do you regionalise the sciencebase and potentially harm the overall international standing of UK science?Unfortunately there will not always be a ‘win-win’ situation. The Government mayneed to choose between equity and excellence and between the international standingof academia in the UK, and a strong regional policy and full employment. We do notunderestimate the difficulty of this decision, but we would urge a centre-leftgovernment to give greater priority to regional policy issues. The question then arisesas to how the science base could be regionalised, if the Government should decide topursue that policy.
We suggest that the Government should start identifying key public sector researchinstitutions currently located in the Greater South East which could be moved, overtime, to lagging regions. Such a relocation would in itself provide scope for significantjob creation, and over time could help improve levels of innovative activity within theregion. However, it is the long-term impact that could be most significant. If keydecision-makers are no longer sited in the Greater South East there may well be aculture change that will start to address the southern-centric bias in the distribution ofUK science spending. (The distribution of public sector jobs is discussed further inChapter 7).
Within the DTI, the Office of Science and Technology (OST) takes the lead onscience, engineering and technology matters. It is based within the London headquartersof the DTI, and employs 150 staff (OST spokesperson 2003). There are seven ResearchCouncils, employing over 6,500 staff in Swindon and nearly 4,000 staff in London andthe Council for the Central Laboratory of Research Councils employs 1,800 staff inDidcot (Cabinet Office 2003c). This issue is discussed further in Chapter 7. Relocatingthese bodies to places such as Merseyside or Teesside would help improve the demandfor graduates in these areas, and would send an important signal which would do muchto affect the regional bias in science spending indicated above.
66 A new regional policy for the UK

A second option is to ‘top-slice’ new investment in science. This would mean thatfuture investment in science by central government would be divided into two budgetheadings. The first heading, which would consist of a large majority of the funding,would be open to institutions across the UK. It would follow the same distributionmechanisms that currently exist: rewarding scientific excellence through the ResearchCouncils and the Higher Education Funding Councils. However, a second budgetheading might be allocated to regional science with institutions in the Greater SouthEast ineligible for funding under this heading. Such an initiative may help boostscience activity in lagging regions.
2 The R&D tax credit
In recent years there has been an international trend away from direct grants andtowards favourable tax treatment of R&D expenditure. Tax credits attempt tostimulate business expenditure in R&D by reducing its cost: but also, importantly, byletting firms keep control over the nature and direction of research. With theintroduction of the R&D tax credit for small and medium-sized enterprises in April2000 and for larger firms in April 2002, the UK has now joined several other OECDcountries in supporting private sector R&D by this method (Chote, Emmerson andSimpson 2003).
The 2003 Budget estimated that the total cost of the tax credits in 2002-03 wouldbe £600 million (HMT 2003a: Table A3.1). While this is far less than the £1.5 billionof direct government R&D funding for the private sector in 2001, only £190 millionof this was for non-defence purposes. The tax credits constitute a significant amountof ‘lost’ revenue to the Exchequer.
While tax credits apply evenly across the UK, they do have unintended regionalconsequences. It is the firms which already invest in R&D which are the most likelyto take advantage of the tax credits, and it is the firms which invest the most whichwill be able to make the greatest deductions from their tax bill. As Figure 5.1demonstrated, these firms are disproportionately concentrated in the South East andin the East of England. If anything, the R&D tax credit is likely to reinforce the unevenpattern of R&D expenditure within the UK. This is not an argument against the R&Dtax credit, which will hopefully prove to be a useful policy initiative. It does, however,mean that the regional dimension in other areas of innovation policy needs to bestrengthened.
3 Regional innovation
Science policy and the R&D tax credit are ‘top-down’ policies. They do have regionalconsequences, but in essence they are UK-wide policies decided by ‘the centre’. There
Science, innovation and the regions 67

are, however, a number of initiatives in innovation policy that are ‘bottom-up’:regional innovation strategies, cluster policy, business-university collaboration,regional foresight and so on. Responsibility for these instruments lies with devolvedand regional institutions, and there are therefore significant variations in policybetween the different nations and regions of the UK.
Regional Innovation Strategies (RIS) developed out of the European Union’s RISinitiative. In part a mechanism to bring together the key players of the region to designthe strategy and to network and spread best practice, it is also designed to try to re-focus existing funding streams on innovation-related activities, for example RSA or EUStructural Funds. RISs are seen as particularly influential in lagging regions as theyhave proved to be a catalyst for regions that traditionally have had weak networks ofinnovation (Michie and Oughton 2001).
Traditionally, lagging regions have not easily absorbed funds for innovation (evenpublic funds), leaving prosperous regions to absorb a disproportionately large amountof the funding. This is what has been called ‘the regional innovation paradox’(Oughton, Landabaso and Morgan 2001). Improving the innovative capacity of theregions would help to resolve this situation, and in recent years the creation of RDAsin England and the development of RISs across the UK are said to have led tosignificant improvements in capacity. They are bringing together the three sectors thatconduct R&D (business, government and universities) to think broadly aboutinnovation and the local economy. While it is almost impossible to evaluate thecontribution of RISs to capacity, or even ‘social capital’, the fact that they are relativelyinexpensive counts in their favour. In England some regions have mainstreamed RISsinto the Regional Economic Strategy.
Cluster policy is perhaps the single initiative in innovation policy that has thehighest profile. Developed and promoted by Professor Michael Porter of HarvardBusiness School clusters have become a world-wide fashion, seized upon by policy-makers. They have been defined as:
Geographic concentrations of interconnected companies, specialisedsuppliers, service providers, firms in related industries, and associatedinstitutions (for example, universities, standards agencies, and tradeassociations) in particular fields that compete but also co-operate (Porter1998: 197).
However, like all fashions cluster policy is now at risk of becoming unfashionable(Martin and Sunley 2002) and numerous criticisms are being made. First of thesemust be that there has been very little evaluative research: we simply do not know howeffective they are as a policy instrument. The DTI must take a more strenuousapproach to evaluation in general, and evaluation of clusters in particular. The DTI
68 A new regional policy for the UK
must rebalance the current policy of ‘asymmetric evaluation’, where some policy tools(Regional Selective Assistance) are subjected to more rigourous evaluation than otherpolicy tools (clusters).
Another criticism often made of clusters is that the geographical definition varies,and can range from an area where businesses are located closely together, to anetwork where businesses are much more widespread (an aerospace cluster, forexample, could be spread across numerous countries). However, this criticism is farfrom fatal: it is unrealistic to demand that different businesses work to the samegeographies. Business must act as it thinks fit and the state must choose a level atwhich to conduct public policy. This will almost never perfectly map ‘real-world’experience. The regional level seems a more sensible spatial scale to consider clustersthan the alternatives of Whitehall or local government.
A criticism often made of clusters, particularly in relation to the English regions, isthat there are far too many clusters being supported. This is almost certainly a validcriticism, and the sooner ‘market forces’ are allowed to operate and thin out thenumber of clusters the better. However, it is better that some RDAs make mistakesthan they have no power or autonomy to innovate.
The most damning criticism of cluster policy is made least of all. It arises from anappreciation that cluster policy should not be regarded as part of regional policy, butis rather a regionally administered form of industrial policy. Policy-makers seemobliged to choose which of the clusters to support (an approach reminiscent of‘picking winners’). This Labour Government has lived in terror of such an idea at thenational scale, because of the reputation of previous Labour Governments forsubsidising lame ducks. This seems to be the most serious criticism of cluster policy.Even if whole sectors rather than individual firms are chosen, there seems littleapparent difference between an approach of ‘pump priming’ or ‘supporting emergingindustries’ to that of ‘picking winners’ (Corry 2001). A policy of caution in clusterpolicy at the national level might be wise.
Another major plank of the Government’s innovation policy has been to try toimprove the links between higher education and business, and this issue is now thesubject of a major review being conducted out of the Treasury by Richard Lambertand expected to report in the Autumn of 2003. It is a subject that has been extensivelyresearched in the past and the conclusions of the Lambert Review will be awaited withinterest.
The major difficulty in enhancing Higher Education and business links is thedifference in culture between the two arenas. It is unrealistic to expect firms to knowin detail how universities work, what expertise exists in local institutions or how thescience base may help them in the future. It is also unrealistic to expect universities tounderstand how the market works, and how much value it would put on theapplication of their research. Knowledge transfer is sometimes called the third stream
Science, innovation and the regions 69

of higher education activity, and it is a poor third behind research and teaching. Thissituation is the natural consequence of differing objectives: industry wants to makeprofits; Universities want to teach or conduct research that will improve the sum ofhuman understanding. This tension may be less pronounced in non-traditionalinstitutions and in institutes of Further Education but it does still exist. Clearlyrelationships need to be built up over time and initiatives such as Regional InnovationStrategies, regional science councils and informal networking opportunities will helpwith this process.
In England, the regional tier is being seen as increasingly important to improvinglinks between universities and businesses (DfES 2003b). Both higher educationinstitutions and business have difficulty in managing relationships with RDAs, but itseems right that RDAs have an important role in this policy area. Furthermore, from2004-05 RDAs will have a larger role in how the Higher Education Innovation Fund(HEIF) is distributed. The HEIF and funds from RDAs have led to the creation of anumber of institutions designed to overcome cultural barriers and try to improveknowledge exploitation within the English regions. These differ from region to region:NorthSTAR in the North East is responsible, via the Science and Industry Council, toOne NorthEast; the 15 Centres of Industrial Collaboration in Yorkshire and theHumber report directly to Yorkshire Forward; and KnowledgeNorthWest is a jointinitiative between the North West Development Agency and the North WestUniversities Association.
Conclusion
It is clear that central government needs to promote higher levels of R&D expenditurein the lagging regions of the UK, and the most straightforward way in which this canbe done is through its own spending on R&D. There are two methods in which stepscan be made in this direction: by relocating institutions to regions such as the NorthEast and Yorkshire and the Humber, where current levels of R&D spending aredisproportionately low; and through explicitly creating a regional science fund,possibly ten per cent of the total funding.
Science policy is not innovation policy, and there is no conclusive evidence thatfirms in the ‘North’ are less innovative than firms in the ‘South’. Nevertheless,innovation is clearly one of the key drivers of prosperity and the Government is rightto identify higher levels of innovation as a policy objective. However, we need a morerobust approach in this area and the Government should be wary of high-profileacademics and consultancies marketing easy answers.
70 A new regional policy for the UK
6. Enterprise policy
Enterprise is clearly one of the drivers of both productivity and employment growth inthe economy. In Productivity 3 the Treasury and the DTI stressed that growth of newfirms is often associated with the introduction of new technologies, innovative ways ofworking and increased competitive pressure on other firms. It is through this ‘churn’effect that new firms and plants entering the market account for such a significant partof total productivity growth (HMT/DTI 2001). This analysis preceded a discussion ofenterprise policy with reference to start-ups only.
Such an analysis restricts debate to entrepreneurs starting new ventures and tosmall businesses. However, individuals within established firms can generate newideas or established firms can enter new markets (a recent example is the move bysupermarkets to offer financial services to their customers). Unfortunately, the onlyDTI PSA target that refers to enterprise policy specifically refers to small firms only:
Help to build an enterprise society in which small firms of all kinds thriveand achieve their potential, with (i) an increase in the number of peopleconsidering going into business, (ii) an improvement in the overallproductivity of small firms, and (iii) more enterprise in disadvantagedcommunities (HMT 2002b).
In truth enterprise policy needs to be as relevant to large businesses as small andmedium sized enterprises (SMEs), and needs to include all measures designed toimprove the capacity of managers and employees to create value out of their availableresources (Brooks and Robinson 2003). The government agency that leads on policyon the promotion of enterprise is the Small Business Service, a focus which hinders thediscussion of enterprise in all UK firms. If the Small Business Service were renamedthe Business Service it could serve firms of all sizes as well as help SMEs to becomelarger firms. Policy debates could therefore be refocused with little institutionalupheaval.
What is urgently needed is a more robust debate on enterprise and small firmspolicy. It is still commonplace to hear that a disproportionate number of new jobs comefrom small firms, or that a big SME sector is a necessity for a successful economy. It istrue that in the 1980s the share of total private sector employment in the SME sectorrose substantially, but this trend did not continue during the 1990s. Total employmentin SMEs changed little between 1994-1996 and 1999-2001, increasing by less than 2per cent (TUC 2003). In contrast, almost all the increase in total private sectoremployment was in large firms, with an increase of 17 per cent. The size of the smallfirm sector means that it necessarily creates many new jobs, but it is also a sector wherelarge-scale job destruction also takes place. As the TUC concluded:
71
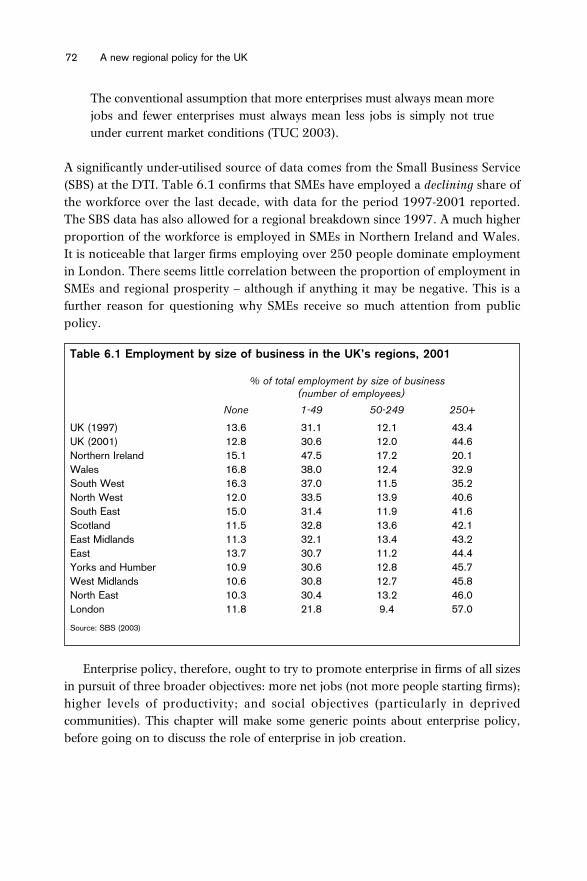
The conventional assumption that more enterprises must always mean morejobs and fewer enterprises must always mean less jobs is simply not trueunder current market conditions (TUC 2003).
A significantly under-utilised source of data comes from the Small Business Service(SBS) at the DTI. Table 6.1 confirms that SMEs have employed a declining share ofthe workforce over the last decade, with data for the period 1997-2001 reported.The SBS data has also allowed for a regional breakdown since 1997. A much higherproportion of the workforce is employed in SMEs in Northern Ireland and Wales.It is noticeable that larger firms employing over 250 people dominate employmentin London. There seems little correlation between the proportion of employment inSMEs and regional prosperity – although if anything it may be negative. This is afurther reason for questioning why SMEs receive so much attention from publicpolicy.
Enterprise policy, therefore, ought to try to promote enterprise in firms of all sizesin pursuit of three broader objectives: more net jobs (not more people starting firms);higher levels of productivity; and social objectives (particularly in deprivedcommunities). This chapter will make some generic points about enterprise policy,before going on to discuss the role of enterprise in job creation.
72 A new regional policy for the UK
Table 6.1 Employment by size of business in the UK’s regions, 2001
% of total employment by size of business(number of employees)
None 1-49 50-249 250+
UK (1997) 13.6 31.1 12.1 43.4 UK (2001) 12.8 30.6 12.0 44.6 Northern Ireland 15.1 47.5 17.2 20.1 Wales 16.8 38.0 12.4 32.9 South West 16.3 37.0 11.5 35.2 North West 12.0 33.5 13.9 40.6 South East 15.0 31.4 11.9 41.6 Scotland 11.5 32.8 13.6 42.1 East Midlands 11.3 32.1 13.4 43.2 East 13.7 30.7 11.2 44.4 Yorks and Humber 10.9 30.6 12.8 45.7 West Midlands 10.6 30.8 12.7 45.8 North East 10.3 30.4 13.2 46.0 London 11.8 21.8 9.4 57.0
Source: SBS (2003)
Enterprise policy
Public sector support for small businesses is surprisingly large in financial terms. TheCross Cutting Review of Government Services for Small Businesses (SBS/HMT 2002)estimated total expenditure by public sector institutions in the UK – at the local,regional and national levels – at around £8 billion in 2001-02 (see Table 6.2). TheDepartment of Environment, Food and Rural Affairs contributed just over £3 billionof this financial support, essentially subsidies for farmers. However, this report willnot specifically address agricultural support issues. A further £2.6 billion was in theform of revenue foregone through various tax measures. This left £2.2 billion for allthe other initiatives. The question arises as to how such diverse schemes, administeredby different organisations, can be co-ordinated to achieve a ‘joined-up’ approach tosupporting small businesses, let alone a broader enterprise policy.
The Government has contributed to the complexity of this situation, bringingforward a number of initiatives additional to those it inherited. It has created theSmall Business Service, Enterprise Areas, the Business Incubation Fund, the PhoenixFund, nine Regional Venture Capital Funds, the Bridges Community DevelopmentVenture Fund, the University for Industry and the Enterprise Management Incentive.It has also reduced Corporation Tax, created the Community Investment Tax Creditand Business Planning Zones. It has also increased the emphasis on enterprise inschools, and it is now policy that every child should have experience of enterprise bythe time they leave school. This is not a definitive list, but it does illustrate thecomplexity of the Government’s enterprise policy.
Improving the standards of external business advice is an important goal ofenterprise policy, with imperfect information regarded as a market failure that posessignificant obstacles to firms. As small firms generally do not have the resources toemploy individual specialists this is one area where a focus on SMEs is justified. Onerecurring criticism has been that the number of bodies operating in this field is toonumerous. Even central government itself now appreciates that the complex situationis a real impediment to getting companies to seek advice.
In 2002 the Better Regulation Task Force examined the delivery of economicdevelopment at the local level (Better Regulation Task Force 2002). Taking evidencefrom a variety of stakeholders the Task Force concluded that a rationalisation of thenumber of bodies operating on the ground was desirable. Its main conclusion was thatRDAs should have responsibility for Business Links Operators (the DTI sponsoreddelivery arm of the Small Business Service). As discussed in Chapter 4, one of theinitiatives contained in the 2002 Spending Review was a pilot initiative to experimentwith RDA-led co-ordination and management of Business Links in four regions: theNorth West, North East, East Midlands and West Midlands. These pilots only becameoperational from April 2003 so it is too early to judge their success. If successful,
Enterprise policy 73

however, the case for Business Links becoming the responsibility of RDAs would bevery strong indeed, though there is a prior question to ask about the effectiveness ofBusiness Links.
A great deal of research has tried to establish the characteristics of the more typicalsuccessful entrepreneur. One conclusion is that age is an important determinant ofentrepreneurship. The Prince’s Trust Business Programme is specifically targeted athelping 18-30 year olds start a business. It is co-funded by the Department of Workand Pensions and focuses on those who are unemployed, under-skilled, within orleaving the criminal justice system or leaving care. An evaluation of the scheme
74 A new regional policy for the UK
Table 6.2 Government services for small businesses, 2001-2002
body programmes estimatedcost
£m
Small Business Service UK online, Business Links, Phoenix Fund, STEP, etc 349.0
DTI Over 100 schemes 160.0
DTI Agencies Office of Science and Technology, Design 115.0Council, Companies House, etc
British Trade Trade Fairs, etc 43.6International
DTLR and Agencies Neighbourhood Renewal, Coalfield 107.1Regeneration, etc
DCMS and Agencies NESTA, Film Council, Arts Council, 332.0Tourist Boards, etc
DfES and Agencies Workforce Development, IiP, Small Firm 138.0Trading Loans, etc
DWP New Deal schemes, Prince’s Trust, etc 71.0
Customs and Excise Business Advice Schemes, etc 31.0
Inland Revenue Business Support Teams, etc 50.0
RDAs Variety of initiatives 274.0
Local Authorities Variety of initiatives 300.0
European Commission ERDF, ESF 227.0
European Investment Global Loans, Venture Capital Funding, etc 19.0Bank
DEFRA and Agencies Over 120 schemes 3,120.0
Tax Measures R&D tax credit, 10p starting rate for corporation tax, 2,590.0 20p Small Companies corporation tax rate, etc
Total 7,932.0
Source: SBS/HMT (2002)
conducted for DWP came to some interesting conclusions (Meager et al 2003). Overa third of clients were educated to degree level or higher, nearly half had a familybackground of self-employment, and the clients were disproportionately drawn fromthe older end of the age range. Furthermore, businesses were more likely to survive ifthe founders were, inter alia, white, older, with a family background of self-employment, educated to degree level and possessing a neutral or adverse attitude torisk-taking (despite the common perception of entrepreneurial behaviour beingassociated with a propensity to take risks).
This research merely confirms what we have known for some time. The easiestway to promote new enterprises is to focus attention on individuals in their 30s or 40swho are well educated and who have many years’ experience of working in aparticular sector. In this context it is worth noting that the average age of the winnersof the New Economics Foundation’s Inner City 100 awards was 45. A focus on‘young people’ is not an effective policy. Meager et al (2003) concluded that:
There is no statistical evidence, however, that participation in Prince’s Trust-supported self-employment has any significant impact on subsequentemployment or earnings chances over time.
In short, it was concluded that the Prince’s Trust Business programme has not madeany difference. The DWP must now reconsider its support for this programme andthis approach ought to be the model for evaluating a great many other enterpriseinitiatives.
Enterprise and job creation
It is important to emphasise that we need to promote a net increase in the totalnumber of jobs in lagging regions. The Enterprise Allowance Scheme of the 1980swas heavily criticised for merely displacing local jobs. Unemployed individuals, withmodest skills, often started businesses in sectors such as vehicle repair, windowcleaning or hairdressing. Due to the subsidy available, these new companies were ableto charge lower prices and successfully displaced existing companies. However, whenthe subsidy ran out, other entrants were eligible for the subsidy, were able to chargelower prices and displaced these companies. The creation of new firms incircumstances such as this did little to promote enterprise nor to create genuinely newjobs.
A second lesson to be learnt from experience of the Enterprise Allowance Schemeis to provide the right mode of funding. Funding provided ‘up-front’ in the form of aloan or a grant is more likely to enable the self-employed to overcome capital barriersto entry, with higher survival prospects. In contrast, funding provided in the form of
Enterprise policy 75

a regular allowance or through allowing the participants to continue to receive benefitare less successful (Meager et al 2003).
In this section of the chapter we shall consider the contribution to employment ofsocial enterprise and Enterprise Areas.
1 Social enterprise
Social enterprise has moved up the political and policy agenda in recent years. WithinWhitehall the DTI have embraced the agenda, publishing Social Enterprise: a strategyfor success (DTI 2002b) and creating the Social Enterprise Unit. The rapid rise of thesocial enterprise agenda has meant that there is still little or no evidence of the impactof government interventions on social enterprises. In fact, we do not even know theextent of the sector in the UK. The lack of available evidence to the contrary hasenabled unsubstantiated claims to be made about the value of promoting socialenterprise, in particular that it is an important tool of job creation.
It is important to remember that there are a variety of social enterprises: the co-operative movement, not-for-profit organisations which deal in ordinary workingmarkets, and ‘bottom-up’ enterprises which foster economic inclusion and are rootedin the social inclusion agenda (Social Enterprise Coalition 2003). This typology isuseful as it distinguishes between the social and the economic.
The social impact of this sector is clear, but the impact upon enterprise is less so.Individuals involved in the schemes do learn new skills, and the employability ofindividuals from excluded groups might be improved. Furthermore, it is easy tounderstand the contribution which social enterprises can make to community capacityand social capital. And while enterprising individuals will create jobs in the sector, itis not at all clear that government initiatives in this field are useful in improvingeconomic activity or employment in deprived communities. This is not to say thatpublic institutions should not support social enterprise, but that it should be regardedas part of community involvement and neighbourhood renewal strategies. Thecontribution to regional economic policy objectives is far from proven.
It is interesting to note that the social enterprise sector has embraced RDAs (SocialEnterprise Coalition 2003). However, each of the five statutory purposes of RDAsrelates to specifically economic objectives (for example raising employment; furtheringeconomic development and regeneration; promoting business efficiency, investmentand competitiveness). It is perfectly understandable for RDAs in regions with fullemployment, and in regions without demand-side employment problems, to promotesocial enterprise. The rationale for RDAs in lagging regions is harder to understand.It is part of an unfortunate tendency of many RDAs to lose focus on their primaryeconomic objectives, in particular that of improving levels of employment.
76 A new regional policy for the UK

2 Enterprise Areas
The creation of Enterprise Areas was announced in the Pre-Budget Report of 2002.Boundaries are identified using the four indices of multiple deprivation in the fournations of the UK, and are drawn at the ward level (postcode level in Scotland).There are 1997 Enterprise Areas in the UK. Levels of business activity are generallylower in more disadvantaged areas, and measures available to firms within theEnterprise Areas include an exemption from stamp duty, a Community InvestmentTax credit, the Bridges Community Development Venture Fund, the Phoenix Fundand support for the Inner City 100 awards. As some of the support available tofirms within these areas consists of fiscal measures, they apply across the UK and areadministered by Whitehall.
The Government hopes that Enterprise Areas will both raise levels of enterpriseand economic activity and meet social objectives: ‘supporting enterprise indisadvantaged areas is a vital part of the Government’s wider neighbourhood renewalobjectives’ (HMT/ODPM 2003: Appendix A). The focus on the ward level has createda patchwork of Enterprise Areas: for example, there are 208 in the North East and 17in Newcastle-upon-Tyne.
A focus on the ward level may be sensible for some neighbourhood renewalobjectives, but it is not apparent how it will achieve economic objectives. Deprivedwards are not likely to have a high proportion of the mature professionals who arelikely to make successful entrepreneurs. A focus on the broader Travel-To-Work Areas(TTWA) would be likely to ensure that Enterprise Areas impact on 30-somethingpotential entrepreneurs. It would also mean that individuals in ‘hard-to-reach’communities would be both in Enterprise Areas, should they decide to start abusiness, but crucially they would also be within travelling distance in caseentrepreneurs elsewhere in the Enterprise Area create job opportunities. Such astrategy would be consistent with the Treasury’s objective of extending travel-to-workdistances. The boundaries of Enterprise Areas and those TTWAs eligible for assistedarea status should be aligned.
Conclusion
Generally speaking, enterprise does not spring from the ashes like a phoenix. Nor isit obvious that public policy should give high priority towards encouraging moreteenagers to set up in business. Rather the typical successful entrepreneur is morelikely to be a mature manager or professional, to be found across all the sectors of theeconomy. The best contribution regional economic policy can make is to ensure abroad sectoral spread of economic activity in each of the regions, from which newenterprises and entrepreneurs may be spun off. Narrowly defined disadvantaged areas
Enterprise policy 77

have concentrations of people with characteristics least likely to make them successfulentrepreneurs and should not be the target for public policy.
The ward is not the best geographical unit at which to target enterprise policy anymore than employment policy. A very long run approach would focus on helpingpeople from disadvantaged areas access jobs over a broad area and develop theexperience and skills which may allow them to develop a business idea later in theircareers. This is more likely to prove a fruitful approach than trying to growentrepreneurs from scratch.
78 A new regional policy for the UK

7. Public spending and investment
Investment in physical capital ought to contribute towards improving regionalproductivity and help create and protect jobs. At the national level much of the UK’sproductivity gap with France and Germany is due to differences in physical capital(plants and machinery) (O’Mahony and de Boer 2002). However, as Productivity 4acknowledged ‘Data at a regional level show that there is not a strong correlationbetween the best performing regions and those where capital expenditure is thehighest’ (HMT/ODPM 2003). It seems, therefore, that levels of private sectorinvestment in physical capital do not easily explain the regional economic disparitiesthat exist within the UK. Levels of public sector investment may be more important inexplaining regional disparities and certainly will have a role to play in reducingregional economic disparities. This requires us to look at the way that public spendingis distributed across the UK.
Fair funding in public expenditure
All advanced industrial economies consciously redistribute resources across regionsand localities to achieve more equitable outcomes in terms of public spending. Insome countries with federal constitutions the processes that achieve this are veryformalised. As befits a country without a codified constitution, the UK’s system offiscal equalisation has evolved over time in response to particular political pressuresand requirements. This does not, however, necessarily mean that it is any the lesseffective at achieving a desirable distribution of resources when compared with othercountries.
The UK can be thought of as having a public expenditure system characterised bya division between two types of expenditure (Heald and McLeod 2002). First,expenditure on ‘national’ programmes, such as defence, or on ‘uniform’ programmes,such as social security. Expenditure of this type may have differential regional impacts,but these are effectively unintended consequences of UK-wide decisions. The secondtype of expenditure is undertaken on a country basis, with well-defined and separatesystems for Scotland, Wales and Northern Ireland. Changes in this type ofexpenditure are allocated via the much-misunderstood Barnett system, and there aresecondary mechanisms that distribute expenditure territorially within each of the fournations of the UK.
Joel Barnett was Chief Secretary to the Treasury in the 1970s when the currentmechanisms were developed during the attempts of the then Labour Government tolegislate on devolution. On the original formula, changes in public spending inEngland on services that were devolved to Scottish and Welsh administrations, wereto result in changes to the grant for Scotland and Wales in the ratio 85:10:5 (England:
79

Scotland: Wales). It, therefore, did not aim to control public spending per se, butrather changes in public spending. The system was designed to be a temporary systemthat would be replaced by a ‘needs-based mechanism’ in time. A flawed andunsubstantial needs-based assessment was conducted, but the in-coming ConservativeGovernment did not act upon it and the Barnett system survives to this day.
The latest figures detailing the national and regional breakdown of public spendingare contained in Table 7.1, which details reserved as well as devolved expenditure.Figures for the English regions have only been produced on a basis comparable withthe UK’s nations since 1998-99. There are quite clearly substantial variations acrossthe nations and regions of the UK: Northern Ireland has the highest levels of publicexpenditure and the South East the lowest. Clearly the current mechanisms areproducing some forms of redistribution, as the lagging regions generally receive higherlevels of funding then the richer regions. However, if we assume that there should bean inverse relationship between GVA/GDP per head and identifiable expenditure perhead then there are three regions that do not match the general trend. Scotland,London and Northern Ireland each seems to receive higher levels of publicexpenditure than their relative prosperity would indicate (McLean and Macmillan2003).
Table 7.1 will be familiar to many journalists who write for Scottish, Welsh andEnglish regional newspapers. When the Treasury publishes the figures in April eachyear, they are invariably the subject of much comment. It is in the North East ofEngland that these figures receive the highest profile, and The Journal newspaper hasrun a campaign against the Barnett formula and headlines such as ‘On wrong side of£1 billion border’ are commonplace (The Journal 2002). However, this is not the
80 A new regional policy for the UK
Table 7.1 Trends in total identifiable public expenditure in the UK’s nations andregions, 1998-1999 to 2001-2002 (UK=100)
1998-1999 1999-2000 2000-2001 2001-2002
Northern Ireland 134 134 131 127 Scotland 118 119 120 120 Wales 116 114 113 113 London 114 114 110 113 North East 107 110 110 111 North West 103 104 104 104 Yorks and Humber 96 95 100 99 West Midlands 94 94 94 95 South West 89 90 90 89 East Midlands 89 90 90 90 East 86 87 87 85 South East 86 84 84 85
Source: HMT (2003b)

opinion on the other side of the border. As Jack McConnell concluded before hebecame First Minister:
The Barnett Formula cannot answer all the questions asked of it but itsgeneral acceptance historically has led to stable public spending settlementsover twenty years. There is still to be a better alternative system put forward(McConnell 2000).
David Heald and Alasdair McLeod (2002) also concluded ‘Much of the politicalattention currently paid to the Barnett formula hinges on the contradictory assertionsthat it is extravagantly generous to the Devolved Administrations, or that it isimposing destructive financial pressures upon them’.
Table 7.1 also demonstrates that the differences in spending between the differentnations and regions of the UK has changed little over the period since devolution tookplace. In theory, the Barnett formula ought to produce a convergence in per capitaspending: the so-called ‘Barnett squeeze’. As the Barnett mechanisms distribute equalper capita increments to each country, smaller percentage spending increases areautomatically delivered to those territories with the highest spending levels. Thefigures in Table 7.1 would indicate as far as Scotland is concerned, the ‘Barnettsqueeze’ is not yet in operation and concerns on this score would seem to beunfounded as yet. Levels of spending in Northern Ireland, however, may beconverging towards the UK average. This could be partly explained by lower securitycosts due to the peace process, expenditure on which falls to the Northern IrelandOffice. It may also be partly explained by the ‘Barnett squeeze’, which applies toexpenditure by the Northern Ireland Government Departments. It is believed that theDepartment of Finance and Personnel has conducted its own analysis of NorthernIreland’s ‘needs’ which estimated that levels of spending at 125 per cent of spendingin England would be ‘fair’. Relative levels of public spending seem to be fastapproaching this level.
Public expenditure is the one issue that could possibly ignite divisive territorialrivalries in the UK (Morgan 2002). The Barnett formula has been subject to muchcriticism since its inception, and almost every part of the United Kingdom hasindividuals and organisations arguing that it should be abolished (Ken Livingstone inLondon, the SNP in Scotland, Plaid Cymru in Wales (for different reasons than theSNP) and the Campaign for the English Regions in the north of England). However,despite this coalition of criticism it is hard to see how reform of the Barnett formulacan be achieved in the near future, given the reluctance of the UK Government toopen up the debate. Treasury Ministers will understandably be loath to open up apolitically divisive issue when the achievable public expenditure savings are likely tolimited (Midwinter 1997). In particular, as a Scottish MP the Chancellor of the
Public spending and investment 81

Exchequer will be understandably concerned that levels of spending in Scotland arenot disadvantaged. The result has been that, even in those nations and regions thatwould like to see reform, there is a general consensus that the Barnett system will notbe reformed for some time. Unfortunately, recent academic literature in this area – onfiscal federalism, on Grants Commissions, et al – are unlikely to be called upon bypolicy makers for some time yet.
However, debates over the Barnett system are not going to disappear and there arestill many public expenditure issues outside Barnett which are relevant to currentpolicy debates. It would be therefore fruitful to consider the principles by which weshould judge the fairness of any system of fiscal redistribution across the regions andlocalities of a country like the UK.
Principles of fair funding
The first basic principle is in essence straightforward: any particular area should beable to offer its residents broadly the same level of public services as another area,regardless of the level of economic prosperity and therefore the tax base in that area.So a less prosperous area in the ‘North’ with a poor tax base should be able to offerbroadly similar services to any area in the ‘South’ where taxes are more buoyant. Infact it is the only bit of ‘quasi-Marxism’ that seems to survive in public policy, in thatin essence it means for each region ‘from each according to their means (tax base); toeach according to their “needs”’.
It is this last word that complicates matters: how do we identify needs? Thecomplex funding formulae that are used, for example, to distribute resources to thehealth service or to fund schools across England, have to try and measure the healthor schooling ‘needs’ of many different areas in a way that is both fair and seen to befair. Needless to say this is more easily said than done. Any formulae may also try totake into account the different ‘costs’ that localities face in delivering particularservices.
What factors need to be taken into account in constructing a ‘fair’ formula?
1 The overall population base is the obvious starting point and most fundingformulae start with a per capita allocation.
2 There are some ‘needs’ over which in principle there is broad agreement: thoserelating to differences in levels of poverty or ill-health, for example. As a resultan area such as the North East with very high levels of poverty and ill-healthshould do well out of any ‘fair’ formula and London’s high rate of childpoverty should also be reflected in its allocation of spending.
3 There are some forms of ‘need’, however, that spending formulae find itdifficult to encompass. The problems posed, particularly for London’s public
82 A new regional policy for the UK

services, by high levels of mobility and transience in schools are one example,as the Cabinet Office (2003a) has noted. Another example might be the higherpolicing costs in the capital as a result of the location of so many important‘targets’.
4 In relation to ‘costs’, the higher costs of delivering services in rural areas isusually recognised as something that the central Exchequer should compensatefor. This could be one reason why, other things equal, Scotland might receivemore resources than the average reflecting the need to provide public servicessuch as schools across the Highlands and Islands. Such rural areas tend not tobe particularly affluent so that this type of compensation for higher costs isunlikely to conflict with any assessment based on ‘needs’. Any formulae thatreflects various forms of social need and higher costs in rural areas is likely toredistribute resources to less affluent areas in a way that would act to reduceregional disparities.
5 London and the Greater South East face higher costs in delivering publicservices because of the need to pay enough to recruit and retain employees inthe context of a relatively high demand for certain types of labour in anexpensive part of the country. The problem, of course, with such an ‘area costadjustment’ is that if a region becomes more economically successful and as aresult prices and wages are bid up, more resources will flow into that region toreflect the higher costs of recruiting and retaining staff. In turn those extraresources could further bid up wages and prices. In this case any formulaecould act to increase regional disparities.
6 Finally some elements of higher spending in an area will reflect consciouspolicy choices. If Scotland chooses to extend free personal care to all elderlypeople, in contrast to England where the provision of such care is means-tested, this is precisely the kind of policy choice that devolution should makepossible. However, it is also equally clear that the costs of such choices shouldbe borne regionally or locally and not by the central Exchequer. Similarly, ifNorthern Ireland chooses to have denominational schools, the higher costs ofthis should be borne by taxpayers in the province.
In reality of course, the ability of the devolved administrations or of local authoritiesin England to exercise significant policy choices is constrained by the very lowproportion of revenue raised locally in the UK’s highly centralised tax system. Ananalysis of spending formulae such as the one used to distribute funding for schoolsin England, where about 70-75 per cent of funding is on a per capita basis and thebalance adjusts for various needs and costs (Johnson 2003), would suggest that thisbalance between local (70-75 per cent) and central (25-30 per cent) funding would
Public spending and investment 83

still allow for an adequate amount of fiscal redistribution. In practice of course theratios of centrally and locally raised revenue in English local government are preciselythe other way round.
Some ways forward
Needless to say, reforms to national and local taxation that would significantly reversethe proportions of revenue raised would amount to a bit of a revolution in the UK’sfiscal constitution. A proposal to end the ‘area cost adjustments’ that help compensatethe Greater South East for the higher labour costs of providing public services wouldprobably lead to real civil disturbance. And yet public policy is already nudging in thedirection that would be suggested by an analysis of the principles of fair fundingdiscussed here. The Treasury is enthused by the idea of a ‘new localism’ (Balls 2003)which includes at least the beginnings of some thinking about how new revenuestreams could be made available to local political institutions.
One of the first examples of this particular type of ‘new localism’ will be theintroduction of a ‘prudential’ system for capital spending in Northern Ireland. Thiswill allow the Northern Ireland Executive to undertake borrowing to help remedy itswidely acknowledged deficiencies in infrastructure investment. Any debt incurred hasto be serviced from its revenue base (Brown 2002). This means that Northern IrelandGovernment Departments are effectively left with little choice but to correct theinfrastructure backlog though increased local charging, notably by introducing watercharges and by substantial increases in local property rates. (It should be rememberedthat Northern Ireland has a very different system of local government to the rest of theUK.)
As one of the poorest parts of the United Kingdom, Northern Ireland would notseem to be the obvious starting point for increased regional revenue raising. However,the ‘new economic settlement’ described above was a response to historically lowlevels of rates and charges. This does indicate, however, that sometimes there is apolitical will to introduce greater regional and local flexibility into the UK’s centralisedtax and public expenditure system. In the rest of this chapter we shall examine howsuccessful regions ought to be asked to make a larger contribution towards meetingthe increased costs of success. Many of the policies mentioned here will not betargeted specifically at successful regions, but spatially blind policies will often have adifferentiated regional impact.
Transport spending represents an interesting starting point. One myth that needsto be dispelled is the irrevocable link between the growth in road traffic and theeconomy (Grayling forthcoming). As the Government’s trunk roads advisorycommittee concluded, there is no simple link between transport provision andeconomic development. The relationship between the two is not always intuitively
84 A new regional policy for the UK
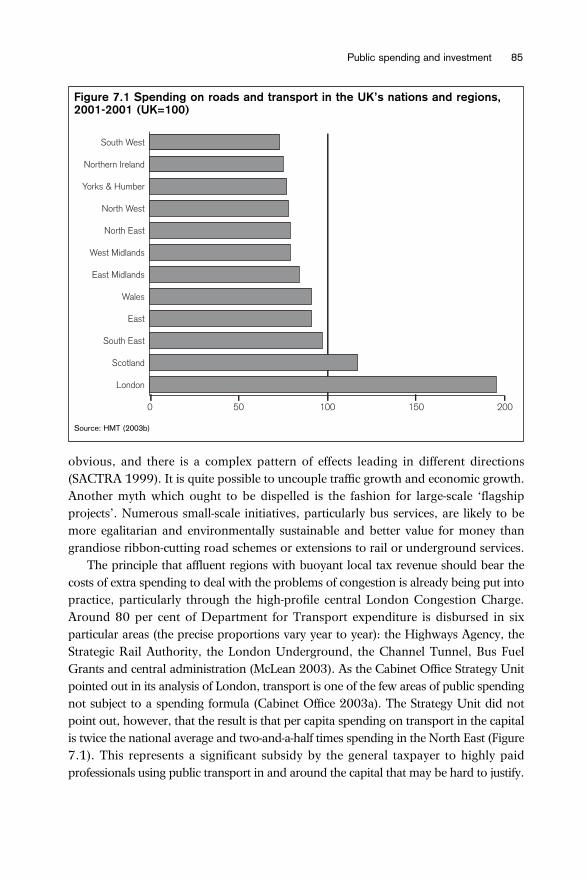
obvious, and there is a complex pattern of effects leading in different directions(SACTRA 1999). It is quite possible to uncouple traffic growth and economic growth.Another myth which ought to be dispelled is the fashion for large-scale ‘flagshipprojects’. Numerous small-scale initiatives, particularly bus services, are likely to bemore egalitarian and environmentally sustainable and better value for money thangrandiose ribbon-cutting road schemes or extensions to rail or underground services.
The principle that affluent regions with buoyant local tax revenue should bear thecosts of extra spending to deal with the problems of congestion is already being put intopractice, particularly through the high-profile central London Congestion Charge.Around 80 per cent of Department for Transport expenditure is disbursed in sixparticular areas (the precise proportions vary year to year): the Highways Agency, theStrategic Rail Authority, the London Underground, the Channel Tunnel, Bus FuelGrants and central administration (McLean 2003). As the Cabinet Office Strategy Unitpointed out in its analysis of London, transport is one of the few areas of public spendingnot subject to a spending formula (Cabinet Office 2003a). The Strategy Unit did notpoint out, however, that the result is that per capita spending on transport in the capitalis twice the national average and two-and-a-half times spending in the North East (Figure7.1). This represents a significant subsidy by the general taxpayer to highly paidprofessionals using public transport in and around the capital that may be hard to justify.
Public spending and investment 85
Figure 7.1 Spending on roads and transport in the UK’s nations and regions,2001-2001 (UK=100)
Source: HMT (2003b)

Similar considerations apply to housing. At first glance, the regional distribution ofpublic expenditure on housing is even more uneven than expenditure on transport, asFigure 7.2 shows. Scotland is the UK region with the highest levels of publicexpenditure in this policy area, but levels of expenditure on housing within Scotlandare determined by the devolved administration under their Assigned Budget.Furthermore, Scottish housing law is very different to that in England and Wales.
London is second to Scotland in terms of expenditure on housing, but theneighbouring East of England region has the lowest levels of public expenditure.Spending per head in London is £197 while in the East of England it is £3. In theSouth East it is £28 per head.
Approximately 95 per cent of expenditure on housing in England is made throughthe Housing Corporation and the Housing Revenue Account Subsidy (McLean 2003).The Housing Corporation registers, funds and supervises registered social landlords inEngland, and the majority of their expenditure is on capital projects. Over the last fewyears, there has been a general decline in expenditure in all regions, with the exceptionof London and the North West. The Housing Revenue Account Subsidy is an ODPMgrant scheme which subsidises expenditure by local housing authorities to manageand maintain council property and to encourage authorities to keep rent increases
86 A new regional policy for the UK
Figure 7.2 Spending on housing in the UK’s nations and regions per head,2001-2002 (UK=100)
Source: HMT (2003b)

within guideline levels. Expenditure is concentrated in a few regions: North East,North West, London and Yorkshire and the Humber (McLean 2003).
The key issue for policy-makers in housing policy is to manage the very differentproblems of failing housing markets in the ‘North’ and shortages of homes in the‘South’. The Government’s approach is outlined in Sustainable Communities (ODPM2003a), and deals with these two different problems in different ways. The housingstock in the ‘North’ is to be modernised and nine housing market renewal pathfinderprojects are to be created in the most severely affected areas. In the ‘South’ there is tobe a ‘step-change in housing supply’ and four growth areas are to be created inLondon, the South East and the South Midlands (ODPM 2003a). Improving housingsupply will be substantially more costly than modernising the housing stock, althoughthe costs of housing market modernisation should not be underestimated. TheGovernment has, therefore, allocated substantially greater sums to the Greater SouthEast than to the ‘North’. Table 7.2 is taken from Sustainable Communities and showsthe higher levels of funding available to the Greater South East, particularly as theGreater South East has only approximately two-fifths of the population of England.Furthermore, the wider infrastructure costs associated with growth are usuallysubstantial: roads will have to be built to new houses, schools and hospitals will haveto built for new communities.
Some of the above expenditure on housing in the Greater South East is clearlyjustified. In particular thousands of families with children in London live in Bed &Breakfast accommodation and other unsuitable temporary accommodation, aphenomenon that does not exist to the same degree anywhere else in the UK. This isclearly a need that requires ‘fair funding’. However, much of the investment in theGreater South East is not of this type, but is rather the consequence of success. Withregard to this latter type of expenditure, the key question again is who should pay?
Section 106 of the Town and Country Planning Act 1990 can be used to enablelocal authorities to secure the provision of, or improvement to, infrastructure necessaryto meet the needs of the occupiers of new development. However, Section 106 powershave not been enthusiastically used by local authorities and the ODPM have indicatedthat they would like to see a greater share of the land value increase to be captured for
Public spending and investment 87
Table 7.2 Estimates of resources for the Communities Plan
02/03 03/04 04/05 05/06 Total 2003/04to 2005/06
Housing – London, East 995 1,573 1,558 1,605 4,736and South East
Housing – other regions 719 852 892 914 2,658
Source: ODPM 2003a

local infrastructure. The Government is consulting on Local Authority BusinessGrowth Incentives to allow local authorities to retain a share of the increased businessrate revenue associated with growing the business rate tax base locally (HMT/ODPM2003).
There seems little appetite within Whitehall to develop a replacement for the‘Betterment Levy’, the post-war development tax of the Attlee Government. However,there does seem to be the beginning of a more robust approach to trying to capturedevelopment contributions and a proportion of the increases in land value arisingfrom growth. Clearly, it is those areas that are growing that will be in a position toraise this revenue: these will be disproportionately but not exclusively located in the‘South’. However, the UK has one of the most centralised tax systems in thedeveloped world and recent moves to create a ‘new localism’ would seem to implymoves towards greater fiscal flexibility within the UK.
Furthermore, it is the role of central government to balance the territorialdimension of economic and social justice (Adams and Robinson 2002). This taskwill actually be more straightforward if more of the costs of congestion anddevelopment pressures are met locally and/or regionally. Therefore, recent movestowards charging for the costs of congestion and for capturing the value of growth bycentral government are welcome and should be further developed.
One of the most controversial ways of doing this was unconsciously hinted at inthe Cabinet Office Strategy Unit’s Analytical Report on London (Cabinet Office2003a). It pointed out that Londoners have higher incomes and pay more income tax,but the average council tax bill was very similar to the rest of the country. Londoncontributes less in local taxes than it would if the system were more progressive. Theinference seems clear: Northern Ireland is not the only part of the UK where localtaxes should be increased to fund necessary investment in the public infrastructure orto pay for better public services.
Direct public sector employment
In the 2003 Budget the Chancellor asked Sir Michael Lyons to conduct a review intothe scope for relocating public sector activities from London and the South East toother regions of the United Kingdom (HMT 2003a). The Chancellor claimed thatsuccessful relocation out of London by private sector companies suggested that thenumber of jobs relocated could exceed 20,000. The objectives of the review, as statedin the terms of reference, were to explore how relocation might improve both ‘thedelivery and efficiency of public services; and the regional balance of economicactivity.’
Over the years, many jobs and offices have been relocated from London and theSouth East. For example, the Drivers and Vehicle Licensing Agency (DVLA) was
88 A new regional policy for the UK

relocated to Swansea in the 1960s and the Patent Office was relocated to Newportin the late 1980s. While the Wilson Government clearly regarded relocation aspart of its regional economic policy, it is equally clear that the motivation of theThatcher Government was to cut costs and save taxpayers’ money. The currentGovernment seems equally motivated by the twin aims of cutting costs andbenefiting the economies of lagging regions, but also seems to hope that relocationwill help improve public services as part of a wider move to modernise the civilservice.
Interestingly, the London Development Agency (LDA) has been very supportive ofmoves to relocate government offices out of London. The nine English RDAs jointlysubmitted evidence to an inquiry by the ODPM Select Committee (ODPM SelectCommittee 2003a) into reducing regional economic disparities. This submissionstated that:
In terms of the specific question about whether Government departments,agencies and non-departmental public bodies should be moved to lessprosperous regions, we would be in favour of investigating such anapproach... It would also help the economy of London and the South Eastby removing some pressures on housing land as the ability of civil servantsto buy houses could increase if departments were located elsewhere (NineEnglish Regional Development Agencies 2003).
It remains to be seen whether the LDA would support the relocation of senior leveljobs, and not just back-office functions. In the late 1980s the then ConservativeGovernment relocated some functions of what is now the Department forInternational Development to East Kilbride. However, only a minority of Departmentstaff were relocated and the senior management positions remained in London. Incontrast to the DVLA and the Patent Office, only secondary functions were relocatedfrom London. As we discussed in Chapter 3, lagging regions generally have a shortageof high-quality graduate jobs though a disproportionate share of graduate jobs inlagging regions are already in the public sector. If one of the objectives of relocationis to help improve the regional economic performance of lagging regions, it wouldseem imperative to ensure that both senior management and back-office functions arerelocated. The relocation of entire Departments and Agencies would appear to be aneffective way to achieve this.
The question then arises as to which Departments or Agencies should be relocatedout of the Greater South East. If the impact of public sector relocation is to bemaximised, the organisations must be chosen with care. The Lyons Review has rightlytaken a bold stance in principle and in its guidance to Departments stated that:
Public spending and investment 89

The question at the heart of departmental proposals should be: ‘why is thisfunction in London/South East?’ It might be helpful analytically to startwith the presumption that work should not be located in the South, giventhe enormous extra costs and other disbenefits, with the onus ondepartments to demonstrate otherwise (Lyons 2003).
We hope that Whitehall will adopt this radical approach and the conclusions of theLyons Review will be eagerly awaited. In this report we shall not try to match thebreadth of the Lyons review, but we will make a few suggestions which might helpidentify the Departments and Agencies which should be relocated. ODPM has beensometimes styled as the Department for England, as its geographical remit is confinedto England and it is responsible for regional and local government policy.Approximately 40 per cent of ODPM staff work already work in the English regions,which means that up 3,500 staff could be relocated (ODPM Spokesperson quoted inThe Journal 2003).
While the ODPM is the most suitable Department to consider for relocation, twoother Whitehall Departments are also effectively England-only Departments (seeFigure 7.3) and should be considered for relocation. On 1 April 2002 the Departmentfor Education and Skills employed 2,260 civil servants in London and the South East,while the Department of Health employed 2,830 civil servants (Cabinet Office2003b). It is worth noting that the two largest employers of civil servants in London
90 A new regional policy for the UK
Figure 7.3 Classification of Whitehall departments
‘Mostly English’ ‘Hybrid’ ‘Mostly UK’ InternationalDepartments
Health Home Office HM Treasury Defence
Education Legal Departments Work and Pensions Foreign Office and Skills
Environment, Food Cabinet Office International Office of the Deputy and Rural Affairs DevelopmentPrime Minister Trade and Industry
Culture, Mediaand Sport
Transport
Notes:
A ‘mostly English’ department has only very modest reserved powers.
A ‘hybrid’ department exercises functions on behalf of England (or England and Wales) that are carried out on a devolved basis in
the territories, with Departments explicitly covering these functions in Cardiff, Edinburgh and Belfast but they also exercise signifi-
cant reserved powers.
A ‘mostly UK’ department carries out mostly reserved functions but with some English functions too.

and the South East are the Ministry of Defence (25,600 on 1 April 2002) and theDepartment for Work and Pensions (23,050 on 1 April 2002). The response of theDWP to the Lyons Review will be particularly important, in light of the importance ofthat Department to the regional economic agenda.
In Chapter 5 we argued that the geographical distribution of institutions ofscientific research was biased towards the Greater South East, so it would fit with theneeds of the English Regions, Wales and Northern Ireland to consider relocatingsome of the institutions which deal with science policy. The two bodies through whichthe majority of government support for science spending is channelled are the sevenResearch Councils and the four Higher Education Funding Councils (one for each ofthe four nations of the UK). Furthermore, the Office of Science and Technology isbased within the London headquarters of the DTI and employs 150 staff (OSTSpokesperson 2003). Relocating these bodies would not only be an importantemployment generating measure, it might over time help to change the culturalattitudes which distribute such a disproportionately large degree of funding to theGreater South East.
The terms of reference of the Lyons Review is to consider relocation from Londonand the South East, but as Table 7.3 demonstrates a number of these scientific bodiesare sited in the M4 corridor in South West England. Places like Bristol and Swindonare areas of full employment with many of the same pressures on development as
Public spending and investment 91
Table 7.3 Relocation of Departments and Agencies
Location Employment Staff rate (TTWA) % employed
Medical Research Council London 71.4 3,945 Biotechnology & Biological Sciences Swindon 82.5 3,219Research Council Natural Environment Research Council Swindon 82.5 2,590 Council for Central Laboratory of Didcot, Oxford 82.9 1,800Research Councils Engineering & Physical Sciences Swindon 82.5 317Research Council Particle Physics and Astronomy Swindon 82.5 302Research Council Higher Education Funding Council Bristol 80.9 223for England Office of Science and Technology (DTI) London 71.4 150 Economic and Social Research Council Swindon 82.5 111 Design Council London 71.4 50
Total 12,707
Source: Cabinet Office (2003c), OST spokesperson (2003)

London. There is no reason why they should not be considered for relocation underthe Lyons Review. As Table 7.3 details, nearly 13,000 staff are employed by thesebodies (the three higher education funding bodies outside England are not covered forobvious reasons). It is suggested that these nine bodies are relocated to areas with reallabour market weaknesses.
Table 7.3 is meant to serve as an indication of the types of agencies that could berelocated given the discussion on science and innovation in Chapter 5. It is in no waysupposed to be an exhaustive list. The outcomes from the Lyons Review are still to beawaited, but the approach adopted – that Whitehall departments must justify whythey should stay in the Greater South East – is the correct one.
The issue of where these jobs are relocated to is as important as where they arerelocated from. They should not go to relatively prosperous cities such as Leeds, butto cities and towns with low employment rates and a lack of jobs in the higher leveloccupations. Public sector relocation is one important instrument for helping suchplaces retain graduates.
Conclusion
There is unfortunately little likelihood in the near future of a wholesale revision of thesystem by which public spending is distributed across the nations, regions andlocalities of the UK. However, the pattern of public spending is an obvious policyinstrument that government can wield to address regional economic disparities. Theneeds of prosperous regions as well as lagging regions need to be addressed, but in thecontext of allowing successful regions and localities to raise more revenue to addresstheir needs.
Some Whitehall departments, especially those with an England-only remit, shouldbe relocated to towns and cities with low employment rates, along with key educationand science funding bodies. Greater fiscal devolution will at some point need toaccompany political devolution, but the starting point for this debate needs to besome agreement on the principles that should underlie a fair funding regime.
92 A new regional policy for the UK
8. Governance issues
Increased capacity at the regional level is one of the key principles upon whichLabour’s new regional policy has been built. Building regional institutions andenhancing the autonomy of those regional institutions is, it is claimed, whatdistinguishes current regional policies from their predecessors:
Our new regional policy is based on two principles – it aims to strengthenthe essential building blocks of growth – innovation, skills, the developmentof enterprise – by exploiting the indigenous strengths in each region andcity. And it is bottom-up not top-down, with national government enablingpowerful regional and local initiatives to work by providing the necessaryflexibility and resources (Balls 2000).
This commitment to bottom-up policies is informed by a fairly widespread academicconsensus that regional institutional capacity matters to economic performance(Harding et al 1996, Russell Barter 2000). The creation of the RDAs and RegionalChambers in Labour’s first term were decentralising reforms, which will bewelcomed by those who feel that governance in the UK is still too focused onWhitehall. RDAs have clearly become influential players in regional debates, andhave worked to improve regional capacity in a variety of ways, particularly throughthe Regional Economic Strategies, which try to bring together all the relevantstakeholders in the region. The first editions of these strategies have been criticisedfor being ‘wish-lists’ and the revised strategies will need to forge a clearer sense ofpriorities.
However, the role of elected regional governments in achieving economic growthis more contested. One stream of academic opinion is that the link between electedregional government and improved economic performance ‘remains unproven andunderexplored’ (Harding et al 1996) and that while democracy may be an intrinsicallygood thing ‘its implications for economic development are more ambiguous than wemay care to admit’ (Morgan and Rees 2001).
Other academics stress the importance of elected assemblies in delivering policiesmatched to the diversity of regional conditions, and their role in providing strongpolitical leadership and regional consensus building (Tomaney et al 2003). It isargued that if the assemblies help to galvanise their regional economies, mobilisingresources which were hitherto untapped and ill-organised for example, then theywould have a positive role to play in regional economic renewal. This approach hasresonance with the Government and others supportive of regional devolution, forexample Peter Mandelson MP:
93

we cannot achieve economic revitalisation in the North East withoutmodernising the means of delivering our economic policies, and this meansrenewing the region’s political institutions (Mandelson 2001).
So what can we conclude from this discussion? First, it is important to emphasise thatstrong regional institutions are important for regional economic growth: theGovernment is right to recognise that regional policy cannot be run from the centre.Second, that regional devolution may be a necessary but not a sufficient preconditionfor any reduction in regional economic disparities. The case for regional devolutionmay be stronger on democratic and public service delivery grounds. Third, that theimpetus for regional devolution is likely to have come from dissatisfaction with theway that recent UK governments have treated the lagging regions, politically as wellas economically. While the impact of devolution and regional assemblies uponeconomic performance will not be capable of independent assessment for some years,it is quite clear that the record of Whitehall in reducing regional economic disparitiesis far from distinguished.
The bottom-up emphasis of Labour’s new regional policy poses another question:what is the role of Whitehall in this regionalised regional policy? Until recently theGovernment could be criticised for merely ‘passing the buck’ to devolvedadministrations and regional institutions, expecting the simple fact of their creation tostart addressing regional economic disparities and refusing to articulate the role of theUK government. However, there is some cause for optimism in this regard.
In the post-devolution world the role of Whitehall in economic governance mattersis a complicated one. There is a mix of reserved, devolved and concurrent powers thatvary between Scotland, Wales, Northern Ireland and London. There will even besignificant variations in policy between the eight RDAs accountable to Whitehall.However, a nation state with devolved and regional polities is still a nation state, andWhitehall and Westminster retain a responsibility for all parts of the UK. Suchresponsibilities must be exercised in a way that is compatible with the variousdevolution settlements and must seek to achieve social and economic justice betweenthe various nations and regions of the UK (Adams and Robinson 2002).
As there is no strict and watertight division of competences between reserved anddevolved matters, Whitehall and the devolved administrations need to workparticularly closely together. The main instrument for inter-governmental relationswithin the UK are the Joint Ministerial Committees (JMCs), regular summit meetingsbetween Ministers and officials from Whitehall and devolved administrations. Inter-governmental relations within the UK have been surprisingly smooth, but theinstitutions have not met often. The decision to hold a JMC on the economy towardsthe end of 2003 is to be welcomed. The Chancellor of the Exchequer will chair theevent and it will discuss ‘how reserved and devolved policies can best work together
94 A new regional policy for the UK

to improve economic performance and productivity across the UK’ (Scotland Office2003). This is a welcome recognition that Whitehall has some responsibility for theeconomies of devolved territories and that the devolved administrations cannot solveregional economic disparities on their own. As we suggested in Chapter 1 it could bethe appropriate forum to discuss a new target for narrowing absolute disparities ineconomic prosperity in the UK as part of the Spending Review 2004 process.
Clearly the concept of territorial justice needs to be fleshed out in the years ahead.Building on the work of ippr’s Social Justice Commission (1994), we would submitthat a hierarchy of four principles underpin territorial justice. First, that each regionand locality should be treated fairly and equitably by the centre. Second, that eachregion and locality is entitled to be able to meet their needs, whether through raisingtheir own revenue or through transfers from the centre. Third, that territorial justicerequires more than just meeting basic needs, and that we need to be concerned withthe distribution of opportunity. Finally, that while not all inequalities are unjust;unjust inequalities should be reduced and where possible eliminated. We would alsoargue that territorial justice should not be defined as a subtractive and inhibiting force,which merely takes things away from successful regions and localities and gives themto the unsuccessful. It has to attend to need, but in doing so it ought to also be anenabling force for all areas and encourage aspirations to improve their economy andthe quality of life for inhabitants.
If the UK government is to uphold the principle of territorial justice and makeinroads into regional economic disparities, it will need to fundamentally re-address itsrole in many of the areas highlighted in this report. Examples include employmentpolicy (Chapter 3), science and innovation policy (Chapter 5) and public expenditureand taxation (Chapter 7). Hard decisions will have to be made in the Spending Review2004 process and while it is encouraging that the Government is asking the rightquestions, it is not yet clear that it will be bold enough to pursue the right answers.
One of the traditional concerns which academics had with the devolution processwas that ‘devolution inevitably involves a promotion of bottom-up forms of territorialcompetition’ (Gordon 2002). These concerns do not yet appear to be borne out.Despite the breadth of regional policy instruments, fears over territorial competitionmostly focused on two policy areas: inward investment and public expenditure. In thecurrent climate the former may be becoming less important as a tool of economicdevelopment, and while there seems no appetite within the Treasury to re-opendebates over the fiscal constitution and the Barnett formula (Chapter 7) this debate islikely to gather pace over time. There have been real disagreements between differentparts of the UK, for example over the decision by the DTI to move science facilitiesfrom Daresbury in the North West to Oxford in the South East. However, this doesnot amount to a new era of territorial competition and fears on this score do not yetseem justified.
Governance issues 95
It is worth noting the remarkable levels of access that the RDAs have withincentral government. Regular meetings are held with the Chancellor of the Exchequer,the Deputy Prime Minister and the Secretary of State for Trade and Industry.Whitehall regularly increases the powers available to the RDAs: more flexibility andthe single-pot, powers over tourism and, should the pilots be successful, the possibilityof becoming responsible for the Business Links Network. Collectively the RDAs havedeveloped a strategy to influence all Government Departments in Whitehall, and eachRDA is allocated specific policy areas to lead upon and specific Whitehall departmentsto lobby. For example Advantage West Midlands leads on transport issues andrelations with the Department for Transport and the South West RDA leads ontourism and culture policy and on relations with the Department for Culture, Mediaand Sport.
While the RDAs are generally regarded as being successful ‘voices for their region’,their research capacity has been criticised. The poor quality of available regional datahas clearly been a hurdle to the work of the RDAs in trying to analyse regionaleconomies, and unfortunately many have had to commission consultants to producefurther evidence of variable and sometimes dubious quality. As a group, the RDAsshould collectively fund an England-wide research unit, which could be located in anyof the nine regions but which preferably should be located in one of the laggingregions. Others with an interest in this subject might also be involved. The Core CitiesGroup is a mechanism by which the local authorities of the eight large cities inEngland come together for common purpose: Newcastle, Leeds, Sheffield, Liverpool,Manchester, Birmingham, Nottingham and Bristol. This group should be interested inimproving their empirical research in this field (ODPM et al 2003). An England-widefocus on evidence-based policy, the empirical analysis of data and public policypriorities would add much to public debates, leaving individual RDAs and the CoreCities to work on ‘foresight’ or ‘scenario-setting’ if they so choose.
Square pegs in round holes?
Since 1999 the UK has been undergoing a period of sustained increases in funding forpublic services. It is crucial that the instruments of the state – Whitehall, devolvedadministrations, regional institutions and local government – ensure that publicexpenditure is used effectively. An important part of this process will be to ensure thatpolicies are designed and administered at the most appropriate spatial scale. If thewrong spatial scale is chosen the result will be poorly delivered services and wastedtaxpayers’ money.
The problems of ensuring joined-up government have received a great deal ofattention recently. Clearly it is sensible for government to strive to ensure that policiesinteract positively ‘on the ground’ and that different funding streams, possibly
96 A new regional policy for the UK

administered by different authorities, complement each other. However, the questionthat ought to precede debates about joined-up government has received much lessattention in policy debates in recent years: at which geographical level should differentpolicies be pursued?
It might be useful to examine one issue in particular to illustrate this problem. Ithas often been argued that the concentration of economic inactivity in certain parts oflarge urban centres means that action designed to rectify this situation needs to befocused on these areas (see, for example, Webster 1999). Such an approach mightsound attractive at first, but is unlikely to be effective in principle: the geography ofmisery is different to the geography of recovery.
As we argued in Chapter 3, the most effective spatial scale to analyse labourmarket issues is the Travel-To-Work Area (TTWA). This has the advantage of beingdemand-led, the boundaries are drawn following an assessment of a sample of thetravel patterns of individuals in the Census. A focus on a more local level betrays amisunderstanding of how the labour market works and reduces the effectiveness ofstate action. If jobs are created in a local area, there is no reason why better qualifiedpeople from outside the area (but within the TTWA) could not successfully apply.
A much more effective strategy would be to analyse the labour market across thewhole TTWA and create jobs in those areas attractive to employers. Take, forexample, the South Wales mining areas. It would be more difficult to create jobs inrelatively inaccessible former mining villages such as Abertridwr or Nelson than inCaerphilly. Good quality transport links (probably buses) would ensure that jobopportunities are linked up with areas with high levels of economic inactivity.
As this discussion has demonstrated, the appropriate spatial scale at which tothink about labour market interventions is the TTWA, although the interventionsthemselves could be carried out by regional or local institutions. Decisions relating toplanning and major infrastructure investment in areas such as transport and housingwould seem to lend themselves to a similar geography. Physical regeneration wouldseem to be sensibly done at a more local level. Enterprise Areas seem to be at such asmall spatial scale that their effectiveness must be questioned. Public involvement andcommunity renewal issues have most resonance at the very local level, even down toparticular streets, although the problem then arises as to how you connect this todecision-making at a broader spatial scale. While the problems of joined-upgovernance must never be ignored, the geography of governance must first becorrectly decided.
This is not the only type of spatial debate that needs to be held within the UK. Thetensions between national economic policy and regional policy have been the subjectof heated debates for many years. This particular debate is complicated by the fact thatthe distinction between national industrial and regional policy is not straightforward(Gillespie and Benneworth 2002). Industrial policy may be spatially blind, and as
Governance issues 97

such it is quite distinct from regional policy; for example, in privatisation, technologypolicies, science policies and so on. These policies will generally have differentregional impacts, but these are often effectively unintended consequences.
However, industrial policy can also be spatially sensitive and policy-makers mightframe them in such a way as to raise the economic performance of lagging regions. Insuch cases they become synonymous with regional policies, for example policies forthe automotive sector could be specifically intended to help the West Midlandseconomy. To complicate matters further, national industrial policies might beadministered at the regional level, but this does not mean they become regionaleconomic policies. An example would include using RDAs to administer, with littleregional autonomy, a UK manufacturing strategy.
To this traditional tension between industrial and regional policy must be addeda new tension, which arises from the Treasury’s productivity agenda. The Treasuryhave been the driving force behind the renaissance in regional policy in recent years,and their motivation has been explicitly to ensure the regions play their part inimproving the UK’s productivity record as measured against other nations,particularly France, Germany and the USA. As we argued in Chapter 3, it is not at allclear that this reflects the concerns of lagging regions themselves, indeed in theireconomic agenda the Welsh Assembly Government have prioritised employment overproductivity. Perhaps the Treasury’s approach could best be described, to paraphraseformer US President Kennedy, as ‘ask not what your country can do for your region,but what your region can do for your country’.
Spatial subtlety is also necessary at the sub-regional level. Regeneration initiativessuch as the Neighbourhood Renewal Fund and the New Deal for Communities aredisproportionately focused on poorer regions and so could contribute towards reducingregional economic disparities. However, regeneration initiatives have a number ofobjectives, not all of them economic. For example, the stated objectives of the currentneighbourhood renewal strategy are the goals of ‘lower worklessness and crime, andbetter health, skill, housing and physical environment’ (SEU 2001). Clearly this is anambitious vision and one which requires numerous different policy interventions beforeit can become a reality, but not all of these interventions will be most effective if designedand administered at the local level. In particular, an objective to ensure lowerworklessness necessitates interventions at the level of the broader Travel-To-Work Area.
In an era of multi-level governance, the fact is that a modern state cannot work onthe basis of watertight divisions of functions and competencies (Keating 2002). Thisis not merely a fact of life that has to be accepted, it is necessary to ensure that thepublic sector is effective in its interventions. However, it does mean that policy-makershave to be clear about the objectives of policy, clear about which policy tools are mostappropriate, clear about at which spatial scale these policy tools should be designedand administered, and clear about how they will interact in practice ‘on the ground’.
98 A new regional policy for the UK

It is the people who most rely on government action and strong public services thatsuffer most from such failures of co-ordination.
Regionalising Whitehall
We have argued previously that Whitehall has a quasi-federal responsibility to tacklesocial and economic inequalities across the nations and regions of the UK (Adams andRobinson 2002). Its inability to understand when it is operating on an English basis,when it is performing UK-wide functions and when it is performing quasi-federalresponsibilities militates against this. Furthermore, the failure to appreciate the spatialimplications of England-wide or UK-wide decisions means that many Whitehalldecisions actually aggravate territorial injustices within the UK.
Before Whitehall departments can ‘mainstream’ the regional dimension into theirspending decisions they first need to identify the amount of expenditure in eachregion. At present in the English regions, this cannot be done with any certainty.Research suggests that a number of Whitehall departments have made seriousmistakes in the information passed to HM Treasury on the regional pattern ofdepartmental expenditure (McLean 2003). This research concluded that in Educationthe published tables understated expenditure in London by £552 million, andoverstated it in the East of England by £329 million (discrepancies of around 10 percent). In Law, order & protective services the published tables understated expenditurein London by £443 million (about 12 per cent) and overstated it in the East ofEngland by £110 million (about 7 per cent). And in Agriculture, forestry, fisheries andfood the published tables overstated expenditure in London by £226 million andunderstated it in East of England by £254 million (discrepancies of almost 50 percent). These figures should be seen as an embarrassment for Whitehall.
This research highlighted a number of instances where the actions of centralgovernment have not been regionally sensitive. In Chapter 5 we detailed theinequitable distribution of central government science spending, where £1 per head isspent on research and development in the North East while £78 is spent per head inthe South East and £62 per head in the South West. In Chapter 7 we discussed theinequitable distribution of spending on roads and transport in the UK. In that chapterwe also noted that the 2003 Communities Plan allocates billions of pounds of publicexpenditure more for the Greater South East than for the ‘North’ (ODPM 2003a).Many in the ‘North’ also feel that the Greater South East has a disproportionate shareof so-called ‘flagship projects’: the Dome was sited in London, not Birmingham; thenew national sports stadium was sited in London, not Coventry; and London isbidding for the Olympics after the successful Manchester Commonwealth Games.
This report has argued throughout that central government has a very difficultrole to play in fulfilling its responsibility of balancing the different, and often
Governance issues 99
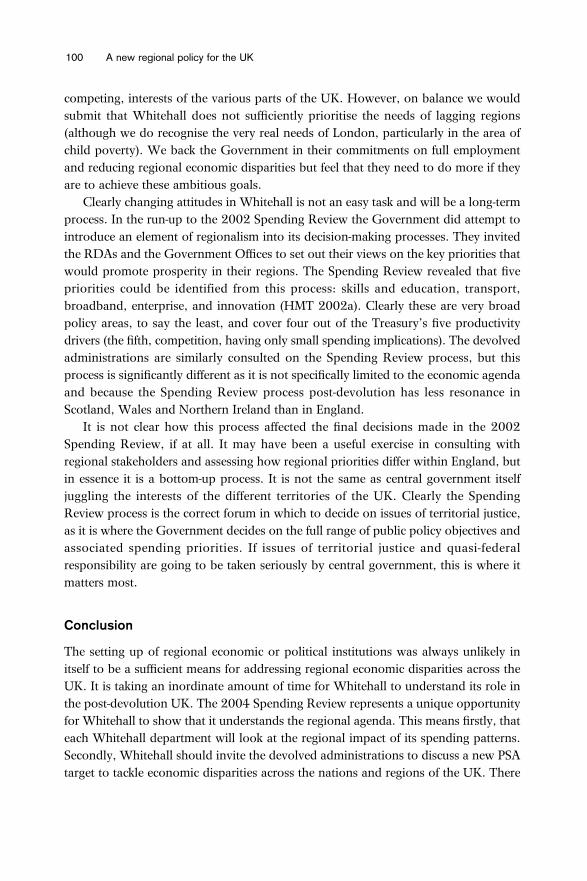
competing, interests of the various parts of the UK. However, on balance we wouldsubmit that Whitehall does not sufficiently prioritise the needs of lagging regions(although we do recognise the very real needs of London, particularly in the area ofchild poverty). We back the Government in their commitments on full employmentand reducing regional economic disparities but feel that they need to do more if theyare to achieve these ambitious goals.
Clearly changing attitudes in Whitehall is not an easy task and will be a long-termprocess. In the run-up to the 2002 Spending Review the Government did attempt tointroduce an element of regionalism into its decision-making processes. They invitedthe RDAs and the Government Offices to set out their views on the key priorities thatwould promote prosperity in their regions. The Spending Review revealed that fivepriorities could be identified from this process: skills and education, transport,broadband, enterprise, and innovation (HMT 2002a). Clearly these are very broadpolicy areas, to say the least, and cover four out of the Treasury’s five productivitydrivers (the fifth, competition, having only small spending implications). The devolvedadministrations are similarly consulted on the Spending Review process, but thisprocess is significantly different as it is not specifically limited to the economic agendaand because the Spending Review process post-devolution has less resonance inScotland, Wales and Northern Ireland than in England.
It is not clear how this process affected the final decisions made in the 2002Spending Review, if at all. It may have been a useful exercise in consulting withregional stakeholders and assessing how regional priorities differ within England, butin essence it is a bottom-up process. It is not the same as central government itselfjuggling the interests of the different territories of the UK. Clearly the SpendingReview process is the correct forum in which to decide on issues of territorial justice,as it is where the Government decides on the full range of public policy objectives andassociated spending priorities. If issues of territorial justice and quasi-federalresponsibility are going to be taken seriously by central government, this is where itmatters most.
Conclusion
The setting up of regional economic or political institutions was always unlikely initself to be a sufficient means for addressing regional economic disparities across theUK. It is taking an inordinate amount of time for Whitehall to understand its role inthe post-devolution UK. The 2004 Spending Review represents a unique opportunityfor Whitehall to show that it understands the regional agenda. This means firstly, thateach Whitehall department will look at the regional impact of its spending patterns.Secondly, Whitehall should invite the devolved administrations to discuss a new PSAtarget to tackle economic disparities across the nations and regions of the UK. There
100 A new regional policy for the UK

is no reason why Northern Ireland and Wales especially, but Scotland also, shouldnot welcome such an initiative. Signing up to a common objective is entirelycompatible with the operation of different policy instruments in pursuit of thatobjective as facilitated by devolution. It would show that the DTI and HMT werelearning about their quasi-federal functions as UK Departments of State.
Governance issues 101

9. A modern regional economic policy
The political priority given to regional economic policy is important. There are twobroad reasons why closing long-term differentials in regional economic performancematters: improving economic efficiency as unbalanced growth can undermine nationaleconomic performance; and there is a straightforward equity dimension, as reducingdisparities in prosperity across the UK is important for improving individuals’ lifechances.
For the centre-left, and for a centre-left government, it is the pursuit of equity thatshould be the strongest justification for a strong regional economic policy. This doesnot mean that a situation where the 12 nations and regions of the UK have exactlythe same levels of GDP per head is either a realistic or desirable outcome. But whilenot all inequalities are unjust, unjust inequalities need to be tackled and eliminated.We would submit that the systemic regional economic disparities that have existed inthe UK for generations are quite clearly inequitable. The perception that nationalUK-wide institutions have systematically failed to address this problem exacerbatesthe sense of injustice and is a cause of dissatisfaction with the UK’s politicalinstitutions.
It is encouraging that perhaps the most important of those UK-wide institutions isnow the strongest of regional ‘champions’. While the Deputy Prime Minister hastraditionally provided a regional voice, this has been supplemented by the rise of HMTreasury as an advocate for regional policy. The challenge for the Government nowis to move beyond its first-term policy of treating unequal territories equally, to a trueregional economic policy: one which targets lagging regions in order to narrowabsolute gaps in economic prosperity. In this report we have tried to examine how thismight be done.
As the Government’s new regional policy develops it needs to understand whichproblems are common amongst UK regions and which problems differ. The needs ofLondon often will be different to those of Northern Ireland, and the needs of NorthEast England will differ to those of South West England. Different problems will needdifferent solutions. This means that regional institutions need freedoms and flexibilitiesbut it also means that central government must appreciate regional circumstances andresist the temptation to become ‘spatially blind’.
Furthermore, the Government needs to commit to regional economic policy for thelong-term. Regional economic disparities have developed over generations and it willtake a significant amount of time to eliminate them. It is important to remember thatwhile the Government needs to set itself a radical objective, it may be thatincrementalism is the only route which will achieve the goal of balanced economicgrowth. Most major change is made up of incremental steps and the ‘big bang’approach is the exception not the rule.
102

While this is a policy area which has been the attention of much academic debate, mostof this work has focussed on conceptual thinking and analysing the scale of the problem.Little research has thought through practical policy solutions. However, this is exactly thetype of support which policy-makers require. The Government will have drafted itsDelivery Plan setting out initial thinking on how the 2002 PSA target of reducing thepersistent gap in growth rates between the English regions will be achieved. This was aspecific requirement of the original target, which stated that Whitehall Departments wouldhave to ‘define measures to improve performance’ (HMT 2002a). As negotiations begin onthe 2004 Spending Review the onus is upon the Government to show that these measuresare likely to actually start addressing regional economic disparities.
Throughout this report we have tried to identify our own practical policy solutionsand bring forward our own ‘ten-point plan’. The implications of meeting theGovernment’s PSA target are significant, and the implications of meeting the simplerbut more radical target we suggest of narrowing absolute disparities in prosperity areeven more demanding. We have mapped out below some possible new routes to aregional economic policy that the Government might follow.
A modern regional economic policy 103
Ten point plan for regional economic policy
1 The 2004 Spending Review should set out an unambiguous target to narrowdisparities in output per head across the UK nations and regions. The JointMinisterial Committee on the Economy taking place later in 2003 should beused to agree a target between the Government and devolved administrations.
2 Employment should be given equal weight with productivity as the focus forregional economic policy. Policies are required to increase the demand forlabour in the Assisted Areas, which should be re-defined to cover groups ofTravel-To-Work Areas in lagging regions with employment rates at or below 70per cent so that regional policy instruments can be concentrated.
3 The EU should back the UK position of ‘renationalising’ regional policy.HM Treasury needs to commit significant additional resources to compensatelagging regions for lower levels of EU spending. Regional and localinstitutions must decide how that funding is allocated across different areas ofspending.
4 More good quality jobs need to be created in lagging regions to retaingraduates. Increasing the proportion of young people and adults with adequatebasic skills and level 2 qualifications are the correct priorities for promotingemployment. A period of stability in the administration of learning and skillspolicy is required.

104 A new regional policy for the UK
5 The Government should ‘regionalise the science base’ by relocating keyinstitutions and by ‘top-slicing’ new spending on science for lagging regions. Thecurrent concentration of government R&D spending and science institutions inthe Greater South East is inequitable.
6 The Government needs to rationalise services for small and medium sizedenterprises as the number of initiatives and bodies in this area are impossiblycomplex. In particular, if the current pilots are successful the case for RDAsassuming responsibility for Business Links will be very strong.
7 All Whitehall departments need to ‘mainstream’ the regional dimension intotheir spending decisions. Decisions in areas such as housing, transport andscience policy need to reduce regional disparities not reinforce them.
8 Prosperous regions and localities should bear more of the costs of extraspending required to deal with the problems of success. Congestion chargingand capturing increases in land values can only be the start of something biggerin terms of fiscal reform.
9 Several Departments and Agencies should be relocated from the Greater SouthEast to the lagging regions, such as the ODPM, the Higher Education FundingCouncil for England and the seven Research Councils. The Lyons Review mustrelocate senior staff as well as back-room staff.
10 A central research unit for the RDAs and the Core Cities should be created tohelp promote evidence-based policy-making. This should be located in one ofthe lagging regions.

ReferencesAdams J and Robinson P (eds) (2002) Devolution in Practice: public policy differences
within the UK London: ippr/ESRC
Amin A, Massey D and Thrift N (2003) Decentering the Nation: a radical approach toregional inequality London: Catalyst
Armstrong H (2003) ‘Regional Selective Assistance’ Presentation to ippr Seminar 7 April
Armstrong H (2001) ‘Regional Selective Assistance: is the spend enough and is ittargeting the right places?’ Regional Studies 35.3
Arup Economics and Planning (2000) Evaluation of Regional Selective Assistance 1991-1995 London: Arup Economics and Planning
Balls E (2003) Growing the Economy: the local dimension London: The Smith Institute
Balls E (2000) ‘Britain’s New Regional Policy: sustainable growth and full employmentfor Britain’s regions’ in Balls E and Healey J (eds) Towards a New Regional Policy:Delivering growth and full employment London: The Smith Institute
Balls E and Healey J (2002) ‘The Regional Economic Challenge’ in Engel N (ed) Age ofRegions: meeting the productivity challenge London: The Smith Institute
Balls E and Healey J (eds) (2000) Towards a New Regional Policy: delivering growth andfull employment London: The Smith Institute
Barlow Report (1940) Report of the Royal Commission on the Distribution of IndustrialPopulation London: HMSO
Belt V, Hentley J, Charles D, Jones I, Audas R and Conway C (2002) North EastGraduate Labour Markets 1999-2000 Newcastle: Centre for Urban and RegionalDevelopment Studies
Better Regulation Task Force (2002) Local Delivery of Central Policy London: CabinetOffice
Blanchflower D, Oswald A and Williamson B (2002) Estimated Regional WagesRelativities for England: a report for the South East Area Cost Adjustment Group andAssociation of London Government Available at www.nera.com/wwt/publications/4975.pdf
Blitz R and Chung J (2003) ‘Back-Slapping and Handshakes Turn to Failure, Criticismand a Commons Grilling’ Financial Times 23 July
Boldrin, M and Fabio C (2001) ‘Inequality and Convergence in Europe’s Regions:reconsidering European regional policies’ Economic Policy 32
Brewer M, Clark T and Goodman A (2002) The Government’s Child Poverty Target: howmuch progress has been made? London: Institute for Fiscal Studies
Brooks R and Robinson P (2003) Manufacturing in the UK London: ippr
Brown G (2002) ‘New Economic Settlement for Northern Ireland: barracks and prisonsto be replaced by business and prosperity’ Press Release 42/02 2 May London: HMTreasury
105

Burkitt N and Robinson P (2001) ‘Overview and Recommendations’ in Burkitt N (ed) ALife’s Work: achieving full and fulfilling employment London: ippr
Cabinet Office (2003a) ‘London: analytical report’ The Prime Minister’s Strategy UnitAvailable at www.pm.gov.uk/output/Page4069.asp
Cabinet Office (2003b) Civil Service Statistics 2002 Norwich: The Stationery Office
Cabinet Office (2003c) Public Bodies Norwich: The Stationery Office
Charles D and Benneworth P (2000) ‘Clustering and Economic Complexity – regionalclusters of the ICT sector in the UK’ Paper presented to Do Clusters Matter inInnovation Policy? OECD Cluster Group Workshop Utrecht, May
Chote R, Emmerson C and Simpson H (2003) The IFS Green Budget: January 2003Commentary 92 London: Institute for Fiscal Studies
Corry D (2001) ‘Labour’s Industrial Policy: a break with the past?’ New Economy 8.3
Department for Education and Skills (DfES) (2003a) 21st Century Skills: realising ourpotential Available at www.dfes.gov.uk/skillsstrategy/
Department for Education and Skills (DfES) (2003b) The Future of Higher EducationNorwich: The Stationery Office
Department for Education and Skills (DfES) (1999) Jobs for All: a report of Policy ActionTeam 1 London: DfES
Department of Trade and Industry (DTI) (2003) Guide to the Regional SelectiveAssistance Scheme Cm 5416 London: DTI
Department of Trade and Industry (DTI) (2002a) Regional Innovation Performance in theUK unpublished paper, contact [email protected]
Department of Trade and Industry (DTI) (2002b) Social Enterprise: a strategy for successLondon: DTI
Department of Work and Pensions (DWP) (2003) Households Below Average Income: ananalysis of the income distribution from 1994-5 to 2001-02 Leeds: CorporateDocument Services
Department of Work and Pension (DWP) (2002) Client Group Analysis: quarterlybulletin on the population of working age on key benefits May Newcastle: DWP
Dixon S (2003) ‘Migration within Britain for Job Reasons’ Labour Market Trends 111.4
Employers Skills Survey (2002) Skills, Local Areas and Unemployment Warwick: Institutefor Employment Research
Engel N (ed) (2002) Age of Regions: meeting the productivity challenge London: TheSmith Institute
Erdem E and Glyn A (2001) ‘Jobs Deficits in UK Regions’ in Dickens R, Wadsworth Jand Gregg P (eds) The State of Working Britain: update 2001 London: Centre forEconomic Performance, London School of Economics
Eurostat (2002) Regional Gross Domestic Product in the European Union 1999 Availableat www.eu-datashop.de/download/EN/sta_kurz/thema1/ dn_02_01.pdf
106 A new regional policy for the UK

Evans M, Noble M, Wright G, Smith G, Lloyd M and Dibben C (2002) GrowingTogether or Growing Apart? Geographic patterns of change of Income Support andincome-based Jobseeker’s Allowance claimants in England between 1995 and 2000Bristol: The Policy Press/Joseph Rowntree Foundation
Experian Business Strategies (2003) Unpublished data presented at private seminar
Feinstein L (1998) Pre-School Education Inequality: British children in the 1970 cohortLondon: CEPS, London School of Economics
Gibbons M, Limoges C, Nowotny H, Schwartzman S, Scott P and Trow M (1994) TheNew Production of Knowledge: the dynamics of science and research in contemporarysocieties London: Sage
Gillespie A and Benneworth P (2002) ‘Industrial and Regional Policy in a DevolvedUnited Kingdom’ in Adams J and Robinson P (eds) Devolution in Practice: publicpolicy differences within the UK London: ippr/ESRC
Gordon I (2003) ‘One World City, Two World Class Regions: labour market andtransport interdependencies between London and its neighbours in South EastEngland’ Paper presented at ‘The New Regionalism’ conference Barbican 11 July
Gordon I (2002) ‘Industrial and Regional Policy: a London perspective’ in Adams J andRobinson P (eds) Devolution in Practice: public policy differences within the UKLondon: ippr/ESRC
Gordon I (1999) ‘Targeting a Leaky Bucket: the case against localised employmentcreation’ New Economy 6.4
Gordon I, Travers T, and Whitehead C (2002) London’s Place in the UK EconomyLondon: Corporation of London
Grayling T (forthcoming) ‘Whatever Happened to Integrated Transport?’ Political Quarterly
Grayling T (ed) (2001) Any More Fares? Delivering better bus services London: ippr
Green A and Owen D (2002) Exploring Local Areas, Skills and Unemployment:exploratory data analysis at local area level Nottingham: Department for Educationand Skills
Gregg P (2002) ‘Work and Communities’ Paper presented to DTI conference 15 January
Gregg P, Machin S and Manning A (2001) Mobility and Joblessness Copies availablefrom the first author, Department of Economics, University of Bristol
Griliches Z (1996) Education, Human Capital and Growth: a personal perspectiveNational Bureau of Economic Research WP 5426
Harding A, Evans R, Parkinson M and Garside P (1996) Regional Government in Britain:an economic solution? Bristol: The Policy Press
Heald D and McLeod A (2002) ‘Beyond Barnett? Financing devolution’ in Adams J andRobinson P (eds) Devolution in Practice: public policy differences within the UKLondon: ippr/ESRC
HM Treasury (HMT) (2003a) Budget 2003: building a Britain of economic strength andsocial justice HC500 London: The Stationery Office
References 107

HM Treasury (HMT) (2003b) Public Expenditure Statistical Analyses 2003 Norwich:The Stationery Office
HM Treasury (HMT) (2002a) 2002 Spending Review: Public Service Agreements 2003-2006 Cm 5571 Norwich: The Stationery Office
HM Treasury (HMT) (2002b) Opportunity and Security for All: investing in anenterprising, fairer Britain – 2002 Spending Review: new public spending plans2003-2006 Cm 5570 Norwich: The Stationery Office
HM Treasury (HMT) (2001) Pre-Budget Report: building a stronger, fairer Britain in anuncertain world Norwich: The Stationery Office
HM Treasury, the Department of Trade and Industry and the Office of the Deputy PrimeMinister (HMT/DTI/ODPM) (2003) A Modern Regional Policy for the UnitedKingdom London: The Stationery Office
HM Treasury and the Department of Trade and Industry (HMT/DTI) (2001)Productivity in the UK: 3 – the regional dimension Norwich: The StationeryOffice
HM Treasury, the Department of Trade and Industry and the Department for Educationand Skills (HMT/DTI/DfES) (2002) Investing in Innovation: a strategy for science,engineering and technology Norwich: The Stationery Office
HM Treasury and the Department for Work and Pensions (HMT/DWP) (2000) TheGoal of Full Employment: employment opportunity for all throughout Britain. Trendsin regional and local vacancies and unemployment London: HM Treasury
HM Treasury and the Office of the Deputy Prime Minister (HMT/ODPM) (2003)Productivity in the UK: 4 – the local dimension Norwich: The Stationery Office
Hubert F and Pain N (2002) ‘Fiscal Incentives, European Integration, and the Locationof Foreign Direct Investment’ Working paper London: National Institute ofEconomic and Social Research
Institute of Employment Research (2001) Projections of Occupations and Qualifications2000/2001, Volume 2 Warwick: Institute of Employment Research
Institute for Public Policy Research (ippr) (2003) Race Equality and Diversity Taskforce:Private Sector Available at www.ippr.org/research/files/team19/project93/briefing%20document.doc
Johnson M (2003) Not Choice But Champion: a new look at secondary admissions inLondon Available at www.ippr.org/london
Keating M (2002) ‘Devolution and Public Policy in the United Kingdom: divergence orconvergence?’ in Adams J and Robinson P (eds) Devolution in Practice: publicpolicy differences within the UK London: ippr/ESRC
Labour Force Survey (2003) Labour Force Survey: summary, 1984-2003 Available atwww.statistics.gov.uk/STATBASE/tsdataset.asp?vlnk=429
Labour Force Survey (2001) Labour Force Survey Available at www.stat.go.jp/english/data/roudou/
108 A new regional policy for the UK

Labour Force Survey (1999) Labour Force Survey Available at www.stat.go.jp/english/data/roudou/
Layard R (2003) ‘What Would Make a Happier Society?’ Lionel Robbins MemorialLectures 5 March London: LSE Available at www.cep.lse.ac.uk/events/lectures/layard/ RL050303.pdf
Lyons M (2003) Letter to all Government Departments: Public Sector Relocation Project –further guidance 10 July London: HM Treasury
MacGillivray A, Potts G and Raymond P (2002) Secrets of their Success: fast growthbusiness in Britain’s inner cities London: NEF
Machin A (2003) ‘The Vacancy Survey: a new series of National Statistics’ Labour MarketTrends 111.7
Mandelson P (2001) ‘Keynote Address’ The State of the English Regions SeminarUniversity of Newcastle-upon-Tyne 21 June
Martin R and Sunley P (2000) ‘Deconstructing Clusters: chaotic or policy panacea?’Journal of Economic Geography 3.1
McConnell J (2002) ‘Funding Devolution: why Barnett remains better than thealternatives’ New Economy 7.2
McLean I (2003) Identifying the Flow of Domestic and European Expenditure Into theEnglish Regions Oxford: Nuffield College
McLean I and McMillan A (2003) ‘The Distribution of Public Expenditure Across the UKRegions’ Fiscal Studies 24
Meager N and Bates P, with Cowling M (2003) ‘Business Start-up Support for YoungPeople Delivered by The Prince’s Trust: a comparative study of labour marketoutcomes’ DWP Research report 184 Leeds: Corporate Document Services
Medical Research Council (MRC) (2003) Medical Research Council Annual Report2001/02 London: MRC
Michie J and Oughton C (2001) ‘Regional Innovation Strategies: integrating regional,industrial and innovation policy’ New Economy 8.3
Midwinter A (1997) ‘The Barnett Formula and Scotland’s Public Expenditure Needs’Treasury Committee on the Barnett Formula Second Report of Session 1997-98 HC341 London: The Stationery Office
Morgan K (2002) ‘The English Question: regional perspectives on a fractured nation’Regional Studies 36.7
Morgan K and Rees G (2001) ‘Learning by Doing: devolution and the governance ofeconomic development in Wales’ in Chaney P, Hall T and Pithouse A (eds) NewGovernance – New Democracy Cardiff: University of Wales Press
National Audit Office (NAO) (2003) ‘The Department for Trade and Industry: regionalgrants in England’ Report by the Comptroller and Auditor General London: TheStationery Office
References 109

National Statistics (ONS) (2003a) Regional Gross Value Added Available atwww.statistics.gov.uk/pdfdir/gva0803.pdf
National Statistics (ONS) (2003b) Jobs Densities for Local Areas: a new indicatorAvailable at www.statistics.gov.uk/articles/nojournal/job_densities _LMTAug03.pdf
National Statistics (ONS) (2003c) ‘Table 10.8: aspects of their area that householderswould like to see improved’ Social Trends 33 Norwich: The Stationery Office
National Statistics (ONS) (2003d) Labour Market Trends 111.4
National Statistics (ONS) (2002) Regional Trends 37 Available at www.statistics.gov.uk/downloads/theme_compendia/Regional_Trends_37/Regional_Trends_37_contents_revised.pdf
National Statistics and Department for Environment, Food and Rural Affairs(ONS/DEFRA) (2002) Achieving a better quality of life: review of progress towardssustainable development – Government annual report 2002 London: DEFRA
Nine English Regional Development Agencies (2003) ‘Memorandum of the Nine EnglishRegional Development Agencies’ in Office of the Deputy Prime Minister SelectCommittee Reducing Regional Disparities in Prosperity, Ninth Report of Session2002-03. Volume 3: oral and written evidence London: The Stationery Office
North West Development Agency (NWDA) (2003) ‘NWDA Invest £35 million intoNew World-Class University’ Press Release 1 July Warrington: NWDA
Office of the Deputy Prime Minister (ODPM) (2003a) Sustainable Communities: buildingfor the future London: ODPM
Office of the Deputy Prime Minister (ODPM) (2003b) Creating Sustainable Communities:Thames Gateway and growth areas London: ODPM
Office of the Deputy Prime Minister Select Committee (2003a) Reducing RegionalDisparities in Prosperity. Volume 1: report London: The Stationery Office
Office of the Deputy Prime Minister Select Committee (2003b) Reducing RegionalDisparities in Prosperity, Ninth Report of Session 2002-03. Volume 3: oral andwritten evidence London: The Stationery Office
Office of the Deputy Prime Minister spokesperson quoted in The Journal (2003)‘Ministry “should go north”’ The Journal 1 August
Office of the Deputy Prime Minister, HM Treasury, Department for Transport, CoreCities Group, Department for Trade and Industry and England’s RegionalDevelopment Agencies (2003) Cities, Regions and Competitiveness: second reportfrom the Working Group of Government Departments, the Core Cities and theRegional Development Agencies London: ODPM
Office of Science and Technology spokesperson (2003) Telephone Interview 14 August
O’Mahoney M and de Boer W (2002) ‘Britain’s Relative Productivity Performance:updates to 1999. A report for DTI/Treasury/ONS’ Working Paper National Institutefor Economic and Social Research Available at www.niesr.ac.uk/epke/britainRPP.pdf
110 A new regional policy for the UK
Oswald A (1997) ‘Happiness and Economic Performance’ Economic Journal 107
Oughton C, Landabaso M and Morgan K (2001) ‘The Regional Innovation Paradox:innovation policy and industrial policy’ Journal of Technology Transfer 27.2
Palmer G, Rahman M and Kenway P (2002) Monitoring Poverty and Social Exclusion2002 York: Joseph Rowntree Foundation/New Policy Institute
Payne J (2001) ‘Patterns of Participation in Full-Time Education after 16: an analysis ofthe England and Wales Youth Cohort Study’ Department for Education and SkillsResearch Report RR307 Norwich: HMSO
Payne J (1998) ‘Routes at Sixteen: trends and choices in the nineties. An analysis of datafrom the England and Wales Youth Cohort Study’ Department for Education andEmployment Research Report 55 Norwich: HMSO
Piatt W and Robinson P (2001) Opportunity For Whom? Options for funding andstructure of post-16 education London: ippr
Porritt J (2003) ‘Odd Couple’ Guardian Society Available at http://society.guardian.co.uk/societyguardian/story/0,7843,993961,00.html
Porter M (1998) On Competition Harvard: Harvard Business School Press
Rawls J (1971) A Theory of Justice Oxford: Oxford University Press
Regional Studies Association (2001) Labour’s New Regional Policy: an assessmentSeaford: Regional Studies Association
Robinson P and Oppenheim C (1999) Key Indicators of Social Exclusion MimeographLondon: ippr
Rodriguez-Pose A (2001) ‘Economic Convergence and Regional DevelopmentStrategies in Spain: the case of Galicia and Navarra’ in Hurst (ed) RegionalDevelopment in Europe: an assessment of policy strategies European InvestmentBank Cahiers Papers 5
Russell Barter W (2000) Regional Government in England: a preliminary review ofliterature and research findings London: DETR
Scotland Office (2003) ‘Scotland’s Economy at the Top of Darling’s Agenda’ PressRelease SS046 26 August Edinburgh: Scotland Office
Small Business Service (SBS) (2003) SME – Statistics 2001: regional summary Availableat www.sbs.gov.uk/content/statistics/’Regional Summary’!A1
Small Business Service and HM Treasury (SBS/HMT) (2002) Cross Cutting Review ofGovernment Services for Small Businesses London: Small Business Service
Social Enterprise Coalition (2003) Social Enterprise in the English RDAs, and in Wales,Scotland and Northern Ireland London: Social Enterprise Coalition
Social Exclusion Unit (SEU) (2001) A New Commitment to Neighbourhood Renewal:national strategy action plan London: Cabinet Office
Social Justice Commission (1994) Social Justice: strategies for national renewal – thereport of the Commission on Social Justice London: Vintage
References 111

South East England Development Agency (SEEDA) (2002) Regional Economic Strategyfor South East England 2002-2012 Guildford: SEEDA
Standing Advisory Committee on Trunk Road Assessment (SACTRA) (1999) Transportand the Economy London: DETR
Stanley K and Regan S (2003) The Missing Million: supporting disabled people into workLondon: ippr
The Journal (2002) ‘On the wrong side of £1 billion border’ The Journal 20 April
The Standing Advisory Committee on Trunk Road Assessment (1999) Transport and theEconomy London: DETR
Tomaney J, Pike A and Benneworth P (2003) ‘Memorandum by Professor JohnTomaney, Dr Andy Pike, Dr Paul Benneworth, Centre for Urban and RegionalDevelopment Studies, University of Newcastle-upon-Tyne’ in Office of the DeputyPrime Minister Select Committee Reducing Regional Disparities in Prosperity, NinthReport of Session 2002-03 Volume 3: oral and written evidence London: TheStationery Office
Trades Union Congress (TUC) (2003) Small Firms – myths and realities London: TUC
Turok I and Edge N (1999) The Jobs Gap in Britain’s Cities: employment loss and labourmarket consequences Bristol: The Policy Press
Webster D (1999) ‘Targeted Local Jobs: the missing element in Labour’s social exclusionpolicy’ New Economy 6.4
Westwood A and Nathan M (2003) Manchester: Ideopolis? Developing a knowledgecapital London: The Work Foundation
Wren C (2002) ‘UK Regional Policy: does it measure up?’ Mimeograph Available fromthe author Department of Economics, University of Newcastle-upon-Tyne, UK
112 A new regional policy for the UK