A new paradigm of GPCR signaling at the trans-Golgi ...€¦ · With regards to the anatomy of the...
117
A new paradigm of GPCR signaling at the trans-Golgi network of thyroid cells Ein neues Model der GPCR Signaltransduktion am trans-Golgi- Netzwerk von Schilddrüsenzellen Doctoral thesis for a Doctoral degree at the Graduate School of Life Sciences, Julius-Maximilians-Universität Würzburg, Section Biomedicine submitted by Amod Anand Godbole from Mumbai, India Würzburg, 2016
Transcript of A new paradigm of GPCR signaling at the trans-Golgi ...€¦ · With regards to the anatomy of the...

A new paradigm of GPCR signaling at the trans-Golgi network of
thyroid cells
Ein neues Model der GPCR Signaltransduktion am trans-Golgi-
Netzwerk von Schilddrüsenzellen
Doctoral thesis for a Doctoral degree
at the Graduate School of Life Sciences,
Julius-Maximilians-Universität Würzburg,
Section Biomedicine
submitted by
Amod Anand Godbole
from
Mumbai, India
Würzburg, 2016

1
A new paradigm of GPCR signaling at the trans-Golgi network of
thyroid cells
Ein neues Model der GPCR Signaltransduktion am trans-Golgi-
Netzwerk von Schilddrüsenzellen
Doctoral thesis for a Doctoral degree
at the Graduate School of Life Sciences,
Julius-Maximilians-Universität Würzburg,
Section Biomedicine
submitted by
Amod Anand Godbole
from
Mumbai, India
Würzburg, 2016

2
Submitted on: …………………………………………………………..……..
Office stamp
Members of the Promotionskomitee:
Chairperson: Prof. Dr. Ulrike Holzgrabe
Primary Supervisor: PD Dr. Dr. med. Davide Calebiro
Supervisor (Second): Prof. Dr. Martin J. Lohse
Supervisor (Third): Prof. Dr. Markus Sauer
Date of Public Defence: …………………………………………….…………
Date of Receipt of Certificates: ……………………………………………….

3
Affidavit
I hereby confirm that my thesis entitled “A new paradigm of GPCR signaling at the trans-Golgi
network of thyroid cells” is the result of my own work. I did not receive any help or support from
commercial consultants. All sources and / or materials applied are listed and specified in the thesis.
Furthermore, I confirm that this thesis has not yet been submitted as part of another examination
process neither in identical nor in similar form.
Place, Date Signature
Eidesstattliche Erklärung
Hiermit erkläre ich an Eides statt, die Dissertation „Ein neues Model der GPCR
Signaltransduktion am trans-Golgi-Netzwerk von Schilddrüsenzellen” eigenständig, d.h.
insbesondere selbständig und ohne Hilfe eines kommerziellen Promotionsberaters, angefertigt und
keine anderen als die von mir angegebenen Quellen und Hilfsmittel verwendet zu haben.
Ich erkläre außerdem, dass die Dissertation weder in gleicher noch in ähnlicher Form bereits in
einem anderen Prüfungsverfahren vorgelegen hat.
Ort, Datum Unterschrift

4
A new paradigm of GPCR signaling at the trans-
Golgi network of thyroid cells
Doctoral thesis by
Amod Anand Godbole

5
Abstract
Whereas G-protein coupled receptors (GPCRs) have been long believed to signal through cyclic AMP
exclusively at cell surface, our group has previously shown that GPCRs not only signal at the cell surface
but can also continue doing so once internalized together with their ligands, leading to persistent cAMP
production. This phenomenon, which we originally described for the thyroid stimulating hormone receptor
(TSHR) in thyroid cells, has been observed also for other GPCRs. However, the intracellular
compartment(s) responsible for such persistent signaling and its consequences on downstream effectors
were insufficiently characterized. The aim of this study was to follow by live-cell imaging the trafficking of
internalized TSHRs and other involved signaling proteins as well as to understand the consequences of
signaling by internalized TSHRs on the downstream activation of protein kinase A (PKA). cAMP and PKA
activity was measured in real-time in living thyroid cells using FRET-based sensors Epac1-camp and
AKAR2 respectively. The results suggest that TSH co-internalizes with its receptor and that the internalized
TSH/TSHR complexes traffic retrogradely to the trans-Golgi network (TGN). This study also provides
evidence that these internalized TSH/TSHR complexes meet an intracellular pool of Gs proteins in sorting
endosomes and in TGN and activate it there, as visualized in real-time using a conformational biosensor
nanobody, Nb37. Acute Brefeldin A-induced Golgi collapse hinders the retrograde trafficking of
TSH/TSHR complexes, leading to reduced cAMP production and PKA signaling. BFA pretreatment was
also able to attenuate CREB phosphorylation suggesting that an intact Golgi/TGN organisation is essential
for an efficient cAMP/PKA signaling by internalized TSH/TSHR complexes. Taken together this data
provides evidence that internalized TSH/TSHR complexes meet and activate Gs proteins in sorting
endosomes and at the TGN, leading to a local activation of PKA and consequently increased CREB
activation. These findings suggest unexpected functions for receptor internalization, with major
pathophysiological and pharmacological implications.

6
Contents
Abbreviations ................................................................................................................................................ 9
1 Introduction ........................................................................................................................................ 13
1.1 The thyroid gland ...................................................................................................................... 13
1.2 The thyroid follicle .................................................................................................................... 13
1.3 The hypothalamus-pituitary-thyroid axis ............................................................................... 15
1.4 The thyroid stimulating hormone receptor ............................................................................. 17
1.5 TSHR structure ......................................................................................................................... 19
1.6 TSHR oligomerization .............................................................................................................. 22
1.7 TSHR signaling .......................................................................................................................... 23
1.8 TSHR desensitization ................................................................................................................ 25
1.9 TSHR internalization and trafficking ..................................................................................... 27
1.10 Intracellular signaling by internalized TSHR......................................................................... 30
1.11 Why do we hypothesize that the Golgi/TGN is a signaling platform for internalized
TSH/TSHR complexes? ........................................................................................................................ 35
2 Aim and Strategy ................................................................................................................................ 39
2.1 Aim .............................................................................................................................................. 39
2.2 Strategy....................................................................................................................................... 40
3 Materials and Methods ...................................................................................................................... 43
3.1 Materials..................................................................................................................................... 43
3.2 Methods ...................................................................................................................................... 46
3.2.1 Plasmids .............................................................................................................................. 46
3.2.2 Transformation of chemically competent Escherichia coli cells (TOP10) .................... 47
3.2.3 Plasmid DNA extraction ................................................................................................... 47
3.2.4 Preparation of fluorescently labelled TSH ...................................................................... 48
3.2.5 Isolation of primary mouse thyroid follicles ................................................................... 49
3.2.6 Transfection of HEK293 AD cells .................................................................................... 50
3.2.7 Transfection of primary mouse thyroid cells by electroporation .................................. 51
3.2.8 Live-cell imaging ................................................................................................................ 52
3.2.9 Post-acquisition image processing .................................................................................... 54

7
3.2.10 Immunofluoroscence ......................................................................................................... 54
3.2.11 CREB phosphorylation ..................................................................................................... 55
3.2.12 Cell lysis .............................................................................................................................. 55
3.2.13 Western blot analysis ........................................................................................................ 55
3.2.14 Statistics .............................................................................................................................. 56
4 Results.................................................................................................................................................. 57
4.1 Spinning disk confocal microscopy is not ideal for imaging mouse thyroid cells ................ 57
4.2 Visualization of Alexa Fluor labelled TSH using TIRF microscopy ..................................... 58
4.3 Visualization of internalized TSHR-YFP and fluorescently labelled TSH .......................... 59
4.4 Trafficking of TSH/TSHR complexes via the endocytic pathway......................................... 60
4.5 Retrograde trafficking of the TSH via the trans-Golgi network ........................................... 61
4.6 Dynamics between internalized TSH/TSHR complexes and Gs proteins ............................ 63
4.7 Involvement of retromer subunits in internalized TSH/TSHR signaling ............................. 65
4.8 Internalized TSH/TSHR complexes activate Gs proteins at the TGN .................................. 66
4.9 Brefeldin A treatment affects retrograde trafficking ............................................................. 68
4.10 Brefeldin A disrupts localization of the PKA RII subunit from the Golgi/TGN ............... 68
4.11 Brefeldin A treatment attenuates cAMP and PKA signaling ................................................ 71
4.12 Effect of Golgi disruption on TSHR-induced TSHR CREB phosphorylation ..................... 73
5 Discussion ............................................................................................................................................ 74
5.1 Retrograde trafficking of GPCRs via the trans-Golgi network ............................................ 74
5.2 Gs-protein-mediated intracellular signaling ........................................................................... 77
5.3 Direct evidence of G-protein signaling at TGN/sorting endosomes ...................................... 79
5.4 Effect of BFA-induced Golgi collapse on the TGN ................................................................. 81
5.5 Intra and post- Golgi transport: cisternal progression or kiss-and-run model? ................. 83
5.6 Gs protein signaling at the trans-Golgi network .................................................................... 85
5.7 cAMP and PKA signaling at the Golgi/TGN .......................................................................... 86
5.8 A new model for internalized TSH/TSHR signaling at the TGN .......................................... 88
6 Outlook ................................................................................................................................................ 90
7 Summary ............................................................................................................................................. 92
8
8 Zusammenfassung .............................................................................................................................. 93
9 Annex ................................................................................................................................................... 94
9.1 Circular plasmid maps .............................................................................................................. 94
9.2 Videos ......................................................................................................................................... 97
10 References ........................................................................................................................................... 99
11 Curriculum vitae .............................................................................................................................. 112
12 Acknowledgments ............................................................................................................................. 116

9
Abbreviations
7TM: seven-transmembrane receptors, here referring to GPCRs
AC: adenylyl cyclase
AKAP: A-kinase anchoring protein
AKAR: A-kinase activity biosensor
Å: Angstrom
ARF6: ADP-ribosylation factor 6
2-AR: β2-adrenergic receptor
BFA: Brefeldin A
BRET: bioluminescence resonance energy transfer
ca.: circa (here, approximately)
cAMP: cyclic adenosine monophosphate
CFP: cyan fluorescent protein
CHO cells: Chinese Hamster Ovary cells
CPM model: cisterna-progression maturation model
CREB: cAMP responsive element binding protein
CRISPR: clustered regularly interspaced short palindromic repeats
D1R: dopamine receptor D1
DAG: diacylglycerol
ddH2O: double-distilled water
DNA: deoxyribonucleic acid
ELISA: enzyme-linked immunosorbent assay
Epac: exchange factor directly activated by cAMP
ER: endoplasmic reticulum
EtOH: ethanol
Fab: fragment antigen-binding
FEME: fast endophilin-mediated endocytosis
fps: frames per second
FRET: fluorescence resonance energy transfer
10
FRTL-5 cells: Fischer rat thyroid cell line
FSH: follicle stimulating hormone
FSHR: follicle stimulating hormone receptor
GDP: guanine diphosphate
GFP: green fluorescent protein
GLUT: glucose transporter
GPCR: G-protein-coupled receptor
GPER: G-protein-coupled estrogen receptor
GPHR: glycoprotein hormone receptors
GRK: G-protein-coupled receptor kinase
GTP: guanosine-5'-triphosphate
hCG: Human chorionic gonadotropin
HEK cells: Human Embryonic Kidney cells
HILO: highly inclined and laminated optical sheet microscopy
HPT: hypothalamus pituitary thyroid
HUVEC: Human umbilical vein endothelial cells
i.e.: id est (here “that is”)
IP3: inositol 1,4,5-trisphosphate
KAR model: kiss and run model
kDa: kilodalton
KDELR: Lys-Asp-Glu-Leu receptor
LB: Lysogeny broth
L-DOPA: L-3, 4-dihydroxyphenylalanine
LH: luteinizing hormone
LHCGR: luteinizing Hormone/Choriogonadotropin Receptor
LRRD: leucine-rich repeat domain
LSCM: laser scanning confocal microscopy
M6PR: mannose 6-phosphate receptor
MAPK: mitogen-activated protein kinases
Nb: nanobody

11
NHS ester: N-hydroxysuccinimide esters
PDB: here, Protein Data Bank
PDZ: acronym for Post synaptic density protein (PSD95), Drosophila disc large tumor suppressor (Dlg1)
and Zonula occludens-1 protein (zo-1)
PI3 kinases: phosphatidylinositol-4, 5-bisphosphate 3-kinase
PKA: protein kinase A
PKD: protein kinase D
PLC: phospholipase C
PTHR: parathyroid hormone receptor
RFP: red fluorescent protein
RI: refractive index
RNA: ribonucleic acid
rpm: rotations per minutes
S1PR: sphingosine-1-phosphate receptor
SDCM: spinning disk confocal microscopy
SEM: standard error of the mean
siRNA: small interfering ribonucleic acid
SNARE: acronym from SNAP (Soluble NSF Attachment protein) REceptor
ST: sialyl transferase
Ste2 receptor: alpha-factor pheromone receptor
T3: triiodothyronine
T4: thyroxine or tetra iodothyronine
Tg: thyroglobulin
TGN: trans-Golgi network
TIRF: total internal reflection fluorescence
TPO: thyroid peroxidase
TRH: thyrotropin-releasing hormone
TSH: thyroid stimulating hormone
TSHR: thyroid stimulating hormone receptor
V2R: vasopressin type 2 receptor
12
VASP: vasodilator-stimulated phosphoprotein
viz.: videlicet (here, “namely”)
WT: wild type
YFP: yellow fluorescent protein

13
1 Introduction
1.1 The thyroid gland
The endocrine system is composed of cells, often organized in glands, which are responsible for the
production, storage and release of hormones directly into the systemic circulation (Gray, 1918). In humans,
this list includes the thyroid, parathyroid, thymus, pituitary, pineal body, adrenal glands, paraganglia, aortic
glands, spleen, liver, pancreas, ovaries and testes (Gray, 1918). Among these, the thyroid gland which is
composed of two lobes situated on either side of the trachea, is one of the largest endocrine gland (Nussey
S, 2001).
The thyroid gland develops from the pharyngeal endoderm and is mainly composed of follicles and
parafollicular cells (Nussey S, 2001). The follicle is a monolayer of epithelial cells that surrounds an empty
cavity filled with colloid (Nussey S, 2001). The colloid contains an iodinated protein (thyroglobulin), which
acts as a storage for thyroid hormones (Nussey S, 2001). The cells of the follicle that surround the follicle’s
lumen are polarized i.e. the base of the cells is on the outer side to receive the blood from the capillaries and
the apex juts into the lumen (Nussey S, 2001).
1.2 The thyroid follicle
With regards to the anatomy of the thyroid gland and the production of thyroid hormones, the follicle
is considered the structural and functional unit of the thyroid (Nussey S, 2001) (see Figure 1.1). The
synthesis and storage of the thyroid hormones involve the follicular cells and the colloid of the lumen
(Nussey S, 2001). Thyroid hormone synthesis starts with the active uptake of iodide ions by the follicular
cells from the basolateral membrane facing the blood vessels (Nussey S, 2001). This uptake of iodide itself
is regulated by the pituitary hormone thyrotropin also known as thyroid stimulating hormone (TSH) (Nussey
S, 2001). Once inside, iodide is transported actively across the apical side of the cells into the lumen and
the oxidation of iodide with hydrogen peroxide into iodine is followed by the incorporation of this iodine
into the glycoprotein thyroglobulin at its tyrosine residues to produce the two forms of thyroid hormones:
tetra-iodothyronine (T4) or tri-iodothyronine (T3) (Nussey S, 2001). This entire reaction is catalyzed with
the help of the enzyme thyroid peroxidase (TPO) at the surface of the apical membrane (Nussey S, 2001).
The thyroid hormones are stored in the above form (T3 and T3) till needed (Nussey S, 2001). Following the
stimulation of follicular cells by TSH, droplets of thyroglobulin re-enter the follicular cells by
micropinocytosis (Nussey S, 2001). The captured droplets fuse with lysosomes inside the cells followed by

14
hydrolysis and the eventual release of T3 and T4 into the blood (Nussey S, 2001). While T3 is ten times
more potent than T4, the released thyroid hormone mixture comprises mostly the less active form i.e. T4
while T3 forms around 10% of this mixture (Nussey S, 2001). Majority of the released T4 (ca. 80%) is
converted to T3 in the liver and the kidney. The effects of thyroid hormones are brought into action by T3
receptors, belonging to the family of nuclear receptors/transcription factors which is then further translated
into differential gene expression (Nussey S, 2001). On a broader scale, thyroid hormones are crucial players
in the metabolism, growth and development of the body as their lack, deficiency or surplus is translated into
a number of clinical disorders (Nussey S, 2001).
Figure 1.1 Thyroid follicle as a central feature of the thyroid gland: Schematic representation of the
thyroid follicle as the structural and functional unit of the thyroid gland. Thyroglobulin (Tg), synthesized in
the follicular cells, is stored in the lumen. Active uptake of iodide by follicular cells is followed by oxidation
to iodine at the apical membrane which couples with tyrosine residues of Tg to form tri- iodothyronine (T3)
and tetra- iodothyronine (T4). T3 and T4 enter back into the cells by micropinocytosis and are then
eventually released into the blood stream.
15
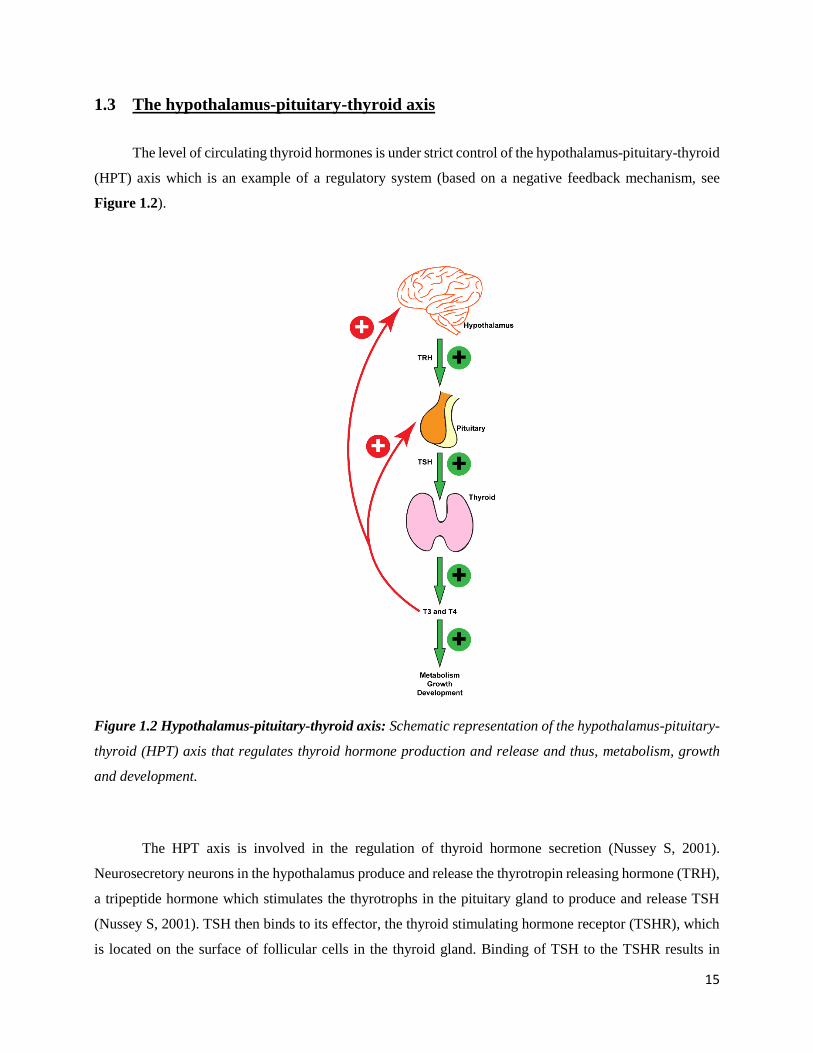
1.3 The hypothalamus-pituitary-thyroid axis
The level of circulating thyroid hormones is under strict control of the hypothalamus-pituitary-thyroid
(HPT) axis which is an example of a regulatory system (based on a negative feedback mechanism, see
Figure 1.2).
Figure 1.2 Hypothalamus-pituitary-thyroid axis: Schematic representation of the hypothalamus-pituitary-
thyroid (HPT) axis that regulates thyroid hormone production and release and thus, metabolism, growth
and development.
The HPT axis is involved in the regulation of thyroid hormone secretion (Nussey S, 2001).
Neurosecretory neurons in the hypothalamus produce and release the thyrotropin releasing hormone (TRH),
a tripeptide hormone which stimulates the thyrotrophs in the pituitary gland to produce and release TSH
(Nussey S, 2001). TSH then binds to its effector, the thyroid stimulating hormone receptor (TSHR), which
is located on the surface of follicular cells in the thyroid gland. Binding of TSH to the TSHR results in

16
TSHR-mediated signaling cascades (explained in more detail in sections 1.4 and 1.7) that ultimately lead
not only to the synthesis and release of thyroid hormones (which involves iodine uptake, thyroid peroxide
production and iodination of thyroglobulin) but also to thyroid growth (Vassart and Dumont, 1992; Nussey
S, 2001). This amount of circulating thyroid hormones is maintained by negative feedback mechanisms that
involves the hypothalamus and the pituitary (Nussey S, 2001). The thyroid hormones exert their main effect
by facilitating the thyrotrophs in reducing their response to TRH rather than changing the secretion of TRH
itself from the hypothalamus. This is brought about by the pituitary intake of circulating T4 followed by its
conversion to T3 (Nussey S, 2001). A low or drop in concentration of circulating T4 leads to an increase in
the expression of TRH receptors in the thyrotrophs leading to an increased TSH production and release and
vice versa (Nussey S, 2001). This feedback mechanism is also affected by internal factors like circadian
rhythms (with a peak in TSH secretion at midnight) and also environmental factors like temperature (Nussey
S, 2001). Therapeutic treatment, for example with glucocorticoids affects the feedback mechanism by
eventually decreasing thyroid hormone release (Nussey S, 2001). TSH secretion can also be inhibited by
other hormones viz. somatostatin, dopamine and by certain cytokines viz. IL-1β, IL-6 and TNF- (Nussey
S, 2001).

17
1.4 The thyroid stimulating hormone receptor
As can be seen from the above feedback mechanism, the TSH, secreted by the pituitary gland and the
overall changes brought about by its effector i.e. the TSHR, located on the follicular cells in the thyroid
gland, are the key players (Vassart and Dumont, 1992). While TSH itself relies on the response of the
thyrotrophs towards TRH, the TSH receptor plays an important role in regulating the physiology of follicular
cells (Nussey S, 2001). Not only does it regulate thyroid hormone production but it also controls growth of
the thyroid gland (Nussey S, 2001; Vassart and Dumont, 1992).
Figure 1.3 TSHR signaling: Schematic representation of the signaling by the thyroid stimulating hormone
receptor (TSHR). Upon binding of the TSH to the TSHR, Gs and Gq mediated signaling cascades are
activated which lead to gene expression, thyroid hormone production and release.
A typical human follicular cell has ca. 1,000 TSH receptor molecules on the basolateral membrane
(Nussey S, 2001). The TSH receptor is a typical G-protein coupled receptor (GPCR) (Kleinau and Krause,
2009). The TSH hormone is a glycoprotein composed of two subunits; the alpha subunit (Szkudlinski et al.,
2002) which shares sequence identity with other glycoprotein hormones viz. luteinizing hormone (LH) and

18
follicle stimulating hormone (FSH); and the beta subunit, which is exclusive regarding sequence and thus
provides biological specificity (Kleinau et al., 2013). Structurally, the TSH, LH and FSH share regions of
three disulfide bonds in the alpha and beta subunits. When TSH binds to the TSH receptor, conformational
changes in the intracellular loops in the receptor lead to G-protein activation (Kleinau and Krause, 2009;
Kleinau et al., 2013). This is brought about by the physical exchange of GDP by GTP on the alpha subunit
of the G protein heterotrimer followed by the dissociation of the alpha subunit from the beta-gamma dimer
and activation of adenylyl cyclase (AC) and phospholipase C (PLC), respectively (Kleinau and Krause,
2009). While AC catalyzes the conversion of ATP to cAMP which then acts as a second messenger by
acting via enzymes (viz. PKA), ion transporters, cAMP binding proteins or transcription factors; PLC brings
about the hydrolysis of phosphoinositide to inositol triphosphate (IP3) and diacylglycerol (DAG) (Kleinau
and Krause, 2009). IP3 production leads to an increase in intracellular Ca2+ concentration while DAG
production leads to a further activation of protein kinase C (PKC) (Kleinau and Krause, 2009). PKA and
PKC together induce downstream signal cascades mainly involving activation, phosphorylation and
translocation of transcription factors and gene expression and ultimately leading to thyroid hormone
production and release (Kleinau and Krause, 2009; Nussey S, 2001) (see Figure 1.3).

19
1.5 TSHR structure
TSHR, like all GPCRs, is characterized by an extracellular N-terminus, a seven transmembrane
“serpentine” domain, which gives rise to three intracellular and extracellular loops and an intracellular C-
terminus (Kleinau and Krause, 2009). A characteristic feature which the TSHR shares with other
glycoprotein hormone receptors (GPHRs) is the long N-terminal extracellular domain (Kleinau and Krause,
2009). Structurally, it can be divided into the 1) N-terminal tail 2) a leucine-rich repeat domain (LRRD)
which also includes the first repeat of cysteine residues and 3) the hinge region, which includes the next
three cysteine repeats followed by the trans-membrane domain (Kleinau and Krause, 2009) (see Figure
1.4).
Figure 1.4 Schematic TSHR structure: A snake dot-plot representation of the TSHR depicting different
known domains viz. the cysteine boxes, leucine-rich domains (shown here as beta strands) and seven
transmembrane domains. Snake dot-plot was constructed using the Sequence-Structure-Function-Analysis
database software (Kreuchwig et al., 2013; Kreuchwig et al., 2011) belonging to Leibniz Institute for
Molecular Pharmacology.

20
A closer look at the amino acid sequence of this ectodomain reveals not only structural conservation
among GPHRs but also diversity, particularly in the hinge region, which is a structurally and functionally
important region. Exclusive to the TSHR, the hinge region contains two cleavage sites to excise out the C-
peptide (Kleinau and Krause, 2009). According to studies based on homology modeling, it was shown that
TSH can bind to the LRRD and the hinge region. Besides hormone binding, it has also been shown that the
hinge region is needed for a stable confirmation of the TSHR in a basal condition (Kleinau et al., 2013).
Latest evidence for the role of hinge region in ligand selectivity and signaling was provided by the use of
truncated portions of the LRRD, hinge region and the transmembrane domains of TSHR and FSHR in the
form of chimeras (Schaarschmidt et al., 2014). Schaarschmidt et al found that the binding of bovine TSH is
greatly reduced in chimeras containing the hinge region of the FSHR. Interestingly, in the same study, it
was also found that the binding of TSH is maintained in chimeras containing the transmembrane domain
and hinge region of the TSHR and LRRD of the FSHR. This chimera also showed a significant level of Gs
protein activation suggesting that the hinge region plays a bigger role not only in hormone binding but also
in signaling following receptor activation (Schaarschmidt et al., 2014). In the same study, Schaarschmidt et
al also provided evidence on how the charge distribution at the interface between the LRR and hinge region
significantly influences hormone binding and signaling; with a positive charge helping in signaling and vice
versa. Nonetheless, what we learn from this work is that the hinge region is not merely a structural entity of
the TSHR, but together with the LRR, contributes to hormone binding and subsequent signaling. After
comparison to the same domains of other GPHRs, it is important to note that even though there are
similarities in structure and function, each ectodomain of these GPHRs behaves in a special way with respect
to hormone binding and signaling (Schaarschmidt et al., 2014). For a more detailed explanation which deals
with the influence of structure on function, the reader is advised to refer to specialized reviews (Kleinau and
Krause, 2009). More recent work by Brüser et al focuses on the activation mechanism of glycoprotein
hormone receptors (Brüser et al., 2016). After screening peptide libraries, they identified a conserved
sequence in the ectodomain of TSHR, viz. near the C-terminus of the extracellular domain. This peptide,
named p10 in their study, acts like an intramolecular agonist (Brüser et al., 2016). Upon binding of the
agonist, this peptide undergoes isomerization to induce structural changes in the transmembrane domains
of TSHR (Brüser et al., 2016). These changes initiate G-protein activation (Brüser et al., 2016). It was also
found that inactivating mutations in this conserved sequence inhibits receptor activation (Brüser et al.,
2016).
To bring the focus back to actual resolved crystal structures, most of the work has been done on
FSHR, and with the help of homology modeling, attempts have been made to design parts of the TSHR.
The actual crystal structures that exist for the TSHR are for the truncated ectodomain (TSHR1-260) in
complex with an auto-antibody (Sanders et al., 2007). The first structure was of TSHR (1-260) bound to a

21
human monoclonal stimulating autoantibody M22 with a resolution of 2.55 Å (PDB 3G04) (Sanders et al.,
2007). In this study by Sanders et al, it was seen that the M22 autoantibody binds to the concave surface of
the TSHR at 90° to the tube axis in the LRR. This interaction involves ionic, polar and hydrophobic forces
and with no movement in the atoms of the bound M22 (Sanders et al., 2007). This binding characteristic
was found to be similar to that of the TSH (Sanders et al., 2007). Sanders et al also showed that the TSHR
with a bound M22 exists as a monomer and not as a dimer as was predicted based on studies on the FSHR
(Sanders et al., 2007). The second structure was that of a TSHR (1-260) bound to a blocking human
monoclonal autoantibody, K1-70, with a resolution of 1.9 Å (PDB 2XWT) (Sanders et al., 2011). Here, the
authors showed that this blocking-type antibody bound to the concave surface of the TSHR LRRD with an
angle of 155° to the LRRD tube axis, opposite as seen for the M22. The binding region was found to be
closer to the N-terminus of the TSHR which might explain the function-blocking property of this antibody
(Sanders et al., 2011).

22
1.6 TSHR oligomerization
The presence of TSHR oligomers as dimers or higher order structures was first shown using
immunoprecipitation with antibodies recognizing different portions of the ectodomain (Graves et al., 1996).
With the help of FRET, Graves et al were able to show that TSHR, tagged with RFP or YFP and expressed
in CHO cells, are present in close proximity. Co-immunoprecipitation of GFP and Myc tagged TSHR
constructs revealed that the TSHR organizes itself into dimers or higher order structures (Latif et al., 2001).
To understand the influence of oligomers on TSH binding, the authors carried out FRET experiments in
CHO cells and showed that the TSHR exists as dimers, or possibly higher order oligomers in the basal
condition (referred to as the closed confirmation) and that TSH binding leads to dissociation of this
oligomeric state (as seen by a decrease in FRET) (Latif et al., 2002). Urizar et al also showed a negative co-
cooperativity of ligand binding but rather suggested that ligand binding does not affect dimer-state of the
TSHR, thus concluding that the TSHR dimer functions as one single functional unit (Urizar et al., 2005a),
a finding which contradicted the earlier study mentioned above (Latif et al., 2002). Nonetheless, several
studies have been conducted to determine the domains responsible for oligomerization. Opposing results
have been published, with one study showing that the highly conserved tyrosine residue in the ectodomain
is mainly responsible for oligomer formation (based on mutation experiments) (Latif et al., 2010) and
another one claiming that the ectodomain as such plays no role in oligomerization (Urizar et al., 2005b).
However studies carried out on the conserved tyrosine residue in the FSHR have shown that it does not
influence dimerization at least in the FSHR (Guan et al., 2010). The recent study involving the crystal
structure of the FSH/FSH trimer complements this finding (Jiang et al., 2012). As to comment on the
increasing work related to TSHR and in general GPCR oligomerization, it can be said that deeper aspects
need to be studied, for instance the effect of oligomerization in hormone binding and any related mutants
connected to the same.
Oligomerization studies also shed some light of the mechanism of the TSHR oligomerization and a
heterozygous loss-of-function TSHR mutation (Calebiro et al., 2005). It was shown that TSHR
oligomerization occurs in the endoplasmic reticulum and that presence of the mutant TSHR with the wild-
type TSHR results in the entrapment of the same in the ER (Calebiro et al., 2005). This negatively affects
the maturation of the receptor thus providing an explanation to the cell’s partial unresponsiveness to TSH
stimulation (Calebiro et al., 2005).

23
1.7 TSHR signaling
One of the most important effect of GPCRs is mediated by the activation of heterotrimeric G-proteins
(marked as exchange of GDP for GTP) which leads to production of secondary messengers and further
downstream signaling (Pierce et al., 2002). Likewise, binding of TSH to the TSHR leads to production of
cAMP at the cell membrane which then diffuses through the cytosol to activate protein kinase A (PKA) I
and II isoforms (Feliciello et al., 2000). These PKA isoforms mediate different effects, with the PKA I
isoform being more associated with iodine uptake and acting at a posttranscriptional level and PKA II
positively affecting gene transcription and proliferation (Calebiro et al., 2006; Feliciello et al., 1996). TSH-
dependent activation of TSHR has been associated with CREB phosphorylation and transcription of cAMP-
induced genes (Porcellini et al., 2003).
With regards to signaling, it has been found that the TSHR shows a kind of promiscuity as it can
activate all four classes of G-proteins. It was shown that TSHR can activate not only Gαs and Gq/11 (Allgeier
et al., 1994) but also Gi, Go, G11, G12, and G13 (Laugwitz et al., 1996). Allgeier et al, in 1994, showed the
incorporation of photoreactive GTP analogue into immunoprecipitates of all G-proteins as a result of
binding of TSH and a TSHR-stimulating antibody (Allgeier et al., 1994) and the opposite for a TSHR-
blocking antibody (Laugwitz et al., 1996).
As was postulated that the TSHR might also be involved in MAPK signaling (Laugwitz et al., 1996),
it was shown in follicular carcinoma cells and primary human non-neoplastic human thyrocytes that TSH
stimulation led to a cAMP-independent activation of MAPK (Buch et al., 2008). This activation is
independent of Gs, Gi/o, Gq/11, G12, but showed for the first time, in the case of the TSHR, that it is G13
dependent (Buch et al., 2008).
The importance of Gq/G11 activation in regulating thyroid function was highlighted by the use of
mice lacking the alpha subunit of Gq and G11 in their thyrocytes (Kero et al., 2007). In the study by Kero et
al, these mice showed a reduced iodine uptake and synthesis leading to hypothyroidism. Proliferation of the
thyroid as a result of TSH stimulation was also lacking in such mice, implying a role of the Gq/G11 pathway
in the growth of the thyroid gland (Kero et al., 2007). This study also suggested that Gq/G11 pathway can be
a target for interfering abnormal thyroid function (Kero et al., 2007). Recently discovered alterations in the
TSHR gene from patients suffering from nonautoimmune hyperthyrotropinemia were found to adversely
affect Gs and Gq/11 signaling (Calebiro et al., 2012), further supporting an important role for Gq/11 signaling.
Besides the activation of the cAMP pathway, TSH dependent activation of the phospholipase C
pathway as marked by an increase in inositol 1, 4, 5, -phosphate has also been documented in human thyroid
cells (Van Sande et al., 2006). The activation of PLC pathway was not observed by using thyroid-stimulating

24
antibodies, which might imply a possible importance of this pathway in disease conditions (Van Sande et
al., 2006). In summary, there exists a dual role of TSH stimulation: production of cAMP which leads to
iodination, secretion of thyroid hormone, cell differentiation and proliferation and the IP3 pathway which
leads to thyroglobulin synthesis (Van Sande et al., 2006).

25
1.8 TSHR desensitization
For the TSHR, very early studies have shown homologous desensitization, a phenomenon in which
cells exposed to prior agonist stimulation show a decreased cAMP response on re-stimulation (Nagayama
and Rapoport, 1992). It was shown that there is a 30-70% decrease in cAMP response when re-stimulated
with TSH, connected to a decreased Gs coupling, excluding non-functional Gs proteins and adenylyl
cyclases (Rapoport and Adams, 1976; Shuman et al., 1976). This work was mainly carried out on human
thyroid slices as experiments in CHO with a stable expression of TSHR gave negative results (Nagayama
and Rapoport, 1992; Rapoport and Adams, 1976; Shuman et al., 1976).
Homologous desensitization for the TSHR outside its natural context was shown for the first time
in HEK293 cells (Nagayama et al., 1994). In this study, prior stimulation of TSH led to a decreased cAMP
responsive on the second stimulation thus clearing the doubt that TSHR homologous desensitization is
exclusive to thyroid cells (Nagayama et al., 1994). Taking the β-adrenergic receptor (2-AR) as the then
standard for GPCR desensitization studies, it was also shown that only the TSHR occupied with TSH
undergoes homologous desensitization (by using chimeras of TSHR) however unlike the 2-AR, the
intracellular domain just before the C-terminus is dispensable (Nagayama et al., 1994).
The next steps in studying TSHR desensitization involved identification of the molecular
mechanism. It was already shown for the adrenergic receptors that the G-protein coupled receptor kinases
(GRK5) and the β-arrestins are involved in desensitization (Freedman et al., 1995). It was discovered that a
well differentiated rat thyroid cell line (Fischer rat thyroid cell line abbreviated as FRTL-5) has endogenous
expression of GRK5. Studies were then carried out using this cell line, and it was shown that the
overexpression of GRK5 lead to a decreased TSH-induced cAMP response and an increased TSHR
desensitization, whereas down regulating the endogenous GRK5 lead to the opposite effect (Nagayama et
al., 1996a). It was found that GRK5 and GRK6 have an effect on receptor desensitization, however GRK5
seemed to be a bigger player in the same (shown by using the real-time PCR) (Nagayama et al., 1996a).
Closely after this finding, it was reported that FRTL-5 cells also express GRK2 (shown by Northern and
Western blot approach) (Iacovelli et al., 1996). In this same work it was also shown that the GRK2 and β-
arrestin1 play an important role in regulating TSH induced cAMP response (Iacovelli et al., 1996). Shortly
afterwards, Nagayama et al, in their 1996 publication, further stressed that they could detect expression of
only GRK5 by Northern blotting. The same authors also showed that in FRTL-5 cells, β-arrestin1 is the
dominant isoform over β-arrestin2. Put together, Nagayama et al showed that GRK5 and β-arrestin1 play
an important role in TSHR desensitization (Nagayama et al., 1996b). This has thus lead to a dispute over
which isoform of GRKs is involved in desensitization.

26
With regards to β-arrestins, further work showed that both isoforms, 1 and 2, seem to play an
important role in TSHR internalization (Voigt et al., 2000). HEK293 cells co-transfected with -arrestin 1
or 2 with TSHR showed a similar interaction of the arrestins with the receptor however an increased
desensitization by β-arrestin2 (Voigt et al., 2000). Voigt et al also found that there is an increased β-arrestin2
expression in toxic thyroid nodules thus providing further evidence to their in vitro studies (Voigt et al.,
2000). This work however opened up the topic of TSHR classification into class A (preference of β-arrestin2
over 1) or B (no preference for any isoform of β-arrestin) (Voigt et al., 2000). The same group later on
showed with co-transfection of β-arrestin1 or 2 and TSHR in HEK293 cells that both the isoforms show a
similar attenuation of TSH-induced cAMP response (Voigt et al., 2000). With the approach of ligand
binding and confocal laser scanning microscopy, Voigt et al further showed that both isoforms are capable
of interacting and internalizing with TSHR, however, β-arrestin2 is faster and stronger. They also could not
detect arrestins in endosomes containing TSHR (Voigt et al., 2000). These findings (preference of β-
arrestin2 over 1, and absence of arrestins in the endosomes containing TSHR) provided evidence for the
classification of TSHR into the class A of GPCRs (Frenzel et al., 2006).

27
1.9 TSHR internalization and trafficking
First studies on TSHR internalization began with the use of rhodamine-labelled TSH in rat FRTL-5
cells and bovine embryo thyroid cells (Avivi et al., 1981). By means of image-intensified microscopy, Avivi
et al, in 1981, were able to observe a diffused-binding of the ligand at the cell surface in cells at 4°C which
aggregated to visible patches once moved to 37°C. Within 15 minutes post incubation at 37°C, most of the
fluorescence signal was from endosomes, suggesting internalization of the ligand with the receptor (Avivi
et al., 1981). Based on a diffused pattern in the cytosol 3 h post simulation, they also suggested that the
ligand probably gets degraded (Avivi et al., 1982).
To understand the molecular mechanisms behind internalization and desensitization, a truncated
form of the human TSHR (deletion from His726 till C-terminus) was used (Haraguchi et al., 1994). When
stably expressed in CHO cells, both forms of TSHR, wild-type and mutant, showed a similar TSH-induced
desensitization and rate of internalization, thus showing that the carboxyl-terminus is dispensable for TSHR
internalization (Haraguchi et al., 1994). Another study (Shi et al., 1995) focused on a highly conserved motif
sequence at the boundary between the seventh transmembrane domain and the proximal region of the C-tail
in GPCRs (Dohlman et al., 1991; Probst et al., 1992). It was already reported that a tyrosine residue located
in this region plays an important role in internalization of the low density lipoprotein receptor (Chen et al.,
1990), insulin (Rajagopalan et al., 1991) and IGF-1 receptors (Hsu et al., 1994). Replacement of this tyrosine
in TSHR with an alanine resulted in a decreased TSH cAMP response and a decreased internalization
without affecting TSH-binding to the receptor (Shi et al., 1995). Unexpectedly, truncation of last 56 amino
acid residues from the C-terminus resulted in an enhanced internalization (Shi et al., 1995). In conclusion,
tyrosine in the conserved sequence motif is required for efficient internalization whereas the remaining part
of the C-tail may influence the internalization of the TSHR (Shi et al., 1995).
A big leap in studying TSHR internalization and trafficking was made with the use of L cells with
a stable expression of TSHR stimulated with labeled TSH and observed by electron and confocal
microscopy (Baratti-Elbaz et al., 1999). It was seen that in L cells the receptor was localized on the cell
surface and in clathrin-coated pits, but not in smooth vesicles facing the cell surface (Baratti-Elbaz et al.,
1999). Endosomes under basal conditions were found to comprise 10% of the receptors from the cell surface
probably hinting at a basal constitutive internalization. Post stimulation, the receptor internalized via
clathrin-coated pits and subsequently the amount of detected endosomes was three-fold of the basal (Baratti-
Elbaz et al., 1999). It was also seen that almost 90% of the receptors recycled back to the cell surface whereas
the majority of the internalized ligand was degraded in lysosomes (Baratti-Elbaz et al., 1999). Similar
experiments in primary human thyroid cells showed comparable endocytosis and distribution as seen in L
cells (Baratti-Elbaz et al., 1999). The use of TSHR/LH chimeras showed that the transmembrane and

28
intracellular domains dictate trafficking (recycling and degradation) and the extracellular domains influence
the internalization rate. This was the first study which showed these differences among such homologous
receptors (Baratti-Elbaz et al., 1999) (see Figure 1.5).
Figure 1.5 Schematic representation of TSHR trafficking: Upon agonist-binding and Gs protein
activation, the TSHR is phosphorylated, and bound by β-arrestin2, undergoes clathrin-dependent
internalization. The internalized receptor is recycled back to the cell surface and the ligand is degraded in
endosomes.
Further studies focused on the molecular mechanisms taking part in TSHR recycling. The TSHR
was shown to contain a TVL (T=threonine, V=valine, L=Leucine) motif at the C-terminal, a motif that is a
binding site for PDZ domain proteins (Nourry et al., 2003). PDZ domain proteins are involved in trafficking
of receptors (Nourry et al., 2003). In this context, it was shown that hScrib (Nakagawa and Huibregtse,
2000), a membrane-associated PDZ protein (Audebert et al., 2004), can bind to the TSHR and play a role
in recycling (Lahuna et al., 2005). As PDZ domain proteins are not single-handedly involved in recycling,
Lahuna et al also showed that two other recycling proteins, βPIX and GIT1 are associated with hScrib and
help in TSHR recycling. βPIX can bind directly to all the four PDZ domains of hScrib (Lahuna et al., 2005).
GIT1 overexpression was found to have no effect on TSHR internalization but contributed to inhibition of

29
recycling (Lahuna et al., 2005). Another protein, ARF6 (a small GTP binding protein) was found to
contribute to trafficking of the 2-AR (Claing et al., 2000) and desensitization of the LH/CG receptor
(Mukherjee et al., 2000) as well as endocytosis of many GPCRs internalized via clathrin-coated pits (Claing
et al., 2000; Houndolo et al., 2005). However in the case of the TSHR, a mutant form of ARF6 negatively
influenced recycling but did not affect the endocytosis (Lahuna et al., 2005). Thus, a very unique pathway
was shown for TSHR recycling, one involving hScrib, βIX, GIT1 and ARF6 (Lahuna et al., 2005).

30
1.10 Intracellular signaling by internalized TSHR
Desensitization and internalization of GPCRs have always been highly interconnected with each
other. Rapid and effective desensitization is brought about through phosphorylation by GRKs and binding
by β-arrestins while internalization of such desensitized receptors occurs at comparatively slower rates
(Lohse, 1993). Hence internalization per se acts more as a way of regulating receptor expression on the cell
surface (Lohse, 1993). Concomitantly there had been a long held dogma that GPCRs, upon ligand
stimulation, signal through cAMP only at the cell surface, while it was known that internalized receptors
can signal via MAPK and β-arrestin in endosomes (Daaka et al., 1998). The finding that endosomes can
also function as sites for G-protein mediated signaling emerged first from the studies using a pheromone-
activated GPCR, the Ste2 receptor, in budding yeast (Slessareva et al., 2006). The authors of this study
showed that Gαs, together with PI3 kinases, produces a Ste2-mediated signal from endosomes (Slessareva
et al., 2006). Early evidences for GPCR-mediated signaling in the context of mammalian systems surfaced
in investigations involving sphingosine 1-phosphate receptor (S1PR) (Müllershausen et al., 2009). In this
study it was shown that FTY720, a S1PR agonist known to elicit Gi-signaling, produces a sustained signal
dependent on the internalization of the receptor. This kind of sustained response was not shown by the
natural agonist, S1P (Müllershausen et al., 2009). In this same study, the authors showed that the receptor
and FTY720 localized to the trans-Golgi network (Müllershausen et al., 2009).
Support for Gs-protein-mediated signaling from GPCRs internalized into intracellular
compartments and/or endosomes became strong with independent investigations on the TSHR (Calebiro et
al., 2009) and the pituitary hormone receptor (PTHR) (Ferrandon et al., 2009). For the TSHR, the authors
generated a transgenic mouse (Calebiro et al., 2009) with ubiquitous expression of the cAMP sensor, Epac1-
camps (Nikolaev et al., 2004) and used isolated thyroid follicles from these mice to monitor cAMP
production and dynamics. Calebiro et al demonstrated that after transient stimulation with TSH, the TSHR
is able to sustain cAMP production. In this study it was also shown that TSHR undergoes heavy
internalization together with its ligand. When internalization was prevented by the use of inhibitors like
dynasore (Macia et al., 2006), the sustained signaling was abolished, thus providing evidence that
internalized ligand-receptor complexes are responsible for this intracellular signaling (Calebiro et al., 2009).
This prolonged Gs-protein-dependent signaling mediated by the production of cAMP was termed then as
persistent signaling (Calebiro et al., 2009) (see Figure 1.6a). The possibility did arise that this observed
persistent signaling is because of the fast TSH dissociation from the receptor (Boutin et al., 2011). A follow-
up investigation by Calebiro et al showed that TSH dissociation from the receptor at the plasma membrane
is faster than the persistent signaling shown by the internalized receptor (Werthmann et al., 2012). The same
study showed that TSHR does not show persistent signaling when expressed in human embryonic kidney

31
(HEK) cells, thus hinting to the notion that persistent signaling is specific to certain cell types only and
maybe experiments in a simple cell line like HEK cells cannot be the litmus test for such an investigation
(Werthmann et al., 2012) (see Figure 1.6b). Functionally, intracellular receptor signaling was shown to
positively affect VASP (Vasodilator-stimulated phosphoprotein, a PKA substrate) phosphorylation and
actin depolymerization, while the inhibition of internalization in the presence of dynasore had negative
effects on the above (Calebiro et al., 2009). Using an immunofluoroscence approach, Calebiro et al, in 2009,
not only showed that there is a pre-existent intracellular pool of Gs proteins at the Golgi but also that
internalized ligand, Gs proteins and adenylyl cyclases are present in a perinuclear compartment. Besides the
discovery of intracellular cAMP signaling by internalized TSHR in a well preserved and highly
physiological model of intact thyroid follicles, the visualization of the internalized receptor/ligand complex,
Gs proteins and adenylyl cyclases (in particular type III) in a perinuclear region (Calebiro et al., 2009)
formed the rationale for studying this compartment in detail (see Figure 1.6c).
Figure 1.6 Persistent signaling of TSHR: (a)
Primary mouse thyroid follicles isolated from the
transgenic mouse expressing the cAMP FRET
sensor, Epac1-camps, and transiently stimulated
with bovine TSH showed persistent cAMP signaling
(Calebiro et al., 2009). (b) Comparison of the same
experiment in HEK293 cells did not reveal such
persistent signaling hinting (Werthmann et al., 2012)
to the possibility that such a form of intracellular
signaling is cell-type specific (Calebiro et al., 2009;
Werthmann et al., 2012). (c) Shown below is a
schematic representation of persistent signaling
characterized by specific outcomes for example actin
depolymerization in the case of thyroid cells.

32
Independent investigations on the parathyroid hormone receptor (PTHR) showed that, when
expressed in HEK cells and stimulated with PTH1-34, the receptor internalizes together with the ligand into
endosomes and displays persistent signaling (Ferrandon et al., 2009). Ferrandon et al were able to visualize
the receptor, ligand and Gs proteins in early endosomes thus proposing early endosomes as the sites for this
sustained signaling (Ferrandon et al., 2009). With regards to control over this endosomal signaling, it was
thought that over-expressing arrestins might and/or should be actually terminating signaling from
endosomes, but this was not the case (Feinstein et al., 2011). To explain this, it was proposed that arrestin
is actually mediating a G-protein independent signaling by associating with a MAPK on the endosomal
membrane thus attenuating PDE activity (Feinstein et al., 2011). This meant that the observed sustained
signaling is a result of decrease in cAMP degradation rather than cAMP production (Feinstein et al., 2011).
Further investigations by the same group gave evidence that the observed sustained signaling is in fact a
result of cAMP production and that the receptor (bound to β-arrestin), ligand, and the heterotrimer of G-
proteins is localized, stabilized and enabling signaling at the endosome (Feinstein et al., 2013; Wehbi et al.,
2013). Thus they proposed a signaling complex most probably localized to the early endosome (Feinstein
et al., 2013; Wehbi et al., 2013).
Investigations into the D1 dopamine receptor (D1R) revealed that the receptor, ligand, G proteins
and adenylyl cyclases are closely associated in the same compartment post endocytosis (Kotowski et al.,
2011). Furthermore, after an acute agonist simulation, cAMP accumulation was observed which was
comparable to the duration of receptor endocytosis (Kotowski et al., 2011). This gave a clue that endosomes
can also be the site for acute G-protein mediated signaling (Kotowski et al., 2011). More direct evidence
into the acute signaling from endosomes was given by investigations of the 2-AR in HEK cells and also in
primary cells (Irannejad et al., 2013). Irannejad et al took advantage of small nanobodies to elucidate the
conformation of receptor (Rasmussen et al., 2011; Steyaert and Kobilka, 2011) and G-proteins (Westfield
et al., 2011) in living cells (Irannejad et al., 2013). Camelids, llamas and dromedaries possess a special class
of functional antibodies that do not contain the light chain (Hamers-Casterman et al., 1993). Nanobodies are
genetically engineered small-size antibodies which retain the antigen-binding domain of such an antibody
but are 25% of a Fab fragment. Such nanobodies are generated by immunizing a llama against the desired
target protein and the resulting single-chain library of nanobodies is then screened for appropriate binding
and specificity. Nanobody Nb80 was one such example where it mimicked G-protein after binding to 2-
AR (Rasmussen et al., 2011). In similar way, Nb35 and Nb37 nanobodies were created, both of which
recognize the active conformation of Gs (Westfield et al., 2011). Nb35 was found to bind at the interface
between Gαs-Ras and Gβγ but not directly to the alpha helical (AH) domain, while the Nb37 nanobody was
found to bind directly to the AH domain (Westfield et al., 2011). Consequently, Nb37 was then used to
decipher the structure of 2-AR in complex with Gs proteins (Rasmussen et al., 2011; Westfield et al.,

33
2011). With the help of conformation selective nanobodies against 2-AR (i.e. Nb80) and nucleotide-free
Gαs (Nb37), Irannejad et al were able to show receptor activation on the cell surface and as distinct but acute
phases in early endosomes (Irannejad et al., 2013) (see Figure 1.7) Irannejad et al were able to transiently
express Nb37 in HEK293 cells which under basal conditions showed a cytoplasmic distribution. Under
stimulation with isoprenaline, Nb37 translocated to the cell surface, the first site of G-protein activation and
also then to early endosomes containing internalized ligand/receptor complexes (Irannejad et al., 2013). The
translocation to early endosomes was of a rapid transient manner giving a hint that G-protein activation at
early endosomes is temporally and spatially dynamic (Irannejad et al., 2013) giving the rise to the possibility
that maybe only a certain locations of the early endosomal compartment are taking part in G-protein
mediated signaling at a given time. These direct observations (Irannejad et al., 2013) coupled with earlier
investigations provide strong evidence that GPCR-G-protein mediated signaling occurs in at least two
waves: at the cell surface, and once internalized, in early endosomes (Lohse and Calebiro, 2013).
Figure 1.7 Proposed two waves of GPCR signaling: Schematic representation of the currently known
biphasic cAMP signaling as deduced from β2-adrenergic receptor 2 (β2-AR) (Irannejad et al., 2013). The
first phase occurs at the plasma membrane when the ligand, isoproterenol (Iso), binds to the receptor. The
ligand/receptor complexes do not signal during internalization and in the early stages due to presence of
the clathrin coat. Following the uncoating of clathrin from early endosomes, the second cAMP signaling
occurs at early endosomes.

34
Since then, the phenomenon of persistent signaling has been extended to other receptors like the
glucagon-like peptide-1 receptor (Kuna et al., 2013), the pituitary adenylate cyclase 1 receptor (Merriam et
al., 2013) and most recently and importantly for the LH receptor (Lyga et al., 2016) (because, like the
TSHR, it also belongs to the same family of glycoprotein hormone receptors). For the LH receptors, the
investigators used a highly physiological model, i.e. the ovarian follicles (Lyga et al., 2016) isolated from
Epac1-camps transgenic mice to monitor cAMP dynamics (Calebiro et al., 2009) in the different cell layers.
Similar to the TSHR, the authors (Lyga et al., 2016) found that LH stimulation leads to two phases of cAMP
production and the use of internalization inhibitors like dynasore abolishes the second phase which is
presumably originating from internalized receptors. As a functional consequence, they were able to show
that inhibiting internalization also partially attenuates meiosis resumption (Lyga et al., 2016). More
importantly, not only did they show that cAMP produced as a result of internalized LH receptors traverses
to the oocyte but also that this signaling is physiologically relevant on a broader scale as it brings about
meiosis resumption (Lyga et al., 2016).

35
1.11 Why do we hypothesize that the Golgi/TGN is a signaling platform for
internalized TSH/TSHR complexes?
Coming back to the TSHR, as mentioned before, previous work from our lab showed that Gs proteins
are not present in early endosomes in primary mouse thyroid cells but a considerable fraction is present in
the Golgi compartment (Calebiro et al., 2009). Work on S1PR (Müllershausen et al., 2009) and the
somatostatin receptor type 2 (Csaba et al., 2007; Csaba et al., 2012) had also hinted at Golgi/TGN
involvement in their trafficking.
The Golgi is composed of flat discs or cisternae that are arranged in stacks and these stacks are divided into
three parts viz. cis, medial and trans (Ladinsky et al., 1999). The cis faces the endoplasmic reticulum (ER)
followed by the medial and the trans side which is continuous with a more tubular, branching network called
as the trans-Golgi network (TGN) (Klumperman, 2011) (see Figure 1.8). The stacks are arranged in such a
way that newly synthesized proteins at the rough ER enter the Golgi stack from the cis side and exit from
the trans side and then pass through the TGN to get sorted to their appropriate locations (De Matteis and
Luini, 2008). The TGN also appears to be more dynamic in time and space being more spread around the
nucleus (De Matteis and Luini, 2008). Traditionally, the TGN has been studied and viewed more as a
platform for protein sorting of newly synthesized proteins (Guo et al., 2014) and its emerging role as a vital
platform for retrograde transport is now gathering attention.
Figure 1.8 A simplified Golgi apparatus: Schematic representation of the Golgi apparatus consisting of
the cis, medial and trans faces followed by the more extensive trans-Golgi network (TGN).

36
Retrograde transport or sorting applies to those proteins that exit the endocytic pathway and enter
the secretory pathway at the TGN (Johannes and Goud, 1998; Johannes and Popoff, 2008; Maxfield and
McGraw, 2004). In mammals, the most studied example of retrograde transport is that of mannose-6-
receptors (M6PRs) (Ghosh et al., 2003), which is a type-I integral membrane protein. These receptors sort
acid hydrolases to lysosomes in mammals. Newly synthesized acid hydrolases precursors coupled to the
receptor leave the TGN and fuse with the early/late endosomes where they bring about acidic pH
environment (Ghosh et al., 2003). This acidic pH leads to the release of precursors from the receptors
followed by transport of these precursors to the lysosome for degradation (Slessareva et al., 2006).
Conversely, the receptors are then sent to the TGN for another round of packaging and sorting (Ghosh et
al., 2003). The importance of retrograde transport has also been shown to be of pivotal importance, for
example, in the maintenance of gradients of Wnt family morphogens (Eaton, 2008) and has also been
implicated in the sorting of cargoes to establish a “polarized” effect on the cell (Johannes and Popoff, 2008;
Wang et al., 2004). In the case of plasma membrane proteins, it was shown that the glucose transporter,
GLUT4, translocates to a perinuclear compartment which is enriched in (t)-soluble N-ethylmaleimide-
sensitive factor attachment protein receptors (SNAREs) Syntaxin 6 and 16, but not TGN38 (Shewan et al.,
2003). It was also shown that an acidic targeting sequence in the C-terminus of GLUT4 is responsible for
this translocation (Shewan et al., 2003).
Early evidence for the retrograde trafficking of GPCRs via the TGN surfaced for the somatostatin
receptor type 2 (sst2) (Csaba et al., 2007; Csaba et al., 2012). While it was known at that time that
internalized GPCRs in the brain, for example the muscarinic Ach receptor m2, internalize via early
endosomes and then recycle back via the recycling pathway (involving early and recycling endosomes) or
are degraded (which involves the late endosomes and lysosomes) (Bernard et al., 2006; Bloch et al., 1999),
Csaba et al showed that after in vivo agonist stimulation in the hippocampus, the sst2 receptor internalized
and was found to be localized mainly in the TGN enriched in TGN38 and syntaxin6. They did not observe
any receptor in the multi-vesicular bodies/late endosomes (organelles which typically seal the degradative
fate of their cargo). Thus they were able to demonstrate the retrograde pathway for the sst2 as a
bypass/alternative route to the endocytic recycling pathway (Csaba and Dournaud, 2007; Csaba et al., 2007;
Csaba et al., 2012), an alternative that had also been shown for other proteins such as Shiga Toxin (Mallard
et al., 1998). Csaba et al also showed this translocation after internalization (which is mediated by the actin
cytoskeleton) is microtubule dependent as treatment with colchicine (a microtubule destabilizing drug)
abolished the accumulation in the TGN leading to a possible entrapment of the internalized receptors in
immobilized endosomes. The rate of recycling was also apparently found to be much slower than that of
endocytosis and it was hypothesized that this might be because of the molecular machinery involving
chaperones that are needed for recycling are rate-limiting or that prolonged/purposeful accumulation in the

37
TGN might have other physiological functional consequences (for example, implications in epilepsy)
(Csaba et al., 2007; Csaba et al., 2012).
As mentioned in section 1.10 regarding the intracellular signaling of internalized GPCRs, initial
evidence that GPCR retrograde trafficking through the TGN has functional impact on receptor-mediated
signaling was shown for the S1PR (Müllershausen et al., 2009). It was shown that post stimulation with
FTY20P, the S1PR colocalized with Golgi matrix (GM130) and TGN (p230) markers in Human Umbilical
Vein Endothelial Cells (HUVECs) and showed negligible colocalisation with markers for early/late
endosomes or lysosomes (Müllershausen et al., 2009). It was also suggested that this retrograde trafficking
is mediated by a distinct conformation assumed by the receptor when bound to FTY720P. As a consequence
of accumulation in the TGN, it was also proposed that this might be the reason why newly synthesized
receptors do not sort to the plasma membrane as they meet the trapped FTY720P pool in the Golgi and
remain there in the active conformation (Müllershausen et al., 2009). It was also shown for the somatostatin
receptor 2A that upon activation with somatostatin 14, it internalizes and reaches the Golgi and is recycled
back to the cell surface (Zhao et al., 2013). Cheng et al have also showed that the G-protein coupled estrogen
receptor (GPER) internalizes via clathrin coated pits and traffics via early recycling endosome, but instead
of ending up back at the cell surface, they accumulate in the TGN where they are then sorted to lysosomal
degradation(Figure 1.9). (Cheng et al., 2011a; Cheng et al., 2011b). Thus, considerable evidence exists that
show GPCRs leave the endocytic pathway and enter the retrograde pathway to be sorted later via the TGN.
Figure 1.9 Schematic representation of GPER internalization and trafficking: (Cheng et al., 2011a;
Cheng et al., 2011b).

38
An important player in retrograde transport is the retromer which is defined as a protein complex in
the form of a coat that envelopes the cargo destined to retrograde sorting (Seaman, 2004; Seaman, 2005)
(Figure 1.10). In mammals, the retromer consists of sorting nexins dimer (composed of sorting nexins 1, 2,
5 and 6 in different combinations) and a trimer of Vps26, Vps29, and Vps35 (Collins, 2008; Collins et al.,
2008). The Vps trimer binds to the cytoplasmic side of cargo proteins with Vps35 serving as a scaffold for
Vps26 and Vps29 (Collins, 2008). Considering this role of the retromer complex in guiding retrograde
trafficking and previous investigations which showed that interaction with the retromer actually terminated
intracellular signaling of the PTHR (Feinstein et al., 2011), it was interesting to see whether this is also the
situation in the case of TSHR in primary thyroid cells.
Figure 1.10 Role of the retromer: A simplified schematic representation of retrograde transport involving
the retromer complex.

39
2 Aim and Strategy
2.1 Aim
As far as the TSHR is concerned, the only study which hinted to look at the signaling compartment
of internalized TSH/TSHR complexes (Calebiro et al., 2009) provided rationale for my work. The nature
of the compartment where the internalized TSH/TSHR complexes, Gs proteins and adenylyl cyclases meet
or are present was insufficiently characterized. Hence the main aims of this work were as follows:
1) How do the TSHR and TSH internalize and in which compartment do they end up?
2) How long do the receptor and ligand stay together?
3) Does Gs internalize together with the ligand/receptor complexes or meet them in an intracellular
compartment?
4) Which compartment is responsible for the signaling by internalized TSH/TSHR complexes?
4) What is the real nature of such an intracellular signaling compartment with regards to the dynamic
behavior?
5) What is the importance of this compartment regarding downstream signaling of the receptor
regarding cAMP and PKA signaling, CREB phosphorylation and gene transcription?

40
2.2 Strategy
As a first step to address the above questions, I used fluorescently tagged target proteins expressed
in living cells. This approach excludes the artefacts/non-specificity that may arise in immunofluoroscence.
Also, the use of fluorescently tagged proteins and live cell imaging allows one to visualize trafficking and
dynamic events in real-time.
To gain more insight into the dynamics, I decided to use high resolution live-cell imaging
techniques like total internal reflection fluorescence (TIRF) (Axelrod, 1981) microscopy and highly inclined
and laminated optical sheet (HILO) microscopy (Tokunaga et al., 2008) (see Figure 2.1). Techniques like
TIRF or HILO offer advantages over point-scanning laser scanning microscopy (LSCM) or spinning disk
confocal microscopy (SDCM). While the axial resolution in LSCM and SDCM is ca. 600 nm, TIRF has an
axial resolution of 100-200 nm (Robert D. Goldman, 2010). Also, even if SDCM and TIRF together already
offer the same high imaging speed at around 30 frames per second (fps), the signal-to-noise ratio, sensitivity
and protection against photobleaching in TIRF is far better than that in SDCM (Robert D. Goldman, 2010).
The practical advantages of TIRF/HILO over SDCM are shown in more detail in section 4.1
Figure 2.1 Comparison between EPI, TIR and HILO: A ray diagram for epifluorescence (EPI), total
internal reflection (TIR) and highly inclined and laminated optical sheet (HILO) microscopy. The incident
beam for HILO has a high inclination so that it is refracted at the point of incidence generating a thin
optical sheet inside the specimen.
41
TIRF microscopy is a technique that takes advantage of the angle of incident beam of light (Axelrod,
1981). When a beam of light passes from a medium with a higher reactive index (RI) to a medium with a
lower one and at an incident angle more than the critical angle, the incident light, instead of undergoing
refraction, undergoes total reflection to enter back into the medium with the higher RI. This “total internal
reflection” generates, to our advantage, a thin evanescent field of illumination at the interface or in the
medium with the lower RI (Axelrod, 1981). This evanescent field of illumination is able to excite the
fluorophores that are near this interface (so typically, fluorophores located on the surface of a cell that is
adjacent/facing the glass coverslip) (Axelrod, 1981). As this field decays exponentially in the z-axis, the
fluorophores beyond the penetration depth are not excited and hence a high signal-to-ratio is obtained
(Axelrod, 1981). This feature of TIRF enables one to visualize single molecules on the cell surface. In
practice, the penetration depth of TIRF is around 100-200 nm (Robert D. Goldman, 2010).
HILO is a technique that was developed as an extension of TIRF so as to increase or shift the
evanescent field to a deeper penetration depth to visualize fluorophores that are not on the cell surface
(Tokunaga et al., 2008). Broadly, it is a technique that is between TIRF and epifluorescence. Technically,
it generates a thin beam of illumination that is so highly inclined by refraction that it passes the specimen
centrally as a thin optical sheet (Tokunaga et al., 2008). This generates a high signal-to-noise ratio which is
comparable to that obtained by TIRF microscopy (Tokunaga et al., 2008). Another advantage of HILO is
that when the beam passes the specimen, the illumination is in the center of the specimen (Tokunaga et al.,
2008). So by changing the penetration depth of the beam, one can visualize the specimen along the z-axis
thus allowing one to perform 3D imaging (Tokunaga et al., 2008). For my purposes here, I have used only
HILO to visualize dynamics inside the cells.
To understand the functional significance of trafficking, I used FRET-based biosensors viz. the
Epac1-camps sensor for cAMP production (Nikolaev et al., 2004) and AKAR2 for PKA signaling (Zhang
et al., 2005). Epac is a guanine nucleotide exchange factor (de Rooij et al., 1998) and consists of a catalytic
and a regulatory domain. It exists in an inactive state when the cAMP levels in the cell are low. When cAMP
is produced, for example as a result of GPCR activation, it binds to the regulatory domain of Epac thus
releasing it from the catalytic domain (Bos, 2003). This model of Epac activation in combination with
fluorescence resonance energy transfer (FRET) (see Figure 2.2a) has been exploited in designing a cAMP
sensor, termed as Epac1-camps (Nikolaev et al., 2004). This sensor consists of the cAMP-binding domain
of Epac1 sandwiched in between the fluorescent proteins CFP and YFP (Nikolaev et al., 2004). When the
sensor is not bound by cAMP, there is energy transfer between CFP and YFP and when the cAMP binds to
the sensor, a conformational change is induced that result in CFP and YFP moving spatially away from each
other (Nikolaev et al., 2004). This results in a decrease in the energy transfer (see Figure 2.2b) and this

42
decrease is inversely related to the increase in cAMP produced as a result of GPCR-mediated activation
(Nikolaev et al., 2004).
Figure 2.2 Principle of FRET: (a) Spectral overlap of excitation (Ex) and emission (Em) wavelengths of
donor and acceptor fluorophores that results in FRET. (b) Schematic representation of the FRET-based
cAMP sensor, Epac1-camps. The sensor consists of CFP and YFP fused to a cAMP-binding domain of
Epac1. In the basal state, i.e. in the absence of cAMP, CFP and YFP are in close proximity to each other
and upon excitation of the donor, CFP, the energy is transferred to the acceptor, YFP resulting in high
FRET. Upon binding of cAMP to the sensor, the distance between CFP and YFP increases resulting in low
FRET. These changes in FRET are used to monitor intracellular changes in cAMP levels.
Our group has developed a transgenic mouse (CAG-Epac1-camps) with ubiquitous expression
(Calebiro et al., 2009) of the Epac1-camps FRET-based cAMP sensor (Nikolaev et al., 2004). The
expression of this sensor has been found to be in all tissues except erythrocytes and hair (Calebiro et al.,
2009). These mice show healthy development and a normal life expectancy as compared to wild type mice
thus implying that the expression of the sensor in most of the cells does not interfere with any physiological
processes (Calebiro et al., 2009). With context to using primary cells, the use of such a transgenic mouse
becomes highly valuable. Since these primary thyroid cells isolated from the transgenic mice express the
cAMP sensor, endogenous GPCR signaling can be monitored by stimulating the cells with natural ligands,
partial agonists, antagonists etc. (Calebiro et al., 2015; Calebiro et al., 2009; Calebiro et al., 2010a; Calebiro
et al., 2010b; Lyga et al., 2016; Maiellaro et al., 2016; Nikolaev et al., 2004).
Thus, with the help of real-time HILO and FRET imaging, this study has tried to characterize the
nature and dynamics of intracellular trafficking and signaling, respectively, of internalized TSH/TSHR
complexes in living primary mouse thyroid cells.

43
3 Materials and Methods
3.1 Materials
1. Mice
1. FVB mice (sensitivity to Friend leukemia virus B strain) (Institute of Pharmacology and
Toxicology)
2. CAG-Epac1-camps transgenic mice (Calebiro et al., 2009) which have a ubiquitous expression
of the FRET-based cAMP sensor, Epac1-camps (Institute of Pharmacology and Toxicology)
2. Immortalized and primary cell lines
1. Human Embryonic Kidney (HEK)-293 AD cells (Institute of Pharmacology and Toxicology)
2. Primary mouse thyroid cells isolated from FVB mice
3. Primary mouse thyroid cells isolated from CAG-Epac1-camps transgenic mice
3. Materials for thyroid follicles isolation
1. Hank’s buffered salt solution (HBSS) (#14025-050 Gibco)
2. Collagenase I (#17100-017 Gibco)
3. Collagenase II (#17101-015 Gibco)
4. Dispase II (#13626900 Roche Diagnostics)
5. Stereomicroscope with LED lamp (Leica Microsystems)
6. Dissection instruments (Fine Science tools)
Broad pointed forceps
Broad curved scissors
Fine straight pointed forceps
Fine curved forceps
Ultrafine scissors
4. Cell culture media and supplements
1. Dulbecco’s modified Eagle’s medium (DMEM)/F-12 without Phenol red (#11039-021 Gibco)
2. Dulbecco’s phosphate buffered saline (DPBS) without Ca2+ and Mg2+ (#14190-094 Gibco)
3. Fetal bovine serum (FBS) (#S0115 Biochrom AG)

44
4. Penicillin/Streptomycin (#P4333 Sigma-Aldrich)
5. Trypsin/EDTA solution (#P10-023100 PAN Biotech)
5. Chemicals/reagents
1. Aprotinin (#10236624001 Roche Diagnostics)
2. Benzonase (#RPN2236 Sigma-Aldrich)
3. Bovine serum albumin, fraction V (BSA) (#A1391 AppliChem)
4. Bovine TSH (#T8931 Sigma-Aldrich)
5. Brefeldin A (BFA) (#B7651 Sigma-Aldrich)
6. cOmplete MINI protease inhibitor cocktail tablets (#04-693-120-001 Roche Diagnostics)
7. DAPI
8. Dimethyl sulfoxide (DMSO) (#A1391 AppliChem)
9. Dynasore (#D7693 Sigma-Aldrich)
10. Forskolin (#1099 Tocris)
11. Leupeptin (#11017101001 Roche Diagnostics)
12. NaCl (#A1149 AppliChem)
13. NaHCO3 (#A3590 AppliChem)
14. phenylmethylsulfonyl fluoride (PMSF) (#P7626 Sigma-Aldrich)
15. Tris (#A2264 AppliChem)
16. Sephadex G-25 normal quality beads (#17-0033-01 GE Healthcare)
Other chemicals and salts were from AppliChem unless mentioned. Aqueous buffers were prepared
in ultrapure water (Barnstead Smart2Pure water purification system, Thermo Scientific). Double
distilled pyrogen-free, mycoplasma-free, endotoxin-free injection grade water (ddH2O) (B. Braun)
was used for molecular cloning.
6. Dyes
1. Alexa Fluor 488 succinimidyl ester (#A20000 Thermo Fischer Scientific)
2. Alexa Fluor 594 succinimidyl ester (#A20004 Thermo Fischer Scientific)
3. Alexa Fluor 647 succinimidyl ester (#A20106 Thermo Fischer Scientific)
7. Primary antibodies
1. Rabbit monoclonal anti-phospho-CREB (#4276 Cell Signaling)

45
2. Mouse anti-tubulin (#T9026 Sigma-Aldrich)
3. Mouse monoclonal anti-PKA RII (#610625 BD Biosciences)
4. Rabbit polyclonal anti-GOLPH4 (#28049 Abcam)
5. Rabbit polyclonal anti-TGN46 (#16059 Abcam)
8. Secondary antibodies
1. Goat anti-mouse horseradish peroxidase conjugate (115-035-003 Jackson ImmunoResearch)
2. Goat anti-rabbit horseradish peroxidase conjugate (111-035-144 Jackson ImmunoResearch)
3. Goat anti-mouse Cy2-conjuaged polyclonal (115-225-062 Jackson ImmunoResearch)
4. Goat anti-rabbit IgG Alexa Fluor 594 conjugate (#A-11037 Thermo Fischer Scientific)
5. Goat anti-rabbit IgG Alexa Fluor 405 conjugate (#A-31556 Thermo Fischer Scientific)
6. Goat anti-mouse IgG Alexa Fluor 488 conjugate (#A-11094 Thermo Fischer Scientific)
7. Goat anti-mouse IgG Alexa Fluor 647 conjugate (#A-21237 Thermo Fischer Scientific)
9. Commercially available kits
1. QIAGEN MIDI plus DNA extraction kit (#12945 QIAGEN)
2. Effectene Transfection Reagent (#301425 QIAGEN)
10. Accessories
1. ECL Prime Western Blotting Detection Reagent (#RPN2236 Amersham, GE Healthcare)
2. Photographic films for western blot detection (#4741008471 FUJI Medical)
3. Electroporation cuvettes (#1652088 Bio-Rad)
4. BCA Protein Assay Kit (#23225 Pierce)
11. Laboratory equipment/apparatus
1. Bio-Rad Gene Pulser II (#1652077 Bio-Rad)
2. Bio-Rad capacitance extender (#1652087 Bio-Rad)
3. NanoDrop 2000 UV-Vis Spectrophotometer (Thermo Fischer Scientific)
46
3.2 Methods
3.2.1 Plasmids
During the course of this work, two plasmid constructs viz. the hTSHR-WT tagged with the
fluorescent protein, tdTomato (pTSHR-td-tomatoN1) or mCherry (pTSHR-mCherry) were
produced. These constructs were tested for receptor functionality using FRET and TIRF imaging.
It was found that both these receptors, while functionally active, had a constitutive internalization
activity and therefore were not used further. The remaining plasmid constructs were already present
in the institute or were obtained under a Material Transfer Agreement (MTA) or as gifts. A plasmid
expressing the human wild-type TSH receptor tagged C-terminally with EYFP (TSHR-EYFP) has
been previously described in terms of expression, functionality etc. (Calebiro et al., 2005). A
plasmid expressing the Gs subunit tagged with YFP (Gs-YFP) has been previously described (Hein
et al., 2006). A plasmid expressing a fragment (37 amino acids) of -2,6-sialyltransferase fused C-
terminally to monomeric RFP (ST-RFP) (Deora et al., 2007) was kindly provided by Ryan Schreiner
from the lab of Enrique Rodriguez-Boulan (Cornell University, New York, NY, USA). A construct
encoding His-tagged Nb37 was kindly provided by Jan Steyaert, (VIB, Brussels, Belgium) and the
plasmid Nb37-EYFP was generated (by Dr. Ulrike Zabel, Institute of Pharmacology and
Toxicology) by fusing EYFP to the C-terminus of Nb37. Plasmids expressing Rab5 tagged with
GFP (Rab5-GFP) and mCherry (Rab5-mCherry) were kindly provided by Emanuele Cocucci (Ohio
State University, Columbus, OH, USA) generated in the lab of Tom Kirchhausen (Harvard Medical
School, Boston, USA). A plasmid expressing YFP-tagged Vsp29 (Vps29-YFP) (Rojas et al., 2008)
was kindly provided by Juan Bonifacino (NICHD, Bethesda, MA, USA). Plasmid Vsp29-mCherry
was generated (by Bianca Klüpfel, Institute of Pharmacology and Toxicology) by replacing YFP
with mCherry in the original construct. A plasmid expressing the AKAR2 sensor (Zhang et al.,
2005) was kindly provided by Jin Zhang (UCSD, San Diego, CA, USA). Circular maps for the
above constructs are provided in the Annex section 9.1. Cloning strategy and sequence data are
available from AG Calebiro.

47
3.2.2 Transformation of chemically competent Escherichia coli cells (TOP10)
Chemically competent Escherichia coli (strain TOP10) were used for the propagation of
plasmids. Briefly, for each plasmid, 20 µl 5x KCM buffer (500 mM KCl, 150 mM CaCl2, 250 mM
MgCl2), 80 µl ddH2O and 0.5 to 1.0 µg plasmid DNA (working concentration 1 g/ml) were mixed
in a 1.5 ml vial. 100 µl competent cells were added to the above mixture followed by incubation on
ice for 20 minutes and then at room temperature (RT) for 10 minutes. This was followed by addition
of 1.0 ml Lysogeny broth (LB) (1% peptone, 0.5% yeast extract. 1% NaCl) and incubation at 37ºC
for 50 minutes with horizontal shaking. 100 µl of the cell suspension was plated onto Nutrient Agar
plates (LB supplemented with 1.5% agar) containing the appropriate antibiotic; ampicillin (final
concentration 0.1 mg/ml) or kanamycin (final concentration 0.04 mg/ml). The plates were incubated
overnight for 14-16 h to obtain isolated colonies. On the next day, a single isolated colony was
picked and used to inoculate cultures for further plasmid extraction.
3.2.3 Plasmid DNA extraction
Plasmid DNA extraction and purification was done by using the Qiagen MIDI plus kit with
some minor changes to the manufacturer’s protocol. The starting material was either isolated
colonies obtained on a nutrient agar plate from the previous day’s bacterial transformation or from
a glycerol stock of transformed bacteria. One isolated colony or a stab from a glycerol stock was
used to inoculate 2 ml LB medium containing the appropriate antibiotic (final concentrations as
mentioned in section 4.2.2). This mini culture was incubated at 37ºC for 8 h at 180 rpm with
horizontal circular shaking. From this mini culture, 50 µl was used to inoculate 50 ml LB containing
the appropriate antibiotic followed by overnight incubation at 37ºC for 14-16 h at 180 rpm with
horizontal circular shaking. On the next day, the bacterial pellet was harvested by centrifugation at
4,000 rpm at 4ºC for 15 minutes. The pellet was resuspended in 4 ml Resuspension buffer P1
containing LyseBlue (mixed to a dilution of 1:1,000) by pipetting or vortexing. This was followed
by addition of 4 ml Lysis buffer P2 and gently mixing the tube by inverting it 4-6 times and a short
incubation at RT for 3 minutes. To the above solution, 4 ml Neutralization buffer S3 was added and
mixed gently by inverting the tube till a colorless solution was obtained. The lysate was centrifuged
at 4,000 rpm (Eppendorf centrifuge) for 5 minutes at RT followed by decanting the lysate into the
QIAfilter cartridge and incubation for 5 minutes. The lysate was filtered into a 15 ml tube followed

48
by addition of 2 ml Binding buffer BB and the solution was mixed gently by inverting 4-6 times.
The lysate was then transferred to a vacuum pump assembly and allowed to run through the column.
The washing was done by centrifugation, first by adding 700 µl wash buffer PE and centrifuging at
10,000 x g for 1 minute and then by adding 700 µl buffer ETR (containing ethanol) and centrifuging
again. After this wash, the column was centrifuged again to remove any residual buffer and the
DNA was eluted by adding 100 µl ddH2O, followed by a short incubation time of 5 minutes at RT,
and collecting the eluted DNA in a sterile 1.5 ml vial by centrifuging the column at 10,000 x g for
1 minute. The concentration and purity of DNA was measured by using the NanoDrop 2000
(Thermo Fischer Scientific), and after adjusting the final concentration to 1 µg/µl, the DNA was
stored at -20ºC.
3.2.4 Preparation of fluorescently labelled TSH
Labeling a GPCR ligand with a fluorophore is a widely used technique as it allows one, for
example, here, to investigate the endogenous receptor trafficking after receptor internalization. In
this study, the thyroid stimulating hormone (TSH), a peptide hormone, was labelled with the
succinimidyl esters of (or NHS ester) Alexa Fluor 488, 594 and 647 fluorescent dyes (Calebiro et
al., 2015; Calebiro et al., 2009). Labelling is achieved by the binding of the ester group of the
fluorescent dye to the primary amino group of the protein. The labelling procedure is divided into
two parts 1) preparing the purification column and 2) purification of TSH-bound dye from the
unbound fraction. All steps were carried out on ice/in a cold room unless indicated.
Purification column: The slurry was prepared by suspending 5 g normal quality Sephadex
G-25 in 50 ml column wash solution (20 mM Tris-HCl, 20 mM NaCl, pH 7.4) allowing the matrix
to swell in size (if required, the slurry can be stored at 4ºC). The glass column was attached to a
vertical stand using clamps followed by cleaning it with distilled water. The column was then filled
up to one-quarter of the height with the column solution followed by adding a part of the prepared
slurry and allowing it to settle into a compact form. Once the slurry was compactly set, the solution
on top was removed using a Pasteur pipette and more slurry was added and allowed to settle. The
same procedure as described above was repeated till the column was packed leaving space for ca. 2
ml of column solution to be added on the top. The column was then washed by passing ca. 100 ml
column solution taking care that the slurry does not run dry. The prepared column was stored at
4ºC.

49
Labelling: Two vials of bovine TSH, each 5 mg, were used to prepare one batch of labelled
ligand. Contents of the two vials were each dissolved in 0.5 ml ice cold Dulbecco’s Phosphate
Buffered Saline (DPBS) and the solution was transferred to a 1.5 ml vial. The vial containing Alexa
Fluor dye was wrapped in aluminum foil so as to protect it from direct light. 50 µl DMSO was then
added to the vial and the dye was dissolved by vortexing and keeping the vial on ice for 20 minutes.
50 µl NaHCO3 (1 M) was added to the dissolved TSH, followed by adding the dissolved dye to the
same. The vial was then sealed with paraffin and aluminum foil. The reaction mixture was incubated
at 4ºC for 90 minutes attached to a head-over-head rotor. The fraction of TSH with bound dye was
separated from the unbound dye by running it through the above prepared column in a cold room at
4ºC. For this, the reaction mixture was added to the top of the column and allowed to run through
the beads. Since the labelled dye has a higher molecular weight than the unbound fraction, the
labelled fraction runs faster and is collected first. This fraction was collected, aliquoted stored at -
20ºC. The degree of labelling was measured by measuring the absorbance at 280 nm and at the
wavelength corresponding to the absorbance maximum of the fluorescence.
3.2.5 Isolation of primary mouse thyroid follicles
Use of primary cells gives one the advantage of investigating endogenously expressed
GPCRs in a highly physiological environment. In the case of TSHR, it had been already shown that
persistent cAMP signaling is a characteristic that quite largely depends on the cell type, with the
observation that persistent cAMP signaling was seen in thyroid follicles isolated from mice and not
in HEK293 cells (Werthmann et al., 2012). This underlined the importance and the necessity of
performing all live-cell imaging in this study in primary mouse thyroid cells obtained from isolated
thyroid follicles. The procedure of isolating thyroid follicles is described below:
Dissection: Mice (either FVB strain or CAG-Epac1-camps transgenic mice) older than 8
weeks were used for isolating thyroid follicles for experiments in live-cell imaging (TIRF and FRET
microscopy). The maximum age till which the mice were used for such experiments was 12 months.
No distinction was made between the genders of the mice for making a single batch of cells. Aseptic
conditions were maintained by carrying out the dissection in designated places and using autoclaved
instruments and ethanol for disinfection of peripheral surroundings. Thyroid lobes obtained from 6
mice were used to seed one 100 mm culture dish.

50
First, the mouse was sacrificed by cervical dislocation. The outer skin was sterilized by
shortly dipping the mouse in a jar containing absolute ethanol. The mouse was then fixed on the
dissecting board by pinning the snout, feet and palms (in this order) so that the mouse lies in a
supine position with the throat arched upwards. A vertical incision was made just below the throat
with the help of a large pair of scissors and broad-pointed forceps and the cut was extended antral
and peripherally to expose the internal organs. This point onwards, all steps were performed under
10x magnification of a stereomicroscope equipped with LED lamp. With the help of sterile fine
forceps, the salivary glands were removed followed by cutting away the muscles covering the
trachea using ultrafine scissors. The trachea was separated from the esophagus by cutting it above
the sternum. The trachea was then lifted and bent upwards to reveal the two thyroid lobes on either
side. Both lobes were removed in intact form with fine curved forceps, briefly washed in sterile
DPBS (by dipping it up and down a couple of times) and transferred to a 1.5 ml vial containing
digestion medium ()DMEM)/F12 medium containing 100 U/ml collagenase I, 100 U/ml collagenase
II and 1U/ml Dispase II). The procedure described above was repeated for the two remaining mice.
The enzymatic digestion was carried out by incubating the vial in a water bath maintained at 37ºC
for 90-105 minutes (till a majority of the tissue had disintegrated) with gentle shaking every 15
minutes to aid digestion. Then, the digestion tissue was transferred using a 2 ml glass pipette to a
sterile 15 ml tube and the digestion was stopped by adding 10 ml complete culture medium
((DMEM)/-F12 supplemented with 20% fetal bovine serum and 1% penicillin and streptomycin)
followed by washing the isolated follicles three times, each time at 100 x g for 3 minutes at RT. The
follicles were then plated in 100 mm culture dishes and maintained at 37ºC, 5% CO2. These seeded
plates were then given fresh medium every 3 days and by day seven most of the follicles had broken
down to individual cells. Plates between 7 and 11 days old were used for transfection and live-cell
imaging.
3.2.6 Transfection of HEK293 AD cells
HEK293 AD cells were maintained at 37ºC and 5% CO2 and in DMEM containing 10%
FCS, 5% penicillin-streptomycin. For transfection, cells were plated on the day before in 6-well
plates (with a density of 250,000 cells/well) containing sterile 24 mm round glass coverslips. On
the next day, the cells were washed gently once with DPBS and supplemented with fresh culture
medium (1.5 ml/well). Following are amounts for one well in a 6-well plate: total DNA amount (0.6

51
µg), buffer EC (83.3 µl), enhancer (8 times the total DNA amount), Effectene (20 times the total
DNA amount). Briefly, for a transfection in a 6-well plate, 500 µl buffer EC was added to a 15 ml
Falcon tube followed by addition of DNA (3.6 µl), followed by enhancer (28.8 µl) and a short gentle
mixing and incubation for 10 minutes at RT. This was followed by addition of Effectene transfection
reagent (72 µl) and incubation for 10 minutes at RT. Complete culture medium was then added to
this DNA master-mix, and after gentle pipetting, the mix was then distributed equally over a 6-well
plate (500 µl each). The cells were incubated as before and imaging was done typically 48 h after
transfection.
3.2.7 Transfection of primary mouse thyroid cells by electroporation
In this study, primary mouse thyroid cells were transected to express mainly intracellular
markers (early endosomes, TGN), nanobody sensors for active Gαs or PKA sensor, AKAR2. From
past trials of transfection, electroporation was evaluated to be the most optimal method giving
around 20% efficiency.
Primary mouse thyroid cells which were 7-11 days old in culture were used for transfection.
Cells older than 12 days produced a considerable amount of autofluorescence. Cells from one 100
mm culture plate were enough to seed six 24 mm round glass coverslips.
All solutions i.e. DPBS, complete culture medium, trypsin were pre-warmed. 24 mm round
glass coverslips (maintained in absolute ethanol at RT) were first washed in a 100 mm plate
containing sterile DPBS, and later on transferred to a 6-well culture plate. 2 ml complete culture
medium was added to each well and the 6-well plate was kept in an incubator till needed.
First, the cells were washed twice in DPBS, each time with 10 ml, followed by incubating
the cells in 2 ml trypsin at 37ºC. The cells were checked for detachment every 3 minutes under a
light microscope followed by gentle tapping. When most of the cells were detached (at ca. 10 min),
trypsinization was stopped by adding 8 ml complete culture medium. The cells were pipetted up
and down once and transferred to a 15 ml tube. The cells were washed by centrifuging at 100 x g at
RT for 3 minutes. The complete culture medium was discarded, and the cell pellet was then washed
twice with DPBS, each time at 100 x g at RT or 3 minutes. After the second wash, the cell pellet
was gently resuspended in 240 µl DPBS. The cell suspension was then equally divided into two 4
mm cuvettes, followed by addition of 40 µl DNA (working concentration 1 µg/µl) to each of the
cuvettes. The mixture was then electroporated using a Bio-Rad Gene Pulser II attached to a Bio-

52
Rad capacitance extender set on 0.32 kV ad 125µF. Following the electric shock, 1 ml warm
complete culture medium was added to the cuvette, followed by gently pipetting it once.
Transfection mix from one cuvette was equally divided into 3 wells of a 6-well plate (as prepared
above). Transfected cells were maintained at 37ºC, 5% CO2 and were used for live-cell imaging 48
h later.
3.2.8 Live-cell imaging
In this study, two types of live-cell imaging were performed, both with different purposes.
The majority of the work involved the visualization of subcellular dynamic events in living cells
which was carried out using HILO microscopy. The other part involving real-time monitoring of
cAMP and PKA kinetics was done by using a simple epifluorescence microscope having a built-in
FRET module.
3.2.8.1 HILO microscopy
For TIRF imaging, primary mouse thyroid cells were electroporated to transiently express
fluorescently tagged proteins, plated on 24 mm round glass coverslips and were used for imaging
48h post transfection. Imaging was carried out at a constant temperature of 37ºC. Briefly, coverslips
plated with transfected cells were assembled in a round steel imaging chamber overlaid with around
300ul complete culture medium and placed on the objective. Live-cell imaging was carried out on
a TIRF microscope (Leica AM TIRF) equipped with a highly inclined thin illumination (HILO), an
EMCCD camera (Cascade 512B from Roper Scientific). A 100x oil-immersion objective (HCX PL
APO 100x/1.46) was used for TIRF and HILO angles combined with a solid-state 488, 594 and 635
laser. A quadruple band filter set was used to achieve minimal delay (1 ms switching time) among
channels. Basal images of cells expressing the transfected proteins of interest were acquired and
their positions were marked with the in-built position marker of the software. This was followed by
stimulation for 10-20 minutes (as indicated) with fluorescently tagged TSH, during which no images
were acquired. Following stimulation, the stage was taken out keeping the chamber position intact
and the cells were rapidly and thoroughly washed with complete culture medium by manual
pipetting. The stage was then placed back on the microscope, previously marked cells were quickly
scanned for efficient internalization of the ligand. An appropriate cell was selected and was used
for acquiring movies. The parameters regarding exposure time (in most cases it was 50-100 ms),

53
EM gain, laser strength, filters used and time interval of acquisition was maintained for basal and
stimulated conditions but were different between experiments involving different fluorophores and
different purposes. Post image acquisition, the cells were fixed in 4% paraformaldehyde and stored
in DPBS for later use in structured-illumination microscopy (SIM).
3.2.8.2 FRET microscopy
Live-cell FRET imaging was used to monitor cAMP kinetics in thyroid cells isolated from
Epac1-camps-CAG transgenic mice (Calebiro et al., 2009) and monitor PKA kinetics in primary
mouse thyroid cells transfected to express the PKA sensor, AKAR2 (Zhang et al., 2005).
For cAMP measurements, 7 days old primary mouse thyroid cells isolated from Epac1-
camps transgenic were plated onto 24 mm round glass coverslips and used 72 h later for FRET
measurements. For PKA measurements, 7 days old primary mouse thyroid isolated from FVB mice
were transfected to express the PKA sensor, AKAR2, and used 48h later. Coverslips were
assembled in an imaging chamber, overlaid with 300 µl FRET-buffer (137 mM NaCl, 5.4 mM KCl,
2 mM CaCl2, 1mM MgCl2, 10 mM HEPES, pH 7.3) and mounted on a Zeiss Axiovert 200 inverted
microscope equipped with a 63x oil immersion objectives (Zeiss plan-NEOFLUAR 63x/1.25), a
505 DCXR beam splitter (Visitron Systems), a high speed polychromator system (Visitron Systems)
and an iXon Ultra EMCCD camera (Andor). The experiments were monitored with MetaFluor 7
software (Molecular Devices). Images were acquired every 5 seconds, ligand/chemicals were added
by manually pipetting. At the end of each measurement, an image was taken with direct YFP
excitation using a 488/30 filter. FRET was calculated as the ration between YFP emission at 535
nm and CFP emission at 480 nm with correction for spillover CFP signal into the YFP channel and
for direct excitation of YFP (Borner et al., 2011). Corrected ratios of FRET traces (calculated in
MS-Excel post acquisition) were then processed further in Prism 6 (GraphPad Software) for
statistical analysis. For measurements using the Epac1-camps sensor, in which FRET values are
inversely related to cAMP levels, the YFP/CFP ratio was inverted to allow direct comparison with
PKA measurements. cAMP and PKA FRET responses were normalized to the maximal response
of either FRET sensor obtained by treating the cells with the direct adenylyl cyclase activator
forskolin (10 µM) at the end of each experiment.

54
3.2.9 Post-acquisition image processing
Images acquired with the TIRF microscope were then further processed in ImageJ
(https://imagej.nih.gov/ij/) /Fiji (https://fiji.sc/) to remove background noise. In experiments
involving fluorescent ligands, a bleaching correction using the Histogram method in ImageJ was
used. Later, on Fast Fourier Transform (FFT) bandpass filter was applied to the images to remove
background noise. For this step, two thresholds were set, the upper limit and the lower limit to
remove background. The upper pixel limit was set to 10 pixels and the lower to 3 pixels. Zoomed
insets were scaled up 5x using the bicubic interpolation function. For quantification of
colocalisation, such filtered images were then further made into a binary mask so as to give a value
of 0 or 1. This mask was then applied for the other channel (the one containing internalized ligand
in vesicles) to see the fraction of colocalisation. For this quantitation, particles were measured with
the ‘Measure Particles’ function of ImageJ. This generated a chart of particles (for example that for
the endosomes marked by the fluorescent ligand) that were or were not in the TGN. Number of
colocalizing particles per frame and total number of particles per frame were thus counted using
simple functions in MS-Excel, and the percentage of colocalisation was plotted against time.
3.2.10 Immunofluoroscence
Transfected or non-transfected cells plated on 24 mm round glass coverslips were washed
three times with DPBS and fixed with 4% paraformaldehyde for 15 minutes at RT. Permeabilization
was carried out by using DPBS supplemented with 0.1% Triton X-100 for 3 minutes at RT. This
was followed by incubation in blocking buffer (DPBS + 5% goat serum) for 1 h at RT and then
overnight incubation with primary antibody (all antibodies against PKA subunits 1:100, anti-
GOLPH4 1:1,000, anti-TGN46 1:1,000 prepared in blocking buffer) at 4ºC and then incubation with
appropriate secondary antibody (Cy2-conjugated goat anti-mouse 1:400 and/or Alexa-594-
conjugated anti-rabbit 1:2,000 dilutions prepared in blocking buffer, Alexa-647-conjugated anti-
mouse with a final concentration of 5 g/ml in blocking buffer) for 2 h at RT. This was followed
by washing three times with DPBS. Nuclei were stained with DAPI. Coverslips were either mounted
in 85% glycerol or stored at 4ºC in DPBS until imaging. Confocal images were acquired on a TCS
SP5 confocal microscope (Leica Microsystems; Wetzlar, Germany) using an oil-immersion
objective (HCX PL APO 63x/1.4).

55
3.2.11 CREB phosphorylation
Primary mouse thyroid cells were used for investigating CREB phosphorylation. Cells
which were in culture for 11 days were plated in 6-wells-format plates on day1. On day2, complete
medium was substituted with starvation medium (complete culture medium sans serum) followed
by a 48 h incubation. On day4, the cells were stimulated with TSH in the presence/absence of
Brefeldin A in the indicated concentrations and for indicated durations. This was followed by cell
lysis and western blot analysis.
3.2.12 Cell lysis
Following stimulation, the cells were washed once with DPBS and then lysed with lysis
buffer (0.125 M Tris-HCl pH 6.8, 5% SDS, supplemented with 0.1 M PMSF, 2 µg/ml Aprotinin,
0.5 mg/ml Leupeptin, cOmplete Mini protease inhibitor cocktail tablet) maintained at 95ºC. The
cells were scraped with a soft rubber scraper and transferred to a 1.5 ml vial. Benzonase (final
concentration 1 U/ml) was added to this cell lysate and this followed by incubation at 4ºC for 1 h
on a horizontal shaker (maintained at 300 rpm). The lysate was then sonicated for 30 seconds and
centrifuged at 20,160 x g at 4ºC for 30 minutes. The supernatant was then transferred to a fresh 1.5
ml vial followed by gel electrophoresis and western blot analysis.
3.2.13 Western blot analysis
Cell lysates were separated on 10% SDS polyacrylamide gels and then transferred to PVDF
membranes. Following transfer, membranes were incubated in blocking buffer (Tris-buffered saline
containing 1% Tween-20, 5% milk) followed by probing with primary antibody, anti-phospho-
CREB (diluted 1:1,000 in blocking buffer) overnight at 4ºC with gentle shaking. On the next day,
after washing with wash buffer (50 mM Tris-HCl pH 7.4, 150 mM NaCl, 0.2% BSA, 0.2% NP-40)
for 30 minutes, the membranes were probed with anti-tubulin (prepared at a dilution of 1:40,000 in
wash buffer) for 1 h at RT followed by brief washing for 30 minutes and then incubation with

56
secondary antibodies i.e. goat anti-mouse or anti-rabbit horseradish peroxidase-conjugated
secondary antibody (prepared at a 1:10,000 dilution in wash buffer) for 1 h at RT. This was followed
by a brief washing for 30 minutes and then by incubation with ECL substrate for one minute.
Detection at various exposure times was captured on photographic films. Films were scanned at
1200 dots per inch (dpi) and densitometry analysis was performed using ImageJ
(https://imagej.nih.gov/ij/).
3.2.14 Statistics
Statistical analyses were performed in Prism 6 software (GraphPad Software). Values are
presented as mean ± S.E.M. Differences between two groups were assessed by two-tailed Student´s
t test (for example for Figure 4.8e). Differences among three or more groups were assessed by one-
way or two-way ANOVA, as appropriate, followed by Bonferroni’s post-hoc test (for example for
Figure 4.10c). Differences between individual time points were assessed using the Holm-Šídák test
for multiple comparisons. Differences were considered significant for P values < 0.05 (for example
for Figures 4.8b, 4.10a, and 4.10b).
Data in Figure 4.10b was fitted using the following set of equations:
𝑌(𝑡) = 𝐴1 (1 − 𝑒𝑡
𝜏1) ; 𝑡 ≤ ∆𝑡2
𝑌(𝑡) = 𝐴1 (1 − 𝑒𝑡
𝜏1) + 𝐴2 (1 − 𝑒𝑡−∆𝑡2
𝜏2 ) ; ∆𝑡2 < 𝑡 < ∆𝑡3
𝑌(𝑡) = 𝐴1 (1 − 𝑒𝑡
𝜏1) + 𝐴2 (1 − 𝑒𝑡−∆𝑡2
𝜏2 ) + 𝐴3 (1 − 𝑒𝑡−∆𝑡3
𝜏3 ) ; 𝑡 ≥ ∆𝑡3
where 𝐴𝑖 is the amplitude of each phase 𝑖 (with 𝑖 = 1, 2, 3) and ∆𝑡𝑖 is the corresponding delay.

57
4 Results
4.1 Spinning disk confocal microscopy is not ideal for imaging mouse thyroid cells
In order to perform live-cell imaging of highly dynamic events such as internalization and trafficking,
SDCM was initially tried as an alternative to a routine LSCM mainly because of the faster imaging speeds
(30 (fps) for SDCM while 1 fps for LSCM), increased sensitivity and lesser photobleaching. HEK293 AD
cells and primary mouse thyroid cells transfected to express YFP-tagged TSHR (TSHR-YFP) were
stimulated with TSH-Alexa594 (TSH-594). While it was possible to monitor TSH/TSHR internalization in
HEK293 AD cells (Figure 4.1 left panels), it was not possible to do so in primary thyroid cells (Figure 4.1
right panels). The main possible reason for this can be attributed to the fact that primary mouse thyroid
cells tend to spread in culture and hence are just 1 m thick (Calebiro et al., 2009). Because of this extreme
thinness of the cells it was not possible to make optical sections using a confocal microscope and hence the
signal of internalized receptors and/or ligands was not discernible over the strong background. Also, as
compared to previous results using TIRF microscopy (Calebiro 2009), it was not possible to observe the
internalized ligand, if any, in tubular structures. For this reason, it was decided that TIRF/HILO would be a
better alternative to the SDCM.
Figure 4.1 Confocal microscopy is not ideal for live-cell
imaging of primary mouse thyroid cells: HEK293 AD
and primary mouse thyroid cells were transfected with
YFP-tagged TSHR (TSHR-YFP) and stimulated with TSH
labelled with Alexa Fluor 594 (TSH-594) for 20 minutes.
Shown are merged basal and stimulated images of both
cell types using spinning disk confocal microscopy. Scale
bar 10µm. Data are representative of 3 independent
trials.

58
4.2 Visualization of Alexa Fluor labelled TSH using TIRF microscopy
Once it was decided to use TIRF microscopy for primary mouse thyroid cells, the first step was to
reproduce the previous observation of internalized fluorescently labelled TSH in thyroid cells.
To directly visualize internalized TSH (and thus indirectly, TSH/TSHR complexes), TSH labelled
with fluorescent Alexa Fluor 594 and 647 dyes was used. Primary mouse thyroid cells were stimulated with
TSH labelled with Alexa Fluor 594 (TSH-594) or 647 (TSH-647) (6 µg/ml for TSH labelled with 594 dye
and 12 µg/ml for TSH labelled with 647 dye) and, following washout, were imaged using TIRF and HILO
penetration depth. Figure 4.2a shows visualization of TSH-647 in TIRF and HILO to differentiate between
real signals of internalized ligand and surface bound ligand and/or background. While surface-bound ligand
signal appeared diffused, internalized ligand in endosomes appeared as bright spots in HILO images (Figure
4.2a). On a closer look, primary thyroid cells stimulated with TSH-594 showed internalized TSH-594 in a
perinuclear area in tubular structures (Figure 4.2b, arrows). TSH-594 bound to the cell surface was also
observed (Figure 4.2b, arrowheads).
Figure 4.2 Visualization of fluorescently labelled
TSH in TIRF and HILO: (a) Primary mouse
thyroid cells were stimulated with TSH labelled with
either (a) Alexa Fluor 647 (TSH-647) or (b) 594
(TSH-594) for 20 minutes followed by washout.
Difference of signal between HILO and TIRF
penetration depth gives a clear idea that the signal
in HILO originates from the cell interior and not
from the cell surface or from non-specific
background. (b) HILO channel showing TSH-594
bound to the plasma membrane (arrowheads in
whole image and zoomed inset) and internalized
TSH-594 present in tubular vesicular structures in
the perinuclear area (arrows in inset). Scale bar 10 µm. Data in a and b are representative of 3 independent
trials.

59
4.3 Visualization of internalized TSHR-YFP and fluorescently labelled TSH
After confirming that internalized fluorescently labelled TSH can be visualized using HILO, the next
step I tried was to visualize internalization as well as trafficking of TSHR-YFP upon TSH stimulation. The
construct, TSHR-YFP, has been validated before in terms of expression, functionality and internalization
post-stimulation (Calebiro et al., 2005). Primary mouse thyroid cells were electroporated to express TSHR-
YFP and stimulated with TSH-594 for 20 minutes followed by washout. The imaging was carried out
continuously and thus included basal, stimulation, and after washout phase. Shown are the basal and
stimulated images at 30th minute post-washout (Figure 4.3). As can be seen, there is quite some background
noise and unevenness in the channel for TSHR-YFP in the basal as well as in stimulated images. This can
be due to uneven illumination in HILO. The background noise can also be due to the expression of newly
synthesized TSHR in the endoplasmic reticulum (ER) en route to the cell surface (Figure 4.3). Nonetheless,
internalized TSHR and TSH can be seen in vesicles. Also, it can be seen that the receptor and ligand remain
in the same compartment for the larger part after being internalized together i.e. at least for 40 minutes post
washout (Figure 4.3).
Figure 4.3 TSHR and TSH co-internalize
and stay together: Primary mouse thyroid
cells were electroporated to express TSHR-
YFP, (green) and stimulated with TSH-594
(magenta) for 20 minutes followed by
washout and further imaging for next 40
minutes. Shown are the basal and
stimulated image at 30th minute after
washout. White indicates colocalisation. Scale bar 10 µm. Data is representative of 3 independent trials.
Since technically it was not always possible to use an overexpressed fluorescent TSHR, I decided
to use fluorescently labeled TSH as an indirect marker of TSH/TSHR complexes. This was justified by the
above observation that TSH and TSHR are in the same compartment at least 30 minutes post stimulation.
Also it gave an added advantage to study the internalization and trafficking of a fluorescent ligand in
complex with the endogenous receptor in its native cell context and therefore in a highly physiological
environment. The next step was to follow and characterize the trafficking of these internalized TSH/TSHR
complexes and the dynamic nature of interaction of TSH-containing vesicles with that containing the
signaling machinery responsible for intracellular GPCR signaling.

60
4.4 Trafficking of TSH/TSHR complexes via the endocytic pathway
The first step to track the internalization was to start with early endosomes of the endocytic pathway.
In order to visualize this compartment and also the fate of internalized ligand/receptor complexes, early
endosome marker, Rab5, tagged with fluorescent protein GFP was used (Rab5-GFP). Primary mouse
thyroid cells electroporated with Rab5-GFP were stimulated with TSH-594 for 10 minutes followed by a
rapid washout. Representative basal (Figure 4.4a) and stimulated (Figure 4.4b) image after 10 minutes of
the same cell are shown. TSH/TSHR complexes can be seen in early endosomes stained also by Rab5
(Figure 4.4b). Zoomed insets show representative early endosome vesicles containing TSH-594 (Figure
4.4c). The zoomed insets also reveal the nature of these early endosomes to some extent. Here they appear
as clearly defined compartments with the marker, Rab5, on the periphery and the ligand in the lumen of the
endosome (Figure 4.4c). While this just adds to our knowledge of endosomes in general it does also reveal
the capabilities of HILO microscopy in discerning such intracellular organelles.
Figure 4.4 TSH/TSHR complexes internalize and enter the endocytic pathway: (a) Primary mouse thyroid
cells expressing early endosome marker, Rab5 tagged with GFP (Rab5-GFP, green) were stimulated with
TSH-594 (magenta) for 10 minutes followed by rapid washout. Representative images of (a) basal and (b)
after stimulation and washout are shown here. (c) Representative insets (corresponding to white boxes in
b) were scaled up 5x and are shown here. Insets revealed the defined nature of endosomes with the marker
on the endosomal membrane and the TSH in the lumen of the endosome. Cell border and the nucleus (N)
are marked in white. Scale bars 10 µm (for images of cells) and 1 µm (for insets). Data are representative
of 3 independent trials.
While the trafficking and recycling of TSH has been characterized, the possibility of internalized
TSH/TSHR trafficking via the TGN arose as Calebiro et al showed that Gs proteins are present in the Golgi
and not in endosomes (Calebiro et al., 2009). Hence, the next step in investigating the trafficking of TSHR
with respect to intracellular signaling was to look at the Golgi/TGN.

61
4.5 Retrograde trafficking of the TSH via the trans-Golgi network
The trans-Golgi network (TGN) not only serves as a central role in the post-transcription modification
of newly synthesized proteins but also in their sorting to the various cell compartments. Recently, the TGN
has also been implicated in the retrograde transport of internalized proteins (Bonifacino and Rojas, 2006).
With respect to GPCRs, it was shown that the S1PR traffics to the TGN where FTY720-mediated Gi-
dependent signaling is sustained (Müllershausen et al., 2009). For the TSHR, immunofluoroscence studies
in primary mouse thyroid cells showed that the internalized receptor along with Gs proteins and adenylyl
cyclases colocalized at the TGN. Hence it was of importance to investigate the same in living cells. A
truncated portion of the -2,6 sialyl transferase (ST), which has Golgi retention signal, tagged with a
fluorescent protein, RFP was used as TGN marker (ST-RFP) (Deborde et al., 2008; Deora et al., 2007).
For live-cell imaging, primary mouse thyroid cells were electroporated to express ST-RFP and
stimulated with TSH-647. As can be seen in the representative images, half of the maximum of TSH is
outside the TGN after 10 minutes (Figure 4.5a middle panel, Figure 4.5b) while at the end of 30 minutes
ca. 60% is present in the TGN (Figure 4.5a bottom panel, Figure 4.5b and Video 1). This retrograde
trafficking of the TSH/TSHR via the TGN occurs via fusion as shown by a representative time series. Entry
of TSH into the TGN can be seen in this event (Figure 4.5c and Video 2). Direct visualization of the
receptor and ligand at the TGN was carried out by transfecting mouse thyroid cells with TSHR-YFP and
ST-RFP and stimulated with TSH-647 followed by rapid washout and imaging (Figure 4.5d). Triple
colocalisation (Figure 4.5d and arrowheads in inset) revealed that both the receptor and ligand traffic
together retrogradely via the TGN. This serves as a direct evidence for the retrograde trafficking of the
receptor and the ligand via the TGN.

62
Figure 4.5 TSH/TSHR
traffic retrogradely via
TGN: (a) Primary mouse
thyroid cells electroporated
to express TGN marker, ST-
RFP (green) and stimulated
with TSH-647 (magenta) for
10 minutes followed by a
rapid washout and further
imaging for the next 30
minutes. Representative
images of the same cell at
basal conditions and at time
points 10 and 30 minutes
post washout are shown
here. White indicates
colocalisation. (b) Above
trials were used to quantify
the percentage of TSH
present in the TGN at
indicated time points. Images
in the TSH and TGN channel
were filtered to remove
background. TSH containing
vesicles were counted and
were quantified by a binary
system based on the criteria
whether they were in the
TGN or not. Consequently, the fraction was plotted as a percentage against time (n=14), error bars indicate
SEM. (c) Inset of a representative time series (corresponding to white box in a) showing retrograde traffic
of TSH/TSHR complexes via fusion (indicated by arrows) with the TGN. (d) Representative image of primary
mouse thyroid cells transfected with TSHR-YFP and ST-RFP and stimulated with TSH-647 for 20 minutes.
Inset shows triple colocalisation (white, arrowheads) of TSHR and TSH at the TGN. Cell border and the
nucleus (N) are marked in white. Scale bars 10 µm (for images of cells) and 1 µm (for insets). Data in a, c
and d is representative of 4, 4 and 3 independent trials respectively.

63
4.6 Dynamics between internalized TSH/TSHR complexes and Gs proteins
Immunofluoroscence studies in primary mouse thyroid cells have shown that Gs proteins are not
present in early endosomes but an intracellular resident pool is present in the Golgi/TGN. Hence, one of the
aims by live-cell imaging was to understand if TSH/TSHR complexes co-internalize with Gs proteins or
whether they internalize without the cell surface Gs proteins and then meet the intracellular pool at the TGN.
Primary mouse thyroid cells were electroporated to co-express YFP-tagged Gs (Gs-YFP) and
mCherry tagged Rab5 (Rab5-mCherry), an early endosome marker, and then stimulated with TSH-647 for
10 minutes followed by rapid washout and imaging to capture the first events of internalized TSH/TSHR
complexes. Even in the basal conditions, there were almost no/very little Gs proteins present in early
endosomes (Figure 4.6a left panel). Post stimulation, most of the internalized TSH/TSHR complexes could
be seen in early endosomes (Figure 4.6a, middle panel). However, TSH/TSHR complexes that were
present in the early endosomes did not contain Gs proteins (Figure 4.6a inset, yellow indicating double
colocalisation only between TSH and Rab5-mCherry) providing a strong hint that early endosomes lack
the signaling machinery for intracellular signaling by internalized TSHR. It also gave a strong hint that
TSH/TSHR complexes internalize without the cell surface Gs proteins. At later time points however,
TSH/TSHR containing endosomes were found to be saturated in a perinuclear compartment in close
association with structures containing Gs proteins (Figure 4.6b left panel). One type of association between
TSH/TSHR vesicles and Gs proteins gave the impression of simple peanut-like structures (Figure 4.6b, left
panel arrows and Video 3). In such structures, Gs proteins were normally found only on side of the
structures, and at times, TSH was found to be present on both sides (Figure 4.6b, right panel showing split
channels). This suggested that TSH (and presumably TSHR) has free passage between these two parts of
the “peanut-like” structure. Such structures also seem to move around the cells, “fusing” and dissociating
from each other (Video 3). Another type of structure was more complex and was characterized by
TSH/TSHR containing vesicles associated with more tubulovesicular structures containing Gs proteins
(Figure 4.6b, left panel arrowheads). A closer look at these structures revealed that the fusion normally
occurred between two domains of the same type, i.e. either between the TSH or the Gs protein part of the
structures (Figure 4.6c top and bottom panel). Upon association, they moved around the cell allowing the
mixing of contents between each other (Figure 4.6 top and bottom panel and Video 3). From these above
examples, it seemed that the interaction between vesicles contained TSH/TSHR complexes and Gs proteins
happened like events suggesting that the intracellular signaling of internalized TSHR occurs as
phases/waves. This also draws light on the compartmentalization of Gs proteins.

64
Figure 4.6 TSH/TSHR
associate dynamically with
intracellular Gs: Primary
mouse thyroid cells
electroporated to express (a)
early endosome marker Rab5-
mCherry (green) and Gs-GFP
(blue) and stimulated with
TSH-647 (red) for 10 minutes
or (b) Gs-YFP (green) alone
and stimulated with TSH-594
(magenta) (6 µg/ml) for 20
minutes followed by rapid
washout and imaging.
Representative basal and
stimulated images of the same
cell are shown here. (a) Gs
proteins are almost absent
from early endosomes in basal
as well as stimulated
conditions. Inset shows double
colocalisation (yellow) of
TSH-647 and Rab5-mCherry
only. (b) TSH and Gs proteins
containing vesicles are seen
near the perinuclear
compartment. TSH vesicles upstream (presumably early endosomes) of Gs protein containing structures
(asterisk), peanut-like structures showing simple association of TSH and Gs protein containing vesicles
(arrows), complex association of TSH containing vesicles with tubulovesicular structures containing Gs
proteins (arrowheads). An inset showing split channels of TSH and Gs proteins to demonstrate peanut-like
structure is shown in the right panel. (c) Representative event shows dynamic association characterized as
fusion and mixing of contents between two domains of vesicles containing TSH and Gs proteins. Cell border
and the nucleus (N) are marked in white. Scale bar 10 µm (whole cell images) or 1 µm (for split channel in
b, time series in c). Data a, b and c representative of 3, 5 and3 independent trials respectively.
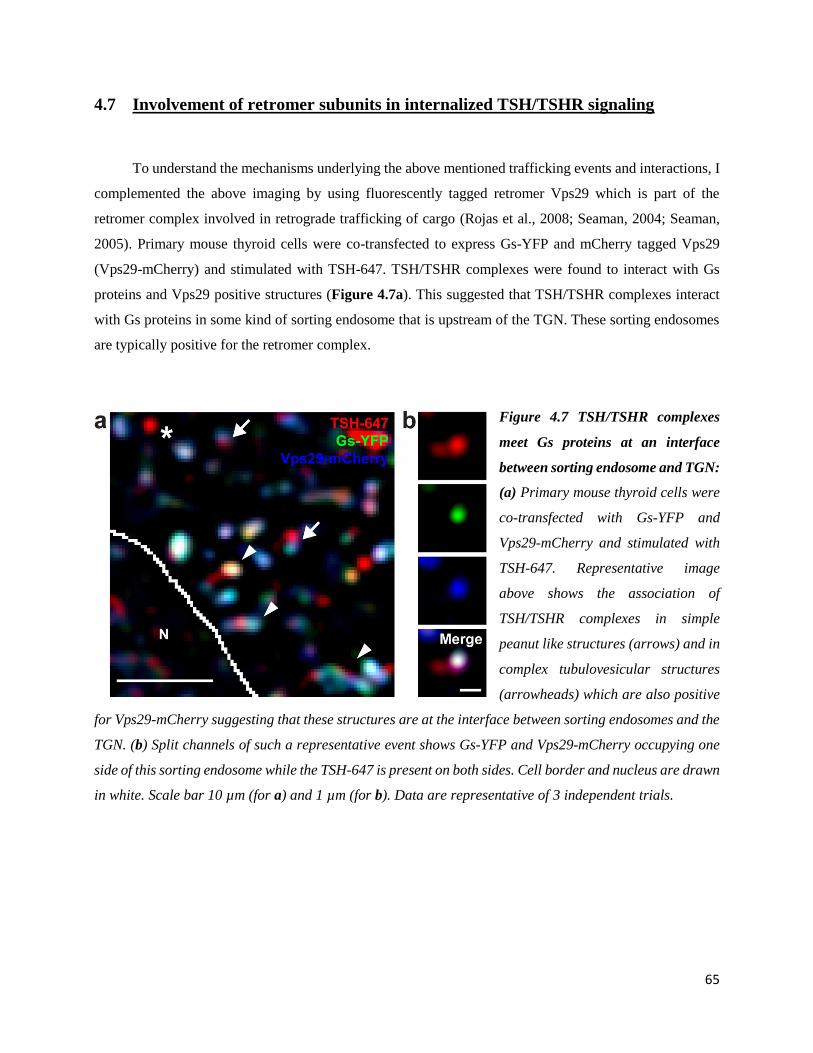
65
4.7 Involvement of retromer subunits in internalized TSH/TSHR signaling
To understand the mechanisms underlying the above mentioned trafficking events and interactions, I
complemented the above imaging by using fluorescently tagged retromer Vps29 which is part of the
retromer complex involved in retrograde trafficking of cargo (Rojas et al., 2008; Seaman, 2004; Seaman,
2005). Primary mouse thyroid cells were co-transfected to express Gs-YFP and mCherry tagged Vps29
(Vps29-mCherry) and stimulated with TSH-647. TSH/TSHR complexes were found to interact with Gs
proteins and Vps29 positive structures (Figure 4.7a). This suggested that TSH/TSHR complexes interact
with Gs proteins in some kind of sorting endosome that is upstream of the TGN. These sorting endosomes
are typically positive for the retromer complex.
Figure 4.7 TSH/TSHR complexes
meet Gs proteins at an interface
between sorting endosome and TGN:
(a) Primary mouse thyroid cells were
co-transfected with Gs-YFP and
Vps29-mCherry and stimulated with
TSH-647. Representative image
above shows the association of
TSH/TSHR complexes in simple
peanut like structures (arrows) and in
complex tubulovesicular structures
(arrowheads) which are also positive
for Vps29-mCherry suggesting that these structures are at the interface between sorting endosomes and the
TGN. (b) Split channels of such a representative event shows Gs-YFP and Vps29-mCherry occupying one
side of this sorting endosome while the TSH-647 is present on both sides. Cell border and nucleus are drawn
in white. Scale bar 10 µm (for a) and 1 µm (for b). Data are representative of 3 independent trials.

66
4.8 Internalized TSH/TSHR complexes activate Gs proteins at the TGN
To directly visualize active Gαs, we used a conformational biosensor (Irannejad et al., 2013) based on
a nanobody that can recognize guanine nucleotide-free state of Gαs (Rasmussen et al., 2011; Westfield et
al., 2011). This nanobody has been well characterized to be specific for sensing Gαs in its signaling
confirmation (Rasmussen et al., 2011; Westfield et al., 2011). Primary mouse thyroid cells electroporated
to express this biosensor showed a cytoplasmic expression as well expression in vesicles in the basal state.
After stimulation with TSH-594, colocalisation was found between vesicles containing TSH and those
marked by the nanobody biosensor (Figure 4.8a). The increase in the number of Nb37 positive vesicles was
specific to TSH stimulation and internalization of TSH/TSHR complexes as inhibition of internalization in
the presence of dynamin inhibitor, dynasore (Macia et al., 2006), led to a decrease in Nb37 positive vehicles
(Figure 4.8b). The increase in Nb37-stained vesicles starts ca. 2 minutes post-stimulation. These
experiments were hence able to prove the specificity of TSH-induced intracellular Gs signaling (Figure
4.8b).
A closer look at these vesicles revealed similar dynamic association as seen for that between TSH
and Gs proteins (Figure 4.8c). A representative event showing translocation of the nanobody to the vesicle
containing TSH is shown (Figure 4.8c and Video 4). This representative image sequence is also shown here
as a kymograph which shows two consecutive events (Figure 4.8d arrowheads) To see whether such a
fusion leads to an increase in active Gs proteins, I quantified the fluorescence intensity of the nanobody in
such a vesicle before and during/after fusion (Figure 4.8e). For all the events it was found that intensity
increases by varying degrees. This increase in intensity was found to be about 60% (Figure 4.8e).
Co-transfection of primary mouse thyroid cells with Vps29-mCherry and Nb37-YFP revealed that
Nb37-YFP was recruited on the retromer positive region of the sorting endosome indicating that Gs protein
activation takes place in retromer-positive regions of the sorting endosomes (Figure 4.8f).
To further investigate whether internalized TSH/TSHR activates Gs proteins in the TGN, I
simultaneously expressed Nb37-YFP and the TGN marker, ST-RFP, in primary thyroid cells and stimulated
them with TSH-647. The TGN is marked as an extensive network of tubules and vesicles. Internalized
TSH/TSHR complexes were found to be near the nucleus located very close to the TGN (Figure 4.8g left
panel). It can be seen that Gs protein activation was seen on TGN-negative (Figure 4.8g inset 1) as well
TGN-positive (Figure 4.8g inset 2 and Video 5) structures thus providing evidence that internalized
TSH/TSHR activate Gs proteins on retromer-positive structures as well as in the TGN.

67
Figure 4.8 TSH/TSHR complexes activate a
resident pool of Gs at sorting endosomes and
at the TGN: (a) Nb37 specific for guanine-
nucleotide free form of Gs and tagged with
YFP (Nb37-YFP) was expressed in primary
thyroid cells followed by stimulation with TSH-
A594 and found to colocalize in the
perinuclear area (n=18 over 6 independent
experiments). (b) Thyroid cells transfected to
express Nb37-YFP were stimulated with TSH
(50 U/L) in the presence and absence of
endocytosis inhibitor dynasore. Nb37-stained
vesicles were counted and plotted against time,
n = 5 in each condition. Data was analysed by
a multiple t-test for multiple comparisons
using the Holm-Šídák method for correction. P
value < 0.05. (c) Representative event showing
association of vesicle containing TSH-594
with that of Nb37-YFP to highlight the
increase in fluorescence intensity as a result of
Nb37 recruitment. (d) kymograph of image
sequence in c to highlight two consecutive
Nb37-YFP recruitment events (arrowheads)
(e) Fold change in the nanobody intensity of
the vesicle before and during/after interaction
with TSH; n = 34 events over three
independent experiments, P value < 0.0001. (f)
Representative image of an Nb37-postive endosome, showing the asymmetrical localization of TSH-647,
Nb37-YFP and Vps29-mCherry, used to visualize the retromer complex. (g) Colocalization between TSH-
647, Nb37-YFP and the TGN marker ST-RFP. The insets show examples of Nb37 recruitment on a ST-RFP
negative structure, presumably a sorting endosome (inset 1), as well as on membranes of the TGN (inset 2).
Cell border and the nucleus (N) are marked in white. Scale bars 10 µm (for in a and g) and 1 µm (for insets,
c, f). Data in f and g is representative of 3 and 5 independent trials respectively.

68
4.9 Brefeldin A treatment affects retrograde trafficking
To understand the role of TGN in intracellular trafficking and signaling of internalized TSH/TSHR
complexes, we performed experiments with fluorescent TSH and ST-RFP in the presence of Brefeldin A
(BFA) which is a fungal metabolite known to disrupt the Golgi and make it collapse into the endoplasmic
reticulum (Lippincott-Schwartz et al., 1991b; Lippincott-Schwartz et al., 1989).
As can be seen, pre-treatment of primary thyroid cells expressing ST-RFP with 10 µg/ml BFA leads
to a collapse of the network marked by the TGN marker (Figure 4.9a middle panel and Video 6) and
subsequent stimulation by TSH-647 leads to accumulation/hovering of the same in a perinuclear
compartment (Figure 4.9a right panel) resulting in a blockage in its retrograde trafficking.
4.10 Brefeldin A disrupts localization of the PKA RII subunit from the Golgi/TGN
Due to the evidence of a resident pool of Gs proteins at the Golgi/TGN, the next step was to
investigate the downstream signaling machinery in GPCR signaling. As a first step, it was important to
consider some previous investigations of PKA subunits localization that had been done in our group. PKA
is the main effector of cAMP in thyroid and other cell types. It is a tetramer composed of a dimer of two
catalytic (C) and two regulatory (R) subunits (Taylor et al., 2012). The regulatory subunit is responsible for
tethering the PKA tetramer to various subcellular compartments by interaction with scaffold proteins,
AKAP (Wong and Scott, 2004).
Previous investigations from our group on the localization of PKA subunits in primary mouse
thyroid cells have revealed that while the catalytic (C) and regulatory (RI and RII) subunits are
dispersed in the cytosol, the RII subunit shows selective colocalisation at the Golgi (Dissertation by Sandra
Lyga (Lyga, 2016)). In this present study, it was also revealed that the Csubunit is enriched at the TGN
(Figure 4.9b).
Immunofluoroscence studies in the present work investigated the relation of the same RII subunit
with the TGN. Primary mouse thyroid cells were fixed and the RII and TGN were visualized by
immunofluoroscence using specific antibodies. Antibody against TGN46, a maker for the TGN, was used
to visualize the TGN (Figure 4.9d, f). While the colocalisation of RII subunit with TGN46 (Figure 4.9d,
f) was not as strong as with GOLPH4 (a marker of Golgi) (Figure 4.9e control and Video 7), there was still

69
some limited colocalisation (Video 8). In fact, one can see that the PKA RIIfraction which is not
positive/associated for GOLPH4 (Figure 4.9c), is probably associated with the TGN (Figure 4.9d and f).
BFA pre-treatment disrupted the highly structured organization of PKA RII in such a way that it
was dispersed around the nucleus in small vesicular structures (Figure 4.9e, f). The strong colocalisation
with the Golgi was completely lost (Figure 4.9e) and there seem to be a small but limited colocalisation
with the TGN (Figure 4.9f).

70
Figure 4.9 BFA treatment delays
TSH/TSHR retrograde trafficking and
dislocates PKA RII from the
Golgi/TGN: (a) Primary mouse thyroid
cells transfected to express ST-RFP
were pre-treated with Brefeldin A (BFA)
(10 µg/ml) to disrupt the TGN followed
by stimulation with TSH-A647 for 20
minutes and a rapid washout.
Representative basal and stimulated
images in the presence of BFA are
shown here. BFA treatment lead to
perturbation of TGN marked by ST-RFP
and after TSHR stimulation, TSH-647
trafficking to the TGN was delayed. (b)
Immunofluoroscence revealed the
perinuclear enrichment of PKA C in
primary mouse thyroid cells. 3D
visualization of PKA RIIb subunit and
(c) Golgi marker GOLPH4 or (d) TGN
marker TGN46 in fixed primary mouse
thyroid cells. (e) Immunostaining of
PKA RII and (e) GOLPH4 and (f)
TGN46 in the absence (control) and
presence of BFA. Representative
control and BFA-treated images are
shown here. BFA treatment lead to disruption of the Golgi- and TGN- localisation of PKA RII Data are
representative of 3 independent trials.

71
4.11 Brefeldin A treatment attenuates cAMP and PKA signaling
To understand the contribution of the TGN towards intracellular cAMP signaling, we used primary
mouse thyroid cells from a transgenic mouse ubiquitously expressing cAMP sensor Epac1-camps (Calebiro
et al., 2009) and performed real-time FRET experiments looking at the cAMP response in the presence and
absence of BFA (Figure 4.10a). Disruption of Golgi by BFA led to attenuated cAMP responses at around
time points ~10 minutes post TSH stimulation (Figure 4.10a).
The next step was to see whether the same could also have an effect on PKA signaling for which we
used a FRET-based PKA sensor AKAR2 (Zhang et al., 2005) expressed in primary mouse thyroid cells. In
the presence of BFA, a triphasic response in PKA signaling was revealed (Figure 4.10b). Even though the
PKA response at end time points of 20 minutes were found to be of same amplitude as that of the control, a
more complex kinetics up to this end point was revealed. While the kinetics of the 1st and 2nd phase were
maintained, a third phase arose at later time points (around 10 minutes post TSH stimulation) (Figure 4.10b)
which corroborated with the trafficking time for internalized TSH/TSHR complexes to reach the TGN
(Figure 4.5a and 4.5b).
As BFA induced Golgi disruption and TGN perturbation seemed to result in attenuated cAMP
responses and more complex PKA signaling kinetics, I decided to see whether these effects trickle down to
CREB phosphorylation, a significant step in TSH-induced signaling in thyroid cells.

72
Figure 4.9 BFA treatment attenuated cAMP/PKA signaling and CREB phosphorylation: (a) Average
cAMP FRET responses measured in primary thyroid cells isolated from transgenic Epac1-camps mice
expressing the FRET based cAMP sensor, EPAC and (b) average PKA FRET responses in primary thyroid
cells transfected with FRET-based PKA sensor AKAR2 upon TSH stimulation (50 U/L) in the absence
(control) or presence of BFA (10µg/ml). FRET values in (a) and (b) were normalized to the response to
forskolin (10 µm) at the end of each experiment. Data (mean ± S.E.M.) in (a) and (b) are from 7-13
independent experiments. Data points between the two treatments were compared using the Holm-Šídák test
for multiple comparisons (dots, P values). (c) Ratio of p-CREB/-tubulin in response to TSH stimulation
(100 U/L) in primary mouse thyroid cells pre-treated with DMSO (control) or dynasore (80 µM). Values
were normalized to mock stimulation in control. Data (mean ± S.E.M.; n= 3). Differences are statistically
significant by two-way ANOVA. *, P<0.05 by Bonferroni´s post hoc test.

73
4.12 Effect of Golgi disruption on TSHR-induced TSHR CREB phosphorylation
CREB (cAMP response element-binding protein) is a transcription factor which belongs to the
leucine-zipper family. Upon induction of the cAMP pathway by hormones, PKA is activated and
translocates to the nucleus from the cytoplasm where it phosphorylates CREB at serine 133. This activation
of CREB takes place in 15-30 minutes after TSH stimulation which is also the time required for PKA to
translocate to the nucleus. Hence to determine whether TSH/TSHR internalization and Golgi/TGN signaling
have any effect on CREB, experiments were performed to measure CREB phosphorylation.
6-days old primary mouse thyroid cells were starved overnight and then preincubated with BFA and
appropriate control medium (medium containing EtOH for BFA) followed by TSH stimulation, cell lysis
and immunoblotting. Values were normalized to basal CREB phosphorylation in control media and P-
CREB/α-tubulin ratio were plotted on a graph (Figure 4.10c). A BFA-induced Golgi collapse significantly
reduced CREB-phosphorylation (Figure 4.10c).
As a conclusion, the current study provides evidence that internalized TSH/TSHR complexes traffic
retrogradely via the TGN, meet and activate intracellular Gs proteins at the interface between sorting
endosomes and the TGN. It also reveals that internalized TSH/TSHR complexes give rise to at least two
distinct phases of PKA signaling which are different in magnitude and functional impact from the one
originating at the cell surface. PKA activation induced by internalized TSH/TSHR complexes is necessary
for CREB phosphorylation and gene transcription which can be attenuated in the presence of
pharmacological mediators like BFA suggesting that an intact Golgi/TGN structure is crucial for efficient
TSH-induced effects. Taken together, these results show that not only the PKA that is activated by
internalized TSH/TSHR contributes to increased CREB-phosphorylation but also that an intact Golgi plays
an important in this increased phosphorylation thus adding more evidence that Golgi/TGN is one of the
major intracellular platform for signaling by internalized GPCRs.
74
5 Discussion
This study reports the retrograde trafficking and signaling of internalized TSH/TSHR complexes in
living thyroid cells. Briefly, upon TSH stimulation, TSH and TSHR co-internalize and meet Gs proteins in
sorting endosomes marked by retromer complexes. The retromer complexes guide the entry of these
TSH/TSHR complexes to the TGN for retrograde transport. The TSH/TSHR complexes activate Gs proteins
along their way from the sorting endosomes to the TGN. The scintillating nature of nanobody Nb37, to
detect active Gs protein, suggests a quantal nature of Gs protein signaling in these structures. Perturbation
and reorganization of the TGN in the presence of BFA led to displacement of the PKA subunit RII from
the Golgi/TGN and subsequently reduced cAMP responses and delayed PKA activation as monitored by
real time FRET. This was reflected in attenuated CREB phosphorylation in the presence of BFA. In
summary, this study not only sheds some light on cAMP/PKA compartmentalization but also reports that
the TGN is one of the compartments responsible for sustained TSHR signaling and provides a mechanism
to explain the biological relevance of internalized GPCRs.
5.1 Retrograde trafficking of GPCRs via the trans-Golgi network
The current work shows that, in living primary mouse thyroid cells, TSH/TSHR complexes
internalize into early endosomes (as marked by Rab5) and enter the endocytic pathway of trafficking. This
is in accordance with the previous studies on TSHR trafficking in fixed cells (Baratti-Elbaz et al., 1999;
Lahuna et al., 2005). Interestingly, presence of TSH and TSHR in the TGN strongly indicates that a fraction
of the internalized TSH/TSHR population traffics via the TGN thus adopting the alternate recycling
pathway. This trafficking of internalized TSH/TSHR complexes via the TGN occurs via fusion of the two
compartments in a highly dynamic manner. The compartment containing TSH/TSHR arrives near the
adjoining area of the compartment marked by the TGN marker. It is followed by the entry of the fluorescent
ligand into the TGN over time and over time, the entire TGN compartment is filled with the fluorescent
ligand (Figure 4.4c, time point +100s). This observed dynamics can be either the result of a maturation of
compartment of the endocytic sorting compartment into the TGN (as supported by the cisterna-progression-
maturation model) or by actual fusion and fusion of the compartments (as supported by the kiss-and-run
model). Both these possibilities and the corresponding models are explained in section 5.5. Quantification
of the trafficking of internalized TSH/TSHR complexes via the TGN revealed that after 10 minutes post-
stimulation, around 30% of the internalized TSH is located in the TGN. This fraction increases to half
maximal i.e. around 55% till 30 minutes. At 10 minutes post stimulation, the remaining 70% of internalized
75
TSH/TSHR is either still in the endocytic pathway waiting to be sorted into the TGN or just continues to
stay in the endocytic pathway and get recycled which would be in accordance with the previous studies on
TSHR trafficking (Baratti-Elbaz et al., 1999; Lahuna et al., 2005). The observation that the fraction of
internalized TSH/TSHR complexes tends to reach steady state by 30 minutes points to the possibility that
the complexes that enter the TGN are sorted continuously so that the TSHR is recycled back to the cell
surface while the TSH is degraded as shown by previous studies (Baratti-Elbaz et al., 1999; Lahuna et al.,
2005). This also takes into account the fraction of TSH/TSHR complexes that never enters the retrograde
pathway. This study also shows that internalized TSH/TSHR complexes colocalized with Vps29-GFP
(Figure 4.7), a subunit of the retromer complex (Rojas et al., 2008) which has been shown to guide cargo
protein to the TGN for retrograde trafficking (Collins, 2008; Seaman, 2004; Seaman, 2005). This gives
further evidence that retrograde transport is another alternate route that internalized TSH/TSHR complexes
adopt as an option to recycling via the endocytic pathway. Zoomed insets revealed prominent
tubulovesicular structures containing retromer and TSH/TSHR complexes. While visually it is clear that
retromer is involved in TSH/TSHR retrograde sorting, further studies viz. identifying cargo recognition
sequences on the TSHR can be done. This will give more information related to binding between Vps35
and TSHR. Thus as conclusion, while it has been shown that the TSHR recycles back in the endocytic
pathway via recycling endosomes (Baratti-Elbaz et al., 1999; Lahuna et al., 2005), the current study shows
that a considerable population of internalized receptor-ligand complexes probably bifurcate from the
endocytic pathway and enter the retrograde pathway for recycling.
Within the glycoprotein hormone receptor family considerable differences in trafficking already
exist between the FSHR, LHCGR and the TSHR. Like the TSHR, upon ligand binding and activation, the
FSHR too undergoes homologous desensitization (Kara et al., 2006). Following this, the FSHR gets
phosphorylated at the serine and threonine residues in the intracellular loops 1 and 3 and at the C-terminus
(Kara et al., 2006). This phosphorylation leads to uncoupling and β-arrestin-mediated internalization (Kara
et al., 2006). Based on the observation of simultaneous recruitment of β arrestin 1 and 2, FSHR has been
classified as a class ‘B’GPCR (Reiter and Lefkowitz, 2006). Post -arrestin mediated internalization,
FSH/FSHR complexes traffic via the recycling pathway and end up back at the plasma membrane
(Krishnamurthy et al., 2003). Once back at the plasma membrane, the hormone dissociates and the receptor
is available to be resensitized again (Krishnamurthy et al., 2003). A small fraction of the internalized
FSH/FSHR complexes however undergoes lysosomal degradation (Krishnamurthy et al., 2003). For the
human choriogonadotropin hormone (hCG) receptor, the choriogonadotropin hormone is internalized as a
whole entity along with the receptor and once inside, the alpha subunit of choriogonadotropin is degraded
at a faster rate than the beta subunit of the ligand and also in a different cellular compartment (Ascoli, 1982a;
Ascoli, 1982b). Once delivered to the lysosomes, the receptor ligand complex is dissociated and the receptor
76
is also degraded (Ascoli, 1984; Ghinea et al., 1992). With the exception of retrograde trafficking via the
TGN for the TSHR as presented in this study the same has not been observed (or maybe not investigated)
for the FSHR and LHCGR.

77
5.2 Gs-protein-mediated intracellular signaling
The results presented in this study showed that Gs proteins are nearly absent in early endosomes not
only in basal conditions but also after stimulation with TSH. Rather, we saw Gs proteins in a perinuclear
compartment (Figure 4.6b). This also provides strong evidence that TSH/TSHR complexes do not co-
internalize with Gs proteins but rather meet an intracellular pool of Gs proteins at the Golgi/TGN.
Immunofluorescence studies from our group have also shown that Gs proteins are not present in early
endosomes (Calebiro et al., 2009). Taken together, early endosomes are probably not a possible platform
for intracellular signaling of internalized TSH/TSHR complexes. Triple colocalisation of TSH, Gs proteins
and AC in the perinuclear area of primary mouse thyroid cells coupled with a prominent intracellular pool
of Gs proteins at the Golgi (Calebiro et al., 2009) gave a clue that the Golgi/TGN might be a more possible
candidate for intracellular signaling.
A long publication list has documented the presence of Gs proteins on the cell surface as well as on
intracellular membranes (Hewavitharana and Wedegaertner, 2012; Wedegaertner, 2012). It was shown that
GPR30, a receptor that localizes to the ER could mobilize Ca2+ and initiate phosphoinositide signaling
(Revankar et al., 2005). Similar studies have also been shown for OA1 (ocular albinism type 1) receptor, a
cell surface 7TM receptor that also localizes to melanosomes and is activated by L-DOPA (L-3, 4-
dihydroxyphenylalanine). However, direct activation of G-proteins by OA1 has not yet been confirmed
(Giordano et al., 2009; Innamorati et al., 2006). Involvement of endosomes as sites for real G-protein
signaling was shown for the first time using Ste2 receptor in budding yeasts, a GPCR that is activated by
pheromone, where it was shown that Gs subunit after being released from the G-protein heterotrimer
translocates to the endosome and initiates signaling which also involves endosome-protein PI3 kinase
(Slessareva et al., 2006). While endosomal signaling has been demonstrated for PTHR (Feinstein et al.,
2011; Ferrandon et al., 2009; Wehbi et al., 2013), V2R (Feinstein et al., 2013), D1R (Kotowski et al., 2011)
and the 2-AR (Irannejad et al., 2013) (mentioned in section 1.10), signaling for the S1PR has been
proposed to be at the Golgi (Müllershausen et al., 2009). The same has been demonstrated for the KDELR
(Giannotta et al., 2012). It was shown for the KDELR (Lys-Asp-Glu-Leu endoplasmic reticulum protein
retention receptor), a protein that was formally thought to be just a mediator for vesicle formation by
controlling small GTP-binding protein ARF1 (Aoe et al., 1997), also regulates Gq and Gs protein signaling
at the Golgi (Giannotta et al., 2012). These results from other receptors not only support the existence of a
signaling machinery at the Golgi/TGN but also the possibility of intracellular Gs protein-signaling by
particularly internalized TSH/TSHR complexes at the TGN.

78
Interestingly, the intracellular compartment responsible for persistent signaling by internalized
GPCRs is cell-type specific (Werthmann et al., 2012). While persistent signaling for PTHR and V2 has been
shown to be present in human embryonic kidney (HEK) cells (an off-the-rack immortalized cell line)
(Feinstein et al., 2013; Ferrandon et al., 2009), the same cannot be said for the TSHR. It was shown that
when TSHR is overexpressed in HEK cells, they do not demonstrate persistent signaling (Werthmann et al.,
2012) (see section 1.10). A possible reason for this might be the highly polarized nature of thyroid cells in
a thyroid follicle. As has been already (section 1.4), not only is the physiology of thyroid cells under strict
control of the endogenous TSHR, the expression of endogenous TSHR is focused on the apical surface (the
surface which is accessible to TSH in the blood stream) and the basolateral membrane devoid of TSHR
expression, faces the lumen of the follicle. In real-time FRET experiments which were performed on thyroid
follicles (Calebiro et al., 2009), one could very well imagine the spatial polarization of such persistent
signaling. When thyroid follicles isolated from mice are cultured on petri dishes they break down into single
cells and these cells also tend to assume a peculiar sickle-like shape which mimics the shape of the cells in
an intact follicle. HEK cells on the other hand do not show such polarization and hence this can be a possible
reason why we do not see persistent signaling by overexpressed internalized TSHR in HEK cells.

79
5.3 Direct evidence of G-protein signaling at TGN/sorting endosomes
As nanobody Nb37 recognizes the guanine-nucleotide-free conformation of Gs (Westfield et al.,
2011) it was used as a biosensor to detect the catalytic and fleeting intermediate state in G-protein activation
(Irannejad et al., 2013). The above application of sensing Gs protein activation in various cellular
compartments was also used successfully in this study to visualize intracellular TSH/TSHR signaling. When
expressed in primary mouse thyroid cells, the nanobody had a cytoplasmic expression and was also found
to be in intracellular vesicles. Such vesicles can represent compartments of the endocytic pathway or the
anterograde or retrograde pathway. As we did not detect Gs proteins in early endosomes by immunostaining
or by live-cell imaging, we can rule out that these vesicles are early endosomes. Gs proteins have been found
to be present in the Golgi/TGN (Calebiro et al., 2009) and hence these vesicles can be a part of the
anterograde or the retrograde pathway in primary mouse thyroid cells. Cells expressing Nb37 stimulated
with TSH showed a marked increase in Nb37-stained vesicles giving more hint that internalized TSH/TSHR
complexes sequester Nb737 to their compartment (Figure 4.8b).. In the presence of dynasore, which is an
internalization inhibitor, there was no increase in such vesicles, giving further evidence that increase in
Nb37-stained vesicles is specific to TSH/TSHR internalization. It is also noteworthy that this increase in
Nb37-stained vesicles begins in around 2-3 minutes which coincides with the second phase of the observed
biphasic PKA signaling response in real-time FRET experiments. This observed biphasic PKA response
consists of a 1st rapid phase which occurs immediately upon TSH application and the 2nd slower phase starts
at around 2-3 minutes post TSH stimulation. This suggests that another compartment upstream of the TGN
(a sorting endosome marked by the retromer as shown in Figure 4.8f) is also a location for internalized
TSH/TSHR Gs protein signaling (summarized in Figure 5.1).

80
Figure 5.1 Schematic representation of Gs protein signaling in primary mouse thyroid: Internalized
TSH/TSHR complexes meet the Gs protein in sorting endosomes (upstream of the TGN and positive for
retromer) and in the TGN where they activate the Gs proteins as visualized by nanobody Nb37-YFP, a
conformational biosensor for Gs protein activation. Figure kindly provided by Davide Calebiro.

81
5.4 Effect of BFA-induced Golgi collapse on the TGN
Brefeldin A is a fungal metabolite isolated from fungi viz. Penicillium brefeldianum which was
initially discovered and applied for its use as an anti-viral antibiotic (Tamura et al., 1968). Studies showed
that Brefeldin A is similar to monensin but different in the aspect of how it affects trafficking of newly
synthesized proteins. BFA was initially shown to inhibit transport from the ER to the Golgi thus negatively
affecting intracellular transport of secretory proteins but showed no inhibition on the endocytic pathway
(Misumi et al., 1986). Pioneering work to elucidate the mechanism was presented by Lippincott-Schwartz
et al in 1989 who showed that upon acute BFA treatment, the cis and medial cisternae (but not the trans
side) of the Golgi get redistributed to the ER. This affected transport of the proteins from the ER to the
Golgi (Lippincott-Schwartz et al., 1989). Upon removal of BFA, the Golgi reforms and cis and medial
resident proteins translocate back to this newly formed Golgi and the transport from the ER to Golgi and
then to further distal cellular compartments is resumed (Lippincott-Schwartz et al., 1989). It was also shown
that forskolin was able to reverse the BFA-induced effects in cells that were acutely pretreated with BFA
while other cAMP analogues or PDE inhibitors were not able to do so implying that forskolin uses a cAMP-
independent mechanism to invert the morphological effects brought about by BFA (Lippincott-Schwartz et
al., 1991a).
Wood et al showed that BFA induced the formation of TGN-derived tubular structures in I-cell
fibroblasts (Wood et al., 1991). These TGN-derived tubules were found to fuse with the endosomal network
forming a new functional network, a TGN/endosomal network, which also retains the functionality of the
endocytic pathway. This newly formed network is associated with microtubules and also led to increased
cell surface expression of the mannose-6-phosphate receptor. It was also shown that while BFA did not
affect the transport between pre-lysosomes to the lysosomes and TGN, only the transport between TGN and
endocytic pathways was affected ultimately affecting the retrograde pathway. It has also been shown that
lysosomes also form a tubular network separate from that formed by the TGN and that endocytosis and
recycling are not affected/inhibited by BFA treatment (Lippincott-Schwartz et al., 1991b; Wood et al.,
1991).
Such a scenario can be hypothesized in this study also, where primary mouse thyroid cells under
acute BFA treatment develop an extensive network of TGN fused with the endocytic pathway (Figure 4.9a
and Video 6). Such an extended network will not affect recycling of internalized TSH/TSHR complexes but
will probably promote receptor recycling rather than degradation, as shown for the M6PR (Wood et al.,
1991). Another effect of acute BFA treatment can be the segregation of the Gs-PKA signaling machinery.
It is possible that the Golgi/TGN resident pool of Gs proteins and PKA undergo a kind of separation under

82
the effect of BFA in such a way that a fraction of the pool stays in the Golgi and the remaining gets
“stranded” in the TGN. Such a scenario can probably explain why we do not see significant changes in PKA
responses after almost 20 minutes after TSH stimulation (Figure 4.10b). However when we look at the
PKA responses at 10 minutes post TSH stimulation we see a significant difference in PKA responses. This
is probably due to the physical separation of Gs-PKA signaling machinery stranded in the TGN from the
internalized TSH/TSHR complexes. This is also reflected downstream of PKA signaling where the TSH
stimulation was carried out for 10 minutes and we investigated induction of CREB phosphorylation at 10
minutes. While it was not possible in the scope of this study to investigate CREB phosphorylation at later
time points in the presence of BFA, it would be interesting to do so and thus underline the impact of BFA
on TGN reorganization and Gs-, PKA- signaling and CREB phosphorylation. Several attempts were also
made to investigate the effect of BFA induced Golgi collapse on gene transcription but the results were not
conclusive.
83
5.5 Intra and post- Golgi transport: cisternal progression or kiss-and-run model?
While Gs proteins were found in perinuclear area in basal conditions as well as in stimulated
conditions colocalizing with internalized TSH/TSHR complexes, this association was found to be highly
dynamic (Figure 4.6c and Video 3). Vesicles containing Gs proteins and TSH were found to be associated
in form of a pair with constant fusion and fusion with intermittent mixing of contents mostly involving TSH
passing into the compartment containing Gs proteins (Figure 4.6c and Video 3). While such a behavior of
dynamic compartments gives a new understanding to TSHR trafficking it now seeks explanation from
extremely controversial models for intra-Golgi transport and transport between Golgi and the TGN and so
on.
To begin with, intra-Golgi transport has been explained by many theories, viz. vesicular transport
(which assumes the anterograde and retrograde transport of cargoes via vesicles), cisternal-progression
maturation model (where the cisternae of the Golgi mature and progress through the Golgi stacks), diffusion
model (Glick and Luini, 2011; Nakano and Luini, 2010) and kiss and run (KAR) model (simply, it explains
transport of cargo by the way of fusion and fission of compartments and increasing and decreasing ion
gradients along the Golgi apparatus (Mironov et al., 2005; Mironov and Beznoussenko, 2012).
Out of the proposed models, the cisternal-progression model has been modified many times (Glick
and Luini, 2011). The latest modified version explains that when cargo proteins exit the ER in dissociated
carriers they travel via the intermediate compartment to reach the cis side of the Golgi where they get
recycled cis proteins from the more distal cis compartment (Glick and Luini, 2011). This newly form cis
cisterna now moves ahead trough the Golgi stack and at each level recycles the proteins belonging to the
previous level and itself gets new proteins from the next level. This is how this cisterna now eventually
arrives at the most distal part of the Golgi apparatus (i.e. at the trans face) by continuous recycling of the
proteins to the back side and taking the delivery of the proteins from the next side (Glick and Luini, 2011).
At the trans-face rather than getting the proteins from the next side i.e. from the TGN, the cisterna breaks
down so that the proteins of trans face are recycled back while the cargo proteins are now in a
vesicle/compartment that moves to the appropriate location in the cell (Glick and Luini, 2011). Thus, intra-
Golgi transport is regulated by the anterograde and retrograde transport of Golgi-resident proteins. Such a
system however does not explain the existence of intercisternal tubules; for example, why they exist when
cisterna progress by maturation (Glick and Luini, 2011). The KAR model assumes that two compartments
fuse and during this fusion the solutes in one compartment are free to pass into the other compartment
(Mironov and Beznoussenko, 2012). This transport needs to be in the proper direction and for this the KAR
model proposes that ion gradient and solute concentration play an important role in pumping the proteins to
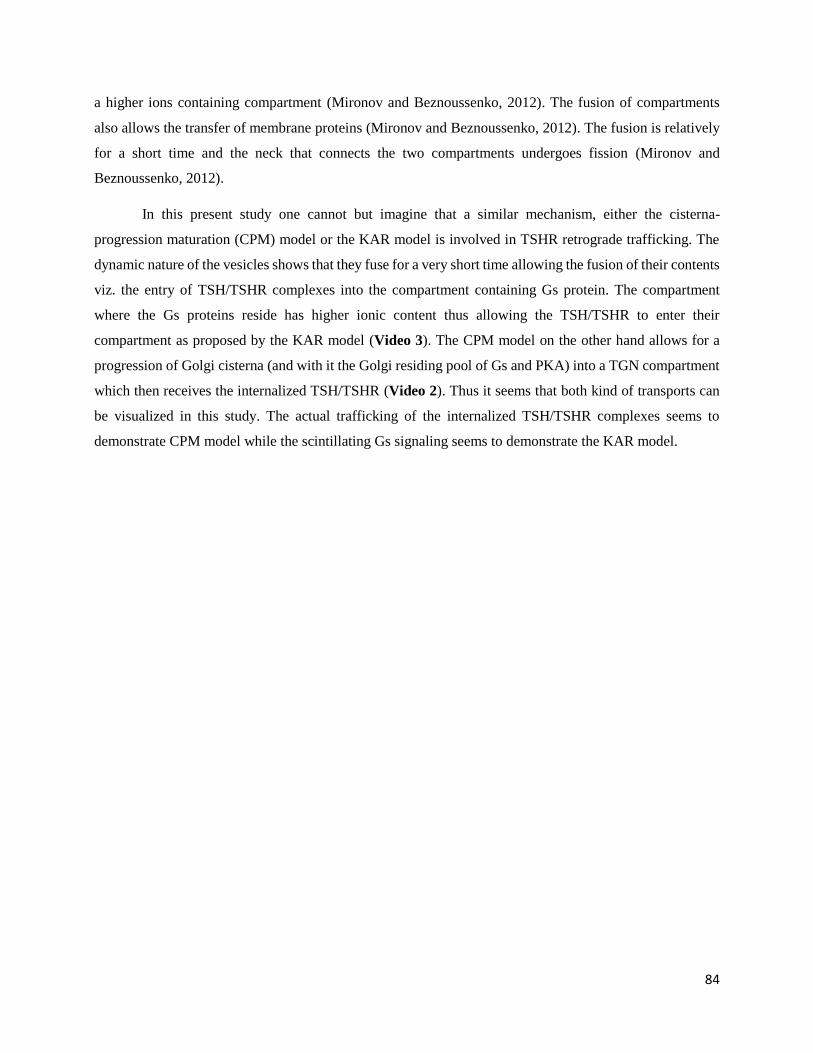
84
a higher ions containing compartment (Mironov and Beznoussenko, 2012). The fusion of compartments
also allows the transfer of membrane proteins (Mironov and Beznoussenko, 2012). The fusion is relatively
for a short time and the neck that connects the two compartments undergoes fission (Mironov and
Beznoussenko, 2012).
In this present study one cannot but imagine that a similar mechanism, either the cisterna-
progression maturation (CPM) model or the KAR model is involved in TSHR retrograde trafficking. The
dynamic nature of the vesicles shows that they fuse for a very short time allowing the fusion of their contents
viz. the entry of TSH/TSHR complexes into the compartment containing Gs protein. The compartment
where the Gs proteins reside has higher ionic content thus allowing the TSH/TSHR to enter their
compartment as proposed by the KAR model (Video 3). The CPM model on the other hand allows for a
progression of Golgi cisterna (and with it the Golgi residing pool of Gs and PKA) into a TGN compartment
which then receives the internalized TSH/TSHR (Video 2). Thus it seems that both kind of transports can
be visualized in this study. The actual trafficking of the internalized TSH/TSHR complexes seems to
demonstrate CPM model while the scintillating Gs signaling seems to demonstrate the KAR model.

85
5.6 Gs protein signaling at the trans-Golgi network
G-proteins have been associated with the Golgi structure and the transport between ER and the Golgi
(Khan et al., 2013). An interesting example is that of the activation of protein kinase D (PKD). PKD is a
resident membrane of the Golgi (Jamora et al., 1997; Jamora et al., 1999) and gets activated by Gβγ subunits
which also play a role in anterograde traffic between the ER and the Golgi. Further research showed that
PLCβ3 is activated by Gβγ in the TGN which then activates PKCη and subsequently activating TGN-
resident PKD (Diaz Anel and Malhotra, 2005). It was also shown that PKD is recruited to the Golgi by Gβγ
and that such recruitment of Gβγ led to formation of Golgi tubules (Irannejad and Wedegaertner, 2010).
Considerable steps have already been taken to unravel the mystery whether GPCRs activate G-proteins at
the Golgi/TGN. It was shown for the M3-muscarinic receptor, that upon activation, the Gβγ subunits
translocate from the cell membrane to the Golgi which induced vesicle formation (Ajith Karunarathne et
al., 2012; O'Neill et al., 2012; Saini et al., 2010). It has already been mentioned that the S1PR translocates
to the Golgi where it is presumed to show intracellular signaling in the presence of FTY720P (Müllershausen
et al., 2009). This might also hint that the S1PR might be activating G-proteins at the Golgi (Müllershausen
et al., 2009).
When the biosensor for active Gs conformation and the marker for TGN were expressed in primary
mouse thyroid cells and stimulated with TSH-Alexa647, there was translocation of the TSH/TSHR from an
endocytic compartment followed by Gs activation as seen by translocation of Nb37 (Figure 4.7g inset 2).
These data provide a strong evidence that the TGN is one of the platform for intracellular signaling in
primary mouse thyroid cells.

86
5.7 cAMP and PKA signaling at the Golgi/TGN
The cAMP/PKA cascade originating from the cell surface is an important downstream signaling
cascade that is strictly regulated, both temporally and spatially. This regulation allows signal transduction
of external factors, for example agonists or antagonists (Mayinger, 2011). However, early studies have well
documented intracellular localization of heterotrimeric G-proteins, adenylyl cyclases and PKA isoforms at
sites other than the cell surface, for example, and notably, at the Golgi (Cheng and Farquhar, 1976; Diaz
Anel and Malhotra, 2005; Jamora et al., 1999; Mavillard et al., 2010; Muniz et al., 1996; Muniz et al., 1997;
Nigg et al., 1985). It is also known that A-kinase anchoring protein (AKAP) binds to the regulatory (R)
subunits of PKA (Wong and Scott, 2004) followed by recruitment of the holoenzyme to the Golgi. cAMP
binds to the C-subunit thus activating PKA as a result of which the two subunits dissociate (Li et al., 2003;
Shanks et al., 2002). Nonetheless, Golgi acts as a resident intracellular pool for a significant population of
PKA. It has also been suggested that post stimulation of AC, the catalytic subunit of PKA translocates from
the Golgi to the nucleus thus raising an explanation for the transmission of signaling events occurring at the
plasma membrane to gene transcription in the nucleus. Evidence also exists which shows that cAMP
production and PKA activation at the Golgi play an important role in regulating anterograde transport at the
Golgi and also Golgi morphology (Mayinger, 2011).
Novel studies on the KDEL receptor (KDELR) have brought to light the importance of signaling at
the Golgi (Cancino et al., 2014; Cancino and Luini, 2013; Giannotta et al., 2012). The KDEL receptor
belongs to the PQ-loop protein family of receptors. Activation of the KDEL receptor is brought about by
the transport of chaperone proteins from the ER to the Golgi. These chaperone proteins possess a KDEL
binding domain at their C-terminus and this domain acts as a ligand for the KDELR. Upon activation, the
KDELR binds and activates the Golgi-residing pool of Gs and Gq proteins. Gs proteins then further activate
adenylyl cyclase 9 (AC9) followed by production of cAMP (Cancino et al., 2014). cAMP production is
accompanied by PDE7A1-mediated degradation of the same so that cAMP is concentrated at the Golgi
(Cancino et al., 2014). This locally concentrated cAMP leads to a controlled activation of Golgi-resident
PKA which then further phosphorylates a variety of Golgi proteins as well as cytosolic proteins (Cancino
et al., 2014). A majority of these activated proteins are related to the actin skeleton (Cancino et al., 2014)
which then further promote retrograde transport. A protein of interest that is phosphorylated by the KDELR-
Gs-PKA pathway is cAMP response element binding protein 1 (CREB1) (Cancino et al., 2014). It is known
that activated PKA translocates to the nucleus and activates CREB1 on its serine residue (Ser133). In this
case it was found that CREB1 phosphorylation led to upregulation of ca. 1,300 genes which were related to
mostly biogenesis of organelles, protein folding, metabolism, cell cycle, actin skeleton, protein kinase

87
cascades (Cancino et al., 2014). Thus it is noteworthy that an entire Gs-PKA signaling cascade exists at the
Golgi.
From the above example and the anterograde transport of Gs proteins and PKA from the Golgi, it
is justifiable to assume that the residing pools of Gs proteins, adenylyl cyclases and PKA at the Golgi is
available for GPCR activation. It has already been shown that the S1PR receptor which shows persistent
signaling when bound to the FTY720P agonist traffics through the TGN where the authors believe is the
site for the observed persistent signaling (Müllershausen et al., 2009). In the present study, TSH/TSHR
complexes traffic via the TGN (Figure 4.5) and meet the resident population of Gs proteins at the Golgi
(Calebiro et al., 2009). Real time FRET experiments in primary thyroid cells isolated from transgenic Epac1-
camps mice showed that cAMP responses are attenuated under Golgi collapse brought about by BFA
(Figure 4.10a). From the above data and literature, it is evident that Golgi/TGN is one of the sites for cAMP
and PKA production. The same is extrapolated for CREB phosphorylation (Figure 10c). In the presence of
BFA (Figure 4.10c), CREB phosphorylation is significantly reduced which shows that not only are the cell
membrane and Golgi/TGN the two main compartments for TSH/TSHR signaling, but also that it is relevant
with respect to activation of transcription factors in a highly biological model.

88
5.8 A new model for internalized TSH/TSHR signaling at the TGN
Based on the experimental data obtained in this study this section describes a new model for
retrograde trafficking and signaling of internalized TSH/TSHR complexes (Figure 5.2).
Upon binding of the agonist, TSH, to TSHR, TSH/TSHR complexes internalize and enter the
endocytic pathway via early endosomes. A significant portion of this internalized population is guided by
the retromer complex to enter the retrograde pathway at the TGN. At the TGN, these TSH/TSHR complexes
meet the resident pool of Gs and PKA (presumably on account of anterograde/retrograde routes for resident
Gs and PKA from Golgi to the TGN) and activate it (Figure 5.2a). The compartment responsible for
intracellular Gs protein signaling by internalized TSH/TSHR is presumably an intermediate compartment
upstream of the TGN (a sorting endosome which is positive for the retromer complex) and the TGN (Figure
5.2a).
Ligand/receptor internalization and retrograde route via the TGN are crucial for the multiple PKA
waves. The first wave has its origin at the cell surface. The second and third wave come from the reorganized
TGN but with a temporal resolution. This can be explained in the following way: BFA induces Golgi
collapse as a result of which the Golgi membranes are absorbed into the ER. Anterograde transport outward
from the Golgi to the TGN is also brought to a halt. The TGN on the other hand has been shown to fuse
with the endocytic pathway to form a new TGN/endocytic network which appropriately recycles or degrades
cargo. A similar thing can be assumed to be happening in primary mouse thyroid cells. While a significant
fraction of the resident pool of Gs proteins and PKA go with the Golgi to the ER, a small but limited fraction
stays with the TGN. In a BFA-induced Golgi collapse, the internalized TSH/TSHR complexes are now in
this new TGN/endocytic network. The second wave of PKA response is most probably from the above
mentioned intermediate compartment that is between the sorting endosome and the TGN. The third slower
PKA wave comes from the newly formed TGN/endocytic network but is slowed down due to limited
availability of the Gs/PKA pool. Nonetheless, reorganization of the TGN significantly attenuated CREB
phosphorylation providing evidence that not only internalization but also an intact Golgi/TGN is crucial for
downstream effects of intracellular Gs and PKA signaling. Thus the retrograde trafficking and intracellular
signaling at the Golgi/TGN of internalized TSH/TSHR complexes have a physiological importance.

89
Figure 5.2 Model of intracellular TSH/TSHR retrograde trafficking and intracellular signaling: (a)
Representative events showing the dynamic association between vesicles containing TSH/TSHR complexes
and retromer subunit Vps29, Gs proteins and Nb37 which is a part of the TGN. The events are shown in
split channels to emphasize the movement of the TSH/TSHR complexes into the compartment containing Gs
proteins and Nb37. Bottom panel, a schematic representation of how the dynamic association is responsible
for Gs signaling as visualized by Nb37. (b) A schematic representation of the intracellular signaling by
internalized TSH/TSHR. The 1st phase of PKA signaling originates from the cell surface. BFA treatment
leads to the 2nd and a 3rd phase of PKA signaling. BFA treatment significantly attenuated CREB
phosphorylation providing evidence that an intact Golgi/TGN are crucial for intracellular cAMP, PKA
signaling, CREB phosphorylation and subsequent gene transcription. Figure 5.2b kindly provided by
Davide Calebiro.

90
6 Outlook
This study provides the direct evidence of Gs protein activation of internalized TSH/TSHR complexes
at the TGN and the biological relevance of cAMP/PKA signaling at the Golgi/TGN. This study also sheds
some light on the microcompartmentalization of cAMP/PKA signaling and how their location can be a
crucial factor for effective downstream effects. In this regard, an interesting venture would be to use
compartment-specific cAMP/PKA sensors. While work has been done to characterize the cAMP and PKA
signaling specifically at the plasma membrane and in the cytosol, the next steps would be to look at signaling
in the nucleus and in the Golgi.
While the acute effects of BFA on Golgi/TGN organization have already been mentioned here, it would
be interesting to know the effects in primary mouse thyroid cells for example: 1) Does the fusion of TGN
with the endocytic pathway increase the recycling of internalized TSHR? 2) What are the effects on absolute
cAMP production from the Golgi? 3) What happens when primary mouse thyroid cells are given a chronic
BFA treatment?
Clathrin-independent endocytosis for GPCRs such as the α2a-adrenergic, β1-adrenergic, dopaminergic
D3 and D4, muscarinic acetylcholine receptor m4 has been reported (Boucrot et al., 2015; Renard et al.,
2015). This clathrin independent endocytosis is initiated immediately following agonist binding and
inhibited by dynamin inhibitors (Boucrot et al., 2015). This new fast mechanism recruits endophilin and is
termed as fast endophilin-mediated endocytosis (FEME) (Boucrot et al., 2015; Renard et al., 2015). It
possible that the TSHR internalization is mediated by this fast mechanism which enables it to reach the
TGN within 2 minutes to induce the 2nd PKA phase. It is also possible that the receptor recycles fast back
to the cell surface through the FEME pathway and produces the second wave again at the cell surface. It
would be of interest to investigate this at the level of the TSHR and see if it is capable of being bound by
endophilin and undergo FEME.
This study shows the acute treatment BFA attenuate cAMP signaling, PKA activation and CREB
phosphorylation. While the effect of BFA is specific to the Golgi, one cannot fully fathom how this affects
cell physiology in general in this present aspect. Hence it would be beneficial to have a FRET biosensor
which is localized at the Golgi to measure cAMP production and PKA activation. In the course of time,
preliminary experiments are already ongoing on newly generated Golgi localized cAMP and PKA sensors.
As has been mentioned before, the entire physiology of thyroid cells is under the control of the TSHR
and its agonist, TSH. TSHR signaling is connected to cell growth and proliferation. The next step to unravel
the effects of intracellular signaling of internalized TSH/TSHR will be to look at thyroglobulin uptake and

91
release of T3 and T4 into circulation. Regarding this, we have already procured pure thyroglobulin and
experiments can already be initiated where one looks at released T3 and T4 levels (by radioimmunoassay
or ELISA) in the presence of dynasore and BFA.
Dynasore has been used in this study to inhibit clathrin-mediated internalization (Macia et al., 2006).
While dynasore acts on the GTPase activity of dynamin, it is not entirely efficient and a small degree of
internalization does take place (unpublished data). As an alternative to this, one could try other dynamin
inhibitors like a high sucrose concertation or Dyngo-4a. Selective inhibition of internalization can also be
brought about by use of dominant negative dynamin mutants such as K44A and T65A. One could use the
adenoviral vectors that already exist for these mutants to achieve high transfection efficiency in primary
mouse thyroid cells. Silencing of βarr2 or clathrin heavy chain by siRNA is also an option. Since
desensitization brought about through phosphorylation of TSHR by GRKs precedes internalization, one
could also try to identify phosphorylation deficient mutants of TSHR. This would involve identification of
phosphorylation sites by site-directed mutagenesis coupled with 2D phosphopeptide mapping or proteomics.
This would be followed by generation of such clones, possibly FLAG-tagged clones for
immunoprecipitation and then characterization of their effects in primary mouse thyroid cells. A long term
project would involve generation of knock-in transgenic mice to observe effects in vivo. Use of dominant
negative early endosome markers (viz. Rab4 and Rab5), recycling endosomes (Rab11) and monensin can
also be used to further characterize the trafficking/recycling of internalized TSH/TSHR complexes in
context of BFA treatment, cAMP signaling and PKA activation.
Thyroid cells in humans express ca. 1,000 TSHR molecules on the cell surface (ref). While
overexpression of TSHR in primary mouse thyroid cells might produce some artificial results with respect
to signaling and trafficking, one could generate N-terminus tagged SNAP/CLIP versions of TSHR and
generate clones in thyroid cells lines such as in FRTL-5 (for example using the new CRISPR/Cas9
technology) or mouse models. Using the CRISPR/Cas9 technique, one will be able to hijack the endogenous
expression levels and study trafficking of a SNAP/CLIP fluorescently tagged TSHR in more physiological
contexts.
An interesting challenge would be to determine whether the cell type is responsible for the phenomenon
of persistent signaling and if so then which genes are the determinants. A suitable model would be FRTL-
5, a rat thyroid cell line. Specific knockdown of genes could be achieved by siRNA. To maximize efforts,
one could use a high throughput array to detect cAMP signal for example ELISA or a colorimetric output
on a plate reader. The experiment would involve treating cells with the siRNA for specific gene knockdown,
followed by stimulation by TSH in the presence and absence of dynasore. If there is no cAMP signal, then
the knocked down gene is a possible candidate contributing to persistent signaling.

92
7 Summary
G-protein coupled receptors (GPCRs) are expressed only in eukaryotes and comprise the largest and
the most varied family of cell membrane receptors. They respond to a broad range of stimuli which activate
various effectors to trigger downstream signaling cascades which are ultimately crucial for cell physiology.
Regulation of this ligand-mediated signal transduction is brought about by the desensitization of the GPCR
primarily by phosphorylation (catalyzed by GRKs) and secondarily by internalization of the GPCR. This
understanding that GPCRs signal for cAMP only at the cell surface and stop doing so once internalized was
challenged by pioneering independent studies on the TSHR and the PTHR where it was shown that not only
do they signal for cAMP at the cell surface but also when internalized into intracellular compartment(s).
This phenomenon of sustained signaling has since then been described for other GPCRs as well, most
notably 2-AR, V2R and the LHR. While it was shown that internalized TSHRs continue to signal for
cAMP, the compartment(s) responsible for this intracellular signaling was largely uncharacterized. Thus the
aim of this work was to characterize the trafficking of internalized TSH/TSHR complexes and the dynamic
nature of possible signaling compartments using real-time TIRF microscopy and the signaling by using real-
time FRET in primary mouse thyroid cells.
The present work reports that TSH/TSHR complexes co-internalize and a significant fraction, guided
by the retromer complex, enters the retrograde sorting pathway centered at the TGN. While these
internalized TSH/TSHR complexes do not co-internalize with Gs proteins or meet Gs proteins in early
endosomes, they meet the residing pool of Gs proteins in sorting endosomes and in the Golgi/TGN. Direct
evidence of Gs protein activation and signaling at the TGN and at the sorting endosomes was visualized
with the help of conformational biosensor nanobody, Nb37. The sequestration of Nb37 to these sites of Gs
signaling was seen as a scintillating behavior suggesting that Gs protein signaling is of quantal nature, both
in time and space. The catalytic subunit of PKA was found to be enriched at the Golgi/TGN and the
perturbation of Golgi/TGN in the presence of Brefeldin A resulted in the loss of Golgi localization of PKA.
Perturbation and reorganization of the TGN in the presence of Brefeldin A also resulted in a) an attenuated
cAMP response b) a triphasic PKA response characterized by a rapid 1st phase, a slow (significantly
attenuated) 2nd phase and a delayed 3rd phase and lastly c) attenuated CREB phosphorylation suggesting that
the reorganization of the TGN affects compartments responsible for intracellular cAMP and PKA signaling.
Taken together, these results provide evidence that the TGN is one of the compartments responsible for
sustained signaling by internalized GPCRs and provides a mechanism to explain the biological relevance of
cAMP/PKA signaling at the TGN by internalized GPCRs.

93
8 Zusammenfassung
G-Protein-gekoppelte Rezeptoren sind nur in Eukaryonten vorhandeln und bilden die größte und
diverseste Familie von Zellmembranrezeptoren. Sie reagieren auf eine vielfältige Gruppe von Stimuli die
verschiedene Effektoren aktivieren und damit nachgelagerte Signalkaskaden auslösen, die letztlich
entscheidend für die Zellphysiologie sind. Die Regelung der Ligand-vermittelten Signaltransduktion wird
hauptsächlich durch die Desensibilisierung des GPCR mittels Dephosphorylierung (katalysiert durch GRK)
und zusätzlich durch Internalisierung des GPCR gesteuert. Die Annahme, dass GPCRs für cAMP nur an
der Zellmembran signalisieren und nicht mehr sobald sie in die Zelle internalisiert wurden, konnte durch
wegweisende unabhängige Forschung an GPCRs im Besonderen an TSHR und PTHR geändert werden. So
konnte gezeigt werden, dass sie für cAMP nicht nur an der Zellmembran signalisieren, sondern auch, wenn
sie in intrazelluläre Zellkompartimente internalisiert wurde. Dieses Phänomen („sustained signaling“ hier
„anhaltende Signalisierung“) wurde seitdem für andere GPCRs (z.B. 2-AR, V2R und LHR) beschrieben.
Aber die Zellkompartimente wurden für nachhaltige intrazelluläre Signale nicht ausreichend charakterisiert.
Das Ziel dieser Arbeit war es die Bewegung und die dynamische Natur der möglichen signalisierenden
Kompartimente mittels „real-time TIRF“-Mikroskopie und die Signalisierung unter Verwendung von „real-
time FRET“ in primären Maus Schilddrüsenzellen zu untersuchen.
Die vorliegende Arbeit berichtet, dass TSH/TSHR Komplexe internalisieren und ein signifikanter Teil,
welcher vom Retromer Komplex angeführt wird, gelangt über den retrograden (rückwärts gerichteten)
Transport in das trans-Golgi-Netzwerk (TGN). Diese TSH/TSHR-Komplexe treffen nicht in den frühen
Endosomen auf die Gs-Proteine, sondern in den „Sortierer Endosomen“ und in dem TGN. Ein direkter
Beweis für Gs Protein Aktivierung und Signaltransduktion am TGN und in Sortierer Endosomen konnte
mittels des nanobody Nb37, einem spezifischen Biosensor für das aktive Gs Protein, erbracht werden. Es
konnte gezeigt werden, dass die Sequestrierung von Nb37 an diesen Kompartimenten ein szintillierendes
Verhalten in Zeit und Raum zeigt. Die vorliegende Arbeit zeigt, dass die katalytische Untereinheit der PKA
am Golgi/TGN angereichert ist. Die Behandlung mit Brefeldin A führt zum Verlust dieser PKA Lokalisation
am Golgi. Die Beschädigung und Reorganisation des TGN durch Brefeldin A führt zu a) einer
abgeschwächten cAMP Reaktion b) einer dreiphasigen PKA Reaktion charakterisiert durch eine schnelle
erste Phase, eine langsame (deutlich abgeschwächte) zweite Phase und eine verzögerte dritte Phase und
schließlich c) einer abgeschwächte CREB Phosphorylierung. Es gibt Anzeichen dafür, dass die
Reorganisation des TGN Kompartimente betrifft, die verantwortlich für intrazelluläre cAMP- und PKA-
Signalisierung sind. Zusammenfassend lässt sich sagen, dass das TGN eines der Kompartimente ist, das für
die anhaltende TSHR-Signalisierung verantwortlich ist.

94
9 Annex
9.1 Circular plasmid maps
1. YFP tagged human TSH receptor
2. EYFP tagged GS

95
3. mRFP1 tagged TGN marker, ST
4. EYFP tagged nanobody Nb37
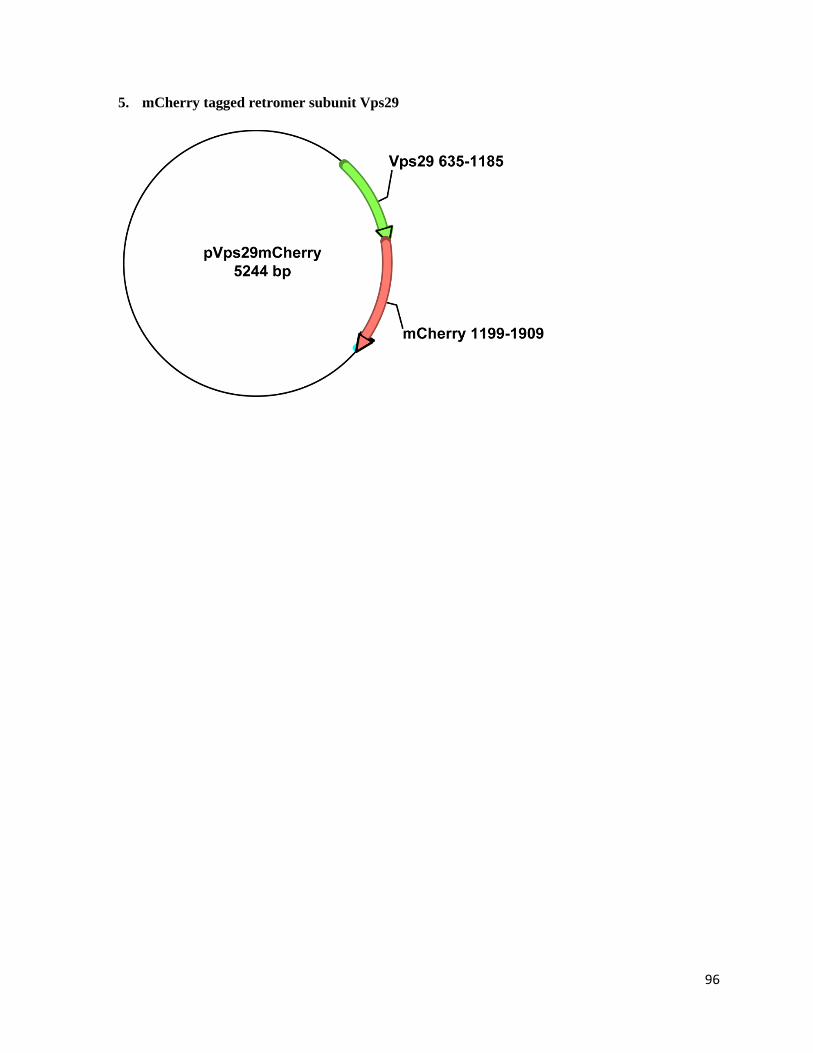
96
5. mCherry tagged retromer subunit Vps29

97
9.2 Videos
Video 1 Retrograde accumulation of internalized TSH/TSHR complexes via the TGN: A representative
image sequence which shows the accumulation of TSH/TSHR complexes (magenta) in the TGN (green).
This video corresponds to figure 4.5a. Frames were acquired every 5 s and playback shown is here with an
accelerated speed of 10 fps.
Video 2 Fusion of TSH/TSHR containing vesicles with that of the TGN: A representative image sequence
which shows that the retrograde sorting of TSH/TSHR complexes occurs via fusion of vesicles containing
TSH/TSHR complexes (magenta) with that of the TGN (green). The image sequence corresponds to the inset
shown in Figure 4.5c. Frames were acquired every 5 s and playback is with an accelerate speed of 10 fps.
Video 3 Dynamics of TSH/TSHR complexes and Gs protein: A representative image sequence that shows
the dynamic nature of vesicles containing TSH/TSHR complexes (magenta) and Gs protein, Gs-YFP (green).
The video shows how the vesicles fuse and split and dance around the cell. Frames were acquired 3 s and
playback is with an accelerate speed of 5 fps.
Video 4 Interaction with TSH/TSHR complexes results in Nb37-YFP enhancement: A representative
image sequence showing two consecutive events during which TSH/TSHR complexes (magenta) meet a
vesicle marked by Nb37-YFP (green). This meeting is followed by an enhancement of the Nb37-YFP signal.
The video corresponds to the time series shown in Figure 4.7c. Frames were acquired every 5 s and
playback is with an accelerated speed of 5 fps.
Video 5 TSH/TSHR mediated Gs signaling at the TGN: A representative image sequence showing the
entry of TSH/TSHR complexes (red) into the TGN (blue) followed by recruitment of Nb37-YFP (green). The
video corresponds to Figure 4.7g (inset 2) Frames were acquired every 5 s and playback is accelerated with
speed of 5 fps.
Video 6 Reorganization of the TGN in the presence of BFA: A representative image sequence showing
the collapse of the TGN structure marked by the TGN marker, ST-RFP (red) upon addition of BFA. The

98
collapse of Golgi/TGN is followed by the reorganization of the TGN which now looks like a concentrated
hub of tubules in the perinuclear area. Frames were acquired every 6 s and the playback is accelerated with
a speed of 5 fps.
Video 7 3D reconstruction of PKA RII at the Golgi: Primary mouse thyroid cells were fixed and the PKA
RII subunit (green) and the Golgi marker, GOLPH4 (magenta), were visualized by immunofluoroscence.
Shown here is a representative 3D projection of a z-stack. A majority of the PKA RII is associated with
the Golgi. Also note the association of PKA RII with the Golgi in the form of an anchored protein.
Video 8 3D reconstruction of PKA RII at the TGN: Primary mouse thyroid cells were fixed and the PKA
RII subunit (green) and the TGN marker, TGN46 (magenta), were visualized by immunofluoroscence.
Shown here is a representative 3D projection of a z-stack. While most of the PKA RII subunits seem to be
associated with the Golgi, as shown in Video 7, note the limited association of PKA RII with the TGN.

99
10 References
Ajith Karunarathne, W. K., O'Neill, P. R., Martinez-Espinosa, P. L., Kalyanaraman, V. and
Gautam, N. (2012). All G protein complexes are capable of translocation on receptor activation.
Biochem Biophys Res Commun 421, 605-11.
Allgeier, A., Offermanns, S., Van Sande, J., Spicher, K., Schultz, G. and Dumont, J. E. (1994).
The human thyrotropin receptor activates G-proteins Gs and Gq/11. J Biol Chem 269, 13733-5.
Aoe, T., Cukierman, E., Lee, A., Cassel, D., Peters, P. J. and Hsu, V. W. (1997). The KDEL
receptor, ERD2, regulates intracellular traffic by recruiting a GTPase-activating protein for ARF1. EMBO
J 16, 7305-16.
Ascoli, M. (1982a). Internalization and degradation of receptor-bound human choriogonadotropin
in Leydig tumor cells. Fate of the hormone subunits. J Biol Chem 257, 13306-11.
Ascoli, M. (1982b). Receptor-mediated uptake and degradation of human chorionic gonadotropin:
fate of the hormone subunits. Ann N Y Acad Sci 383, 151-73.
Ascoli, M. (1984). Lysosomal accumulation of the hormone-receptor complex during receptor-
mediated endocytosis of human choriogonadotropin. J Cell Biol 99, 1242-50.
Audebert, S., Navarro, C., Nourry, C., Chasserot-Golaz, S., Lecine, P., Bellaiche, Y., Dupont,
J. L., Premont, R. T., Sempere, C., Strub, J. M. et al. (2004). Mammalian Scribble forms a tight complex
with the PIX exchange factor. Curr Biol 14, 987-95.
Avivi, A., Tramontano, D., Ambesi-Impiombato, F. S. and Schlessinger, J. (1981). Adenosine
3',5'-monophosphate modulates thyrotropin receptor clustering and thyrotropin activity in culture. Science
214, 1237-9.
Avivi, A., Tramontano, D., Ambesi-Impiombato, F. S. and Schlessinger, J. (1982). Direct
visualization of membrane clustering and endocytosis of thyrotropin into cultured thyroid cells. Mol Cell
Endocrinol 25, 55-71.
Axelrod, D. (1981). Cell-substrate contacts illuminated by total internal reflection fluorescence. J
Cell Biol 89, 141-5.
Baratti-Elbaz, C., Ghinea, N., Lahuna, O., Loosfelt, H., Pichon, C. and Milgrom, E. (1999).
Internalization and recycling pathways of the thyrotropin receptor. Mol Endocrinol 13, 1751-65.
Bernard, V., Decossas, M., Liste, I. and Bloch, B. (2006). Intraneuronal trafficking of G-protein-
coupled receptors in vivo. Trends Neurosci 29, 140-7.
Bloch, B., Dumartin, B. and Bernard, V. (1999). In vivo regulation of intraneuronal trafficking
of G protein-coupled receptors for neurotransmitters. Trends Pharmacol Sci 20, 315-9.
100
Bonifacino, J. S. and Rojas, R. (2006). Retrograde transport from endosomes to the trans-Golgi
network. Nat Rev Mol Cell Biol 7, 568-79.
Borner, S., Schwede, F., Schlipp, A., Berisha, F., Calebiro, D., Lohse, M. J. and Nikolaev, V.
O. (2011). FRET measurements of intracellular cAMP concentrations and cAMP analog permeability in
intact cells. Nat Protoc 6, 427-38.
Bos, J. L. (2003). Epac: a new cAMP target and new avenues in cAMP research. Nat Rev Mol Cell
Biol 4, 733-8.
Boucrot, E., Ferreira, A. P., Almeida-Souza, L., Debard, S., Vallis, Y., Howard, G., Bertot, L.,
Sauvonnet, N. and McMahon, H. T. (2015). Endophilin marks and controls a clathrin-independent
endocytic pathway. Nature 517, 460-5.
Boutin, A., Allen, M. D., Geras-Raaka, E., Huang, W., Neumann, S. and Gershengorn, M. C.
(2011). Thyrotropin receptor stimulates internalization-independent persistent phosphoinositide signaling.
Mol Pharmacol 80, 240-6.
Brüser, A., Schulz, A., Rothemund, S., Ricken, A., Calebiro, D., Kleinau, G. and Schoneberg,
T. (2016). The Activation Mechanism of Glycoprotein Hormone Receptors with Implications in the Cause
and Therapy of Endocrine Diseases. J Biol Chem 291, 508-20.
Buch, T. R., Biebermann, H., Kalwa, H., Pinkenburg, O., Hager, D., Barth, H., Aktories, K.,
Breit, A. and Gudermann, T. (2008). G13-dependent activation of MAPK by thyrotropin. J Biol Chem
283, 20330-41.
Calebiro, D., de Filippis, T., Lucchi, S., Covino, C., Panigone, S., Beck-Peccoz, P., Dunlap, D.
and Persani, L. (2005). Intracellular entrapment of wild-type TSH receptor by oligomerization with
mutants linked to dominant TSH resistance. Hum Mol Genet 14, 2991-3002.
Calebiro, D., de Filippis, T., Lucchi, S., Martinez, F., Porazzi, P., Trivellato, R., Locati, M.,
Beck-Peccoz, P. and Persani, L. (2006). Selective modulation of protein kinase A I and II reveals distinct
roles in thyroid cell gene expression and growth. Mol Endocrinol 20, 3196-211.
Calebiro, D., Gelmini, G., Cordella, D., Bonomi, M., Winkler, F., Biebermann, H., de Marco,
A., Marelli, F., Libri, D. V., Antonica, F. et al. (2012). Frequent TSH receptor genetic alterations with
variable signaling impairment in a large series of children with nonautoimmune isolated
hyperthyrotropinemia. J Clin Endocrinol Metab 97, E156-60.
Calebiro, D., Godbole, A., Lyga, S. and Lohse, M. J. (2015). Trafficking and function of GPCRs
in the endosomal compartment. Methods Mol Biol 1234, 197-211.
Calebiro, D., Nikolaev, V. O., Gagliani, M. C., de Filippis, T., Dees, C., Tacchetti, C., Persani,
L. and Lohse, M. J. (2009). Persistent cAMP-signals triggered by internalized G-protein-coupled receptors.
PLoS Biol 7, e1000172.

101
Calebiro, D., Nikolaev, V. O. and Lohse, M. J. (2010a). Imaging of persistent cAMP signaling
by internalized G protein-coupled receptors. J Mol Endocrinol 45, 1-8.
Calebiro, D., Nikolaev, V. O., Persani, L. and Lohse, M. J. (2010b). Signaling by internalized
G-protein-coupled receptors. Trends Pharmacol Sci 31, 221-8.
Cancino, J., Capalbo, A., Di Campli, A., Giannotta, M., Rizzo, R., Jung, J. E., Di Martino, R.,
Persico, M., Heinklein, P., Sallese, M. et al. (2014). Control systems of membrane transport at the interface
between the endoplasmic reticulum and the Golgi. Dev Cell 30, 280-94.
Cancino, J. and Luini, A. (2013). Signaling circuits on the Golgi complex. Traffic 14, 121-34.
Chen, W. J., Goldstein, J. L. and Brown, M. S. (1990). NPXY, a sequence often found in
cytoplasmic tails, is required for coated pit-mediated internalization of the low density lipoprotein receptor.
J Biol Chem 265, 3116-23.
Cheng, H. and Farquhar, M. G. (1976). Presence of adenylate cyclase activity in Golgi and other
fractions from rat liver. II. Cytochemical localization within Golgi and ER membranes. J Cell Biol 70, 671-
84.
Cheng, S. B., Graeber, C. T., Quinn, J. A. and Filardo, E. J. (2011a). Retrograde transport of
the transmembrane estrogen receptor, G-protein-coupled-receptor-30 (GPR30/GPER) from the plasma
membrane towards the nucleus. Steroids 76, 892-6.
Cheng, S. B., Quinn, J. A., Graeber, C. T. and Filardo, E. J. (2011b). Down-modulation of the
G-protein-coupled estrogen receptor, GPER, from the cell surface occurs via a trans-Golgi-proteasome
pathway. J Biol Chem 286, 22441-55.
Claing, A., Perry, S. J., Achiriloaie, M., Walker, J. K., Albanesi, J. P., Lefkowitz, R. J. and
Premont, R. T. (2000). Multiple endocytic pathways of G protein-coupled receptors delineated by GIT1
sensitivity. Proc Natl Acad Sci U S A 97, 1119-24.
Collins, B. M. (2008). The structure and function of the retromer protein complex. Traffic 9, 1811-
22.
Collins, B. M., Norwood, S. J., Kerr, M. C., Mahony, D., Seaman, M. N., Teasdale, R. D. and
Owen, D. J. (2008). Structure of Vps26B and mapping of its interaction with the retromer protein complex.
Traffic 9, 366-79.
Csaba, Z. and Dournaud, P. (2007). Activated somatostatin type 2 receptors traffic in vivo from
dendrites to the trans-Golgi network. Ideggyogy Sz 60, 136-9.
Csaba, Z., Lelouvier, B., Viollet, C., El Ghouzzi, V., Toyama, K., Videau, C., Bernard, V. and
Dournaud, P. (2007). Activated somatostatin type 2 receptors traffic in vivo in central neurons from
dendrites to the trans Golgi before recycling. Traffic 8, 820-34.
Csaba, Z., Peineau, S. and Dournaud, P. (2012). Molecular mechanisms of somatostatin receptor
trafficking. J Mol Endocrinol 48, R1-12.

102
Daaka, Y., Luttrell, L. M., Ahn, S., Della Rocca, G. J., Ferguson, S. S., Caron, M. G. and
Lefkowitz, R. J. (1998). Essential role for G protein-coupled receptor endocytosis in the activation of
mitogen-activated protein kinase. J Biol Chem 273, 685-8.
De Matteis, M. A. and Luini, A. (2008). Exiting the Golgi complex. Nat Rev Mol Cell Biol 9, 273-
84.
de Rooij, J., Zwartkruis, F. J., Verheijen, M. H., Cool, R. H., Nijman, S. M., Wittinghofer, A.
and Bos, J. L. (1998). Epac is a Rap1 guanine-nucleotide-exchange factor directly activated by cyclic AMP.
Nature 396, 474-7.
Deborde, S., Perret, E., Gravotta, D., Deora, A., Salvarezza, S., Schreiner, R. and Rodriguez-
Boulan, E. (2008). Clathrin is a key regulator of basolateral polarity. Nature 452, 719-23.
Deora, A. A., Diaz, F., Schreiner, R. and Rodriguez-Boulan, E. (2007). Efficient electroporation
of DNA and protein into confluent and differentiated epithelial cells in culture. Traffic 8, 1304-12.
Diaz Anel, A. M. and Malhotra, V. (2005). PKC is required for - and PKD-mediated
transport to the cell surface and the organization of the Golgi apparatus. J Cell Biol 169, 83-91.
Dohlman, H. G., Thorner, J., Caron, M. G. and Lefkowitz, R. J. (1991). Model systems for the
study of seven-transmembrane-segment receptors. Annu Rev Biochem 60, 653-88.
Eaton, S. (2008). Retromer retrieves wntless. Dev Cell 14, 4-6.
Feinstein, T. N., Wehbi, V. L., Ardura, J. A., Wheeler, D. S., Ferrandon, S., Gardella, T. J.
and Vilardaga, J. P. (2011). Retromer terminates the generation of cAMP by internalized PTH receptors.
Nat Chem Biol 7, 278-84.
Feinstein, T. N., Yui, N., Webber, M. J., Wehbi, V. L., Stevenson, H. P., King, J. D., Jr.,
Hallows, K. R., Brown, D., Bouley, R. and Vilardaga, J. P. (2013). Noncanonical control of vasopressin
receptor type 2 signaling by retromer and arrestin. J Biol Chem 288, 27849-60.
Feliciello, A., Gallo, A., Mele, E., Porcellini, A., Troncone, G., Garbi, C., Gottesman, M. E.
and Avvedimento, E. V. (2000). The localization and activity of cAMP-dependent protein kinase affect
cell cycle progression in thyroid cells. J Biol Chem 275, 303-11.
Feliciello, A., Giuliano, P., Porcellini, A., Garbi, C., Obici, S., Mele, E., Angotti, E., Grieco, D.,
Amabile, G., Cassano, S. et al. (1996). The v-Ki-Ras oncogene alters cAMP nuclear signaling by
regulating the location and the expression of cAMP-dependent protein kinase IIbeta. J Biol Chem 271,
25350-9.
Ferrandon, S., Feinstein, T. N., Castro, M., Wang, B., Bouley, R., Potts, J. T., Gardella, T. J.
and Vilardaga, J. P. (2009). Sustained cyclic AMP production by parathyroid hormone receptor
endocytosis. Nat Chem Biol 5, 734-42.

103
Freedman, N. J., Liggett, S. B., Drachman, D. E., Pei, G., Caron, M. G. and Lefkowitz, R. J.
(1995). Phosphorylation and desensitization of the human beta 1-adrenergic receptor. Involvement of G
protein-coupled receptor kinases and cAMP-dependent protein kinase. J Biol Chem 270, 17953-61.
Frenzel, R., Voigt, C. and Paschke, R. (2006). The human thyrotropin receptor is predominantly
internalized by -arrestin 2. Endocrinology 147, 3114-22.
Ghinea, N., Vu Hai, M. T., Groyer-Picard, M. T., Houllier, A., Schoevaert, D. and Milgrom,
E. (1992). Pathways of internalization of the hCG/LH receptor: immunoelectron microscopic studies in
Leydig cells and transfected L-cells. J Cell Biol 118, 1347-58.
Ghosh, P., Dahms, N. M. and Kornfeld, S. (2003). Mannose 6-phosphate receptors: new twists in
the tale. Nat Rev Mol Cell Biol 4, 202-12.
Giannotta, M., Ruggiero, C., Grossi, M., Cancino, J., Capitani, M., Pulvirenti, T., Consoli, G.
M., Geraci, C., Fanelli, F., Luini, A. et al. (2012). The KDEL receptor couples to Gq/11 to activate Src
kinases and regulate transport through the Golgi. EMBO J 31, 2869-81.
Giordano, F., Bonetti, C., Surace, E. M., Marigo, V. and Raposo, G. (2009). The ocular albinism
type 1 (OA1) G-protein-coupled receptor functions with MART-1 at early stages of melanogenesis to
control melanosome identity and composition. Hum Mol Genet 18, 4530-45.
Glick, B. S. and Luini, A. (2011). Models for Golgi traffic: a critical assessment. Cold Spring Harb
Perspect Biol 3, a005215.
Graves, P. N., Vlase, H., Bobovnikova, Y. and Davies, T. F. (1996). Multimeric complex
formation by the thyrotropin receptor in solubilized thyroid membranes. Endocrinology 137, 3915-20.
Gray, H. (1918). Anatomy of the Human Body.
Guan, R., Wu, X., Feng, X., Zhang, M., Hebert, T. E. and Segaloff, D. L. (2010). Structural
determinants underlying constitutive dimerization of unoccupied human follitropin receptors. Cell Signal
22, 247-56.
Guo, Y., Sirkis, D. W. and Schekman, R. (2014). Protein sorting at the trans-Golgi network. Annu
Rev Cell Dev Biol 30, 169-206.
Hamers-Casterman, C., Atarhouch, T., Muyldermans, S., Robinson, G., Hamers, C., Songa,
E. B., Bendahman, N. and Hamers, R. (1993). Naturally occurring antibodies devoid of light chains.
Nature 363, 446-8.
Haraguchi, K., Saito, T., Kaneshige, M., Endo, T. and Onaya, T. (1994). Desensitization and
internalization of a thyrotrophin receptor lacking the cytoplasmic carboxy-terminal region. J Mol
Endocrinol 13, 283-8.

104
Hein, P., Rochais, F., Hoffmann, C., Dorsch, S., Nikolaev, V. O., Engelhardt, S., Berlot, C. H.,
Lohse, M. J. and Bunemann, M. (2006). Gs activation is time-limiting in initiating receptor-mediated
signaling. J Biol Chem 281, 33345-51.
Hewavitharana, T. and Wedegaertner, P. B. (2012). Non-canonical signaling and localizations
of heterotrimeric G proteins. Cell Signal 24, 25-34.
Houndolo, T., Boulay, P. L. and Claing, A. (2005). G protein-coupled receptor endocytosis in
ADP-ribosylation factor 6-depleted cells. J Biol Chem 280, 5598-604.
Hsu, D., Knudson, P. E., Zapf, A., Rolband, G. C. and Olefsky, J. M. (1994). NPXY motif in
the insulin-like growth factor-I receptor is required for efficient ligand-mediated receptor internalization
and biological signaling. Endocrinology 134, 744-50.
Iacovelli, L., Franchetti, R., Masini, M. and De Blasi, A. (1996). GRK2 and -arrestin 1 as
negative regulators of thyrotropin receptor-stimulated response. Mol Endocrinol 10, 1138-46.
Innamorati, G., Piccirillo, R., Bagnato, P., Palmisano, I. and Schiaffino, M. V. (2006). The
melanosomal/lysosomal protein OA1 has properties of a G protein-coupled receptor. Pigment Cell Res 19,
125-35.
Irannejad, R., Tomshine, J. C., Tomshine, J. R., Chevalier, M., Mahoney, J. P., Steyaert, J.,
Rasmussen, S. G., Sunahara, R. K., El-Samad, H., Huang, B. et al. (2013). Conformational biosensors
reveal GPCR signalling from endosomes. Nature 495, 534-8.
Irannejad, R. and Wedegaertner, P. B. (2010). Regulation of constitutive cargo transport from
the trans-Golgi network to plasma membrane by Golgi-localized G protein subunits. J Biol Chem 285,
32393-404.
Jamora, C., Takizawa, P. A., Zaarour, R. F., Denesvre, C., Faulkner, D. J. and Malhotra, V.
(1997). Regulation of Golgi structure through heterotrimeric G proteins. Cell 91, 617-26.
Jamora, C., Yamanouye, N., Van Lint, J., Laudenslager, J., Vandenheede, J. R., Faulkner, D.
J. and Malhotra, V. (1999). G-mediated regulation of Golgi organization is through the direct activation
of protein kinase D. Cell 98, 59-68.
Jiang, X., Liu, H., Chen, X., Chen, P. H., Fischer, D., Sriraman, V., Yu, H. N., Arkinstall, S.
and He, X. (2012). Structure of follicle-stimulating hormone in complex with the entire ectodomain of its
receptor. Proc Natl Acad Sci U S A 109, 12491-6.
Johannes, L. and Goud, B. (1998). Surfing on a retrograde wave: how does Shiga toxin reach the
endoplasmic reticulum? Trends Cell Biol 8, 158-62.
Johannes, L. and Popoff, V. (2008). Tracing the retrograde route in protein trafficking. Cell 135,
1175-87.

105
Kara, E., Crepieux, P., Gauthier, C., Martinat, N., Piketty, V., Guillou, F. and Reiter, E.
(2006). A phosphorylation cluster of five serine and threonine residues in the C-terminus of the follicle-
stimulating hormone receptor is important for desensitization but not for -arrestin-mediated ERK
activation. Mol Endocrinol 20, 3014-26.
Kero, J., Ahmed, K., Wettschureck, N., Tunaru, S., Wintermantel, T., Greiner, E., Schutz, G.
and Offermanns, S. (2007). Thyrocyte-specific Gq/G11 deficiency impairs thyroid function and prevents
goiter development. J Clin Invest 117, 2399-407.
Khan, S. M., Sleno, R., Gora, S., Zylbergold, P., Laverdure, J. P., Labbe, J. C., Miller, G. J.
and Hebert, T. E. (2013). The expanding roles of G subunits in G protein-coupled receptor signaling and
drug action. Pharmacol Rev 65, 545-77.
Kleinau, G. and Krause, G. (2009). Thyrotropin and Homologous Glycoprotein Hormone
Receptors: Structural and Functional Aspects of Extracellular Signaling Mechanisms. Endocrine Reviews
30, 133-151.
Kleinau, G., Neumann, S., Grüters, A., Krude, H. and Biebermann, H. (2013). Novel Insights
on Thyroid-Stimulating Hormone Receptor Signal Transduction. Endocrine Reviews 34, 691-724.
Klumperman, J. (2011). Architecture of the mammalian Golgi. Cold Spring Harb Perspect Biol
3.
Kotowski, S. J., Hopf, F. W., Seif, T., Bonci, A. and von Zastrow, M. (2011). Endocytosis
promotes rapid dopaminergic signaling. Neuron 71, 278-90.
Kreuchwig, A., Kleinau, G. and Krause, G. (2013). Research resource: novel structural insights
bridge gaps in glycoprotein hormone receptor analyses. Mol Endocrinol 27, 1357-63.
Kreuchwig, A., Kleinau, G., Kreuchwig, F., Worth, C. L. and Krause, G. (2011). Research
resource: Update and extension of a glycoprotein hormone receptors web application. Mol Endocrinol 25,
707-12.
Krishnamurthy, H., Kishi, H., Shi, M., Galet, C., Bhaskaran, R. S., Hirakawa, T. and Ascoli,
M. (2003). Postendocytotic trafficking of the follicle-stimulating hormone (FSH)-FSH receptor complex.
Mol Endocrinol 17, 2162-76.
Kuna, R. S., Girada, S. B., Asalla, S., Vallentyne, J., Maddika, S., Patterson, J. T., Smiley, D.
L., DiMarchi, R. D. and Mitra, P. (2013). Glucagon-like peptide-1 receptor-mediated endosomal cAMP
generation promotes glucose-stimulated insulin secretion in pancreatic beta-cells. Am J Physiol Endocrinol
Metab 305, E161-70.
Ladinsky, M. S., Mastronarde, D. N., McIntosh, J. R., Howell, K. E. and Staehelin, L. A.
(1999). Golgi structure in three dimensions: functional insights from the normal rat kidney cell. J Cell Biol
144, 1135-49.

106
Lahuna, O., Quellari, M., Achard, C., Nola, S., Meduri, G., Navarro, C., Vitale, N., Borg, J.
P. and Misrahi, M. (2005). Thyrotropin receptor trafficking relies on the hScrib-PIX-GIT1-ARF6
pathway. EMBO J 24, 1364-74.
Latif, R., Graves, P. and Davies, T. F. (2001). Oligomerization of the human thyrotropin receptor:
fluorescent protein-tagged hTSHR reveals post-translational complexes. J Biol Chem 276, 45217-24.
Latif, R., Graves, P. and Davies, T. F. (2002). Ligand-dependent inhibition of oligomerization at
the human thyrotropin receptor. J Biol Chem 277, 45059-67.
Latif, R., Michalek, K., Morshed, S. A. and Davies, T. F. (2010). A tyrosine residue on the TSH
receptor stabilizes multimer formation. PLoS ONE 5, e9449.
Laugwitz, K. L., Allgeier, A., Offermanns, S., Spicher, K., Van Sande, J., Dumont, J. E. and
Schultz, G. (1996). The human thyrotropin receptor: a heptahelical receptor capable of stimulating members
of all four G protein families. Proc Natl Acad Sci U S A 93, 116-20.
Li, H., Adamik, R., Pacheco-Rodriguez, G., Moss, J. and Vaughan, M. (2003). Protein kinase
A-anchoring (AKAP) domains in brefeldin A-inhibited guanine nucleotide-exchange protein 2 (BIG2). Proc
Natl Acad Sci U S A 100, 1627-32.
Lippincott-Schwartz, J., Glickman, J., Donaldson, J. G., Robbins, J., Kreis, T. E., Seamon, K.
B., Sheetz, M. P. and Klausner, R. D. (1991a). Forskolin inhibits and reverses the effects of brefeldin A
on Golgi morphology by a cAMP-independent mechanism. J Cell Biol 112, 567-77.
Lippincott-Schwartz, J., Yuan, L., Tipper, C., Amherdt, M., Orci, L. and Klausner, R. D.
(1991b). Brefeldin A's effects on endosomes, lysosomes, and the TGN suggest a general mechanism for
regulating organelle structure and membrane traffic. Cell 67, 601-16.
Lippincott-Schwartz, J., Yuan, L. C., Bonifacino, J. S. and Klausner, R. D. (1989). Rapid
redistribution of Golgi proteins into the ER in cells treated with brefeldin A: evidence for membrane cycling
from Golgi to ER. Cell 56, 801-13.
Lohse, M. J. (1993). Molecular mechanisms of membrane receptor desensitization. Biochim
Biophys Acta 1179, 171-88.
Lohse, M. J. and Calebiro, D. (2013). Cell biology: Receptor signals come in waves. Nature 495,
457-8.
Lyga, S. (2016). Doctoral dissertation titled "Glycoprotein hormone receptor signaling in the
endosomal compartment". Wuerzburg, Germany: University of Wuerzburg.
Lyga, S., Volpe, S., Werthmann, R. C., Gotz, K., Sungkaworn, T., Lohse, M. J. and Calebiro,
D. (2016). Persistent cAMP signaling by internalized LH receptors in ovarian follicles. Endocrinology,
en20151945.

107
Macia, E., Ehrlich, M., Massol, R., Boucrot, E., Brunner, C. and Kirchhausen, T. (2006).
Dynasore, a cell-permeable inhibitor of dynamin. Dev Cell 10, 839-50.
Maiellaro, I., Lohse, M. J., Kittel, R. J. and Calebiro, D. (2016). cAMP Signals in Drosophila
Motor Neurons Are Confined to Single Synaptic Boutons. Cell Rep 17, 1238-1246.
Mallard, F., Antony, C., Tenza, D., Salamero, J., Goud, B. and Johannes, L. (1998). Direct
pathway from early/recycling endosomes to the Golgi apparatus revealed through the study of Shiga toxin
B-fragment transport. J Cell Biol 143, 973-90.
Mavillard, F., Hidalgo, J., Megias, D., Levitsky, K. L. and Velasco, A. (2010). PKA-mediated
Golgi remodeling during cAMP signal transmission. Traffic 11, 90-109.
Maxfield, F. R. and McGraw, T. E. (2004). Endocytic recycling. Nat Rev Mol Cell Biol 5, 121-
32.
Mayinger, P. (2011). Signaling at the Golgi. Cold Spring Harb Perspect Biol 3.
Merriam, L. A., Baran, C. N., Girard, B. M., Hardwick, J. C., May, V. and Parsons, R. L.
(2013). Pituitary adenylate cyclase 1 receptor internalization and endosomal signaling mediate the pituitary
adenylate cyclase activating polypeptide-induced increase in guinea pig cardiac neuron excitability. J
Neurosci 33, 4614-22.
Mironov, A. A. and Beznoussenko, G. V. (2012). The kiss-and-run model of intra-Golgi transport.
Int J Mol Sci 13, 6800-19.
Mironov, A. A., Beznoussenko, G. V., Polishchuk, R. S. and Trucco, A. (2005). Intra-Golgi
transport: a way to a new paradigm? Biochim Biophys Acta 1744, 340-50.
Misumi, Y., Misumi, Y., Miki, K., Takatsuki, A., Tamura, G. and Ikehara, Y. (1986). Novel
blockade by brefeldin A of intracellular transport of secretory proteins in cultured rat hepatocytes. J Biol
Chem 261, 11398-403.
Mukherjee, S., Gurevich, V. V., Jones, J. C., Casanova, J. E., Frank, S. R., Maizels, E. T.,
Bader, M. F., Kahn, R. A., Palczewski, K., Aktories, K. et al. (2000). The ADP ribosylation factor
nucleotide exchange factor ARNO promotes -arrestin release necessary for luteinizing
hormone/choriogonadotropin receptor desensitization. Proc Natl Acad Sci U S A 97, 5901-6.
Müllershausen, F., Zecri, F., Cetin, C., Billich, A., Guerini, D. and Seuwen, K. (2009).
Persistent signaling induced by FTY720-phosphate is mediated by internalized S1P1 receptors. Nat Chem
Biol 5, 428-34.
Muniz, M., Alonso, M., Hidalgo, J. and Velasco, A. (1996). A regulatory role for cAMP-
dependent protein kinase in protein traffic along the exocytic route. J Biol Chem 271, 30935-41.

108
Muniz, M., Martin, M. E., Hidalgo, J. and Velasco, A. (1997). Protein kinase A activity is
required for the budding of constitutive transport vesicles from the trans-Golgi network. Proc Natl Acad Sci
U S A 94, 14461-6.
Nagayama, Y., Chazenbalk, G. D., Takeshita, A., Kimura, H., Ashizawa, K., Yokoyama, N.,
Rapoport, B. and Nagataki, S. (1994). Studies on homologous desensitization of the thyrotropin receptor
in 293 human embryonal kidney cells. Endocrinology 135, 1060-5.
Nagayama, Y. and Rapoport, B. (1992). The thyrotropin receptor 25 years after its discovery: new
insight after its molecular cloning. Mol Endocrinol 6, 145-56.
Nagayama, Y., Tanaka, K., Hara, T., Namba, H., Yamashita, S., Taniyama, K. and Niwa, M.
(1996a). Involvement of G protein-coupled receptor kinase 5 in homologous desensitization of the
thyrotropin receptor. J Biol Chem 271, 10143-8.
Nagayama, Y., Tanaka, K., Namba, H., Yamashita, S. and Niwa, M. (1996b). Expression and
regulation of G protein-coupled receptor kinase 5 and -arrestin-1 in rat thyroid FRTL5 cells. Thyroid 6,
627-31.
Nakagawa, S. and Huibregtse, J. M. (2000). Human scribble (Vartul) is targeted for ubiquitin-
mediated degradation by the high-risk papillomavirus E6 proteins and the E6AP ubiquitin-protein ligase.
Mol Cell Biol 20, 8244-53.
Nakano, A. and Luini, A. (2010). Passage through the Golgi. Curr Opin Cell Biol 22, 471-8.
Nigg, E. A., Schafer, G., Hilz, H. and Eppenberger, H. M. (1985). Cyclic-AMP-dependent
protein kinase type II is associated with the Golgi complex and with centrosomes. Cell 41, 1039-51.
Nikolaev, V. O., Bunemann, M., Hein, L., Hannawacker, A. and Lohse, M. J. (2004). Novel
single chain cAMP sensors for receptor-induced signal propagation. J Biol Chem 279, 37215-8.
Nourry, C., Grant, S. G. and Borg, J. P. (2003). PDZ domain proteins: plug and play! Sci STKE
2003, RE7.
Nussey S, W. S. (2001). Endocrinology-An Integrated Approach. Oxford: BIOS Scientific
Publishers.
O'Neill, P. R., Karunarathne, W. K., Kalyanaraman, V., Silvius, J. R. and Gautam, N. (2012).
G-protein signaling leverages subunit-dependent membrane affinity to differentially control translocation
to intracellular membranes. Proc Natl Acad Sci U S A 109, E3568-77.
Pierce, K. L., Premont, R. T. and Lefkowitz, R. J. (2002). Seven-transmembrane receptors. Nat
Rev Mol Cell Biol 3, 639-50.
Porcellini, A., Messina, S., De Gregorio, G., Feliciello, A., Carlucci, A., Barone, M., Picascia,
A., De Blasi, A. and Avvedimento, E. V. (2003). The expression of the thyroid-stimulating hormone (TSH)

109
receptor and the cAMP-dependent protein kinase RII regulatory subunit confers TSH-cAMP-dependent
growth to mouse fibroblasts. J Biol Chem 278, 40621-30.
Probst, W. C., Snyder, L. A., Schuster, D. I., Brosius, J. and Sealfon, S. C. (1992). Sequence
alignment of the G-protein coupled receptor superfamily. DNA Cell Biol 11, 1-20.
Rajagopalan, M., Neidigh, J. L. and McClain, D. A. (1991). Amino acid sequences Gly-Pro-Leu-
Tyr and Asn-Pro-Glu-Tyr in the submembranous domain of the insulin receptor are required for normal
endocytosis. J Biol Chem 266, 23068-73.
Rapoport, B. and Adams, R. J. (1976). Induction of refractoriness to thyrotropin stimulation in
cultured thyroid cells. Dependence on new protein synthesis. J Biol Chem 251, 6653-61.
Rasmussen, S. G., Choi, H. J., Fung, J. J., Pardon, E., Casarosa, P., Chae, P. S., Devree, B. T.,
Rosenbaum, D. M., Thian, F. S., Kobilka, T. S. et al. (2011). Structure of a nanobody-stabilized active
state of the 2 adrenoceptor. Nature 469, 175-80.
Reiter, E. and Lefkowitz, R. J. (2006). GRKs and -arrestins: roles in receptor silencing,
trafficking and signaling. Trends Endocrinol Metab 17, 159-65.
Renard, H. F., Simunovic, M., Lemiere, J., Boucrot, E., Garcia-Castillo, M. D., Arumugam,
S., Chambon, V., Lamaze, C., Wunder, C., Kenworthy, A. K. et al. (2015). Endophilin-A2 functions in
membrane scission in clathrin-independent endocytosis. Nature 517, 493-6.
Revankar, C. M., Cimino, D. F., Sklar, L. A., Arterburn, J. B. and Prossnitz, E. R. (2005). A
transmembrane intracellular estrogen receptor mediates rapid cell signaling. Science 307, 1625-30.
Robert D. Goldman, J. R. S., David L. Spector, ed.,. (2010). Live Cell Imaging: A Laboratory
Manual, Second Edition.
Rojas, R., van Vlijmen, T., Mardones, G. A., Prabhu, Y., Rojas, A. L., Mohammed, S., Heck,
A. J., Raposo, G., van der Sluijs, P. and Bonifacino, J. S. (2008). Regulation of retromer recruitment to
endosomes by sequential action of Rab5 and Rab7. J Cell Biol 183, 513-26.
Saini, D. K., Karunarathne, W. K., Angaswamy, N., Saini, D., Cho, J. H., Kalyanaraman, V.
and Gautam, N. (2010). Regulation of Golgi structure and secretion by receptor-induced G protein
complex translocation. Proc Natl Acad Sci U S A 107, 11417-22.
Sanders, J., Chirgadze, D. Y., Sanders, P., Baker, S., Sullivan, A., Bhardwaja, A., Bolton, J.,
Reeve, M., Nakatake, N., Evans, M. et al. (2007). Crystal structure of the TSH receptor in complex with
a thyroid-stimulating autoantibody. Thyroid 17, 395-410.
Sanders, P., Young, S., Sanders, J., Kabelis, K., Baker, S., Sullivan, A., Evans, M., Clark, J.,
Wilmot, J., Hu, X. et al. (2011). Crystal structure of the TSH receptor (TSHR) bound to a blocking-type
TSHR autoantibody. Journal of Molecular Endocrinology 46, 81-99.

110
Schaarschmidt, J., Huth, S., Meier, R., Paschke, R. and Jaeschke, H. (2014). Influence of the
Hinge Region and Its Adjacent Domains on Binding and Signaling Patterns of the Thyrotropin and
Follitropin Receptor. PLoS ONE 9, e111570.
Seaman, M. N. (2004). Cargo-selective endosomal sorting for retrieval to the Golgi requires
retromer. J Cell Biol 165, 111-22.
Seaman, M. N. (2005). Recycle your receptors with retromer. Trends Cell Biol 15, 68-75.
Shanks, R. A., Steadman, B. T., Schmidt, P. H. and Goldenring, J. R. (2002). AKAP350 at the
Golgi apparatus. I. Identification of a distinct Golgi apparatus targeting motif in AKAP350. J Biol Chem
277, 40967-72.
Shewan, A. M., van Dam, E. M., Martin, S., Luen, T. B., Hong, W., Bryant, N. J. and James,
D. E. (2003). GLUT4 recycles via a trans-Golgi network (TGN) subdomain enriched in Syntaxins 6 and 16
but not TGN38: involvement of an acidic targeting motif. Mol Biol Cell 14, 973-86.
Shi, Y., Zou, M., Ahring, P., Al-Sedairy, S. T. and Farid, N. R. (1995). Thyrotropin
internalization is directed by a highly conserved motif in the seventh transmembrane region of its receptor.
Endocrine 3, 409-14.
Shuman, S. J., Zor, U., Chayoth, R. and Field, J. B. (1976). Exposure of thyroid slices to thyroid-
stimulating hormone induces refractoriness of the cyclic AMP system to subsequent hormone stimulation.
J Clin Invest 57, 1132-41.
Slessareva, J. E., Routt, S. M., Temple, B., Bankaitis, V. A. and Dohlman, H. G. (2006).
Activation of the phosphatidylinositol 3-kinase Vps34 by a G protein subunit at the endosome. Cell 126,
191-203.
Steyaert, J. and Kobilka, B. K. (2011). Nanobody stabilization of G protein-coupled receptor
conformational states. Curr Opin Struct Biol 21, 567-72.
Szkudlinski, M. W., Fremont, V., Ronin, C. and Weintraub, B. D. (2002). Thyroid-stimulating
hormone and thyroid-stimulating hormone receptor structure-function relationships. Physiol Rev 82, 473-
502.
Tamura, G., Ando, K., Suzuki, S., Takatsuki, A. and Arima, K. (1968). Antiviral activity of
brefeldin A and verrucarin A. J Antibiot (Tokyo) 21, 160-1.
Taylor, S. S., Ilouz, R., Zhang, P. and Kornev, A. P. (2012). Assembly of allosteric
macromolecular switches: lessons from PKA. Nat Rev Mol Cell Biol 13, 646-58.
Tokunaga, M., Imamoto, N. and Sakata-Sogawa, K. (2008). Highly inclined thin illumination
enables clear single-molecule imaging in cells. Nat Methods 5, 159-61.

111
Urizar, E., Claeysen, S., Deupi, X., Govaerts, C., Costagliola, S., Vassart, G. and Pardo, L.
(2005a). An activation switch in the rhodopsin family of G protein-coupled receptors: the thyrotropin
receptor. J Biol Chem 280, 17135-41.
Urizar, E., Montanelli, L., Loy, T., Bonomi, M., Swillens, S., Gales, C., Bouvier, M., Smits, G.,
Vassart, G. and Costagliola, S. (2005b). Glycoprotein hormone receptors: link between receptor
homodimerization and negative cooperativity. EMBO J 24, 1954-64.
Van Sande, J., Dequanter, D., Lothaire, P., Massart, C., Dumont, J. E. and Erneux, C. (2006).
Thyrotropin stimulates the generation of inositol 1,4,5-trisphosphate in human thyroid cells. J Clin
Endocrinol Metab 91, 1099-107.
Vassart, G. and Dumont, J. E. (1992). The thyrotropin receptor and the regulation of thyrocyte
function and growth. Endocr Rev 13, 596-611.
Voigt, C., Holzapfel, H. and Paschke, R. (2000). Expression of -arrestins in toxic and cold
thyroid nodules. FEBS Lett 486, 208-12.
Wang, X., Ma, D., Keski-Oja, J. and Pei, D. (2004). Co-recycling of MT1-MMP and MT3-MMP
through the trans-Golgi network. Identification of DKV582 as a recycling signal. J Biol Chem 279, 9331-6.
Wedegaertner, P. B. (2012). G protein trafficking. Subcell Biochem 63, 193-223.
Wehbi, V. L., Stevenson, H. P., Feinstein, T. N., Calero, G., Romero, G. and Vilardaga, J. P.
(2013). Noncanonical GPCR signaling arising from a PTH receptor-arrestin-G complex. Proc Natl Acad
Sci U S A 110, 1530-5.
Werthmann, R. C., Volpe, S., Lohse, M. J. and Calebiro, D. (2012). Persistent cAMP signaling
by internalized TSH receptors occurs in thyroid but not in HEK293 cells. FASEB J 26, 2043-8.
Westfield, G. H., Rasmussen, S. G., Su, M., Dutta, S., DeVree, B. T., Chung, K. Y., Calinski,
D., Velez-Ruiz, G., Oleskie, A. N., Pardon, E. et al. (2011). Structural flexibility of the Gs -helical
domain in the 2-adrenoceptor Gs complex. Proc Natl Acad Sci U S A 108, 16086-91.
Wong, W. and Scott, J. D. (2004). AKAP signalling complexes: focal points in space and time.
Nat Rev Mol Cell Biol 5, 959-70.
Wood, S. A., Park, J. E. and Brown, W. J. (1991). Brefeldin A causes a microtubule-mediated
fusion of the trans-Golgi network and early endosomes. Cell 67, 591-600.
Zhang, J., Hupfeld, C. J., Taylor, S. S., Olefsky, J. M. and Tsien, R. Y. (2005). Insulin disrupts
-adrenergic signalling to protein kinase A in adipocytes. Nature 437, 569-73.
Zhao, P., Canals, M., Murphy, J. E., Klingler, D., Eriksson, E. M., Pelayo, J. C., Hardt, M.,
Bunnett, N. W. and Poole, D. P. (2013). Agonist-biased trafficking of somatostatin receptor 2A in enteric
neurons. J Biol Chem 288, 25689-700.

112
11 Curriculum vitae Name: Amod Godbole
Date of birth: 18th October, 1987
Place of birth: Mumbai, India
Nationality: Indian
Current address:
Email ID:
Telephone number:
Current position: PhD doctoral student (May 2012-present)
Location: Institute of Pharmacology and Toxicology, University of Würzburg, Germany
Title of PhD thesis: A new paradigm of GPCR signaling at the trans-Golgi network of thyroid cells
Supervisors: PD. Dr. Dr. med. Davide Calebiro, Prof. Dr. Martin J. Lohse, Prof. Dr. Markus Sauer
Academic background:
Master’s in Biochemistry and Molecular Biology (2009-2012)
University of Bremen, Germany
Bachelor of Science (Major: Microbiology) (2006-2009)
University of Pune, India

113
Research experience:
Master’s in Biochemistry and Molecular Biology:
1. Project title: In vivo non-invasive imaging of mouse pancreas using Magnetic Resonance Imaging
(MRI).
Supervisor: Prof. Dr. Kathrin Mädler (University of Bremen, Germany)
2. Project title: Immuno-purification of polyclonal antibody against the germ-line specific lamin LIV from
Xenopus laevis.
Supervisor: Prof. Dr. Reimer Stick (University of Bremen, Germany)
3. Project title: An in vitro study of the interactions of Xenopus lamin LIV with other endogenous lamins
(Master’s Thesis).
Supervisor: Prof. Dr. Reimer Stick (University of Bremen, Germany)
Bachelor of Science (Major: Microbiology):
Project title: Isolation and Characterization of organisms in river water by using Winogradsky’s column.
Supervisor: Dr. Neelima Deshpande (Abasaheb Garware College, Pune, India)
Student Assistant (Wissenschaftliche Hilfskraft)
Employer: Prof. Dr. Kathrin Mädler (Islet Biology Laboratory, University of Bremen)
Duration: October 2010 – February 2012
Job description: Microtomy of paraffin embedded tissue samples.
Language skills:
English (native), Marathi (native), Hindi (native), German (professional)
Oral presentations:
“TSHR trafficking and signaling at the trans-Golgi network”
Conference: 31st Arbeitstagung Experimentelle Schilddrüsenforschung (AESF), 2015, Berlin, Germany
114
Awards
Best Poster Award
Godbole, A., Lyga S., Lohse MJ., Calebiro D., “A new paradigm in TSH receptor signaling in the trans-
Golgi network” at the European conference of Endocrinology (organized by the ESE), 2016, Munich,
Germany.
Nominations for the Best Poster award
Venue: Graduate School of Life Sciences (GSLS) PhD symposium (2014), Würzburg,
Venue: 67th annual meet of the Deutsche Gesellschaft für experimentelle und klinische Pharmakologie und
Toxikologie (DGPT), 2016, Berlin, Germany.
Best Poster Award (3rd place)
Godbole, A., Lohse MJ., Calebiro D., “Trafficking and signaling of the TSHR and effector proteins in
living thyroid cells” at the Annual retreat of the Rudolf Virchow Centre, 2014, Kloster Banz, Germany.
Best Poster Award (2nd place)
Godbole, A., Lohse MJ., Calebiro D., “Trafficking of the TSHR in living thyroid cells” at the Annual
retreat of the Rudolf Virchow Centre, 2013, Kloster Banz, Germany.
GSLS PhD Fellowship
Venue: Graduate School of Life Sciences, University of Würzburg,
Details: financial support and research grant (7,500 Euros per year) from May 2012 till October 2015.
Best Poster Award (1st place)
Godbole, A., Meyer A., Küstermann E., Mädler K., “In vivo non-invasive imaging of pancreas using
Magnetic Resonance Technology (MRT)” at the MSc-BMB Student Symposium, University of Bremen,
2010, Bremen, Germany.
115
Publications
Godbole, A., Lyga, S., Lohse, MJ., Calebiro, D., GPCRs reach the trans-Golgi network to trigger PKA
wave and gene transcription (in review)
Calebiro, D., Grassi, E. S., Eszlinger, M., Ronchi, C. L., Godbole, A., Bathon, K., Guizzardi, F., de
Filippis, T., Krohn, K., Jaeschke, H. et al. (2016). Recurrent EZH1 mutations are a second hit in
autonomous thyroid adenomas. J Clin Invest 126, 3383-8
Calebiro, D., Godbole, A., Lyga, S., and Lohse, M. (2015) Trafficking and Function of GPCRs in the
Endosomal Compartment in Nuclear G-Protein Coupled Receptors (Allen, B. G., and Hébert, T. E. eds.),
Springer New York. pp 197-211
E. Küstermann, A. Meyer, A. Godbole, W. Dreher, K. Maedler, “Investigating the Pancreatic Function:
Robust 3D MR imaging of Mouse Abdomen”, Proc. 19th Ann. Sci. Meet. ISMRM, Montreal, 2011, p.810
Date and signature

116
12 Acknowledgments
First and foremost, I would like to thank my supervisor PD. Dr. Dr. med. Davide Calebiro for giving
me the opportunity to pursue my Doctoral studies under his supervision. His guidance helped me a lot in
the beginning of my experiments. The thought-provoking discussions with him were of immense help.
Under his guidance, I was able to develop a critical and an analytical attitude which helped me a lot in the
interpretation of my results. His “persistent determination” in bringing about the best in me was not only
useful during my work but also during the writing of this dissertation.
Secondly, I would also like thank Prof. Dr. Martin J. Lohse for his supervision. His scientific guidance
over the course of my Doctoral dissertation, his insistence at having a broader outlook for my findings and
the financial support at the end of my Doctoral thesis helped me a lot. I will not forget his advice that to be
successful in life, one needs to be decisive and assertive.
Last, but not the least, I would also like to thank Prof. Dr. Markus Sauer for agreeing to be on my thesis
committee. His participation and feedback in my annual meetings was of great help.
I would like to thank Dr. Titiwat Sungkaworn for his continuous support, his help in imaging
experiments and teaching me logical thinking. Of course, thanks are also due to Dr. Isabella Maiellaro for
the same reasons mentioned above and also for the lively discussions and arguments over our data and
results. Thanks also go to Dr. Julia Wagner for supervising me in the beginning, teaching me basic lab skills
and for being a helpful friend. Sandra Lyga’s support and her help near the end of my dissertation is also
appreciated. Unter den Mitarbeitern der AG Calebiro möchte ich mich zunächst bei Bianca Klüpfel für ihre
wunderbare technische Hilfe, Unterstützung und ihren Beitrag bei der Verbesserung meiner
Deutschkenntnisse bedanken. Secondly, I would like to thank Alexandra Bohl and Christian Dees for their
help and support. Among the new personnel, I would like to thank Kerstin Bathon, Dr. Marie-Lise Jobin,
Sana Siddig and Kerstin Seier for being supportive, caring and wonderful colleagues. I would also like to
thank Yannick for his help in writing the “Zusammenfassung”. Most importantly, and yet seldom
acknowledged let alone appreciated, I owe this work to the mice that were sacrificed during this study.
Overall, I would like to thank the entire working group on the fourth floor, with the occasional guest, in
helping me during my stay there.
Lastly, and in particular, I would like to thank Christine Salomon for her wonderful assistance and
patience. Thanks are also due to the Graduate School of Life Sciences and their great personnel (in particular
Dr. Gabriele Blum-Öhler) for granting the PhD fellowship and their assistance during the whole time. And
yet it is quite a long list of things and people that I am still grateful about but unfortunately cannot mention
all of them here.