A new Method to determine Stress Cycle Histograms of...
8
A new Method to determine Stress Cycle Histograms of Structures under Gusty Wind Load Frank H. Kemper 1 1 Dept. for Wind Engineering, Institute for Steel Structures, RWTH Aachen University, 52074 Aachen, Germany. [email protected] Abstract Based on spectral computations with a subsequent frequency based Rainflow count algorithm (Dirlik method), a thorough investigation of the response behaviour and the associated Rainflow histograms has been performed for different strcutures under wind load. With respect to stress histograms over the lifetime, it has been identified that mainly the structural frequency and damping, as well as the shape coefficient of the Weibull distribution for the wind speed on site are relevant. Based on this conclusion, concerted calculations of various structural and site-related parameters have been performed. For each case, the Rainflow shape has been fitted to a quadratic logarithmic function. The associated quadratic and linear coefficients could finally be expressed based on the four main influence parameters depen- dent on structure and location. Summarized in surface plots, an easy to use method to determine the shape of the stress cycle count histogram for any structure and any location has been developed. 1 Introduction For the structural safety of modern steel structures, a realistic consideration all quasi-static or dynamic cyclic actions, a correct interpretation of the resulting structural stresses, a meaningful damage cumu- lation approach and a realistic fatigue-related material resistance is needed. For structures under gusty wind load, the description of the stress cycles during the foreseen lifetime is often estimated based on simplified closed-form approaches. In most cases, these methods overestimate the Damage value significantly with increasing bandwith of the response process. In earlier investigations it has been shown, that detailed spectral structural computations in combination with a spectral Rainflow cycle count approach lead to reliable stress range distributions for arbitrary response bandwiths (Kemper & Feldmann, 2011b). 2 Spectral Computations of Stress Range Spectra The most common and accepted counting algorithm for cyclic stressed structures is the Rainflow method from Matsuishi & Endo (1968). As this algorithm is based on a transient formulation a usage for stochastic wind load processes is limited to the field of Monte-Carlo Simulations with artificial time-series of the wind field. A lot of efforts have been made to estimate ”Rainflow-like” distributions based on spectral densi- ties of response processes, which is much more convinient for the treatment of stochastic fields. An overview of some current methods has been given from Halfpenny (2010). Own calculations showed, that Rainflow stress range spectra of gust excited structures can be determined in good agreement to 1
Transcript of A new Method to determine Stress Cycle Histograms of...

A new Method to determine Stress Cycle Histograms ofStructures under Gusty Wind Load
Frank H. Kemper1
1Dept. for Wind Engineering, Institute for Steel Structures, RWTH Aachen University,52074 Aachen, Germany. [email protected]
Abstract
Based on spectral computations with a subsequent frequency based Rainflow count algorithm (Dirlikmethod), a thorough investigation of the response behaviour and the associated Rainflow histogramshas been performed for different strcutures under wind load. With respect to stress histograms over thelifetime, it has been identified that mainly the structural frequency and damping, as well as the shapecoefficient of the Weibull distribution for the wind speed on site are relevant. Based on this conclusion,concerted calculations of various structural and site-related parameters have been performed. For eachcase, the Rainflow shape has been fitted to a quadratic logarithmic function. The associated quadraticand linear coefficients could finally be expressed based on the four main influence parameters depen-dent on structure and location. Summarized in surface plots, an easy to use method to determine theshape of the stress cycle count histogram for any structure and any location has been developed.
1 Introduction
For the structural safety of modern steel structures, a realistic consideration all quasi-static or dynamiccyclic actions, a correct interpretation of the resulting structural stresses, a meaningful damage cumu-lation approach and a realistic fatigue-related material resistance is needed. For structures under gustywind load, the description of the stress cycles during the foreseen lifetime is often estimated basedon simplified closed-form approaches. In most cases, these methods overestimate the Damage valuesignificantly with increasing bandwith of the response process. In earlier investigations it has beenshown, that detailed spectral structural computations in combination with a spectral Rainflow cyclecount approach lead to reliable stress range distributions for arbitrary response bandwiths (Kemper &Feldmann, 2011b).
2 Spectral Computations of Stress Range Spectra
The most common and accepted counting algorithm for cyclic stressed structures is the Rainflowmethod from Matsuishi & Endo (1968). As this algorithm is based on a transient formulation a usagefor stochastic wind load processes is limited to the field of Monte-Carlo Simulations with artificialtime-series of the wind field.
A lot of efforts have been made to estimate ”Rainflow-like” distributions based on spectral densi-ties of response processes, which is much more convinient for the treatment of stochastic fields. Anoverview of some current methods has been given from Halfpenny (2010). Own calculations showed,that Rainflow stress range spectra of gust excited structures can be determined in good agreement to
1

6th European and African Wind Engineering Conference 2
transient methods based on an emprical formula from Dirlik (1985). Although the computation suc-ceeds much quicker than transient methods, for a general rating of structures or an implication intocodes it still seems too complex.
Especially in the field of mechanical engineering an empirical approach for estimating the Rain-flow distribution based on the power spectral density is meanwhile well established. Dirlik derivedthis method based on continuous random processes and subsequent numerical Rainflow counting Dir-lik (1985). He discovered an empirical relationship between the frequency range description of thesignal and the Rainflow distribution.
His studies were directed to stationary, ergodic random processes with arbitrary bandwidth. Con-sistently, the Dirlik probability density function of peak values of a process with any bandwidth is aweighted sum of a normal distribution and a Rayleigh distribution. In previous studies of Wirschingand Shehata ?, a similar approach was chosen, but there an attempt was made to describe the Rainflowdistributions by Weibull functions. The simulations of Dirlik, as well as own simulations showed, thatthe Rainflow distributions of peaks often differs significantly from a Weibull distribution. For thisreason, the Wirsching-Factor, which has been used for instance from Holmes Holmes (2001), is notrealistic in case of higher response bandwidth Kemper & Feldmann (2011a). With Dirlik’s formula,the density of the number of cycle counts N ′ of a given stress level ∆σ can be computed to:
N ′(∆σ) = EP · T · fD(∆σ) (1)
fD(∆σ) =
D1Q · e
−Z(∆σ)Q + D2·Z(∆σ)
R2 · e−Z(∆σ)2
2·R2 +D3 · Z(∆σ) · e−Z(∆σ)2
2
2 · √m0(2)
whereat:
xm =m1
m0·√m2
m4R =
γ − xm −D21
1− γ −D1 +D21
(3a)
D1 =2 · (xm − γ2)
1 + γ2D2 =
1− γ −D1 +D21
1−R(3b)
D3 = 1−D1 −D2 Z(∆σ) =∆σ
2 · √m0(3c)
Q =1.25 · (γ −D3 −D2 ·R)
D1(3d)
are auxillary values.The accuracy of the method has been verified with respect to gust excited structures by comparing
the results to corresponding transient simulations. In all cases, the discrepancies between transientRainflow count and Dirlik formula where negligible Kemper & Feldmann (2011b). Even geomet-rical nonlinear structures can be analyzed based on the presented spectral approach. The necessarystochastic description of the mechanical system has been presented in Kemper & Feldmann (2011c).
The method presented in this paper is aimed to clarify the influence parameters on the stress rangedistribution for structures under gusty wind loads and to deduce a simplified approach which takes intoaccount the most relevant influences. The stress range density over the lifetime TLife of a structurecan be expressed as a convolution of the stress range spectra within a short reference periodN(∆σ, u),e.g. Tref = 10 min. at a given wind speed and the frequency of occurence of wind speeds f(u) at theconsidered site (Kemper & Feldmann, 2010):

6th European and African Wind Engineering Conference 3
10
10
0
0
50
100
1
1
100
100
103
103
104
104
105
105
106
106
107
107
108
108
ΔσΔσmax
Δσ
Δσb
ΔσmaxΔσm,8
Δσm,7
Δσm,6
Δσm,5
Δσm,4
Δσm,3
Δσm,2
Δσm,1
100
0,5
1,0
1 100 103 104 105 106 107 1080
σσmax
σσmax
NLife
NLife⌠⌡
1
2
3
4
5
6
7
8
NLife
ΔσΔσmax
( )
NLife Δσ( )
N =i dΔσΔσm,i-0.5·Δσb
Δσm,i+0.5·Δσb
⌠⌡ Nlife Δσ( )
βα
ΔσΔσmax
(N ) = · ·Life Life Lifeβα log (N )+ log(N )+1002
Regression of Inverse N -Function:Life
in %
Figure 1: Quadratic Approximation of the Inverse NLife-Function
N ′(∆σ)Life =
∫ uref
0
TLifeTref
· f(u) ·N(∆σ, u) du (4)
It is meaningful to decouple parameters which mainly affect the scale of the stress range amplitudes(e.g. the reference wind speed on site) and those which affect the distribution as well (e.g. the struc-tural frequency). As N ′(∆σ)Life describes the density of cycle counts over the structural effects, adirect relation to the maximum amplitude succeeds based on the cumulative stress range distribution:
NLife(∆σ/∆σmax) =
∆σ/∆σmax∫0
N ′Life(t) dt (5)
An example of the NLife-function is given in Fig. 1. As a result of the cumulative representation,the maximum stress range amplitude is located at NLife = 1 , which corresponds to a probability ofexceedance of p = 1/TLife. For a general usage, the amplitudes may be normalized to the maximum.
3 Influence Parameters and Model Simplification
Considering all parameters of the Alan G. Davenport Wind Loading Chain, it can be stated, that mainlythe natural frequency of the structure and its damping behavior as well as the shape coefficient of theprobability density function of the wind speed on site influence the distibution of stress range spectra.
Based on systematic spectral computations, the regression parameter α and β of the generalNLife-Curve (cp. Fig. 1) have been determined, to identify the relations between the mentioned parametersand the shape of the Rainflow stress range cycle count.In order to extract the indiviual results of the performed computations to a simplified model, for eachconsidered location (expressed by its Weibull parameters A and k), a two-dimensional fit has beenperformed (cp. Fig. 2).
Finally, the surface regression coefficients (3 in case of a bilinear fit) have been determined. As aresult, the shape of the Inverse NLife-Function, expressed by its coefficients α and β can be describedrelated to the dynamical properties of the structure for any location:
∆σ
∆σmax(Ng) = (κ1 · log f + κ2 · log δ + κ3) · log2Ng...
− (λ1 · log f + λ2 · log δ + λ3) · log Ng + 100 (6)

6th European and African Wind Engineering Conference 4
0.011
100 0.010.1
10
0.5
1
1.5
δ
NL−Opt. α [A:4.80−k:1.60]
f in Hz
0 0.5 1 1.5
0.011
100 0.010.1
1−20
−10
δ
NL−Opt. β [A:4.80−k:1.60]
f in Hz
−25 −20 −15 −10 −5
Figure 2: Regression of α and β dependent on the dynamic Properties of all considered Structures
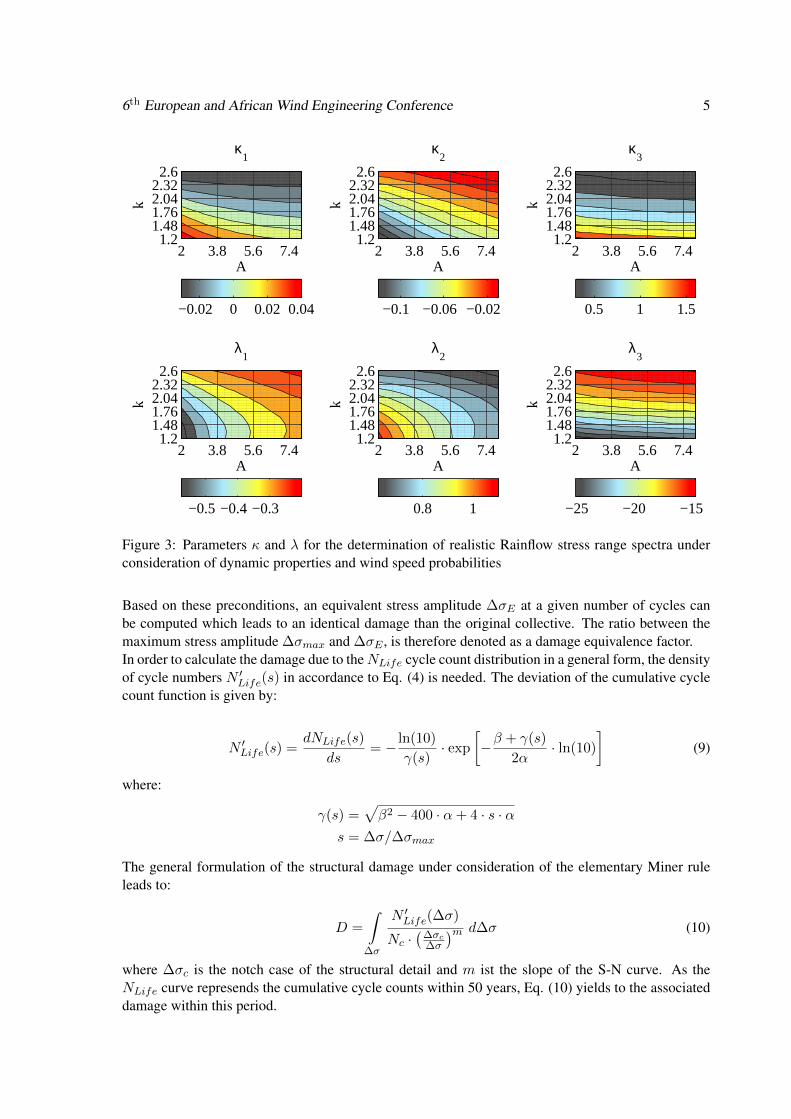
where κi and λi are the areal regression parameter of a bilinear approach, summarized in Fig. 3. Theusage of the presented approach is quite simple:
1. Computation of the maximum stress amplitude ∆σmax2. Determination of auxiliary values κi and λi dependent on the location of the structure3. Formulation of the cumulative Rainflow spectrum NLife dependent on the structural dynamic
parameters with Eq. (6)The stress range density N ′Life(∆σ/∆σmax) can be found to:
N ′(s) =dN(s)
ds=
N(s)
log(e) ·√β2 − 400 · α+ 4 · s · α
(7)
Finally, stress range collectives can be derived for arbitrary class widths and the associated fatiguedamage leads do:
D =
∆σD∫∆σL
N ′Life(∆σ)
ND ·(
∆σD∆σ
)m2+
∞∫∆σD
N ′Life(∆σ)
ND ·(
∆σD∆σ
)m1d∆σ (8)
where: m1 and m2 describe the inclination of the structural S-N curve.
4 DAMAGE EQUIVALENCE FACTOR CONCEPT
In the preceding sections the main computation strategy and a simplified possibility for the determi-nation of realistic cycle count distributions is presented. The latter allows a detailed verification of theactual fatigue life considering appropriate S-N curves and damage accumulation strategies. However,at least for a pre-design stage, the damage assessment might be still too extensive, as the damage inte-gral has still to be solved. For this reason some additional considerations have been made, allowing toreduce the fatigue assessment to a really simple check of the fatigue endurance. The following itemsare addressed in order to allow a further simplification:• Consideration of a realistic shape of the NLife-curve based on α(f, δ, A, k) and β(f, δ, A, k)• Assumption of a certain shape of the structural S-N curve (trilinear or single slope)• Linear damage hypothesis (elementary or modified Miner rule)
6th European and African Wind Engineering Conference 5
κ1
A
k
2 3.8 5.6 7.41.2
1.481.762.042.322.6
−0.02 0 0.02 0.04
κ2
A
k
2 3.8 5.6 7.41.2
1.481.762.042.322.6
−0.1 −0.06 −0.02
κ3
A
k
2 3.8 5.6 7.41.2
1.481.762.042.322.6
0.5 1 1.5
λ1
A
k
2 3.8 5.6 7.41.2
1.481.762.042.322.6
−0.5 −0.4 −0.3
λ2
A
k
2 3.8 5.6 7.41.2
1.481.762.042.322.6
0.8 1
λ3
A
k
2 3.8 5.6 7.41.2
1.481.762.042.322.6
−25 −20 −15
Figure 3: Parameters κ and λ for the determination of realistic Rainflow stress range spectra underconsideration of dynamic properties and wind speed probabilities
Based on these preconditions, an equivalent stress amplitude ∆σE at a given number of cycles canbe computed which leads to an identical damage than the original collective. The ratio between themaximum stress amplitude ∆σmax and ∆σE , is therefore denoted as a damage equivalence factor.In order to calculate the damage due to theNLife cycle count distribution in a general form, the densityof cycle numbers N ′Life(s) in accordance to Eq. (4) is needed. The deviation of the cumulative cyclecount function is given by:
N ′Life(s) =dNLife(s)
ds= − ln(10)
γ(s)· exp
[−β + γ(s)
2α· ln(10)
](9)
where:
γ(s) =√β2 − 400 · α+ 4 · s · α
s = ∆σ/∆σmax
The general formulation of the structural damage under consideration of the elementary Miner ruleleads to:
D =
∫∆σ
N ′Life(∆σ)
Nc ·(
∆σc∆σ
)m d∆σ (10)
where ∆σc is the notch case of the structural detail and m ist the slope of the S-N curve. As theNLife curve represends the cumulative cycle counts within 50 years, Eq. (10) yields to the associateddamage within this period.

6th European and African Wind Engineering Conference 6
4.1 Elementary Miner-Rule (acc. to Palmgren)
In this section the steps are described, which allow the development of damage equivalence factorsusing the elementary Miner rule. The equivalent stress range ∆σE can be calculated implicitly by thedefinition of the number equivalent of cycles nE = ND = 5 · 106 and by the demand of an identity ofdamages:
nENE
=ND
NE
!= DMiner,elementary (11)
The associated stress range amplitude ∆σE is defined based on the structural S-N curve:
∆σE =
(∆σmD ·
ND
NE
) 1m
(12)
Under consideration of Eq. (10), the equivalent stress amplitude can finally be derived to:
∆σE =
1
ND·∞∫
0
N ′Life
(100 · s
∆σmax
)· sm ds
1m
(13)
The damage equivalence factor KF for the consideration of the shape of the stress range collective isgiven by:
KF = ∆σmax/∆σE (14)
The fatigue endurance verification can be performed considering characteristic values as follows:
∆σmax/KF
!≤ ∆σD (15)
A realistic damage assessment is enabled using the bearable cycle counts NE , which are associatedwith the stress amplitude ∆σE :
NE =
(∆σD∆σE
)m·ND (16)
Finally, the corresponding damage value is defined as:
D =nENE
=ND
NE(17)
The verification now includes implicitly the individual shape of the stress and leads to the same col-lective damage value as the integral of the actual collective consideration based on Eq. (10).
4.2 Damage Equivalence Factors for Application
For an enabling of a preferably simple and general fatigue assessment concept, it was essential toavoid dependencies of the damage equivalence factor KF to other parameters than the shape of thecycle count distribution. Especially an influence of the maximum stress amplitude ∆σmax and thenotch case ∆σC would complicate the concept. Considering Eq. (13), it becomes apparent that theequivalent stress range depends on the fatigue endurance limit ∆σD in a direct way and indirectlyby the damage D. Therefore, the equivalent stress range ∆σE , and thus the damage equivalencefactor KF , are not dependent on the notch case ∆σC . However, as soon as a S-N curve with differentinclinations is used, this independency is lost, due to the necessary case distinction.

6th European and African Wind Engineering Conference 7
KF
0.2 0.4 0.6 0.8 1 1.2 1.4−24
−22
−20
−18
−16
−14
−12
−10
k=2.3
0.001
a
b
0.010.1
k=1.9
k=1.5
2
4
68
10
14
20
30
100101
0.10.01
f
d Determine K via F a or b Alternatively a simplifieddetermination via k (Weibull),f and d is possible
Figure 4: Damage Equivalence Factors KF dependent on the regression parameter of the NLife-function and assuming the elementary Miner rule
Generally, the maximum value of the stress collective ∆σmax affects the computed structuraldamage. In case of a simple linear S-N curve (elementary Miner rule) it follows for different collectivemaximums ∆σmax,1 and ∆σmax,2:
D2 = D1 ·(
∆σmax,2∆σmax,1
)m(18)
Consequently, in conjunction with equation (13) it follows, that the equivalent stress range ∆σE actslinear to the maximum stress amplitude ∆σmax of the collective. Thus, the damage equivalence factorKF is also independent of the collective maximum amplitude ∆σmax.
When the modified Miner’s rule is used, the damage equivalence factor KF depends on both thecollective maximum and the notch case of the S-N curve. For the establishment of an easy concept it istherefore advantageous to use the conservative elementary Miner rule with a unique slope of m1 = 3.
In Fig. 4, the damage equivalence factors are plotted for arbitrary combinations of the regressionparameter α and β of the cycle count distribution NLife. Considering the influence of wind char-acteristic and structural dynamic properties, the equivalent stress factors can be read directly fromthe chart. Therefore, the bi-linear regression model has been used. As the plot is restricted to threedifferent values for the shape parameter k of the Weibull distribution, the usage is limited to rather ap-proximative calculations, for example as a part of a pre-dimensioning. For the accurate determinationof the damage equivalent factors it is recommended to determine the parameter α and β in advanceusing the equations described in section 3.
For the fatigue assessment finally Eq. (15) can be simplified to:
γFf ·∆σmaxKF
!≤ ∆σDγMf
(19)
Due to the implicit form of the elementary Miner rule this proof is generally on the safe side.The corresponding damage value can be calculated as follows:
D =
(∆σD
∆σmax·KF
)−m(20)

6th European and African Wind Engineering Conference 8
5 Conclusions
The presented method allows for the determination of realistic Rainflow stress range distributionsfor structures under gusty wind load. The formulation takes into account the individual location ofthe structure by considering the frequency of occurrence of wind speeds, as well as the dynamicalparameter of the structure.
As main influencing parameters of the stress cycle count distribution, mainly the structural fre-quency, the damping behavior and the wind statistic on site has been identified. Under considerationof appropriate shape function, the four independent parameters have been brought together in order toenable a simplified, graphical description.
Finally, the damage equivalence factor concepts has been introduced on the base of the regressionparameters which describe the actual shape of the cycle count distribution. In combination with theelementary Miner rule it was possible to calculated divisors, which allow a reduction of the maximumstress level in order to consider the distribution of cycle counts.
References
Dirlik, T. 1985. Application of computers to fatigue analysis. Ph.D. thesis, Warwick University,Warwick.
Halfpenny, Andrew. 2010. Rainflow Cycle Counting and Acoustic Fatigue Analysis Techniques forRandom Loading. In: RASD2010.
Holmes, J. D. 2001. Wind loading of structures. London and New York: Spon Press.
Kemper, F. H., & Feldmann, M. 2010. Rating of the fatigue relevance of gust induced vibrationsbased on spectral methods. Pages 133–136 of: Proceedings of the 9th UK Conference on WindEngineering. Lulu.com.
Kemper, F. H., & Feldmann, M. 2011a. Appraisement of Fatigue Phenomena due to Gust inducedVibrations based on closed-form Approaches. In: ICWE 13.
Kemper, F. H., & Feldmann, M. 2011b. Fatigue life prognosis for structural elements under stochasticwind loading based on spectral methods: Part 1: Linear structures. In: EURODYN 2011.
Kemper, F. H., & Feldmann, M. 2011c. Fatigue life prognosis for structural elements under stochasticwind loading based on spectral methods: Part 2: Nonlinear structures. In: EURODYN 2011.
Matsuishi, M., & Endo, T. 1968. Fatigue of metals subjected to varying stress. Japan Society ofMechanical Engineers.