A New Look at Impurities in CO for EOR and their Consequences · for EOR and their Consequences Ray...
24
A New Look at Impurities in CO 2 for EOR and their Consequences Ray McKaskle, P.E. Trimeric Corporation Presented at the 20 th Annual CO 2 Flooding Conference December 11-12, 2014 Midland, Texas
Transcript of A New Look at Impurities in CO for EOR and their Consequences · for EOR and their Consequences Ray...

A New Look at Impurities in CO2 for EOR and their Consequences
Ray McKaskle, P.E. Trimeric Corporation
Presented at the
20th Annual CO2 Flooding Conference
December 11-12, 2014
Midland, Texas
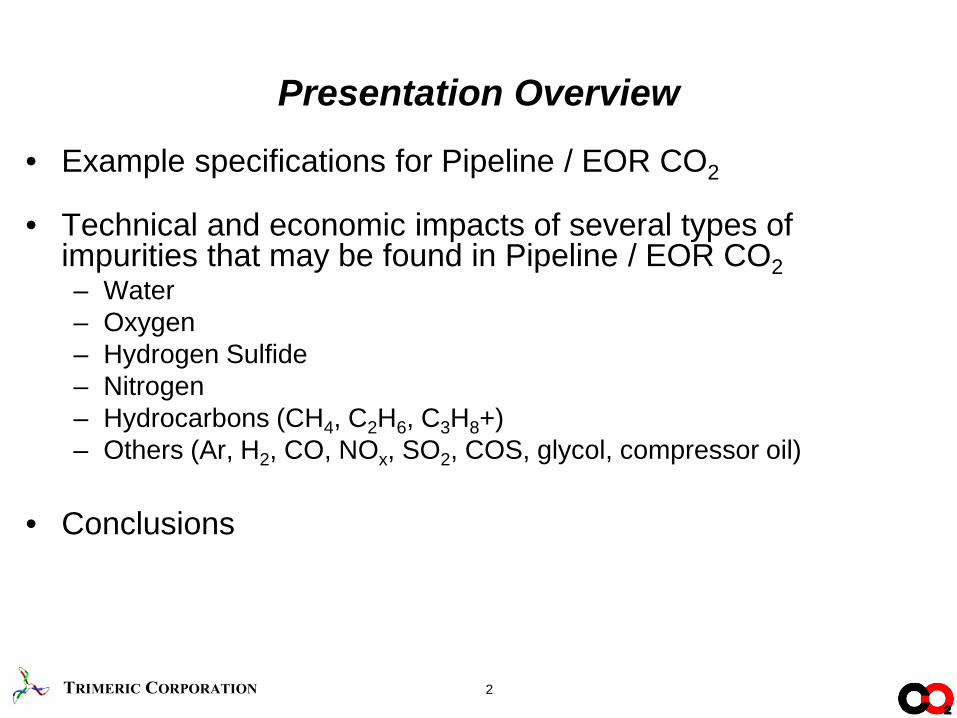
• Example specifications for Pipeline / EOR CO2 • Technical and economic impacts of several types of
impurities that may be found in Pipeline / EOR CO2 – Water – Oxygen – Hydrogen Sulfide – Nitrogen – Hydrocarbons (CH4, C2H6, C3H8+) – Others (Ar, H2, CO, NOx, SO2, COS, glycol, compressor oil)
• Conclusions
Presentation Overview
2
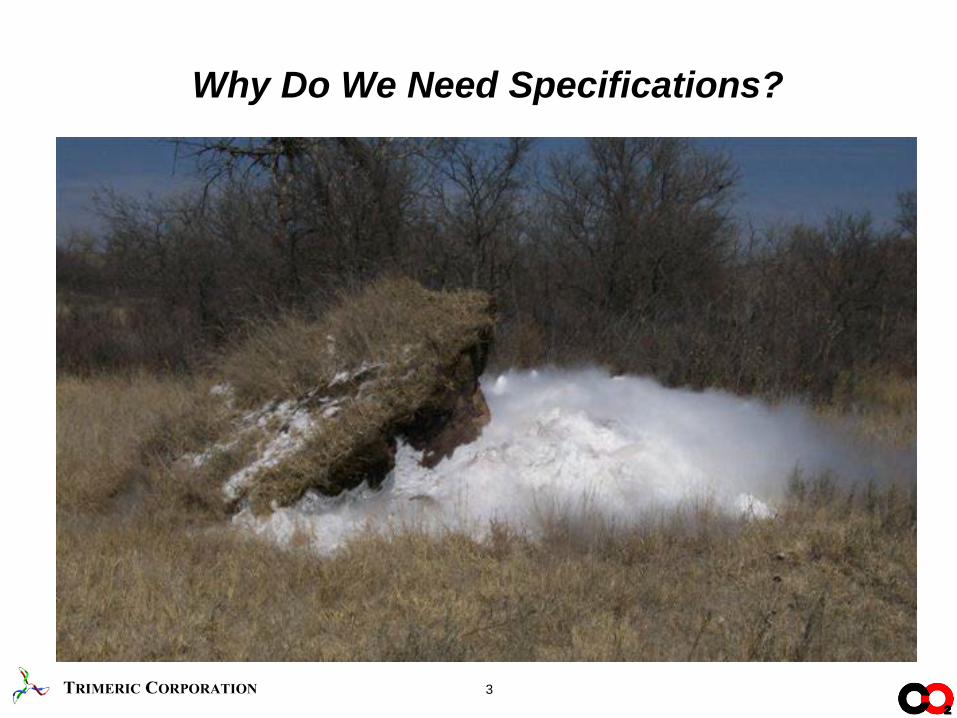
Why Do We Need Specifications?
3

Example Pipeline / EOR Specifications (1 of 2)
4
Component Example Industrial Pipeline ( Ref. 1)
DOE Pipeline Design Guideline (Ref. 2)
DOE EOR Design Guideline (Ref. 2)
CO2 ≥ 95 mol. % ≥ 95 vol. % ≥ 95 vol. %
H2O ≤ 30 lb / MMcf (633 ppmv)
≤ 500 ppmv ≤ 500 ppmv
Oxygen ≤ 10 ppmw ≤ 10 ppmv ≤ 10 ppmv
H2S ≤ 20 ppmw ≤ 100 ppmv ≤ 100 ppmv
Total Sulfur ≤ 35 ppmw
Nitrogen ≤ 4 mol. % ≤ 4 vol. % ≤ 1 vol. %
Hydrocarbons ≤ 5 mol. % (next slide) (next slide) Glycol ≤ 0.3 gal / MMcf ≤ 46 ppbv ≤ 46 ppbv
Ref 1 – CO2 Transportation, Ken Havens, Kinder-Morgan CO2 Company, June 5, 2008 Ref 2 – National Energy Technology Laboratory, Quality Guidelines for Energy System Studies, CO2 Impurity Design Parameters, August 2013
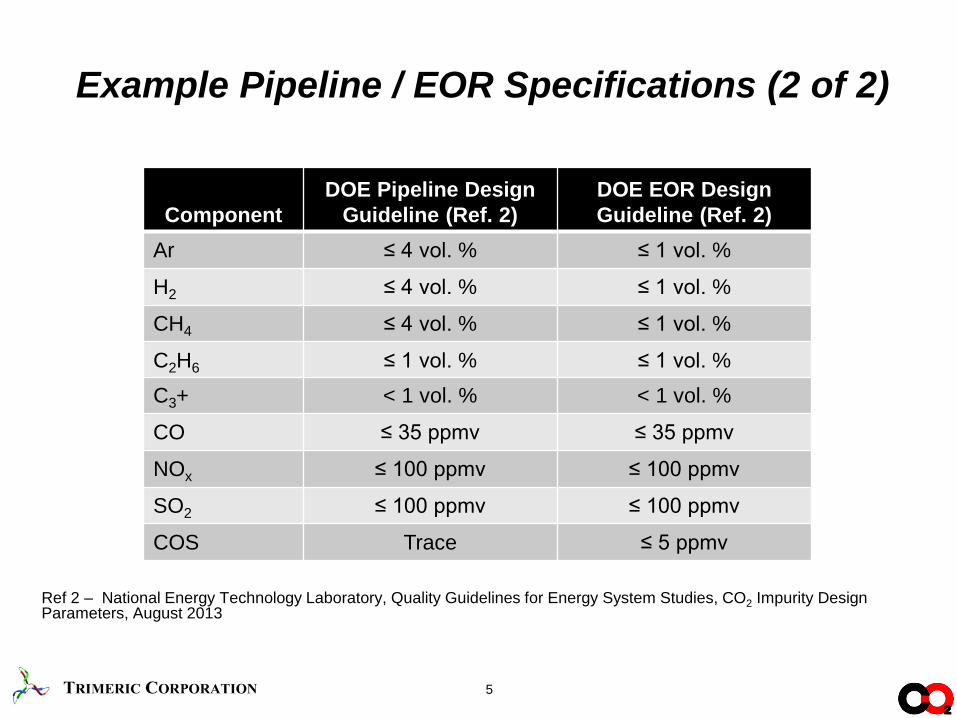
Example Pipeline / EOR Specifications (2 of 2)
5
Component DOE Pipeline Design
Guideline (Ref. 2) DOE EOR Design Guideline (Ref. 2)
Ar ≤ 4 vol. % ≤ 1 vol. %
H2 ≤ 4 vol. % ≤ 1 vol. %
CH4 ≤ 4 vol. % ≤ 1 vol. %
C2H6 ≤ 1 vol. % ≤ 1 vol. % C3+ < 1 vol. % < 1 vol. %
CO ≤ 35 ppmv ≤ 35 ppmv
NOx ≤ 100 ppmv ≤ 100 ppmv
SO2 ≤ 100 ppmv ≤ 100 ppmv
COS Trace ≤ 5 ppmv
Ref 2 – National Energy Technology Laboratory, Quality Guidelines for Energy System Studies, CO2 Impurity Design Parameters, August 2013

Corrosion of carbon steel
Impacts of Water in CO2
6
CO2-H2O Hydrates
Puck of solid CO2 hydrate http://www.bgs.ac.uk/scienceFacilities/laboratories/research/hydrates.html
Corrosion of carbon steel tube sheet placed in wet CO2, water condensing service.

Saturation Water Content in CO2
7
Figure used courtesy of GPSA. Ref 3 - GPSA Engineering Data Book, 12th Ed., Figure 20-6
Note that example limit of 30 lb water / MMscf (633 ppmv) is well below saturation limit of CO2 at typical pipeline operating temperatures.

Phase, Pressure, and Temperature – Impacts on Corrosion in CO2 Pipeline and EOR Applications
8
• Under normal conditions, a free liquid phase (usually water) has to be present for corrosion to occur in CO2 pipeline and EOR applications
• Higher partial pressure and temperature of CO2 generally
increase the corrosion rate – Increasing concentration of CO2 increases partial pressure of CO2 – Increasing total pressure increases partial pressure of CO2
• de Waard-Milliams Equation (Ref 4)
Log Vcorr = 5.8 – 1710 / (273+t) + 0.67 log (pCO2)
Vcorr in mm/year, t is temp in oC, and pCO2 is partial pressure of CO2 in bar
Ref 4 – de Waard C, Lotz U. Prediction of CO2 corrosion of carbon steel. Corrosion/93 Paper No 69, NACE, Houston, Texas 1993

Impurity Impacts on Corrosion in CO2 Pipeline and EOR Applications
9
• At 75% relative saturation, an O2 concentration of 1 mol. % (10,000 ppmv) produced a corrosion rate of 0.37 – 0.40 mils per year (Ref 5)
• At 75% relative saturation, an H2S concentration of 5 mol. % (50,000
ppmv) produced a corrosion rate of 0.16 mils per year (Ref 5) – Rule of thumb is that corrosion rates ≥ 1 mil per year begin to trigger
closer monitoring and perhaps efforts to reduce corrosion rates • Once CO2 containing small amounts (> 10 ppmv) of O2 or H2S is
injected in a formation and contacts water, corrosion and other problems in the injection well, the formation, and the recycle facility may occur
Ref 5 - GPA Research Report RR-222 “Corrosion in Acid Gas Injection Systems”, June 2014
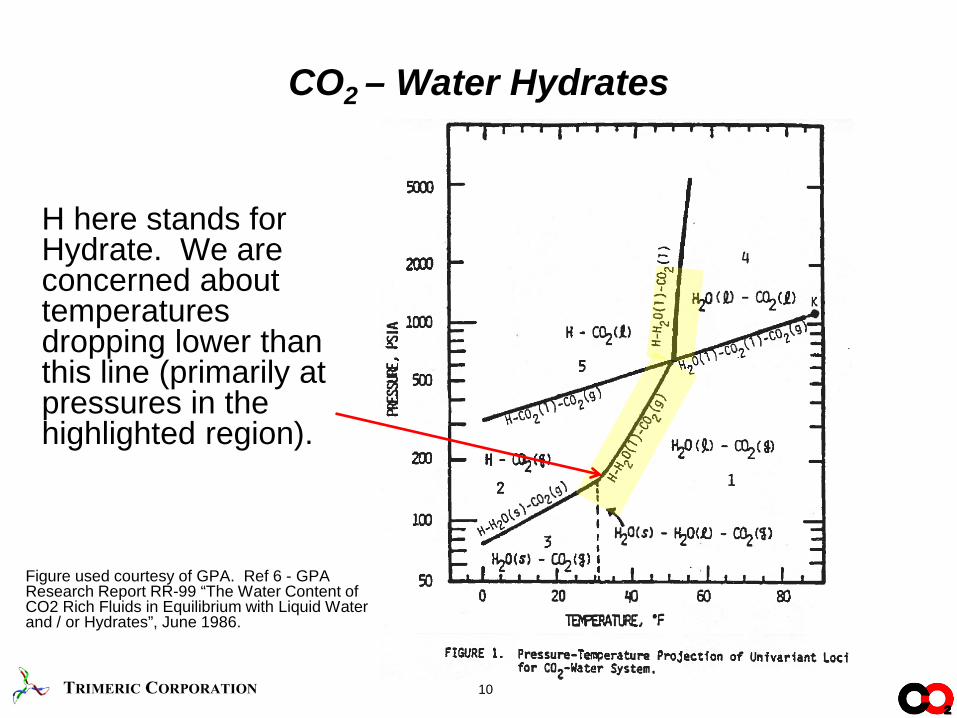
CO2 – Water Hydrates
10
Figure used courtesy of GPA. Ref 6 - GPA Research Report RR-99 “The Water Content of CO2 Rich Fluids in Equilibrium with Liquid Water and / or Hydrates”, June 1986.
H here stands for Hydrate. We are concerned about temperatures dropping lower than this line (primarily at pressures in the highlighted region).
Water Removal Costs (1 of 2)
11
• TEG (triethylene glycol) absorption-based dehydration is most common – Installed equipment costs are on the order of $ 30,000 / MMscfd of
treatment capacity (for a nominal 50 MMscfd plant) – Installed equipment costs in $ / MMscfd decrease with increasing
throughput capacity – Operating costs are fairly minimal (fuel gas, glycol)
• If pressure is higher than about 1,000 psig, glycerol is often
used instead of TEG – TEG solubility in CO2 increases with increasing pressure and losses
would be unacceptably high – Equipment costs are comparable to TEG – Operating costs are slightly higher
• Water loading is higher at these pressures, so fuel costs for regeneration are higher
• Glycerol is typically more expensive than TEG
Water Removal Costs (2 of 2)
12
• If refrigeration-based processes such as CO2 liquefaction for distillation or Natural Gas Liquids recovery are involved, then adsorption-based processes (molecular sieve) may be required – Higher capital and operating costs – Installed equipment costs are on the order of $ 50,000 /
MMscfd of treatment capacity (for a nominal 60 MMscfd plant)
– Installed equipment costs in $ / MMscfd decrease with increasing throughput capacity
– More complex operation • Cyclical operation of drying and regenerating beds • Monitor performance of media over time (months) and adjust cycle
times until it becomes necessary to replace adsorbent media (years)
Impacts of Oxygen
13
• Once CO2 containing O2 contacts water, the mixture is more corrosive than CO2 and water in the absence of O2
• Oxygen can lead to biological growth in the formation
• Oxygen can oxidize TEG and glycerol
• Oxygen can react with H2S under certain conditions to form
elemental sulfur, sulfuric acid, and / or other sulfur compounds
• It is difficult to treat a CO2 stream to remove oxygen – Liquefaction and distillation have been used in some applications – Some catalytic approaches may be applicable in principle – Preferred approach is to try and limit the introduction of oxygen at the
source

Comparison of H2S and CO2 Exposure Limits
14
Component OSHA Ceiling
OSHA PEL
OSHA IDLH
H2S 20 ppmv 50 ppmv for 10 minutes 100 ppmv
CO2 5,000 ppmv for 8 hour shift 40,000 ppmv
• Definitions – Ceiling - at no time should this exposure limit be exceeded – PEL – permissible exposure limit – IDLH – immediately dangerous to life or health
• While the toxicity of H2S is well known in this industry, the toxicity of pipeline / EOR quality CO2 also needs to be understood
• Toxicity risks of CO2 are not the same as the asphyxiation hazard of CO2
For more details, see Tyndall, K., K. McIntush, J. Lundeen, K. Fisher, C. Beitler, "When is CO2 more hazardous than H2S", Hydrocarbon Processing, January 2011, Vol. 90, No. 1, pp. 45-48.
Impacts of Hydrogen Sulfide (1 of 2)
15
• Limits on the order of 10 ppmv are often specified for these reasons: – Concerns with toxicity and odor – Avoid monitoring and public hearing requirements for Texas RR Comm. Rule
36 when H2S > 100 ppmv and similar rules in other states – May avoid designing to meet NACE MR0175 requirements to prevent sulfide
stress corrosion cracking
• Presence of H2S in CO2 EOR is common in West Texas, but > 10 ppmv in other areas can be a concern because concentrations could increase with recycle and H2S accumulates in in low pressure steps (flash and storage)
• H2S can react with O2 or SO2 under certain conditions to form elemental sulfur, sulfuric acid, and / or other sulfur compounds
Impacts of Hydrogen Sulfide (2 of 2)
16
• H2S lowers the minimum miscibility pressure, which is a benefit to EOR operations
• Trace amounts (10’s of ppmv) can usually be treated
economically with scavengers – Order of magnitude costs are $ 5 to $ 20 / lb of H2S removed – As an example, annual operating costs to treat 8 MMscfd of CO2 to
lower H2S from 440 to 4 ppmv are on the order of $ 750,000
• Higher levels (% levels) require liquid redox or absorption
processes – Higher capital costs than scavengers – Lower operating costs than scavengers
Impurities Impact Operating Costs
17
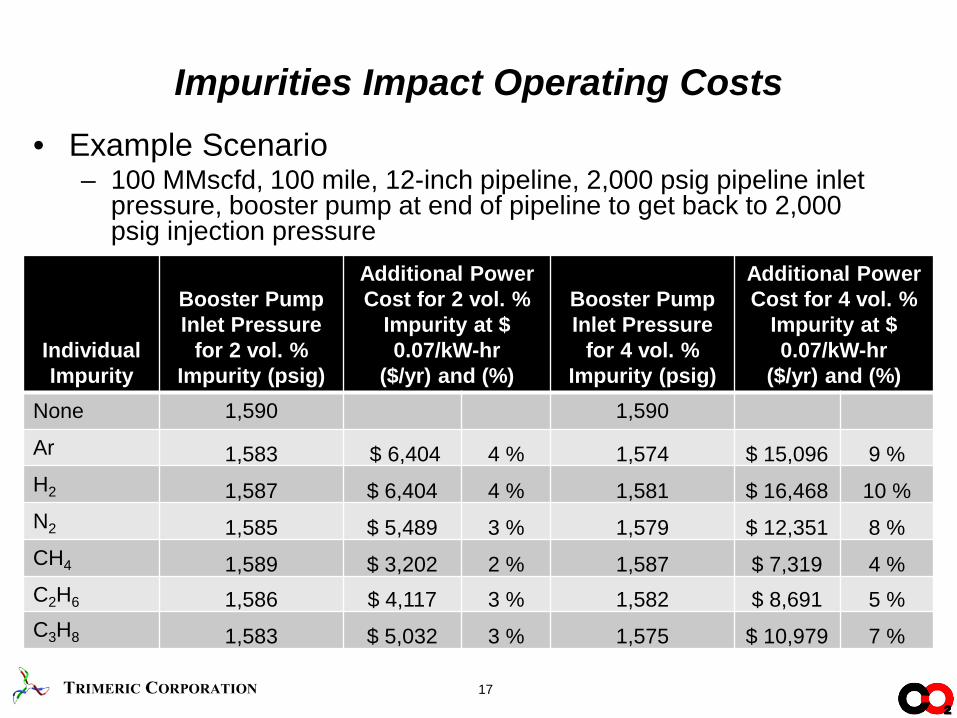
• Example Scenario – 100 MMscfd, 100 mile, 12-inch pipeline, 2,000 psig pipeline inlet
pressure, booster pump at end of pipeline to get back to 2,000 psig injection pressure
Individual Impurity
Booster Pump Inlet Pressure
for 2 vol. % Impurity (psig)
Additional Power Cost for 2 vol. %
Impurity at $ 0.07/kW-hr
($/yr) and (%)
Booster Pump Inlet Pressure
for 4 vol. % Impurity (psig)
Additional Power Cost for 4 vol. %
Impurity at $ 0.07/kW-hr
($/yr) and (%) None 1,590 1,590
Ar 1,583 $ 6,404 4 % 1,574 $ 15,096 9 % H2 1,587 $ 6,404 4 % 1,581 $ 16,468 10 % N2 1,585 $ 5,489 3 % 1,579 $ 12,351 8 % CH4 1,589 $ 3,202 2 % 1,587 $ 7,319 4 % C2H6 1,586 $ 4,117 3 % 1,582 $ 8,691 5 % C3H8 1,583 $ 5,032 3 % 1,575 $ 10,979 7 %

Impacts of Nitrogen
18
• N2 will increase the minimum miscibility pressure and raise the critical pressure, which increase operating costs and are detrimental for oil production
• N2 will decrease the saturation water content of CO2
• N2 will increase the potential for hydrate formation
• Presence of N2 can require increased transport pipe strength due to ductility issues (Ref 2)
• Some operators place a limit on the total “light gases”, “non-
condensables”, or “inerts” in the range of 2 vol. % to 4 vol. % Ref 2 – National Energy Technology Laboratory, Quality Guidelines for Energy System Studies, CO2 Impurity Design Parameters, August 2013

Impacts of Hydrogen
19
• H2 will increase the minimum miscibility pressure and raise the critical pressure, which increase operating costs and are detrimental for oil production
• Presence of H2 can require increased transport pipe strength due to ductility issues (Ref 2)
• Some operators place a limit on the total “light gases”, “non-
condensables”, or “inerts” in the range of 2 vol. % to 4 vol. %
• H2 is valuable and would likely be lowered to far less than 4 vol. % in a CO2 stream under normal operating conditions
Ref 2 – National Energy Technology Laboratory, Quality Guidelines for Energy System Studies, CO2 Impurity Design Parameters, August 2013

Impacts of Methane
20
• CH4 will increase the minimum miscibility pressure and raise the critical pressure, which increase operating costs and are detrimental for oil production
• CH4 will decrease the saturation water content of CO2
• CH4 will increase the potential for hydrate formation • Hydrocarbons accumulate in recycle CO2 over time in
facilities without NGL recovery – Changes the viscosity of the oil by stripping away lighter components – Takes up pore space, which is detrimental to CO2 EOR
• Some operators place a limit in the range of 0.3 vol. % to 1 vol. % on CH4
Impacts of Other Hydrocarbons
21
• C2H6, C3H8, and heavier hydrocarbons will decrease the minimum miscibility pressure, which is beneficial for oil production
• Hydrocarbons accumulate in recycle CO2 over time in
facilities without NGL recovery – Change the viscosity of the oil by stripping away lighter components – Take up pore space, which is detrimental to CO2 EOR
• Some operators place a limit in the range of 3 vol. % to 5 vol. % on total hydrocarbons
• Hydrocarbon removal (including CH4) is typically done with membranes or via liquefaction and distillation – Capital intensive process on the order of $ 80 MM for a 200 MMscfd facility – Capital and operating costs may be offset by NGL and sales gas revenue
Impacts of CO, NOx, SO2, and COS
22
• Limits on CO, NOx, and SO2 are largely driven by health and safety related exposure limits
• COS is a concern for the following reasons:
– COS can hydrolyze to H2S in the presence of free water, which means that pipeline CO2 that starts with COS may come back as CO2 with H2S in the recycle stream
– COS is unacceptable in food and beverage CO2 product and removal costs are significant
• As more manmade CO2 sources are transported in pipelines and used for EOR, the impacts of these types of impurities will become better understood and current proposed limits may be revised
Impacts of Glycol and Compressor Oil
23
• In addition to concentration limits, specifications may require that no glycol can be present in a liquid state at the pressure and temperature conditions of the pipeline
• Excess glycol carryover can cause damage to seals and
other components (Ref 2) • Use of mineral oil for CO2 compressor cylinder lubricant has
led to asphaltene plugging issues in injection wells requiring acid treatments
• Use of higher cost synthetic oil avoids this problem, but it is
important to keep mineral oil and synthetic oil separate because they can form a gel when mixed together
Ref 2 – National Energy Technology Laboratory, Quality Guidelines for Energy System Studies, CO2 Impurity Design Parameters, August 2013
Conclusions
24
• Limiting impurities in CO2 transported in pipelines and used for EOR is necessary to ensure reliable operation and to protect health, safety, and the environment
• Specification limits must be determined on a case by case basis considering the source of the CO2 and the use of the CO2
• As more manmade CO2 is transported in pipelines and used
for EOR, impacts of newer types of impurities will be become better understood and proposed limits may be revised