A NEW HEDGE FUND REPLICATIONMETHOD WITH THE DYNAMIC OPTIMAL … · global journal of business...
12
GLOBAL JOURNAL OF BUSINESS RESEARCH ♦ VOLUME 4 ♦ NUMBER 4 ♦ 2010 A NEW HEDGE FUND REPLICATION METHOD WITH THE DYNAMIC OPTIMAL PORTFOLIO Akihiko Takahashi, The University of Tokyo Kyo Yamamoto, The University of Tokyo ABSTRACT This paper provides a new hedge fund replication method, which extends Kat and Palaro (2005) and Papageorgiou, Remillard and Hocquard (2008) to multiple trading assets with both long and short positions. The method generates a target payoff distribution by the cheapest dynamic portfolio. The work here extends the work of of Dybvig (1988) to a continuous-time framework and dynamic portfolio optimization where the dynamic trading strategy is derived analytically by applying Malliavin calculus. It is shown that cost minimization is equivalent to maximization of a certain class of von Neumann- Morgenstern utility functions. The method is applied to the replication of a CTA/Managed Futures Index in practice. JEL: G11, G20, G23 KEYWORDS: Hedge Fund Replication, Dynamic Portfolio Optimization, Martingale Method, Malliavin Calculus INTRODUCTION edge fund replication products appeared in the financial markets recently. Investment banks and asset management companies launched the products one after another. Some of these institutions developed replication techniques collaborating with the pioneers in hedge fund research. Therefore, these products have gained increased attention. Hedge fund replication overcomes the following difficulties in hedge fund investing: high cost, low transparency, and low liquidity. The importance of transparency and liquidity was recognized after the subprime and Lehman shocks. Existing methods of hedge fund replication can be categorized in three ways: rule-based, factor-based, and distribution replicating approaches. Our method is categorized as distribution replicating approach. The previous studies are Kat and Palaro (2005) and Papageorgiou et al. (2008). Kat and Palaro (2005) tried to replicate the return distribution of the target hedge fund and its dependence structure on an investor’s existing portfolio through the dynamic trading of the portfolio (proxied by a portfolio of stock index and bond futures) and another asset. Papageorgiou et al. (2008) proposed an alternative way to perform Kat-Palaro’s replication methodology by utilizing a hedging scheme of options in an incomplete market. This article extends these previous works. The methods developed by the two earlier research papers use only one asset as a replication tool. Moreover, they can take only long positions. Therefore, the user of the methods should pay attention to asset choice. On the other hand, our new method allows multiple assets with both long and short positions for creating a replicating portfolio. When the investment universe is extended to multiple assets, a criterion that chooses a payoff should be introduced because there are infinitely many payoffs that have the same statistical properties as the target hedge fund. This paper proposes to choose the cheapest one. By extending the work of Dybvig (1988) to continuous-time framework, the cheapest payoff is obtained. Then, the dynamic trading strategy is derived analytically by applying Malliavin calculus. For replicating the marginal distribution of the target hedge fund return, it is shown that cost minimization is equivalent to maximization of a certain class of von Neumann- Morgenstern utility functions. In the subprime and Lehman shocks, CTA/Managed Futures funds enjoyed high returns by controlling their exposures efficiently. (See figure 1.) This paper replicates CTA/Managed Futures Index. Other H 23
Transcript of A NEW HEDGE FUND REPLICATIONMETHOD WITH THE DYNAMIC OPTIMAL … · global journal of business...
GLOBAL JOURNAL OF BUSINESS RESEARCH ♦ VOLUME 4 ♦ NUMBER 4 ♦ 2010
A NEW HEDGE FUND REPLICATION METHOD WITH THE DYNAMIC OPTIMAL PORTFOLIO
Akihiko Takahashi, The University of Tokyo Kyo Yamamoto, The University of Tokyo
ABSTRACT
This paper provides a new hedge fund replication method, which extends Kat and Palaro (2005) and Papageorgiou, Remillard and Hocquard (2008) to multiple trading assets with both long and short positions. The method generates a target payoff distribution by the cheapest dynamic portfolio. The work here extends the work of of Dybvig (1988) to a continuous-time framework and dynamic portfolio optimization where the dynamic trading strategy is derived analytically by applying Malliavin calculus. It is shown that cost minimization is equivalent to maximization of a certain class of von Neumann-Morgenstern utility functions. The method is applied to the replication of a CTA/Managed Futures Index in practice. JEL: G11, G20, G23 KEYWORDS: Hedge Fund Replication, Dynamic Portfolio Optimization, Martingale Method, Malliavin Calculus INTRODUCTION
edge fund replication products appeared in the financial markets recently. Investment banks and asset management companies launched the products one after another. Some of these institutions developed replication techniques collaborating with the pioneers in hedge fund research.
Therefore, these products have gained increased attention. Hedge fund replication overcomes the following difficulties in hedge fund investing: high cost, low transparency, and low liquidity. The importance of transparency and liquidity was recognized after the subprime and Lehman shocks. Existing methods of hedge fund replication can be categorized in three ways: rule-based, factor-based, and distribution replicating approaches. Our method is categorized as distribution replicating approach. The previous studies are Kat and Palaro (2005) and Papageorgiou et al. (2008). Kat and Palaro (2005) tried to replicate the return distribution of the target hedge fund and its dependence structure on an investor’s existing portfolio through the dynamic trading of the portfolio (proxied by a portfolio of stock index and bond futures) and another asset. Papageorgiou et al. (2008) proposed an alternative way to perform Kat-Palaro’s replication methodology by utilizing a hedging scheme of options in an incomplete market. This article extends these previous works. The methods developed by the two earlier research papers use only one asset as a replication tool. Moreover, they can take only long positions. Therefore, the user of the methods should pay attention to asset choice. On the other hand, our new method allows multiple assets with both long and short positions for creating a replicating portfolio. When the investment universe is extended to multiple assets, a criterion that chooses a payoff should be introduced because there are infinitely many payoffs that have the same statistical properties as the target hedge fund. This paper proposes to choose the cheapest one. By extending the work of Dybvig (1988) to continuous-time framework, the cheapest payoff is obtained. Then, the dynamic trading strategy is derived analytically by applying Malliavin calculus. For replicating the marginal distribution of the target hedge fund return, it is shown that cost minimization is equivalent to maximization of a certain class of von Neumann-Morgenstern utility functions. In the subprime and Lehman shocks, CTA/Managed Futures funds enjoyed high returns by controlling their exposures efficiently. (See figure 1.) This paper replicates CTA/Managed Futures Index. Other
H
23
A. Takahashi, K. Yamamoto| GJBR ♦ Vol. 4 ♦ No. 4 ♦ 2010
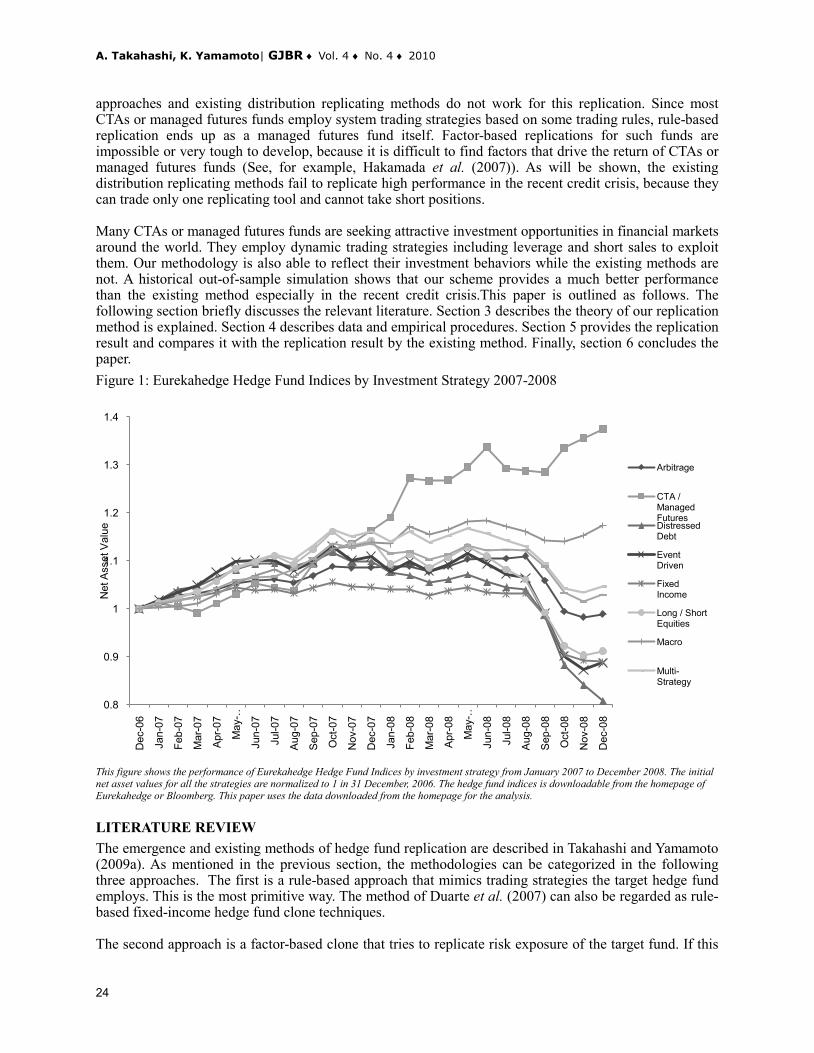
approaches and existing distribution replicating methods do not work for this replication. Since most CTAs or managed futures funds employ system trading strategies based on some trading rules, rule-based replication ends up as a managed futures fund itself. Factor-based replications for such funds are impossible or very tough to develop, because it is difficult to find factors that drive the return of CTAs or managed futures funds (See, for example, Hakamada et al. (2007)). As will be shown, the existing distribution replicating methods fail to replicate high performance in the recent credit crisis, because they can trade only one replicating tool and cannot take short positions. Many CTAs or managed futures funds are seeking attractive investment opportunities in financial markets around the world. They employ dynamic trading strategies including leverage and short sales to exploit them. Our methodology is also able to reflect their investment behaviors while the existing methods are not. A historical out-of-sample simulation shows that our scheme provides a much better performance than the existing method especially in the recent credit crisis.This paper is outlined as follows. The following section briefly discusses the relevant literature. Section 3 describes the theory of our replication method is explained. Section 4 describes data and empirical procedures. Section 5 provides the replication result and compares it with the replication result by the existing method. Finally, section 6 concludes the paper. Figure 1: Eurekahedge Hedge Fund Indices by Investment Strategy 2007-2008
This figure shows the performance of Eurekahedge Hedge Fund Indices by investment strategy from January 2007 to December 2008. The initial net asset values for all the strategies are normalized to 1 in 31 December, 2006. The hedge fund indices is downloadable from the homepage of Eurekahedge or Bloomberg. This paper uses the data downloaded from the homepage for the analysis. LITERATURE REVIEW The emergence and existing methods of hedge fund replication are described in Takahashi and Yamamoto (2009a). As mentioned in the previous section, the methodologies can be categorized in the following three approaches. The first is a rule-based approach that mimics trading strategies the target hedge fund employs. This is the most primitive way. The method of Duarte et al. (2007) can also be regarded as rule-based fixed-income hedge fund clone techniques. The second approach is a factor-based clone that tries to replicate risk exposure of the target fund. If this
0.8
0.9
1
1.1
1.2
1.3
1.4
Dec
-06
Jan-
07
Feb-
07
Mar
-07
Apr
-07
May
-…
Jun-
07
Jul-0
7
Aug
-07
Sep
-07
Oct
-07
Nov
-07
Dec
-07
Jan-
08
Feb-
08
Mar
-08
Apr
-08
May
-…
Jun-
08
Jul-0
8
Aug
-08
Sep
-08
Oct
-08
Nov
-08
Dec
-08
Net
Ass
et V
alue
Arbitrage
CTA / Managed FuturesDistressed Debt
Event Driven
Fixed Income
Long / Short Equities
Macro
Multi-Strategy
24
GLOBAL JOURNAL OF BUSINESS RESEARCH ♦ VOLUME 4 ♦ NUMBER 4 ♦ 2010
method succeeds, then the return of the replica tracks that of the target fund on a month-to-month basis. This is the ideal replication, but this method requires finding tradable market factors that drive the return of the target hedge fund. Lo and Hasanhodzic (2006) and Fung and Hsieh (2007a, 2007b) studied a factor-based approach. The techniques of factor analysis for hedge funds that have been developed from the late 1990s such as that of Fung and Hsieh (1997, 2000, 2001) and Agarwal and Naik (2004) are directly applied to the replication. The third approach is distribution replication that gives up month-to-month return replication, and aims to replicate the distribution of hedge fund returns. Amin and Kat (2003) first tried the replication. However, an attractive character of hedge fund returns is low dependence with returns of traditional asset classes. Further, Kat and Palaro (2005) and Papageorgiou et al. (2008) developed modified method to replicate the dependence structure with the investor’s existing portfolio, too. This paper extends the methods developed by Kat and Palaro (2005) and Papageorgiou et al. (2008) to multiple trading assets with long and short positions. The dynamic replicating portfolio is obtained by applying Malliavin calculus. See, for example, Nualart (2006) for the introduction to Malliavin calculus. By extending theorem 2 in Dybvig (1988) to continuous-time framework, it is shown that generation of a target marginal distribution is equivalent to maximization of certain class of von Neumann-Morgenstern utility functions. In a complete market, martingale method is a powerful approach to obtain the dynamic portfolio that maximizes a von Neumann-Morgenstern utility function. See, for example, Karatzas and Shreve (1998) for the basics of martingale method. To obtain the concrete expression of the optimal portfolio, Clark-Ocone formula in Malliavin calculus is useful. For example, Detemple et al. (2008) surveyed the Monte Carlo methods for the computation of the optimal portfolio policies. Takahashi and Yoshida (2004) applied an asymptotic expansion method to the optimal investment problems in the analytic approximation methods. Our method can be also considered as an alternative dynamic portfolio optimization assuming not an agent’s utility but a target payoff distribution. THE THEORY First, we review the distribution replication method of hedge fund returns proposed by Kat and Palaro (2005). Consider an investor who has been investing in traditional assets such as stocks and bonds, and plans to invest in a hedge fund. It is assumed that he is attracted to the hedge fund because the distribution of returns and the dependence structure in his existing portfolio of bonds and stocks. Suppose that
S0 is a risk-free asset,
S1 is an investor’s existing portfolio, and
S2 is a risky asset (replicating tool). Assume that 1S is also tradable. (It is proxied by a portfolio of stock index and bond futures.) Let 0 and T be the start
and terminal dates of the investment, respectively. Kat-Palaro’s approach tries to the return distribution of the hedge fund and dependence structure with the investor’s existing portfolio by the dynamic trading strategy of the investor’s portfolio
S1 and another risky asset
S2. To implement the replicating strategy, we need to proceed with the following steps. First, the stochastic
processes { }TttS 0
1= and { }T
ttS 02
= are inferred. The initial asset values are normalized so that .120
10 == SS
Following that, the joint distribution of 11 log TT SR = and 22 log TT SR = is also obtained. Let be the
random variable that represents the log return of the target hedge fund. Second, the joint distribution of
the investor’s portfolio and hedge fund returns ),( 1TT RR is estimated. This is the target joint distribution
25
A. Takahashi, K. Yamamoto| GJBR ♦ Vol. 4 ♦ No. 4 ♦ 2010
to replicate. Third, the payoff function, which transforms the joint distribution of ),( 21TT RR to that of
),( 1TT RR , is determined. Finally, the payoff is priced is replicated through the dynamic trading of 1S and
2S .
In the first step )}{and}{ofinference( 02
01 T
tTTtT SS == , Kat and Palaro (2005) and Papageorgiou et al. (2008)
modeled by Gaussian and non-Gaussian distributions, and selected the best-fitting one. As hedge funds
exhibit skewness and fat-tails, and are non-linearly related to traditional asset classes, in the second step
(estimation of (RT1 , RT )), Kat and Palaro (2005) proposed to model 1
TR and
RT separately, and then
connect them by a copula. For hedge fund returns, it is desirable to use the distribution class that can
capture its skewness and fat-tails. For example, Kat and Palaro (2005) and Papageorgiou et al. (2008)
used Gaussian, Student-t, Gaussian mixture and Johnson distributions. Some copulas can capture the
asymmetric dependence structure flexibly. After estimating the parameters and selecting models of the asset returns and price processes, a payoff function is determined. To obtain the joint distribution of the investor’s portfolio and hedge fund returns through the dynamic trading of the investor’s portfolio and the replicating tool, a function that satisfies the following equation is required.
,,anyfor),()),(~,( 1211 babRaRPbRRgaRP TTTTT ≤≤=≤≤ (1)
or equivalently,
.,anyfor)|()|),(~( 1121 baaRbRPaRbRRgP TTTTT =≤==≤ (2)
Then, g~ is given by
)),((),(~|
1| 2 bFFbag
aRaRTT
−=
)),((),(~
|1| 2 bFFbag
aRaRTT
−= (3)
where aRTF | and
aRTF
|2 are the conditional distribution functions of
RT and 2TR under aRT =1 . In terms
of the asset prices, the payoff function is represented as
{ }.)log,(log~exp),(ˆ 2121TTTT SSgSSg =
(4)
If one obtained the payoff function, the replicating strategy encounters the same problem with pricing and
hedging of derivatives. The dynamic replicating strategy is given by the delta-hedging strategy of the
payoff ).,(ˆ 21TT SSg
26

GLOBAL JOURNAL OF BUSINESS RESEARCH ♦ VOLUME 4 ♦ NUMBER 4 ♦ 2010
If the initial cost for the trading strategy is less (more) than 1, then the target payoff can be realized by a lower (higher) cost. The remaining (shortage of) money is invested (funded) in the risk-free asset. The shape of the probability density can be replicated, but the mean return is higher (lower) than the target fund by the difference of the initial cost. In this case, the replicating tool does (does not) include greater investment opportunity than the target hedge fund. Note that the payoff function ),(ˆ ⋅⋅g is an increasing function with respect to the second argument. Then, the delta-hedging strategy never takes a short position for
S2. In page 17-18 of Kat and Palaro (2005), the authors claim that users of this method should choose the replicating tool
S2 that has the positive expected return factor uncorrelated to the return of the investor’s portfolio. Then, the long position for
S2 is justified. In this case, the choice of a replicating tool is crucial. As described here, this methodology can replicate the shape of the probability density, but cannot fit the mean. If you found a greater investment opportunity than the target fund, the mean return would be superior and vice versa. Therefore, the usage of only one risky asset is restrictive. Papageorgiou et al. (2008) synthesized multiple assets to create a replicating tool by equal-weighing, but there would be inefficiencies in the ad hoc fixed weighted portfolio. The extension of the investment universe would bring in higher mean returns.
Let us extend the replication method to multiple assets. See Takahashi and Yamamoto (2009b) for a
rigorous argument. Suppose that nSS ,,2 are risky assets (replicating tools). Suppose that the price
processes of the financial assets nt
itS 0}{ = ( ni ,,0 = ) follow stochastic differential equations (SDEs)
,00 dtSrdS ttt = (5)
),,,1(1
nidWSdtSdS jt
it
i
j
ijt
it
it
it =+= ∑
=
σµ (6)
where ),,( 1 ′= nttt WWW is n-dimensional standard Brownian motion. ij
tittr σµ and,, satisfy
appropriate measurability and integrability conditions. All of the initial asset values are normalized, so
that 1000 === nSS . The following notations by n-dimensional vectors and a nn × matrix are
introduced: ,)1,,1(1,),,(,),,( 11 ′=′=′=
nttt
nttt SSS µµµ and
.1
11
=nnt
nt
t
t
O
σσ
σσ
(7)
Suppose that is invertible almost surely. Then, there exists the unique market price of risk
).1(1
tttt r−= − µσθ In other words, the financial market is complete. The financial market is denoted by
M= (r, μ, σ).
27

A. Takahashi, K. Yamamoto| GJBR ♦ Vol. 4 ♦ No. 4 ♦ 2010
In complete market M, the unique state price density process is given by
.21exp
0 0
2
0
′−−−= ∫ ∫∫
t t
uuu
t
ut dWdudurH θθ (8)
The no-arbitrage price of any measurable payoff X at T is given by ].[ XHEx T= By the standard
argument of martingale method, X can be replicated by a dynamic trading of the financial assets with
initial cost x. For convenience, the minus logarithm state price density process tL is introduced:
.21
0 0
2
0 ∫ ∫∫ ′++=t t
uuu
t
ut dWdudurL θθ (9)
Let ξ be a positive payoff at time T. Let sF |ξ and sLTF | be the conditional distribution functions of ξ
and TL under condition .1 sST = Assume that sF |ξ and sLTF | are continuous and strictly increasing for
any s > 0. If X is defined as follows, ),( 1 XST has the same joint distribution as ),( 1 ξTS :
),,( 1TT LSgX = (10)
where
)).((),( |1
| lFFlsg sLs T
−= ξ (11) The next theorem asserts that X is the unique cheapest payoff among the random variables whose joint distributions with 1
TS are same as ).,( 1 ξTS Theorem 1 in Dybvig (1988) is the equally probable finite state setting version of the theorem.
Theorem 1 Assume ξ is a positive payoff at time T, and sF |ξ and sLTF | are continuous and strictly
increasing for any s > 0. In a complete market M, the unique cheapest payoff X among the random variables whose joint distributions with 1
TS are same as ),( 1 ξTS by equation (10). See Takahashi and Yamamoto (2009b) for the proof. If condition sST =1 is not taken account, the following claim can be proven. Let ξF and
TLF be the distribution functions of ξ and TL respectively. Assume that ξF and
TLF are continuous and strictly increasing. If X is defined by )),((1TL LFFX
T
−= ξ X is the unique cheapest payoff among the random variables that has the same marginal distribution with ξ. The next theorem asserts that the cost minimization for the marginal payoff distribution is equivalent to an expected utility maximization. Theorem 2 in Dybvig (1988) is the equally probable finite state setting version of the theorem. To state the theorem in continuous-time framework, two additional conditions are required for the utility function.
Theorem 2 Assume ξ is a positive payoff at time T, and ξF and TLF are continuous and strictly
increasing. If X is the cheapest payoff that has the same distribution with ξ, then, in a complete market M,
there exists a strictly increasing and strictly concave von Neumann-Morgenstern utility function )(⋅u
such that (a) ,)(lim0
+∞=′+→
zuz
(b) ,0)(lim =′+∞→
zuz
and the dynamic trading strategy that attains payoff X
28
GLOBAL JOURNAL OF BUSINESS RESEARCH ♦ VOLUME 4 ♦ NUMBER 4 ♦ 2010
is the optimal investment strategy for ).(⋅u Conversely, if a dynamic trading strategy maximizes a strictly
increasing and strictly concave von Neumann-Morgenstern utility function )(⋅u that satisfies conditions
(a) and (b), it attains the cheapest payoff for some distribution. See Takahashi and Yamamoto (2009b) for the proof. This theorem supports our method theoretically. Moreover, it ensures that our method is applicable to not only hedge fund replication but also dynamic portfolio optimization in investment management. Let us see the dynamic portfolio that replicates the cheapest payoff. Let i
tπ (i = 0,…, n) represent the money amount invested in asset i at time t. n-dimensional vector i
tπ is defined by ),,( 1 nttt πππ = ,
which denotes the portfolio of risky assets. Let x be the initial cost required to realize the cheapest payoff TX for some payoff distribution. The initial cost x is invested in the financial assets by a dynamic self-
financing trading strategy to generate payoff TX . In other words, the portfolio value at time t, tX , satisfies
10
tttX ππ ′+= (12)
for any t. In a differential form this is,
.)1( ttttttttt dWdtrdtXrdX σπµπ ′+−′+=
(13) The dynamic portfolio can be obtained for the case of Markovian coefficients. (See Takahashi and Yamamoto (2009b).) This paper assumes that are deterministic functions of t. By applying Malliavin calculus, the dynamic portfolio generating the cheapest payoff is obtained. Proposition 1 Assume that r, μ and σ are deterministic functions of t. Then, in a complete market M, The
dynamic portfolio generating payoff ),( 1TT LSgX = is given by
,)( 1tt t φσπ −′= (14)
where is given by
],),([)()],([)( 111
111
2
11
TTTTtt
TTTtt
t SLSgHEH
tLSgHEH
t σθφ += (15)
,,,2)],([)( 12 niforLSgHE
Ht
TTTtt
iit ==
θφ (16)
where jg represents the partial derivative of g with respect to argument j.
The interpretations for the optimal portfolio constituent factors are as follows. )],([1 12 TTTt
t
LSgHEH
is
the present value of the sensitivity of the terminal payoff to the change of .TL This quantity corresponds to delta in the option theory. The volume of the risky asset portfolio increases in this quantity. This factor contributes to generating the target distribution. In addition, the replicating strategy allocates wealth to tradable assets according to the market price of risk )(tiθ . Through this operation, the cheapest strategy is realized. The second term of 1
tφ is the present value of the sensitivity of the terminal payoff to the change of .1
TW This term contributes to the generation of the dependence structure on the investor’sexisting portfolio.
),,( 1 ′= nttt φφφ
29
A. Takahashi, K. Yamamoto| GJBR ♦ Vol. 4 ♦ No. 4 ♦ 2010
DATA AND METHODOLOGY Let us replicate Eurekahedge CTA/Managed Futures Index. The replication test is conducted on an out-of-sample basis. This paper uses the following investor’s existing portfolio and risky assets. Assume that the investor’s portfolio 1S is composed of 50% Japanese stocks and 50% Japanese government bonds (JGB). Since these assets are traded dynamically, TOPIX futures and long-term JGB futures were used as the proxies. Both of these securities are listed on the Tokyo Stock Exchange. The S&P 500 futures, NYMEX WTI crude oil futures, COMEX gold futures, and JPY against USD spot currency are used as replicating tools. It is considered that CTAs and managed futures funds invest in these assets. All the data are obtained from Bloomberg. The log returns on futures are calculated by rolling the front contract. The front contract is rolled on the last trading day of the maturity month. Our base currency is USD. Since TOPIX and JGB futures are denominated in JPY, a currency hedge is applied. Accordingly, the log returns of these assets are adjusted by the difference between the interest rates of USD and JPY. Libor rates are used for the interest rates. Using past data, the following procedures were performed on a monthly basis to estimate and select the best-fitted model of the target return distribution and its dependence structure on the investor’s portfolio. First, the parameter estimation and model selection for the marginal distribution of monthly log returns of the CTA/Managed Futures Index are performed using the same method as with Papageorgiou et al. (2008). The best-fitted model is chosen from a Gaussian mixture with m regimes (m = 1, 2, 3, 4, 5) and Johnson unbounded distribution. Next, the copula model between the monthly log returns of the replication target and the investor’s portfolio is estimated and selected in the same manner as that in Papageorgiou et al. (2008), which is based on the ranking of the time-series data. The copula is selected from the Gaussian, Student, Clayton, Frank and Gumbel. In this example, it is assumed that the coefficients of the investor’s portfolio and the replicating tool price processes are constant during a month. The parameters for the investor’s portfolio and the replicating tools are estimated by maximum likelihood. The daily data in the previous month are used for the estimation in order to reflect the trend-following investment strategy. Finally, payoff function (10) is replicated by dynamic replicating portfolio (14). The portfolio is rebalanced on a daily basis. The conditional expectations in equations (15) and (16) can be numerically calculated by Monte Carlo simulations with two-dimensional Gaussian distributions. Therefore, the computational burden to obtain the dynamic replicating strategy is not different from that of the one replicating tool case. For the purpose of comparison, the replication result of only one asset with only long position (Kat-Palaro’s method) is also shown. Here, the replicating tool is the equally weighted portfolio of the four assets used by our method. The transaction costs are assumed to be one basis point for the sale and purchase of all assets. The inception month of Eurekahedge CTA/Managed Futures Index is January 2000. The data from the first two years since inception are used to estimate the return distributions while the monthly log returns from January 2002 to October 2009 were replicated by multiple assets (our method) and single asset (Kat and Palaro’s method), which is composed by the equal-weighted portfolio of the four replicating tools. RESULTS Figure 2 shows the growth of net asset values of the target and two replication strategies. The replication by multiple assets performed better than the target. However, note that the performance of the replication target is after deduction of management and performance fees, while those of replications are not. Although the replication by single asset with only long positions performed well before July 2007, it incurred a large drawdown after this period. This is because the replicating tool substantially declined but the method could not take the short position for the asset. CTAs or managed futures funds attract investors because they enjoy high returns during the financial market crises. However, the replication by single replicating tool with only long position failed to reproduce the character. On the other hand, the
30
GLOBAL JOURNAL OF BUSINESS RESEARCH ♦ VOLUME 4 ♦ NUMBER 4 ♦ 2010
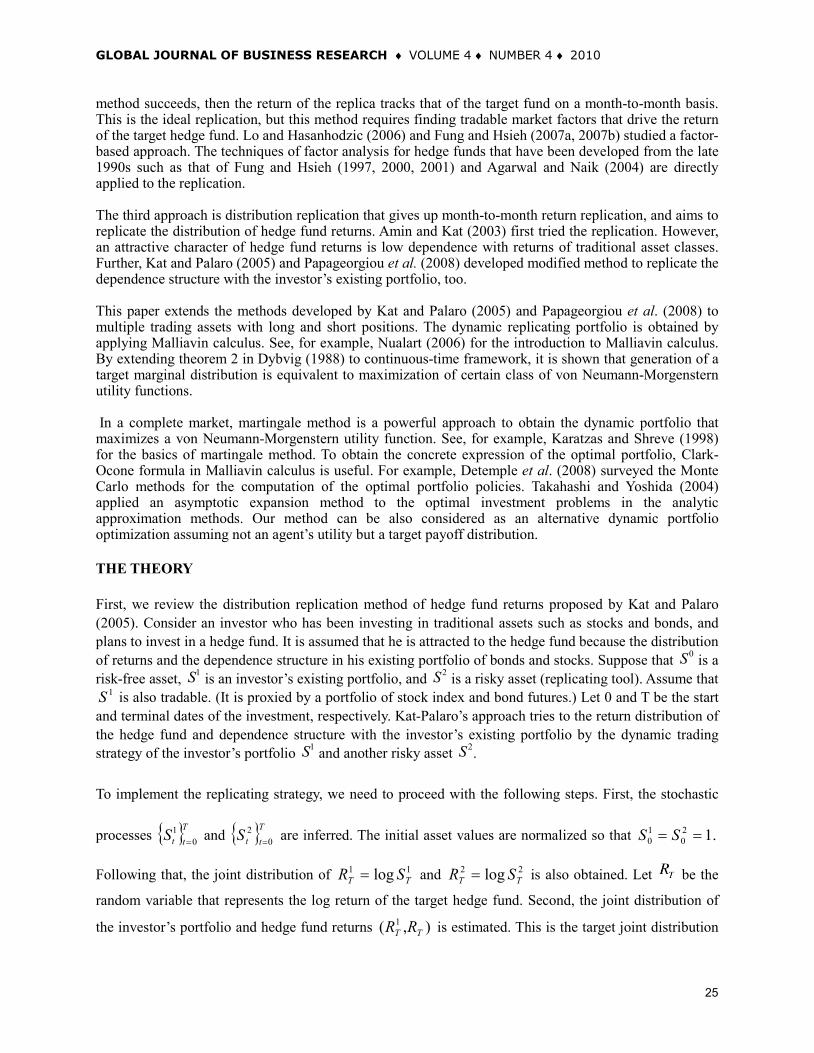
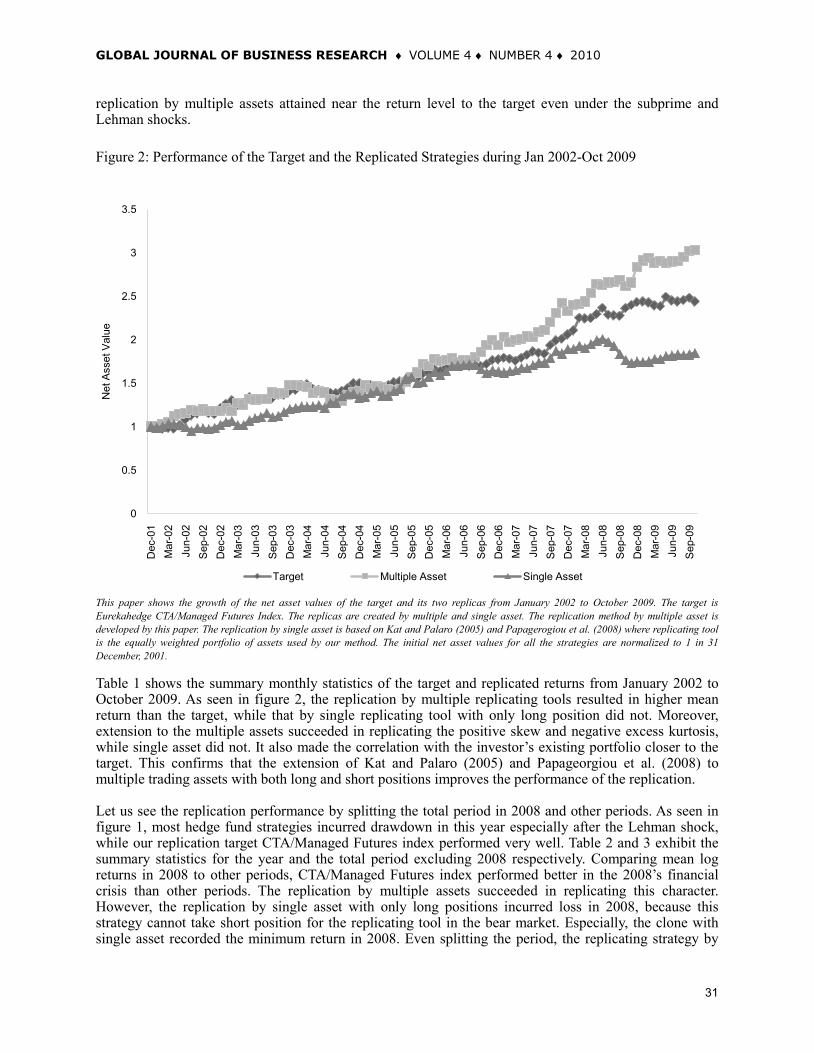
replication by multiple assets attained near the return level to the target even under the subprime and Lehman shocks. Figure 2: Performance of the Target and the Replicated Strategies during Jan 2002-Oct 2009
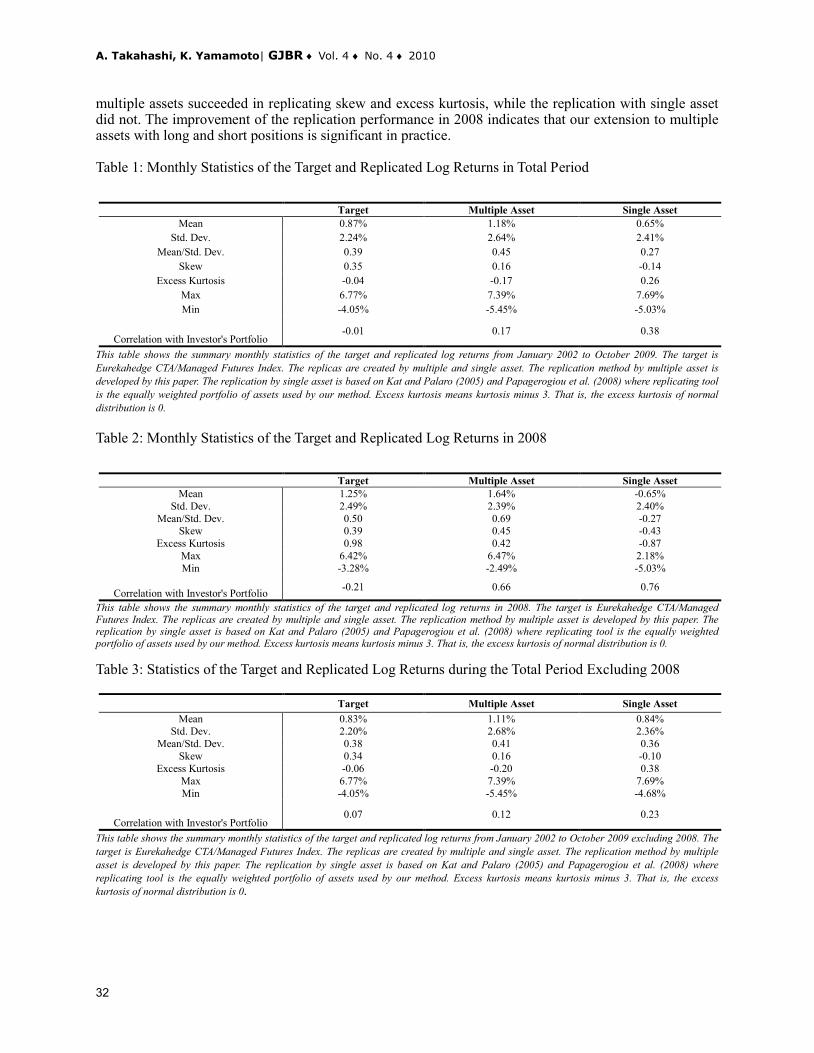
This paper shows the growth of the net asset values of the target and its two replicas from January 2002 to October 2009. The target is Eurekahedge CTA/Managed Futures Index. The replicas are created by multiple and single asset. The replication method by multiple asset is developed by this paper. The replication by single asset is based on Kat and Palaro (2005) and Papagerogiou et al. (2008) where replicating tool is the equally weighted portfolio of assets used by our method. The initial net asset values for all the strategies are normalized to 1 in 31 December, 2001. Table 1 shows the summary monthly statistics of the target and replicated returns from January 2002 to October 2009. As seen in figure 2, the replication by multiple replicating tools resulted in higher mean return than the target, while that by single replicating tool with only long position did not. Moreover, extension to the multiple assets succeeded in replicating the positive skew and negative excess kurtosis, while single asset did not. It also made the correlation with the investor’s existing portfolio closer to the target. This confirms that the extension of Kat and Palaro (2005) and Papageorgiou et al. (2008) to multiple trading assets with both long and short positions improves the performance of the replication. Let us see the replication performance by splitting the total period in 2008 and other periods. As seen in figure 1, most hedge fund strategies incurred drawdown in this year especially after the Lehman shock, while our replication target CTA/Managed Futures index performed very well. Table 2 and 3 exhibit the summary statistics for the year and the total period excluding 2008 respectively. Comparing mean log returns in 2008 to other periods, CTA/Managed Futures index performed better in the 2008’s financial crisis than other periods. The replication by multiple assets succeeded in replicating this character. However, the replication by single asset with only long positions incurred loss in 2008, because this strategy cannot take short position for the replicating tool in the bear market. Especially, the clone with single asset recorded the minimum return in 2008. Even splitting the period, the replicating strategy by
0
0.5
1
1.5
2
2.5
3
3.5
Dec
-01
Mar
-02
Jun-
02S
ep-0
2D
ec-0
2M
ar-0
3Ju
n-03
Sep
-03
Dec
-03
Mar
-04
Jun-
04S
ep-0
4D
ec-0
4M
ar-0
5Ju
n-05
Sep
-05
Dec
-05
Mar
-06
Jun-
06S
ep-0
6D
ec-0
6M
ar-0
7Ju
n-07
Sep
-07
Dec
-07
Mar
-08
Jun-
08S
ep-0
8D
ec-0
8M
ar-0
9Ju
n-09
Sep
-09
Net
Ass
et V
alue
Target Multiple Asset Single Asset
31
A. Takahashi, K. Yamamoto| GJBR ♦ Vol. 4 ♦ No. 4 ♦ 2010
multiple assets succeeded in replicating skew and excess kurtosis, while the replication with single asset did not. The improvement of the replication performance in 2008 indicates that our extension to multiple assets with long and short positions is significant in practice. Table 1: Monthly Statistics of the Target and Replicated Log Returns in Total Period
Target Multiple Asset Single Asset Mean 0.87% 1.18% 0.65%
Std. Dev. 2.24% 2.64% 2.41% Mean/Std. Dev. 0.39 0.45 0.27
Skew 0.35 0.16 -0.14 Excess Kurtosis -0.04 -0.17 0.26
Max 6.77% 7.39% 7.69% Min -4.05% -5.45% -5.03%
Correlation with Investor's Portfolio -0.01 0.17 0.38
This table shows the summary monthly statistics of the target and replicated log returns from January 2002 to October 2009. The target is Eurekahedge CTA/Managed Futures Index. The replicas are created by multiple and single asset. The replication method by multiple asset is developed by this paper. The replication by single asset is based on Kat and Palaro (2005) and Papagerogiou et al. (2008) where replicating tool is the equally weighted portfolio of assets used by our method. Excess kurtosis means kurtosis minus 3. That is, the excess kurtosis of normal distribution is 0. Table 2: Monthly Statistics of the Target and Replicated Log Returns in 2008
Target Multiple Asset Single Asset Mean 1.25% 1.64% -0.65%
Std. Dev. 2.49% 2.39% 2.40% Mean/Std. Dev. 0.50 0.69 -0.27
Skew 0.39 0.45 -0.43 Excess Kurtosis 0.98 0.42 -0.87
Max 6.42% 6.47% 2.18% Min -3.28% -2.49% -5.03%
Correlation with Investor's Portfolio -0.21 0.66 0.76
This table shows the summary monthly statistics of the target and replicated log returns in 2008. The target is Eurekahedge CTA/Managed Futures Index. The replicas are created by multiple and single asset. The replication method by multiple asset is developed by this paper. The replication by single asset is based on Kat and Palaro (2005) and Papagerogiou et al. (2008) where replicating tool is the equally weighted portfolio of assets used by our method. Excess kurtosis means kurtosis minus 3. That is, the excess kurtosis of normal distribution is 0. Table 3: Statistics of the Target and Replicated Log Returns during the Total Period Excluding 2008
Target Multiple Asset Single Asset Mean 0.83% 1.11% 0.84%
Std. Dev. 2.20% 2.68% 2.36% Mean/Std. Dev. 0.38 0.41 0.36
Skew 0.34 0.16 -0.10 Excess Kurtosis -0.06 -0.20 0.38
Max 6.77% 7.39% 7.69% Min -4.05% -5.45% -4.68%
Correlation with Investor's Portfolio 0.07 0.12 0.23
This table shows the summary monthly statistics of the target and replicated log returns from January 2002 to October 2009 excluding 2008. The target is Eurekahedge CTA/Managed Futures Index. The replicas are created by multiple and single asset. The replication method by multiple asset is developed by this paper. The replication by single asset is based on Kat and Palaro (2005) and Papagerogiou et al. (2008) where replicating tool is the equally weighted portfolio of assets used by our method. Excess kurtosis means kurtosis minus 3. That is, the excess kurtosis of normal distribution is 0.
32
GLOBAL JOURNAL OF BUSINESS RESEARCH ♦ VOLUME 4 ♦ NUMBER 4 ♦ 2010
CONCLUDING COMMENTS This article presented a new hedge fund replication method with the dynamic optimal portfolio by extending Kat and Palaro (2005) and Papageorgiou et al. (2008) to multiple trading assets with both long and short positions. It generates a target payoff distribution by the cheapest dynamic portfolio. By extending Dybvig (1988) to continuous-time framework, it was shown that cost minimization is equivalent to maximization of a certain class of von Neumann-Morgenstern utility functions. The dynamic trading strategy was derived analytically by applying Malliavin calculus. The method was applied to the replication of CTA/Managed Futures Index. The replication performance was examined on an out-of-sample basis. Our statistical procedure is the same as Papageorgiou et al. (2008). The result showed that the performance of the replication was dramatically improved compared to the existing method (investing in only one replicating tool with only long position). Most notably, our replication method was able to obtain high returns after the subprime and Lehman shocks as the replication target while the replication based on the one replicating tool with only long position incurred a large loss during this period. Any change or extension of the investment universe would affect the performance of the replication. In our empirical replication, it is assumed that the stochastic processes of trading assets have deterministic coefficients. The implementation for the Markovian coefficients case including a stochastic volatility model as well as a stochastic interest rate model is also a challenging task. Also, the application of our method to creating new attractive trading strategies represents an avenue for future research. REFERENCES Agarwal, V. and N.Y. Naik (2004) “Risks and Portfolio Decisions Involving Hedge Funds,” The Review of Financial Studies, Vol. 17(1), p. 63-98 Amin, G.S. and H.M. Kat (2003) “Hedge Fund Performance 1990-2000: Do the “Money Machines” Really Add Value?” The Journal of Financial and Quantitative Analysis, Vol. 38, p. 251-274. Detemple, J., R. Garcia, and M. Rindisbacher (2008) “Simulation Methods for Optimal Portfolios,” Handbooks in OR & MS, Vol. 15, p. 867-923 Duarte, J., F. Longstaff, and F. Yu (2007) “Risk and Return in Fixed Income Arbitrage: Nickels in front of a Steamroller?” The Review of Financial Studies, Vol. 20(3), p. 769-811 Dybvig, P. (1988) “Distributional Analysis of Portfolio Choice,” Journal of Business, Vol. 61, p. 369-393 Fung, W. and D.A. Hsieh (1997) “Empirical Characteristics of Dynamic Trading Strategies: The Case of Hedge Funds,” The Review of Financial Studies, Vol. 10(2), p. 275-302 Fung, W. and D.A. Hsieh (2000) “Performance Characteristics of Hedge Funds and Commodity Funds: Natural vs. Spurious Biases” The Journal of Financial and Quantitative Analysis, Vol. 35(3), p. 291-307 Fung, W. and D.A. Hsieh (2001) “The Risk in Hedge Fund Strategies: Theory and Evidence from Trend Followers,” The Review of Financial Studies, Vol. 14(2), p. 313-341 Fung, W. and D.A. Hsieh (2007a) “Will Hedge Funds Regress towards Index-like Products?” Journal of Investment Management, Vol. 5(2), p. 46-55. Fung, W. and D.A. Hsieh (2007b) “Hedge Fund Replication Strategies: Implications for Investors and Regulators” Banque de France, Financial Stability Review, Special issue on hedge funds, Vol. 10 April, p. 55-66
33
A. Takahashi, K. Yamamoto| GJBR ♦ Vol. 4 ♦ No. 4 ♦ 2010
Hakamada, T., A. Takahashi, and K. Yamamoto (2007) “Selection and Performance Analysis of Asia-Pacific Hedge Funds,” The Journal of Alternative Investments, Vol. 10(3), p. 7-29 Karatzas, I. and S. Shreve (1998) Methods of Mathematical Finance, Springer Kat, H.M. and H.P. Palaro (2005) “Who Needs Hedge Funds? A Copula-Based Approach to Hedge Fund Return Replication,” Working Paper Lo, A. and J. Hasanhodzic (2006) “Can Hedge-Fund Returns Be Replicated?: The Linear Case,” Working Paper. Nualart, D. (2006) The Malliavin Calculus and Related Topics 2nd Edition, Springer Papageorgiou, N., B. Remillard, and A. Hocquard (2008) “Replicating the Properties of Hedge Fund Returns,” The Journal of Alternative Investments, Vol. 11(2), p. 8-38 Takahashi, A., and K. Yamamoto (2009a) “Hedge Fund Replication,” The Recent Trend of Hedge Fund Strategies, Nova Science Publishers, forthcoming Takahashi, A., and K. Yamamoto (2009b). “Generating a Target Payoff Distribution with the Cheapest Dynamic Portfolio: An Application to Hedge Fund Replication,” Working Paper Takahashi, A., and N. Yoshida (2004) “An Asymptotic Expansion Scheme for Optimal Investment Problems,” Statistical Inference for Stochastic Process, Vol. 7, pp. 153-188 ACKNOWLEDGEMENT This research was funded by the Global COE Program “The Research and Training Center for New Development in Mathematics.” BIOGRAPHY Dr. Akihiko Takahashi is a Professor of Economics at the University of Tokyo. He can be contacted at: Graduate School of Economics, The University of Tokyo 7-3-1, Hongo, Bunkyo-ku, Tokyo, Japan. Mr. Kyo Yamamoto is a Ph.D. student at the University of Tokyo and a research analyst at GCI Asset Management. He can be contacted at: Graduate School of Economics, The University of Tokyo 7-3-1, Hongo, Bunkyo-ku, Tokyo, Japan. Email: [email protected], [email protected]
34