A New Design Methodology for the Ultimate Capacity of...
21
A New Design Methodology for the Ultimate Capacity of Slender Prestressed Concrete Columns Authors Ahmed B Shuraim, Antoine E Naaman Publication date 2003/1/1 Volume 48 Journal PCI journal Issue 1 Pages 64-81 Publisher PRESTRESSED CONCRETE INSTITUTE Description STATE-OF-THE-ART PAPER investigators tried to develop accurate models capable of predicting the behavior as well as the ultimate strength of slender prestressed concrete columns. In addition, some authors derived simple design recommendations for practical implementation. For the past three decades, the ACI Building Code (ACI 318) 16 has adopted the magnification formula for the design of slender concrete columns. The main function of the formula may be explained with reference to Fig. 1, which shows a simply ... Total citations Cited by 6 Scholar articles A New Design Methodology for the Ultimate Capacity of Slender Prestressed Concrete Columns AB Shuraim, AE Naaman - PCI journal, 2003 Cited by 6 - Related articles - All 3 versions
Transcript of A New Design Methodology for the Ultimate Capacity of...
A New Design Methodology for the Ultimate Capacity of Slender Prestressed Concrete Columns
Authors Ahmed B Shuraim, Antoine E Naaman
Publication date 2003/1/1
Volume 48
Journal PCI journal
Issue 1
Pages 64-81
Publisher PRESTRESSED CONCRETE INSTITUTE
Description STATE-OF-THE-ART PAPER investigators tried to develop accurate models capable of predicting the behavior as well as the ultimate strength of slender prestressed concrete columns. In addition, some authors derived simple design recommendations for practical implementation. For the past three decades, the ACI Building Code (ACI 318) 16 has adopted the magnification formula for the design of slender concrete columns. The main function of the formula may be explained with reference to Fig. 1, which shows a simply ...
Total citations Cited by 6
Scholar articles A New Design Methodology for the Ultimate Capacity of Slender Prestressed Concrete Columns
AB Shuraim, AE Naaman - PCI journal, 2003
Cited by 6 - Related articles - All 3 versions

Seediscussions,stats,andauthorprofilesforthispublicationat:https://www.researchgate.net/publication/242700416
ANewDesignMethodologyfortheUltimateCapacityofSlenderPrestressedConcreteColumns
ArticleinPciJournal·January2003
DOI:10.15554/pcij.01012003.64.80
CITATIONS
2
READS
78
2authors,including:
AhmedShuraim
KingSaudUniversity
32PUBLICATIONS63CITATIONS
SEEPROFILE
AllcontentfollowingthispagewasuploadedbyAhmedShuraimon08March2015.
Theuserhasrequestedenhancementofthedownloadedfile.Allin-textreferencesunderlinedinblueareaddedtotheoriginaldocument
andarelinkedtopublicationsonResearchGate,lettingyouaccessandreadthemimmediately.

January-February 2003 �

Ahmed B. Shuraim, Ph.D.Associate Professor of Civil EngineeringCivil Engineering Department College of EngineeringKing Saud University Riyadh, Saudi Arabia
This paper presents a new method for computing the flexural rigidity, EI, of prestressed concrete columns at their ultimate capacity. Flexural rigidity is needed to evaluate the critical buckling load which is used in the magnification formula. The proposed methodology for computing EI is based on two fundamental relationships: (1) the moment versus curvature relationship at a given load eccentricity, and (2) buckling under the assumption of pure concentric load. The proposed EI model was used with the moment magnification formula to obtain moment versus axial load interaction diagrams for a number of slender prestressed concrete columns. The diagrams were compared with those obtained from a finite element analysis and very good agreement was observed. Also good agreement was observed with available experimental test results. Comparisons with current code formulations and PCI recommendations are made, and a new procedure is proposed. Several numerical design examples, illustrating the new method, are provided.
Slenderness effects and possible buckling in prestressed con-crete columns have challenged
the minds of researchers for more than four decades. Several theories and some formulations have been pro-posed but none have been completely satisfactory. Nonetheless, over the years, the performance of prestressed concrete columns in actual structures has been satisfactory and the demand for such members will definitely in-crease in the future.
Extensive investigations on pre-
stressed concrete columns have been carried out by many researchers; in-cluded among these researchers are Lin and Itaya (1957),1 Zia and Morea-dith (1966),2 Brown and Hall (1966),3 Kabaila and Hall (1966),4 Aroni (1967, 1968),5,6 Nathan (1972 to 1985),7,8,9,10 Yuan (1987),11 Issa and Yuan (1989),12 the PCI Committee on Prestressed Concrete Columns (1988),13 Shuraim and Naaman (1989),14 and Shuraim (1990).15
While several of the above stud-ies involved experimental work, most
A New Design Methodology for the Ultimate Capacity of Slender Prestressed Concrete Columns
64 PCI JOURNAL
Antoine E. Naaman, Ph.D., FPCIProfessor of Civil Engineering Civil and Environmental Engineering DepartmentCollege of Engineering University of MichiganAnn Arbor, Michigan
STATE-OF-THE-ART PAPER

investigators tried to develop accurate models capable of predicting the be-havior as well as the ultimate strength of slender prestressed concrete col-umns. In addition, some authors de-rived simple design recommendations for practical implementation.
For the past three decades, the ACI Building Code (ACI 318)16 has ad-opted the magnification formula for the design of slender concrete col-umns. The main function of the for-mula may be explained with reference to Fig. 1, which shows a simply sup-ported column, subjected to equal ec-centric axial loads, P, at its ends.
As the column deflects under such a loading, its midspan section is subject to an additional moment of P∆mid, where ∆mid is the deflection at midspan. Thus, the total moment for which the column should be designed for is Mmid = Mend + P∆mid. The mag-nification formula attempts to estimate the total moment without evaluating ∆mid explicitly.
In practice, the magnification factor should neither be underestimated, thus risking an unsafe structure, nor overes-timated, thus leading to an uneconomi-cal design. The formula was originally derived for simply supported columns subject to axial compressive load and end moments assuming linear elastic materials. It is usually expressed as follows:
MM
P
P
midend
cr
=−1
(1)
in whichMend = moment at the end of the
column (that is, M = Pe)P = axial load at the end of the
columnPcr = critical buckling load when
the column is under concen-tric axial compression
Mmid = total moment at midspan (see Fig. 1)
The Euler critical buckling load is given by:
PEI
Lcr = π 2
2 (2)
January-February 2003 65
Fig. 1. Model of slender column under equal end moments and axial load: (a) Deformed shape; (b) Magnified moment at midspan.
where L = length of the columnI = moment of inertia of the col-
umn cross sectionE = modulus of elasticityWhen Eqs. (1) and (2) were adopted
for concrete columns in which the ma-terials are essentially nonlinear and in-elastic to a large degree, modifications were introduced regarding the flexural rigidity EI. Consequently, the valid-ity of the equations depends on how accurately the flexural rigidity can be estimated.
This paper describes the main re-sults of an investigation to evaluate the effective flexural rigidity, EI, used in Eq. (2) to calculate the buckling load for prestressed concrete (PC) col-umns and hence, through Eq. (1), to estimate the load carrying capacity of slender PC columns. The proposed methodology for computing EI was formulated based on two fundamental
relationships:The first relates moment to curva-
ture at a given load eccentricity and the second is based on the concept of buckling under the assumption of pure concentric load.
The proposed methodology was de-veloped following an extensive ana-lytical evaluation of the behavior of numerous PC columns through a fi-nite element analysis.14,15 The effect of many parameters such as nonlinear properties of the component materials, cracking, slenderness ratio, irregular section geometry, level of effective prestress, prestressing reinforcement ratio, and different boundary condi-tions were considered.
A computer program was written to carry out the simplified calcula-tions, verify the accuracy and fine-tune the calibration of the proposed design method vis-à-vis the finite ele-ment analysis. Also, the accuracy of
66 PCI JOURNAL
the model was verified by comparing predicted results with experimental data from the technical literature. The program was then used to evaluate a wide range of parameters.
BACKGROUND ON FLEXURAL RIGIDITY (EI)
This section presents the ACI Code provisions for determining flexural rigidity and the PCI recommendations for evaluating slenderness effects of columns.
Current ACI 318 Equations for EI
To account for the influence of cracking, softening and creep of con-crete in addition to the yield of rein-forcement, in lieu of a more accurate analysis, the ACI Code recommends the use of the following simple design equations for calculating the rigidity of slender concrete columns:
EIE I E I
EIE I
c g s se
d
c g
d
=+
+
=+
0 2
1
0 4
1
.
.
(3)
or
(4)
β
β
EIE I E I
EIE I
c g s se
d
c g
d
=+
+
=+
0 2
1
0 4
1
.
.
(3)
or
(4)
β
β
where Ec = concrete modulus of elasticityIg = gross moment of inertia of the
column cross sectionEs = reinforcing bar modulus of
elasticityIse = moment of inertia of the rein-
forcing bars in the sectionβd = coefficient to account for long-
term loadingThe ACI Code Commentary states
that Eq. (4) was derived for small ec-centricity ratios and high levels of axial load where the slenderness ef-fects are most pronounced.
PCI Treatment of Slenderness Effects
The PCI Committee on Prestressed Concrete Columns13 concluded that Eqs. (3) and (4) cannot be applied di-rectly to prestressed concrete columns and bearing walls. As an alternative, the PCI Committee recommended equations for EI, which are based pri-marily on the work of Nathan (1972-1985). The latest form of these equa-tions (considering short-term loading) is given as:17
EIE Ic g
d
=+
/ λβ1
(5)
λ θ η= ≥ 3 2. (6)
η = +2 5 1 60
. . (7)P
P
whereP = applied axial load on the col-
umn from first order analysis P0 = pure axial load capacity of the
section Upper and lower limits were speci-
fied for η so that it should not be taken less than 6 nor more than 70.
For sections without a compression flange, θ is given by:
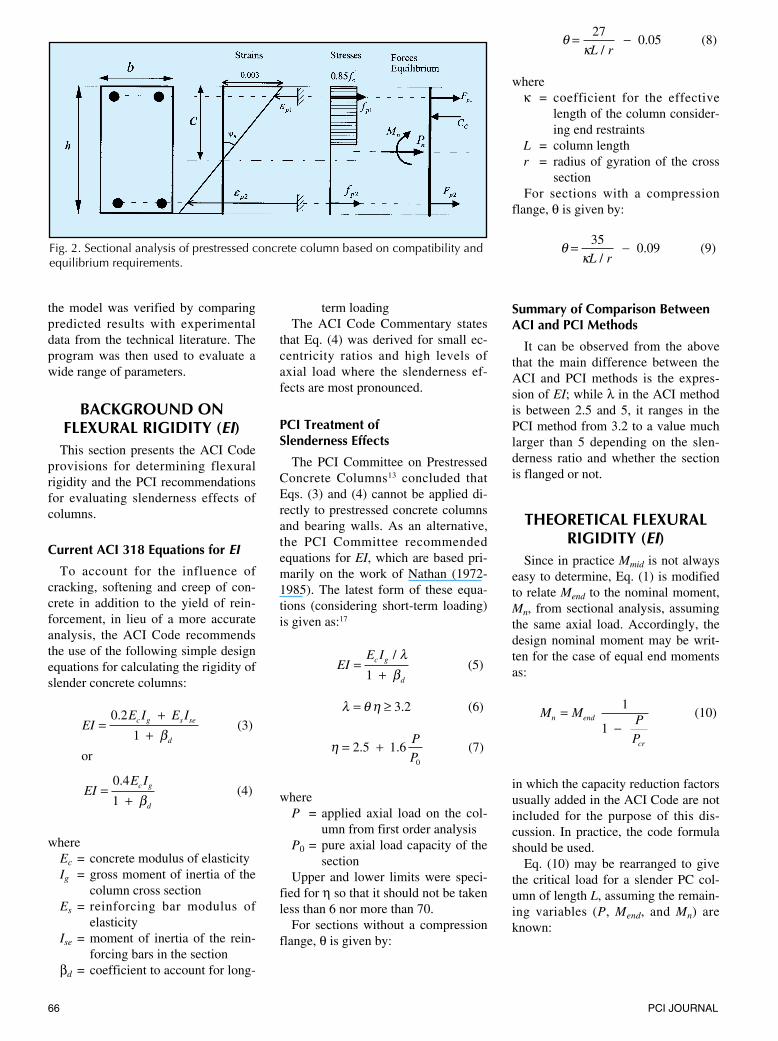
Fig. 2. Sectional analysis of prestressed concrete column based on compatibility and equilibrium requirements.
θκ
= −270 05
L r/. (8)
whereκ = coefficient for the effective
length of the column consider-ing end restraints
L = column lengthr = radius of gyration of the cross
sectionFor sections with a compression
flange, θ is given by:
θκ
= −350 09
L r/. (9)
Summary of Comparison Between ACI and PCI Methods
It can be observed from the above that the main difference between the ACI and PCI methods is the expres-sion of EI; while λ in the ACI method is between 2.5 and 5, it ranges in the PCI method from 3.2 to a value much larger than 5 depending on the slen-derness ratio and whether the section is flanged or not.
ThEORETICAL FLEXURAL RIGIDITY (EI)
Since in practice Mmid is not always easy to determine, Eq. (1) is modified to relate Mend to the nominal moment, Mn, from sectional analysis, assuming the same axial load. Accordingly, the design nominal moment may be writ-ten for the case of equal end moments as:
M M P
P
n end
cr
=−
1
1 (10)
in which the capacity reduction factors usually added in the ACI Code are not included for the purpose of this dis-cussion. In practice, the code formula should be used.
Eq. (10) may be rearranged to give the critical load for a slender PC col-umn of length L, assuming the remain-ing variables (P, Mend, and Mn) are known:

January-February 2003 67
PPM
M
crend
n
=−1
(11)
Recalling that Pcr is given by Eq. (2), and equating the two equations yield the following formula for the theoreti-cal effective flexural rigidity, EI:
EIPM
M
L
end
n
=−1
2
2
(12)
π
In principle, Eq. (12) gives the most accurate value of flexural rigidity, EI, that would make Mn predictable from Mend or vice-versa. A set of EI values may be generated using Eq. (12) in which the Mend and P are obtained from finite element analysis, while Mn is obtained from sectional analysis. This approach of extracting the effec-tive EI for slender PC and RC columns was commonly followed by several investigators18,8,15,19 to allow further examination of the effective rigidity.
The main aim of previous studies on flexural rigidity of slender concrete columns as well as this study is to es-tablish an approximate model for EI that simulates as closely as possible the theoretical relationship. In some of these studies, notably MacGregor et al.,18 Nathan,8 and Mirza,19 data were collected on effective rigidity for some influencing variables in order to allow a statistical analysis.
In this paper, an alternative approach is followed for determining EI using two fundamental concepts that were found to lead to reasonable agreement with the theoretical results from the finite element analysis.
PROPOSED PROCEDUREThe proposed procedure for comput-
ing the flexural rigidity, EI, for slender PC columns is based on two concepts. The first idea takes advantage of the fundamental relationship between sectional moment and associated cur-vature. The second concept is based on the tangent modulus of a slender concrete column at onset of buckling under concentric axial compression as-suming a nonlinear stress-strain curve of concrete.
Nominal Bending and Axial Resistance
Regardless of the method used to determine EI, the nominal moment and axial load strength envelope of a col-umn section is generally needed for the design of PC columns. It is de-veloped on the basis of equilibrium, strain compatibility, and constitutive relationships. Fig. 2 shows a schematic representation of the calculations for a rectangular cross section having a height, h, and a width, b. The strain distribution is assumed linear over the cross section with a compression limit of 0.003.
For an assumed value of neutral axis depth, c, the strains in any layer of pre-stressing steel can be computed from:
ε εpi pepid c
c= +
−
(13)0 003.
whereepe = effective strain in prestressing
steel dpi = depth of a steel layer, i, taken
from the compression faceThe steel stress, fpi, is found from an
appropriate constitutive relationship such as that given in Reference 20, and the stress in concrete is defined as 0.85f ′c over an area of β1cb, where β1 is a factor defined as the ratio of the equivalent rectangular stress block depth to the distance from the extreme compression fiber to the neutral axis depth. Multiplying the stresses in steel and concrete by their corresponding areas, gives the forces in steel and con-crete as Fpi and Cc, respectively.
Equilibrium requires that the nomi-nal axial load, Pn, and the nominal flexural moment, Mn, be computed respectively from:
P C Fn c pi
npl
= − ∑ (14)1
M C h c
F h d
n c
pi pi
npl
= − +
−∑
( )
( ) (15)
/ /
/
2 2
2
1
1
β
where npl is the number of prestress-
Fig. 3. Proposed EI model composed of descending branch of Sectional EI and upper portion from linear part. Also shown is EI from finite element analysis (FEA) for a slender PC column.

68 PCI JOURNAL
ing layers in a section.
Sectional Flexural Rigidity at Nominal Strength
The curvature, ψn, at any section at nominal strength can be written as:
ψ nnM
EI= (16)
The curvature is also defined from compatibility requirements as the ratio of nominal strain at the top of the sec-tion to the depth of the neutral axis as shown in Fig. 2. Assuming the com-pressive strain is equal to 0.003 as per ACI 318, the curvature becomes:
ψ n c= 0 003.
(17)
By rearranging Eqs. (16) and (17), the flexural rigidity EI is computed as:
EIM cn=
0 003. (18)
The load eccentricity at nominal re-sistance is defined as:
eM
Pn
n
= (19)
For different values of c, the nomi-nal bending strength and the flexural rigidity can be computed, respectively, from Eqs. (15) and (18). Then, the flexural rigidity can be plotted versus the eccentricity [from Eq. (19)] lead-ing to an EI-e diagram. A typical ex-ample is shown in Fig. 3 (derived from the examples of Appendix B), where the rigidity is termed Sectional EI, and is compared with the EI obtained from finite element analysis [Eq. (12)] and termed EI-FEA.
The Sectional EI has an ascending branch that increases to a maximum value (Point B) followed by a descend-ing branch covering a wide range of eccentricities. It can be observed that,
Fig. 4. Comparisons of proposed EI model with existing code models and finite element model for a slender PC column (from examples of Appendix B).
while the ascending branch is in total disagreement with the corresponding portion of the EI-FEA curve, the de-scending branch is very similar to it.
This observation was typical of all the prestressed columns studied. Ac-cordingly, it is believed that the de-scending branch of the curve may be utilized to model the flexural rigidity EI for this range of eccentricities, but a different approach should be used for the smaller eccentricity range.
Note that the concept of using the Sectional EI was first introduced in 1990 (Reference 15) for PC columns and was also discussed in 1992 by Zeng et al.21 for reinforced concrete columns. However, Zeng et al.21 did not distinguish between the ascending and descending branches of the EI-e curve.
Sectional Rigidity and Eccentricity at Peak Point
The boundary of the descending branch may be determined either by inspection when sufficient numerical values are generated, or by using an expression that gives the neutral axis associated with the value of EI at the peak point (Point B in Fig. 3). Ana-lytically, this can be achieved by dif-ferentiating EI with respect to c and equating the derivative to zero.
This leads to the neutral axis depth at which flexural rigidity reaches its maximum value; for a rectangular sec-tion it is:
ch
peak = 2
3 1β (20)
in which h is the total depth of the section.
Analyzing the section with c = cpeak and computing Mn and Pn from Eqs. (14) and (15) allow for calculating EIpeak using Eq. (18) and the corresponding epeak using Eq. (19).
Linear EI Method for Small Eccentricity Range (e < epeak)
The ascending part of the Sectional EI presented in Fig. 3 (up to Point B) is in total disagreement with the theoretical EI from the finite element analysis. The apparent reason for this
January-February 2003 69
is that under small eccentricities col-umn failure is initiated by stability at relatively lower strains, while the section analysis assumes material failure at a relatively larger strain.
Therefore, the ascending branch is not applicable for eccentricities smaller than the peak eccentricity. However, it is believed that the use of the tangent modulus of a slender PC column under pure compressive axial load can help in developing an approximate EI expression for
this range of eccentricities; first, let us define:
(EI)tan = EtcIg (21)
where Etc is the tangent modulus of con-crete, given later by Eq. (27), and Ig is the gross moment of inertia of the col-umn cross section.
The derivation of this equation is given in Appendix A. In the following discus-sion, only the end result is provided.
In summary, the proposed flexural ri-
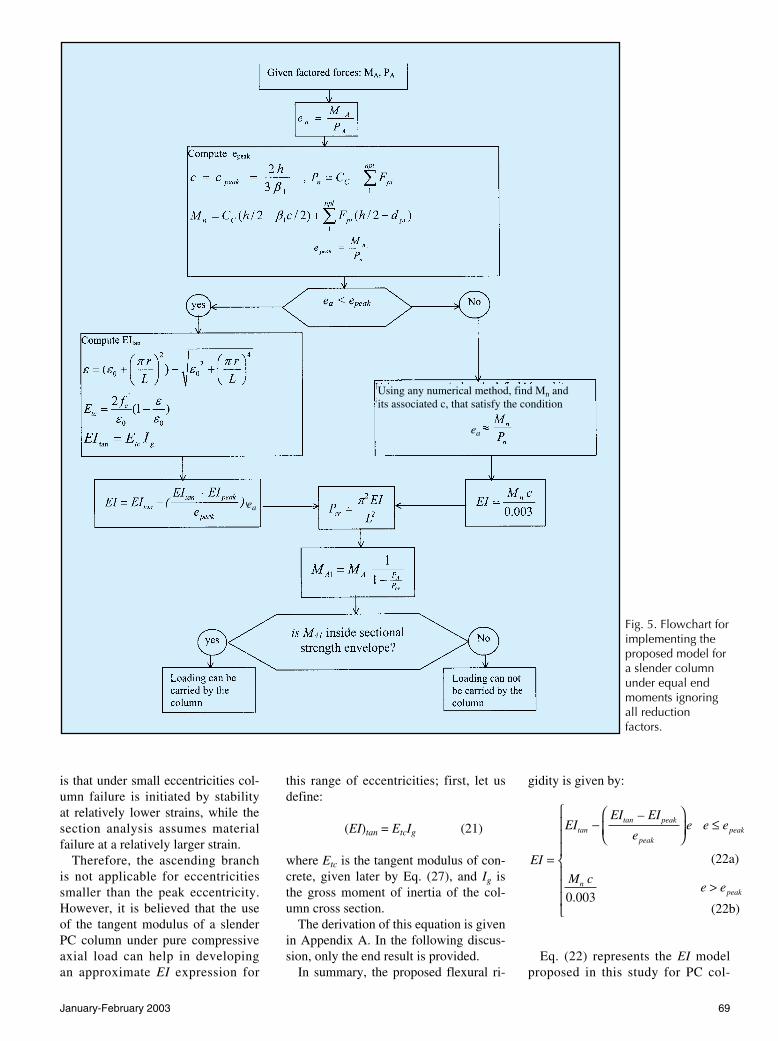
Fig. 5. Flowchart for implementing the proposed model for a slender column under equal end moments ignoring all reduction factors.
ea
ea
gidity is given by:
EI
EIEI EI
ee e e
M ce e
peak
peakpeak
npeak
=
−
≤
>
tantan –
(22a)
(22b)
0 003.
Eq. (22) represents the EI model proposed in this study for PC col-
Using any numerical method, find Mn and its associated c, that satisfy the condition
70 PCI JOURNAL
umns; it is plotted in Fig. 4 for a typ-ical slender PC column. The curve comprises two parts with minor dis-continuity at epeak. The EI from the fi-nite element analysis is also plotted on the same figure for comparison (EI-FEA). A very good agreement in both trend and numerical values is observed between the two curves even though they were developed independently.
The current ACI 318 equations are also plotted in Fig. 4 and identified as ACI-EI Eqs. (3) and (4), respectively. They show a complete insensitivity to a wide change in eccentricity, and are too conservative at small eccentrici-ties and unsafe at larger eccentricities.
Finally, the PCI recommendations represented by Eq. (5) are shown in the figure for comparison. For e/h < 0.13, Eq. (5) is extremely conserva-tive, however, beyond that, it is in close agreement with the proposed EI in both trend and numerical values.
IMPLEMENTATION OF
PROPOSED PROCEDUREIn the proposed method, the eccen-
tricity of loading plays a major role in determining EI as illustrated next for different situations. Fig. 5 shows two paths for the calculations depending on epeak. When the applied eccentricity is less than the peak eccentricity, the linear EI in Eq. (22a) must be used. On the other hand, when the applied eccentricity is larger than the peak eccentricity, the Sectional EI in Eq. (22b) must be used.
Once the EI is known, the method is similar to the ACI Code method (or PCI recommendations) and the same procedure may be followed. It should be noted that in the flowchart and the examples solved in this paper, all the reduction factors and the long-term factor were dropped for clarity sake, but they can be restored for actual designs.
Checking the Adequacy of Column Strength Under a Given Loading
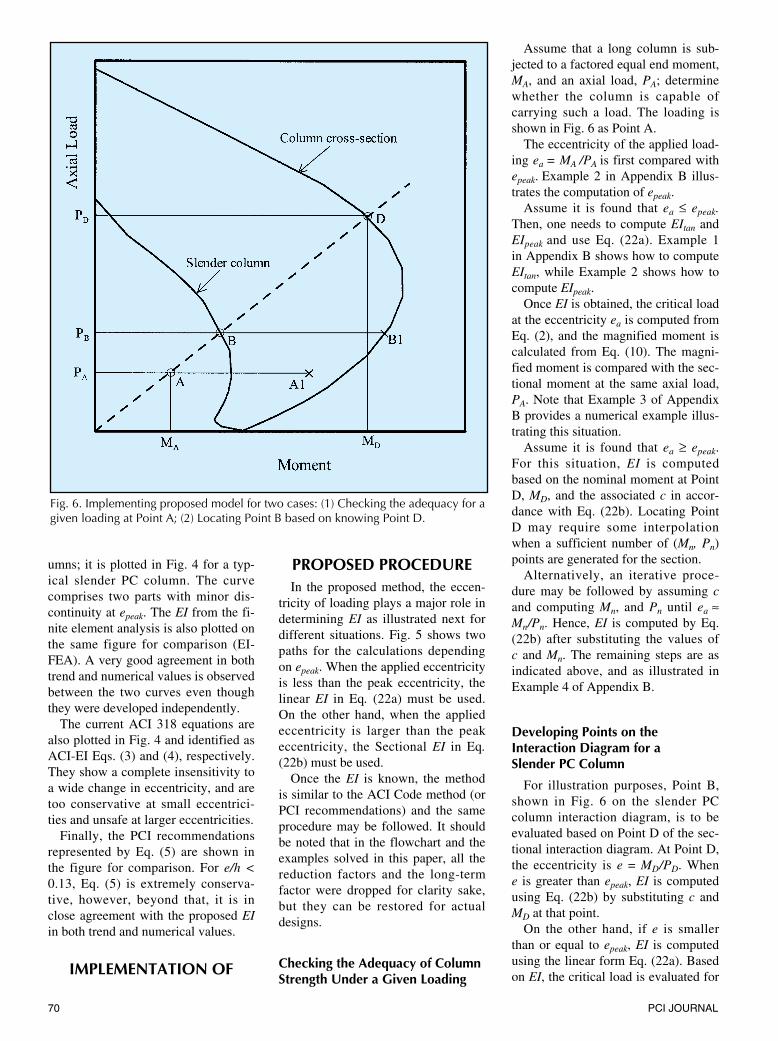
Fig. 6. Implementing proposed model for two cases: (1) Checking the adequacy for a given loading at Point A; (2) Locating Point B based on knowing Point D.
Assume that a long column is sub-jected to a factored equal end moment, MA, and an axial load, PA; determine whether the column is capable of carrying such a load. The loading is shown in Fig. 6 as Point A.
The eccentricity of the applied load-ing ea = MA /PA is first compared with epeak. Example 2 in Appendix B illus-trates the computation of epeak.
Assume it is found that ea ≤ epeak. Then, one needs to compute EItan and EIpeak and use Eq. (22a). Example 1 in Appendix B shows how to compute EItan, while Example 2 shows how to compute EIpeak.
Once EI is obtained, the critical load at the eccentricity ea is computed from Eq. (2), and the magnified moment is calculated from Eq. (10). The magni-fied moment is compared with the sec-tional moment at the same axial load, PA. Note that Example 3 of Appendix B provides a numerical example illus-trating this situation.
Assume it is found that ea ≥ epeak. For this situation, EI is computed based on the nominal moment at Point D, MD, and the associated c in accor-dance with Eq. (22b). Locating Point D may require some interpolation when a sufficient number of (Mn, Pn) points are generated for the section.
Alternatively, an iterative proce-dure may be followed by assuming c and computing Mn, and Pn until ea ≈ Mn/Pn. Hence, EI is computed by Eq. (22b) after substituting the values of c and Mn. The remaining steps are as indicated above, and as illustrated in Example 4 of Appendix B.
Developing Points on the Interaction Diagram for a Slender PC Column
For illustration purposes, Point B, shown in Fig. 6 on the slender PC column interaction diagram, is to be evaluated based on Point D of the sec-tional interaction diagram. At Point D, the eccentricity is e = MD/PD. When e is greater than epeak, EI is computed using Eq. (22b) by substituting c and MD at that point.
On the other hand, if e is smaller than or equal to epeak, EI is computed using the linear form Eq. (22a). Based on EI, the critical load is evaluated for

January-February 2003 7�
that eccentricity using Eq. (2). Knowing Pcr and the associated e,
the desired point on the slender load-moment interaction diagram (MB,PB) may be obtained by successive ap-proximation. The main equation for finding this solution is obtained by rearranging Eq. (10) such that:
PP
P e
M
Bcr
cr
B
=+1
1
(23)
Satisfying Eq. (23) begins by as-suming that MB1 = MD and solving for an approximate value for PB. In general, the resulting value of PB is a reasonable estimate leading to the cor-rect value. However, to improve the prediction, additional iterations can be carried out. Given PB, the associated moment MB1 from sectional analysis is obtained, then substituted in Eq. (23) leading to an improved estimate of PB.
This process may be repeated for a few cycles until the change in PB is within an acceptable limit, which indi-cates convergence. After convergence is obtained, the moment associated with PB is MB = PBe which represents Point B in Fig. 6. Example 5 of Appendix B illustrates this process for a typical point. The above approach was used to generate data for the parametric analy-ses presented in the following section.
APPLICATION AND COMPARISON
The proposed EI model was used to generate end moment versus axial load interaction diagrams for a number of slender columns having prestressed reinforcement ratios between 0.2 to 0.5 percent. A typical square [8 x 8 in. (103 x 103 mm)] simply supported slender PC column is considered with equal end eccentricity as illustrated in Fig. 1. For these applications, all re-duction factors are ignored and short-term loading is considered. A com-puter program was written to carry out the computations for a practical range of values of the main parameters.
Connecting twenty independent pairs of end moment and axial load points generated the end moment ver-sus axial load envelope from the fi-
Fig. 7. Comparison of interaction diagrams developed on basis of flexural rigidities suggested by the current study, ACI 318, and PCI with finite element analysis (FEA) for L/r = 52 and ρp = 0.2 percent.
Fig. 8. Comparison of interaction diagrams developed on the basis of flexural rigidities suggested by current study, ACI 318, and PCI with finite element analysis (FEA) for L/r =52 and ρp = 0.3 percent.

72 PCI JOURNAL
nite element analysis. A typical point is obtained by applying moment and axial load to the column ends in in-cremental form using a computer pro-gram developed earlier.15 The program is based on the well-known finite ele-ment principles with consideration to material and geometric nonlinearities. The method carries no assumption re-lated to or utilization of the magnifica-tion formula.
Along with the proposed approxi-mate method and the finite element analysis, the current EI models recom-mended by the ACI Building Code, Eq. (4), and PCI recommendations, Eq. (5), were both used to generate end moment versus axial load interac-tion diagrams.
Comparisons were made with the results obtained from the proposed
model (Proposed), finite element anal-ysis (FEA), current code recommenda-tions (ACI and PCI), and experimental test results. Having the four methods represented concurrently for each case help broaden our understanding of their capabilities and limitations.
Columns with Slenderness Ratio (L/r) = 52
The moment versus axial load inter-action diagram based on the proposed EI method is presented in Fig. 7 for a column with a prestressed reinforce-ment ratio of 0.2 percent; it has two branches with a distinctive balance point having coordinates of 0.37P0 and 2.1M0, where P0 is the nominal concentric axial load capacity of the section, and M0 is the nominal flexural
moment capacity of the section at zero axial load.
The upper branch reaches a maxi-mum value of P0 and the entire branch is on the conservative side of the curve predicted by FEA. For the lower branch, the decrease in axial load is associated with a decrease in moment and the branch is very close in shape and value to the FEA curve. Fig. 8 shows the curves for the same column with a 0.3 percent prestressed rein-forcement ratio and a similar trend is observed.
The curve generated using the ACI method for ρp = 0.2 percent has two branches similar to the proposed method with a balance point having an axial load of 0.29P0 and a moment of 2.0M0. While the upper branch is in agreement with the proposed method and on the conservative side, the lower branch predicts higher strengths and it is on the unsafe side with respect to the FEA results. Increasing the percentage of prestressing steel affects the bal-anced moment as shown in Fig. 8 and Table 1 but leads to similar trends.
The curve generated from the PCI approach for ρp = 0.2 percent has slightly different features (see Fig. 7). The balanced point has coordinates of 0.34P0 and 1.71M0. This curve has a noticeable middle branch where the drop in axial load from 0.4P0 to 0.21P0 occurs without much of a change in moments. Below 0.21P0, the moment decreases until it reaches a minimum value of 0.86M0 at 0.02P0 before in-creasing again to M0. This curve rep-resents the most conservative method among the four approaches shown in the figure. Similar observations can be made for ρp = 0.3 percent as shown in Fig. 8 and Table 1.
Columns with Slenderness Ratio (L/r) = 100
This is a square column such as de-scribed in the examples of Appendix A. The moment versus load interac-tion curve generated by the proposed method for ρp = 0.3 percent is shown in Fig. 9; it shows three parts: the upper part starts at a maximum load of 0.68P0 and extends linearly to the point defined by epeak at which the axial load is 0.26P0 and the moment is
Fig. 9. Comparison of interaction diagrams developed on basis of flexural rigidities suggested by current investigation, ACI 318, and PCI with finite element analysis (FEA) for L/r = 100 and ρp = 0.3 percent.
Table 1. Summary of results for slenderness ratio (L/r) = 52.
Method of computing Maximum Balanced point EI load ρp = 0.2 percent ρp = 0.3 percent Proposed 1.0P0 (2.1M0, 0.37P0) (1.53M0, 0.36P0) ACI 1.0P0 (2.0M0, 0.29P0) (1.51M0, 0.25P0) PCI 0.95P0 (1.71M0, 0.34P0) (1.27M0, 0.33P0)

January-February 2003 73
0.75M0. Below this part comes the middle
part, which extends in a nonlinear form to a point with coordinates 0.04P0 and 0.68M0. The lower part extends to the pure flexure case in a linear form. As ρp is increased to 0.4 and 0.5 percent (see Figs. 10 and 11), respectively, the main change occurs in the middle part, which becomes flatter.
Overall, these strength envelopes have similar shapes to the correspond-ing curves from FEA and are on the conservative side except for the con-centric load, which is nearly identi-cal to that computed by FEA. Table 2 shows the numerical coordinates of the key points for these cases.
The curve generated by the ACI method for ρp = 0.3 percent has a maximum load of 0.14P0. Compared to the FEA curve, it underestimates strength for loads higher than 0.14P0 and overestimates the strength for loads lower than 0.14P0. Moreover, the overall shape of the curve is in dis-agreement with the trend established by FEA and confirmed by the pro-posed model. Similar observations are made when ρp is increased to 0.4 and 0.5 percent as shown in Figs. 10 and 11, respectively.
The curve generated by the PCI method for ρp = 0.3 percent is char-acterized by three distinctive parts. The maximum axial load is 0.26P0, which constitutes only 37 percent of that predicted by FEA. The middle part is characterized by a steep drop in axial load with a slight variation in moments; it starts from axial load of 0.14P0 and the moment of 0.77M0, and extends to a point of 0.04P0 and 0.66M0 before the moment increases to M0 at zero axial load. The middle part of the diagram becomes more conservative as ρp is increased to 0.4 and 0.5 percent, as shown in Figs. 10 and 11, respectively.
COMPARISON wITh TEST RESULTS
The finite element analysis model used to verify the proposed EI model of this study was compared with the results of 121 column tests obtained from various sources in the technical literature.6,21,11 A summary of the test
Fig. 10. Comparison of interaction diagrams developed on basis of flexural rigidities suggested by current investigation, ACI 318, and PCI with finite element analysis (FEA) for L/r =100 and ρp = 0.4 percent.
Fig. 11. Comparison of interaction diagrams developed on basis of flexural rigidities suggested by current study, ACI 318, and PCI with finite element analysis (FEA) for L/r = 100 and ρp = 0.5 percent.

74 PCI JOURNAL
results is shown in Table 3. The average of the Ptest to PFEA ratio
is shown for each group of tests hav-ing a range of 0.955 to 1.052 with an overall average ratio of 1.0. The breakdown of prediction accuracy is illustrated in the table. The predicted load versus the test load for all of the columns is presented in Fig. 12.
Table 3 and Fig. 12 confirm first the validity of the finite element model (FEA) used to conduct the predictions. Reasonable differences between pre-dicted and experimental results are understandable due to a number of influencing factors, which include un-certainty in material properties and the
constitutive relationships. Also during the testing, accidental eccentricity or restraints due to friction at the ends of columns may have significant effects on the ultimate load. It was observed, for instance, that two otherwise identi-cal columns led to ultimate loads that are different by 12 percent.
Six slender prestressed concrete col-umns tested by Carinci and Halvorsen in 198622 were chosen to illustrate the predictive capability of the differ-ent methods considered in this study. They are selected to represent an im-portant case of low reinforcement ratio and high slenderness.
Three of the columns are among
Table 2. Critical points on interaction diagrams for slender PC columns (L/r) = 100.
Method of ρp = 0.4 percent ρp = 0.5 percent computing EI Max. P Middle point Lower point Max. P Middle point Lower point Proposed 0.69P0 (0.62M0, 0.27P0) (0.71M0, 0.06P0) 0.7P0 (0.56M0, 0.26P0) (0.71M0, 0.075P0) ACI 0.33P0 (0.80M0, 0.14P0) — 0.34P0 (0.76M0, 0.14P0) — PCI 0.26P0 (0.67M0, 0.14P0) (0.63M0, 0.04P0) 0.26P0 (0.61M0, 0.13P0) (0.61M0, 0.04P0)
Table 3. Summary of comparison with test results of PC columns.
Source of No. of Average of No. of columns for which the PFEA is within tests tests Ptest/PFEA 5 percent 10 percent 15 percent 20 percent Aroni6 36 1.052 13 23 32 33 Carinci and Halvorsen21 36 0.955 20 29 35 36 Yuan’s concentric-
27 0.960 12 23 27 27 short columns11
Yuan’s long columns11 22 1.047 6 16 19 22 Total 121 1.00 51 91 113 118
Fig. 12. Finite element predicted load versus test load at failure for 121 slender columns obtained from technical literature.
those predicted with a 5 percent accu-racy and the other three are from those predicted with a 10 percent accuracy. The results for six columns are shown in Fig. 13 along with the FEA gener-ated curve, the proposed curve, the ACI 318 Eq. (4) curve, and the curve based on the PCI recommendations.
The tests confirm the overall ac-curacy of the upper branch of the pro-posed method, despite some overesti-mated predictions that are considered within a reasonable limit as discussed earlier. The test results also confirm the degree of conservatism in the pre-dictions based on ACI 318 or the PCI recommendations. Note that for com-parison purposes, no reduction factors were used in any curve prediction.
CONCLUDING REMARKSA comprehensive nonlinear finite
element analysis suggests that the flex-ural rigidity, EI, of prestressed con-crete columns varies widely with the load eccentricity and other material and reinforcement parameters such as concrete strength, prestress level, rein-forcement ratio and slenderness ratio. This variability is so complex that it cannot be described adequately by a simple formula such as that attempted in the ACI Code or the PCI recom-mendations.
The methodology proposed in this paper to estimate the flexural rigidity requires moderate analytical effort; it simulates very well the predicted ana-lytical results while also incorporating results from experimental tests. Once the flexural rigidity is determined, the proposed method offers the advantage to simply integrate in the generally accepted procedure of the ACI Code to determine the critical buckling load used in the magnification formula, and thus to allow a prediction of nominal resistance.
In comparison to predictions from

January-February 2003 75
the finite element analysis, the pro-posed method incorporates both trends and values significantly better than ei-ther the ACI Code formula or the PCI recommendations. The effective rigid-ity using the ACI Code shows very lit-tle resemblance to the rigidity obtained from theoretical considerations.
The effective rigidity using the PCI recommendations is generally on the safe side; however, it is too conserva-tive particularly in the low eccentricity range and higher slenderness ratios. While the PCI approach is certainly acceptable for design, the correspond-ing safety margin may be too large in some cases.
Since the proposed method de-scribed here provides a better answer overall without sacrificing safety, it is recommended for inclusion in future versions of the ACI Code; it is also recommended as a tentative procedure to replace the PCI recommendations to determine the flexural capacity of pre-stressed concrete columns throughout the range of slenderness ratios.
ACKNOwLEDGMENT
Fig. 13. Comparison of interaction diagrams developed on basis of flexural rigidities suggested by current study, ACI 318, and PCI with finite element analysis (FEA) and test results for L/r = 104 and ρp = 0.22 percent.

76 PCI JOURNAL
The research work of the first author was supported by a fellowship award from King Saud University, Saudi Arabia. The research work of the second author has been supported in the past by numerous grants from the National Science Foundation and by the University of Michigan. Their sup-port is gratefully acknowledged.
The authors would also like to thank the PCI JOURNAL reviewers of the first draft of this paper for their constructive comments.1. Lin, T. Y., and Itaya, R., “A Prestressed Concrete Column
Under Eccentric Loading,” PCI JOURNAL, V. 2, No. 3, May-June 1957, pp. 5-17.
2. Zia, P., and Moreadith, F. L., “Ultimate Load Capacity of Pre-stressed Concrete Columns,” ACI Journal, V. 63, July 1966, pp. 767-786.
3. Brown, H. R., and Hall, A. S., “Tests on Slender Prestressed Concrete Columns,” Symposium on Reinforced Concrete Col-umns, SP-13, American Concrete Institute, Farmington Hills, MI, 1966, pp. 179-192.
4. Kabaila, A. P., and Hall , A. S., “Analysis of Instability of Un-restrained Prestressed Concrete Columns with End Eccentrici-ties,” Symposium on Reinforced Concrete Columns, SP-13, American Concrete Institute, Farmington Hills, MI, 1966, pp. 157-178.
5. Aroni, S., “Slender Prestressed Concrete Columns,” Report No. 67-10, Structural Engineering and Structural Mechanics, College of Engineering, University of California, Berkeley, CA, 1967, 237 pp.
6. Aroni, S., “Slender Prestressed Concrete Columns,” Journal of the Structural Division, ASCE, V. 94, ST4, April 1968, pp. 875-904.
7. Nathan, N. D., “Slenderness of Prestressed Concrete Beam-Columns,” PCI JOURNAL, V. 17, No. 6, November-Decem-ber 1972, pp. 45-57.
8. Nathan, N. D., “Applicability of ACI Slenderness Computa-tions to Prestressed Concrete Sections,” PCI JOURNAL, V. 20, No. 3, May-June 1975, pp. 68-85.
9. Nathan, N. D., “Slenderness of Prestressed Concrete Col-umns,” PCI JOURNAL, V. 28, No. 2, March-April 1983, pp. 50-77.
10. Nathan, N. D., “Rational Analysis and Design of Prestressed Concrete Columns and Wall Panels,” PCI JOURNAL, V. 30, No. 3, May-June 1985, pp. 82-133.
11. Yuan, R. L., “Prestressed Concrete Column Behavior,” Final Report, PCI Research Project No. 3, Prepared for Prestressed
Concrete Institute by Department of Civil Engineering, The University of Texas at Arlington, Arlington, TX, 1987, 191 pp.
12. Issa, M., and Yuan, R., “Prestressed Concrete Column Be-havior,” PCI JOURNAL, V. 34, No. 6, November-December 1989, pp. 51-67.
13. PCI Committee on Prestressed Concrete Columns, “Recom-mended Practice for the Design of Prestressed Concrete Col-umns and Walls,” PCI JOURNAL, V. 33, No. 4, July-August 1988, pp. 56-95.
14. Shuraim, A. B., and Naaman, A. E., “Analysis of Slender Prestressed Concrete Columns,” ASCE Seventh Structures and Pacific Rim Engineering Congress, Volume on Analysis, Design, and Testing, A. S-H. Ang, Editor, San Francisco, CA, 1989, pp. 231-240.
15. Shuraim, A. B., “Slenderness Effects in Prestressed Concrete Columns,” Ph. D. Dissertation, The University of Michigan, Ann Arbor, MI, 1990.
16. ACI Committee 318, “Building Code Requirements for Re-inforced Concrete (ACI 318),” American Concrete Institute, Farmington Hills, MI, 1995.
17. PCI Design Handbook – Precast and Prestressed Concrete, Fifth Edition, Precast/Prestressed Concrete Institute, Chicago, IL, 1999.
18. MacGregor, J. G., Oelhafen, U. H., and Hage, S. E., “A Re-Ex-amination of the EI Value for Slender Columns,” Symposium on Reinforced Concrete Columns, SP-50, American Concrete Institute, Farmington Hills, MI, 1975, pp. 1-40.
19. Mirza, S. A., “Flexural Stiffness of Rectangular Reinforced Concrete Columns,” ACI Structural Journal, V. 87, No. 4, July-August 1990, pp. 425-435.
20. Menegotto, M., and Pinto, P. E., “Method of Analysis for Cy-clically Loaded R. C. Plane Frames,” IABSE Preliminary Re-port for Symposium on Resistance and Ultimate Deformability of Structures Acted on Well-Defined Repeated Loads, Lisbon, Portugal, 1973, pp. 15-22.
21. Zeng, J. M., Duan, L., Wang, F. M., and Chen, W. F., “Flex-ural Rigidity of Reinforced Concrete Columns,” ACI Struc-tural Journal, V. 89, No. 2, March-April 1992, pp. 150-158.
22. Carinci, C. A., and Halvorsen, G. T., “Tie Requirements for Prestressed Concrete Columns,” Final Report, Department of Civil Engineering, West Virginia University, October 1984 (Revised July 1986), 93 pp.
23. Gere, J., and Timoshenko, S. P., Mechanics of Materials, Third SI Edition, Chapman & Hall, London, United Kingdom, 1991.
24. Shanley, F. R., “Inelastic Column Theory,” Journal of the Aeronautical Sciences, V. 14, No. 5, May 1947, pp. 261-267.
REFERENCES

January-February 2003 77
25. Hognestad, E., “A Study of Combined Bending and Axial Load in Reinforced Concrete Members,” University of Illinois Engi-neering Experiment Station, Bulletin Series No. 399, Bulletin No. 1, Urbana-Champaign, IL, 1951, 28 pp.
26. Ahmed, S. H., “Properties of Confined Concrete Subjected to Static and Dynamic Loading,” Ph. D. Thesis, Department of Materials Engineering, University of Illinois at Chicago, Chi-cago, IL, 1981, 342 pp.
Following the tangent modulus theory,23,24 the buckling load for a hinged prestressed concrete column considering nonlinear properties of the materials is given by:
PE I E I
Lcrtc c tp p=
+π 2
2
( ) (24)
whereEtc = tangent modulus of concrete Etp = tangent modulus of steel reinforcementIc = moment of inertia of concrete Ip = moment of inertia of steel reinforcement cross section
Equilibrium and compatibility conditions lead to:
P A E A Ecr c sc p sp pe= − −ε ε ε ( ) (25)
whereEsc = secant modulus of concreteEsp = secant modulus of steel reinforcementAc = cross-sectional area of concreteAp = cross-sectional area of steel reinforcementεpe = effective strain in prestressing steel
Since the area of steel is generally small, the contribution of the steel can be neglected from both equations. Conse-quently, Eqs. (24) and (25) can be combined to produce Eq.
APPENDIX A — DERIvATIONS OF EItan
(26):
PE I
LA Ecr
tc gg sc= =
πε
2
2 (26)
where Ig = moment of inertia of cross sectionAg = area of gross cross section
The concrete tangent modulus Etc can be obtained by differentiating the stress-strain relationship with respect to strain. Using, for instance, the parabolic equation suggested by Hognestad25 leads to:
Ef
tcc= ′ −
21
0 0εεε
(27)
where ε0 is the concrete strain at maximum strength. For normal weight concrete, ε0 can be estimated by the
following expression:26
ε0 0 001648 0 000114= + ′. . (28)
fc
in which f ′c is in ksi units.Similarly, the concrete secant modulus Esc at a particular
strain can be obtained by dividing the stress in the stress-strain relationship by the strain. Using the parabolic relation-ship of Hognestad leads to:
Ef
scc= ′ −
ε
εε0 0
2 (29)
Substituting the expressions of Etc and Esc into Eq. (26) and solving for the strain leads to:
78 PCI JOURNAL
ε ε π ε π= +
− +
0
2
02
4
(30)
r
L
r
L
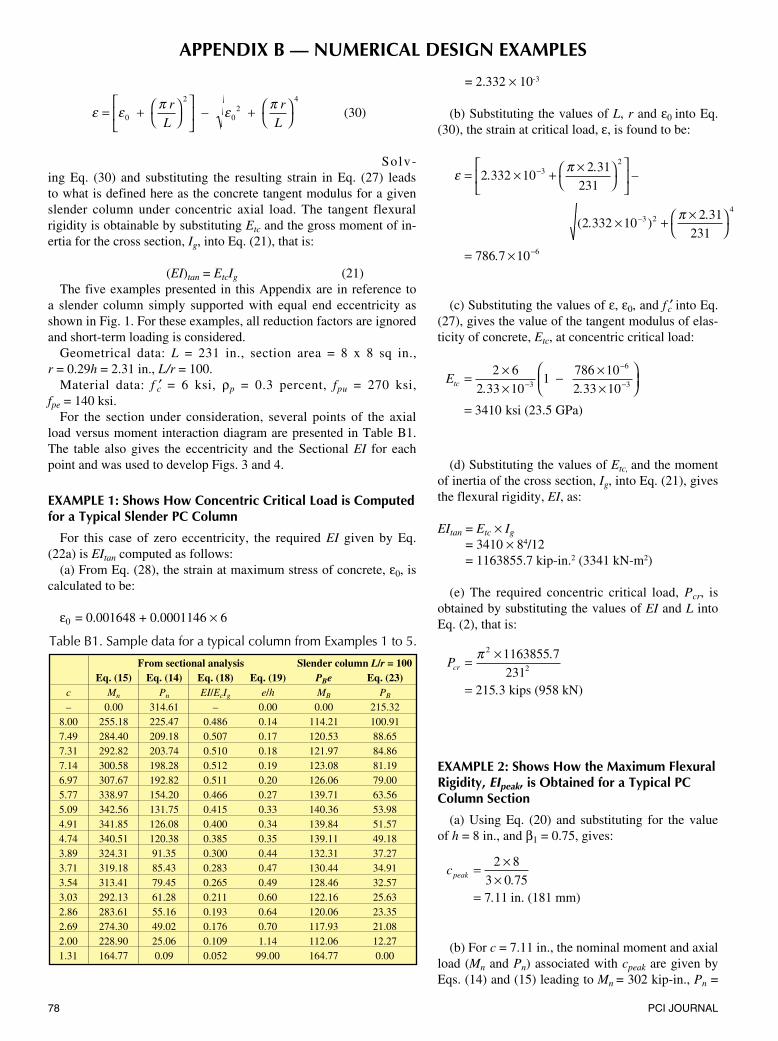
Solv-ing Eq. (30) and substituting the resulting strain in Eq. (27) leads to what is defined here as the concrete tangent modulus for a given slender column under concentric axial load. The tangent flexural rigidity is obtainable by substituting Etc and the gross moment of in-ertia for the cross section, Ig, into Eq. (21), that is:
(EI)tan = EtcIg (21)The five examples presented in this Appendix are in reference to
a slender column simply supported with equal end eccentricity as shown in Fig. 1. For these examples, all reduction factors are ignored and short-term loading is considered.
Geometrical data: L = 231 in., section area = 8 x 8 sq in., r = 0.29h = 2.31 in., L/r = 100.
Material data: f ′c = 6 ksi, ρp = 0.3 percent, fpu = 270 ksi, fpe = 140 ksi.
For the section under consideration, several points of the axial load versus moment interaction diagram are presented in Table B1. The table also gives the eccentricity and the Sectional EI for each point and was used to develop Figs. 3 and 4.
EXAMPLE 1: Shows how Concentric Critical Load is Computed for a Typical Slender PC Column
For this case of zero eccentricity, the required EI given by Eq. (22a) is EItan computed as follows:
(a) From Eq. (28), the strain at maximum stress of concrete, ε0, is calculated to be:
ε0 = 0.001648 + 0.0001146 × 6
APPENDIX B — NUMERICAL DESIGN EXAMPLES
Table B1. Sample data for a typical column from Examples 1 to 5.
From sectional analysis Slender column L/r = 100 Eq. (15) Eq. (14) Eq. (18) Eq. (19) PBe Eq. (23) c Mn Pn EI/EcIg e/h MB PB
– 0.00 314.61 – 0.00 0.00 215.32 8.00 255.18 225.47 0.486 0.14 114.21 100.91 7.49 284.40 209.18 0.507 0.17 120.53 88.65 7.31 292.82 203.74 0.510 0.18 121.97 84.86 7.14 300.58 198.28 0.512 0.19 123.08 81.19 6.97 307.67 192.82 0.511 0.20 126.06 79.00 5.77 338.97 154.20 0.466 0.27 139.71 63.56 5.09 342.56 131.75 0.415 0.33 140.36 53.98 4.91 341.85 126.08 0.400 0.34 139.84 51.57 4.74 340.51 120.38 0.385 0.35 139.11 49.18 3.89 324.31 91.35 0.300 0.44 132.31 37.27 3.71 319.18 85.43 0.283 0.47 130.44 34.91 3.54 313.41 79.45 0.265 0.49 128.46 32.57 3.03 292.13 61.28 0.211 0.60 122.16 25.63 2.86 283.61 55.16 0.193 0.64 120.06 23.35 2.69 274.30 49.02 0.176 0.70 117.93 21.08 2.00 228.90 25.06 0.109 1.14 112.06 12.27 1.31 164.77 0.09 0.052 99.00 164.77 0.00
= 2.332 × 10⁻³
(b) Substituting the values of L, r and ε0 into Eq. (30), the strain at critical load, ε, is found to be:
ε π
π
= × + ×
× + ×
= ×
−
−
−
2 332 102 31
231
2 332 102 31
231
786 7 10
32
3 24
..
–
..
.
( )
6
(c) Substituting the values of ε, ε0, and f ′c into Eq. (27), gives the value of the tangent modulus of elas-ticity of concrete, Etc, at concentric critical load:
Etc = ××
− ××
=
−
−
−2 6
2 33 101
786 10
2 33 10
3410
3
6
3. .
ksi (23.5 GPa)
(d) Substituting the values of Etc, and the moment of inertia of the cross section, Ig, into Eq. (21), gives
the flexural rigidity, EI, as:
EItan = Etc × Ig = 3410 × 84/12 = 1163855.7 kip-in.2 (3341 kN-m2)
(e) The required concentric critical load, Pcr, is obtained by substituting the values of EI and L into Eq. (2), that is:
Pcr = ×
=
π 2
2
1163855 7
231215 3
.
. kips (958 kN)
EXAMPLE 2: Shows how the Maximum Flexural Rigidity, EIpeak, is Obtained for a Typical PC Column Section
(a) Using Eq. (20) and substituting for the value of h = 8 in., and β1 = 0.75, gives:
cpeak = ××
=
2 8
3 0 757 11
.. in. (181 mm)
(b) For c = 7.11 in., the nominal moment and axial load (Mn and Pn) associated with cpeak are given by Eqs. (14) and (15) leading to Mn = 302 kip-in., Pn =

January-February 2003 79
197.3 kips.
(c) From Eq. (18), the maximum flexural rigidity is:
EIpeak = ×
=
302 7 11
0 003
715 740
.
.
, kip - in. (2054 kN - m )
2 2
(d) The corresponding eccentricity is given by Eq. (19) as:
epeak = 302/197.3 = 1.53 in. (39 mm)
EXAMPLE 3: Checking the Adequacy of Column Strength (Case 1)
Assume that the above column is subjected to a load-ing represented by Point A in Fig. 6 with PA = 85 kips and MA = 116 kip-in. Using the proposed method, compute the moment at Point A1 and check if the column can carry the loading.
(a) Compute the eccentricity for the given loading:
ea = 116/85 = 1.365 in. (35 mm)
(b) Because the applied eccentricity is lower than epeak, use the linear EI relationship given by Eq. (22a):
EI = − −
×
=
11638561163856 715740
1 531 365
764 066
kip - in. (2193 kN - m )
2 2
..
, = 764,066 kip-in.2 (2193 kN-m2)
(c) Based on the computed value of EI, the critical load at this eccentricity is calculated by Eq. (2):
Pcr = ×
=
π 2
2
764066
231141 3. kips (629 kN)
(d) The magnified moment is given by Eq. (10):
MA1
116
185
141 3291
=−
=
kip - in. (32.9 kN - m).
This moment is less than the sectional moment of 319 kip-in. at a load of 85 kips, indicating that the column can indeed carry the applied load.
EXAMPLE 4: Checking the Adequacy of Column Strength (Case 2)
Assume that the above column is subjected to a loading
represented by Point A in Fig. 6 with PA = 55 kips and MA = 149 kip-in. Using the proposed method, compute the mo-ment at Point A1 and check if the column can carry the load.
(a) Compute the eccentricity of the given loading:
ea = 149/55 = 2.71 in. (69 mm)
(b) Because the eccentricity of the loading is higher than the peak eccentricity, the flexural rigidity is obtained from Eq. (22b). For such an eccentricity, sectional analysis pro-vided Mn = 341.85 kip-in. and Pn = 126.08 kips, at a neutral axis, c = 4.91 in. Thus, Eq. (22b), gives:
EI = ×
=
341 85 4 91
0 003
559 495
. .
.
, kip - in. (1606 kN - m )2 2
(c) The critical load at this eccentricity is given by Eq. (2):
Pcr = ×
=
π 2
2
559495
231103 5. kips (460 kN)
(d) The magnified moment is given by Eq. (10):
MA1
149
155
103 5318
=−
=
kip - in. (35.9 kN - m).
This moment is outside the section interaction diagram; hence, the column is not capable of carrying this load.
EXAMPLE 5: Development of a Typical Point on the Interaction Diagram
For the above column, locate Point B in Fig. 6 on the slender interaction diagram given Point D with MD = 341.85 kip-in. and PD = 126.08 kips as shown in Table B1.
(a) The eccentricity for this loading is e = 341.85/126.08 = 2.71 in.; it is higher than the eccentricity at the peak (epeak
= 1.53 in.). Accordingly, EI is obtained from Eq. (22b) as illustrated in Example 4 (EI = 559495), and the associated critical load is Pcr = 103.5 kips (460 kN).
(b) The first estimate of the load is obtained by using Eq. (23):
PB =+ ×
=
103 5
1103 5 2 71
341 8556 85
.. .
..
kips (253 kN)
80 PCI JOURNAL
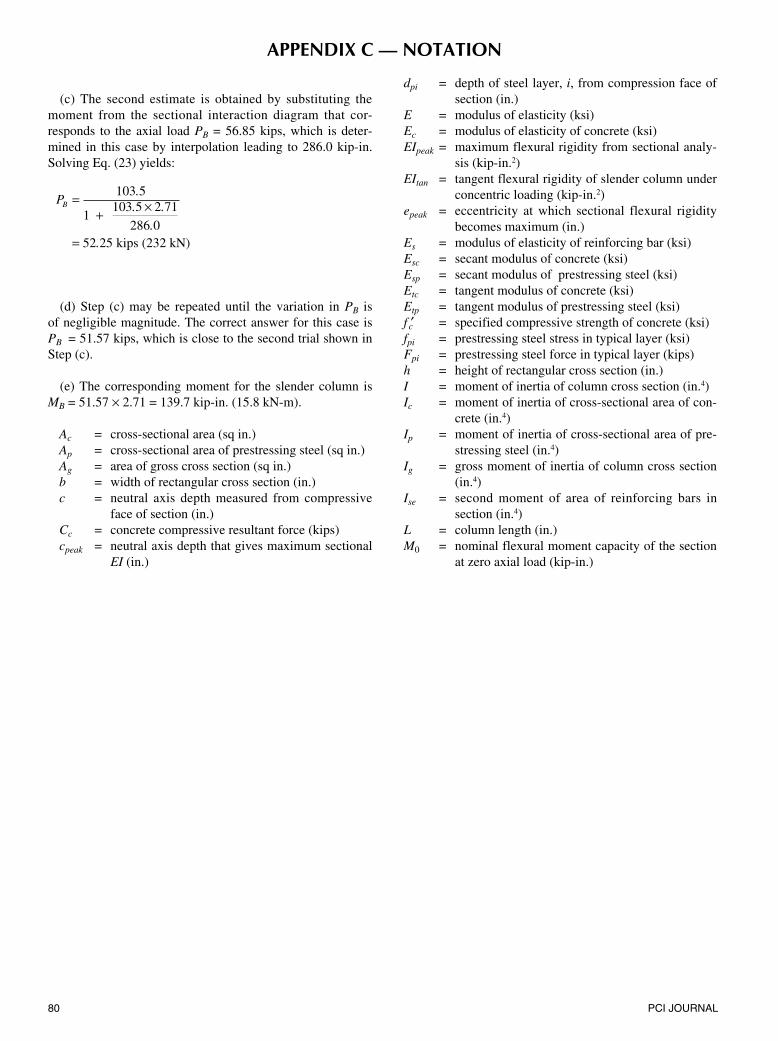
(c) The second estimate is obtained by substituting the moment from the sectional interaction diagram that cor-responds to the axial load PB = 56.85 kips, which is deter-mined in this case by interpolation leading to 286.0 kip-in. Solving Eq. (23) yields:
PB =+ ×
=
103 5
1103 5 2 71
286 052 25
.. .
..
kips (232 kN)
(d) Step (c) may be repeated until the variation in PB is of negligible magnitude. The correct answer for this case is PB = 51.57 kips, which is close to the second trial shown in Step (c).
(e) The corresponding moment for the slender column is MB = 51.57 × 2.71 = 139.7 kip-in. (15.8 kN-m).
Ac = cross-sectional area (sq in.)Ap = cross-sectional area of prestressing steel (sq in.)Ag = area of gross cross section (sq in.)b = width of rectangular cross section (in.)c = neutral axis depth measured from compressive
face of section (in.)Cc = concrete compressive resultant force (kips)cpeak = neutral axis depth that gives maximum sectional
EI (in.)
APPENDIX C — NOTATION
dpi = depth of steel layer, i, from compression face of section (in.)
E = modulus of elasticity (ksi)Ec = modulus of elasticity of concrete (ksi)EIpeak = maximum flexural rigidity from sectional analy-
sis (kip-in.2) EItan = tangent flexural rigidity of slender column under
concentric loading (kip-in.2)epeak = eccentricity at which sectional flexural rigidity
becomes maximum (in.)Es = modulus of elasticity of reinforcing bar (ksi)Esc = secant modulus of concrete (ksi)Esp = secant modulus of prestressing steel (ksi)Etc = tangent modulus of concrete (ksi)Etp = tangent modulus of prestressing steel (ksi)f ′c = specified compressive strength of concrete (ksi)fpi = prestressing steel stress in typical layer (ksi)Fpi = prestressing steel force in typical layer (kips)h = height of rectangular cross section (in.)I = moment of inertia of column cross section (in.4)Ic = moment of inertia of cross-sectional area of con-
crete (in.4)Ip = moment of inertia of cross-sectional area of pre-
stressing steel (in.4)Ig = gross moment of inertia of column cross section
(in.4)Ise = second moment of area of reinforcing bars in
section (in.4)L = column length (in.) M0 = nominal flexural moment capacity of the section
at zero axial load (kip-in.)

January-February 2003 8�
Mend
View publication statsView publication stats