A New Deep UV Raman & Photoluminescence Spectrometer ...
23
SPIE DCS 2018 Booth No. 1330 www.photonsystems.com New Product Demonstration SPIE DCS – Orlando, FL April 16, 2018 A New Deep UV Raman & Photoluminescence Spectrometer System The DUV Raman/PL 200 by Photon Systems, Inc.
Transcript of A New Deep UV Raman & Photoluminescence Spectrometer ...

SPIE DCS 2018 Booth No. 1330 www.photonsystems.com
New Product Demonstration
SPIE DCS – Orlando, FL April 16, 2018
A New Deep UV Raman & Photoluminescence Spectrometer System
The DUV Raman/PL 200
by Photon Systems, Inc.

SPIE DCS 2018 Booth No. 1330 www.photonsystems.com
Deep UV Raman/PL 200
7”W x 8”H x 22” D < 25 lbs < 25 W, max

SPIE DCS 2018 Booth No. 1330 www.photonsystems.com
q Deep UV Raman spectroscopy, until now, has required a large and expensive spectrometer system with a large and expensive detector and laser with a liquid cooler and 15 kW power available, which requires a significant lab on a 4’x8’ optical table plus peripherals.
q The new Photon Systems DUV Raman/PL 200 system is a fully self-contained instrument with deep UV laser, spectrometer, detector and electronics, computer controlled dual grating mount and sub-micron XY microscope stage sample positioner, all in a single package.
q Nothing external except your laptop or tablet. ü Size: 7” wide x 8” high x 22” deep, ü Weight < 25 lbs, ü Power consumption < 25 W.
q Take it to the field with you. Run it on a battery.
q Take it on vacation with you.
What’s New

SPIE DCS 2018 Booth No. 1330 www.photonsystems.com
Excita'onWavelength:248.6or224.3nm.
Spectrograph:200cmCzernyTurnerwithdualcomputercontrolled3600&300g/mmholographicgra?ngs
Dispersion:1.9cm-1/pixel(w4200g/mmgra?ng)
Resolu'on:<8cm-1,with75µmslit
EntranceSlits:fixed,selectableSpectralSpread:300-4000cm-1(4200g/mmgra?ng)
250nmto450nm(600g/mmgra?ng)(0.6nmres)
Detector:3stageTEcooled,backilluminated,UVCCDArray
Obj.Lens:3X,5X,15X,40XDUVachroma?cobjec?vesContextImagingCamera:FOV:1.3mm,267µ,100µ,30µ;2.4MpixelMotorizedPosi'on/MappingStage:5x5cmmappingarea,<2µmrepeatabilityOverallSize:7.0”Wx7.3”Hx22”D(includingXYmapper)
Weight:<25lbPowerConsump'on:Standby-8W,Maxpower-60W
Input:85VACto270VACor24VDCSafety:ClassI,DHHS/CDRHCommand&Control:viaexternalcomputerortablet
Deep UV Raman/PL 200 Specifications Fully Self-Contained except external computer or tablet

SPIE DCS 2018 Booth No. 1330 www.photonsystems.com
Computer controlled 5x5 cm XY
Manual 5x5 cm XY
SPIE DCS 2018 Booth No. 1330 www.photonsystems.com
Why Deep UV vs Near UV , Vis, or IR
q The old saying is that fluorescence is the enemy of Raman. q It is also true that Raman is the enemy of fluorescence. q I’ll explain.
ü Fluorescence cross-section are between 1 to 100 million times larger than Raman cross-sections. ü As a result, any fluorescence within the Raman region of the spectrum from the targeted material
or surrounding material within the laser beam spot, will alter or obscure the Raman spectra. ü Native fluorescence spectra from a material are independent of excitation wavelength, although
the spectra can be truncated if excitation does not occur below the threshold for fluorescence of the material, which is about 270 nm.
ü The Raman spectral region of a material is a dependent on the excitation wavelength. As excitation wavelength is made shorter, the wavelength spectral range for Raman and fluorescence emissions separate, with Raman below 270 nm and fluorescence above 270 nm.
ü When excitation wavelength is below 250 nm, the Raman spectral range is below the lowest emission wavelength of essentially all known natural materials. When this occurs, Raman emissions occur is a “fluorescence free” region of the spectrum.
ü When Raman is fluorescence free, fluorescence is also Raman free, enabling better identification.

SPIE DCS 2018 Booth No. 1330 www.photonsystems.com
RamanSpectraofCrudeOilat248nmvs532nm

SPIE DCS 2018 Booth No. 1330 www.photonsystems.com
Sensitivity to Excitation Wavelength Raman Spectra with Excitation at 248 nm versus 262 nm
(Example is G Agents)
248 nm 262 nm
Adapted from Christesen, S.D. et al. Appl. Spec. 2008 Oct; 62(10):1078-83

SPIE DCS 2018 Booth No. 1330 www.photonsystems.com
Deep UV Fluorescence Spectra of 52 Compounds with no baseline subtraction or compensation, Ex=248 nm
Raman Region Fluorescence Region
BTEX Biological 2-ring 3-ring 4-ring 5-ring
SPIE DCS 2018 Booth No. 1330 www.photonsystems.com
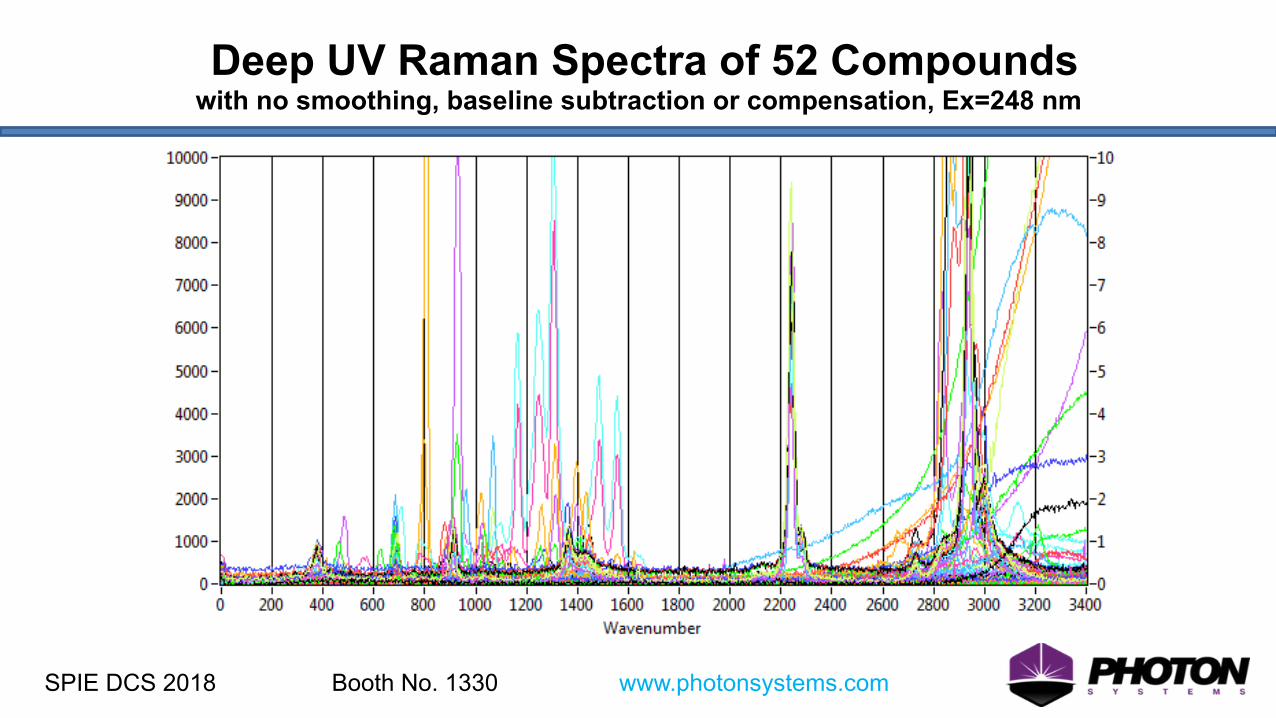
Deep UV Raman Spectra of 52 Compounds with no smoothing, baseline subtraction or compensation, Ex=248 nm

SPIE DCS 2018 Booth No. 1330 www.photonsystems.com
Deep UV Raman & Fluorescence as Independent & Orthogonal
Modes of Detection

SPIE DCS 2018 Booth No. 1330 www.photonsystems.com
Combining DUV Raman & Fluorescence
q Raman provides information about chemical bonds and functional groups, including those that do not fluoresce (aliphatics and simple compounds)
q Fluorescence data provides information about the electronic structure of target & substrate ingredients (aromatics, ketones, aldehydes) q Fluorescence is over 106 to 108 times more sensitive than Raman, providing longer standoff distances or detection at lower concentrations

SPIE DCS 2018 Booth No. 1330 www.photonsystems.com
DUV Fluorescence/Raman Fusion
Fluorescence Raman
Raman & Fluorescence Combined

SPIE DCS 2018 Booth No. 1330 www.photonsystems.com
DUV Raman Spectra of Amino Acids and Glucose with no smoothing, baseline subtraction, or compensation, Ex=248 nm

SPIE DCS 2018 Booth No. 1330 www.photonsystems.com
DUV Raman Spectra of Minerals with no baseline subtraction or compensation, Ex=248 nm

SPIE DCS 2018 Booth No. 1330 www.photonsystems.com
DUV Raman Spectra of Bulk SEMTEX (PETN +RDX) with no baseline subtraction or compensation, Ex=248 nm
N2
PETN 1295 cm-1
PETN 1658 cm-1
RDX 1458 cm-1
PETN 2981 cm-1
SEMTEX

SPIE DCS 2018 Booth No. 1330 www.photonsystems.com
DUV Fluorescence Spectra of Bulk Explosives with no baseline subtraction or compensation, Ex=248 nm
SEMTEX = 76% PETN + 4.6%RDX + 9.4% binders + 9% plasticizers, etc C4 = 91% RDX + 5.3% plasticizers + 2.1% binder, etc.

SPIE DCS 2018 Booth No. 1330 www.photonsystems.com
DUV Raman Spectra of Oxidizers & DMMP with no baseline subtraction or compensation, Ex=248 nm
baseline offset for clarity
932 cm-1
933 cm-1
1240 cm-1 & 1457 cm-1
DMMP: 2914 cm-1, 2840 cm-1
989 cm-1

SPIE DCS 2018 Booth No. 1330 www.photonsystems.com
DUV Fluorescence Spectra of CBE Materials with no baseline subtraction or compensation, Ex=248 nm

SPIE DCS 2018 Booth No. 1330 www.photonsystems.com
Standoff sensors: 1-5 m with 3 mm Microscopic (µMOSAIC)
Macroscopic Raman/PL 200 &
MOSAIC
Standoff SHCBE, etc.
Working distance
1-10 mm 1-10 cm 1-10 m
Spatial resolution
0.2 -1 µm
10 - 200 µm 0.25 -10 mm
LOD Small fraction of a single spore
Single spore or ng/cm2 at 5 cm
60 spores or low µg per cm2
at 5 m
DUVRaman&FluorInstrumentsforSurfaceDetec'onOverwidespa'alscales

SPIE DCS 2018 Booth No. 1330 www.photonsystems.com
Microscopic Microbial Differentiation, Ex = 224 nm EvidenceofSpecia?onwithna?vefluorescence
Tyr (and Phe) concentrations increase with decreasing GC-content (Lobry 1997)
10um!
OrganicMaterial
BacterialCells
BacterialSpore
Staphylococcus epidermidis (32%) Bacillus subtilis (44%) Shewanella oneidensis (46%) Escherichia coli (51%) Bacillus atropheus spores
Bacterial Cells (GC%)

SPIE DCS 2018 Booth No. 1330 www.photonsystems.com
StandoffBicrobialDifferen'a'ononPaintedWall@ 2 m with Gen 1.0, @ 6 m with Gen 2.0 (f/55)
1x10⁸ cells per streak
3in
8 in
• Differen?abilityoftwogram(-)genuses,duetophenotypictraits
associatedwithproteincomposi?on&conforma?on

SPIE DCS 2018 Booth No. 1330 www.photonsystems.com
Differen'abilityofMicrobesonSurfaces
37
32
44
46
65
§ Detec?ondilutedintalcdown<10
microbesinview
volumeor<1/50Kw/w
§ Mul?pleindependent
prepara?onsand
samplesperorganism
GC% content shown in green