A New Approach To State Corporate Taxation
88
University of New Mexico UNM Digital Repository Economics ETDs Electronic eses and Dissertations 2-1-2012 A New Approach To State Corporate Taxation Swaroop Chary Follow this and additional works at: hps://digitalrepository.unm.edu/econ_etds is Dissertation is brought to you for free and open access by the Electronic eses and Dissertations at UNM Digital Repository. It has been accepted for inclusion in Economics ETDs by an authorized administrator of UNM Digital Repository. For more information, please contact [email protected]. Recommended Citation Chary, Swaroop. "A New Approach To State Corporate Taxation." (2012). hps://digitalrepository.unm.edu/econ_etds/5
Transcript of A New Approach To State Corporate Taxation
University of New MexicoUNM Digital Repository
Economics ETDs Electronic Theses and Dissertations
2-1-2012
A New Approach To State Corporate TaxationSwaroop Chary
Follow this and additional works at: https://digitalrepository.unm.edu/econ_etds
This Dissertation is brought to you for free and open access by the Electronic Theses and Dissertations at UNM Digital Repository. It has beenaccepted for inclusion in Economics ETDs by an authorized administrator of UNM Digital Repository. For more information, please [email protected].
Recommended CitationChary, Swaroop. "A New Approach To State Corporate Taxation." (2012). https://digitalrepository.unm.edu/econ_etds/5

A NEW APPROACH TO STATE CORPORATE TAXATION
BY SWAROOP R. CHARY B.E., Osmania University, 1997 M.S., Lamar University, 1998 DISSERTATION Submitted in Partial Fulfillment of the Requirements for the Degree of
Doctor of Philosophy Economics The University of New Mexico Albuquerque, New Mexico December, 2011

©2011, Swaroop R. Chary

iv
DEDICATION
I dedicate this work to my parents, Dr. S.T. Ramachandra Chary and Mrs. S.T.
Swarnalatha Chary as well as my best friend Ms. Michele Markovich for everything they
have given me.

v
ACKNOWLEDGMENTS
I heartily acknowledge Dr. Alok K. Bohara, my advisor and dissertation chair, for
continuing to encourage me through the years of classroom teaching and the long number
of months writing and rewriting these chapters. His guidance and professional style will
remain with me as I continue my career.
I also thank my committee members, Dr. Matias Fontenla, Dr. Philip Ganderton,
and Dr. Wendy Hansen, for their valuable recommendations pertaining to this study and
assistance in my professional development.
To Dr. James R. Nunns and Dr. Allen Maury from the Taxation and Revenue
Department at the State of New Mexico for the data, ideas, support, reviews and
feedback.
To my best friend, Michele Markovich, thank you for the many years of support
through my liver transplant and your comments, edits and encouragement.
And finally to my parents, Dr. S.T. Ramachandra Chary and Mrs. Swarnalatha
Chary, your love and blessings are the greatest gift of all.
vi
A NEW APPROACH TO STATE CORPORATE TAXATION
BY SWAROOP R.CHARY ABSTRACT OF DISSERTATION Submitted in Partial Fulfillment of the Requirements for the Degree of
Doctor of Philosophy Economics The University of New Mexico Albuquerque, New Mexico December, 2011
vii
A NEW APPROACH TO STATE CORPORATE TAXATION
by
Swaroop R. Chary
Bachelor of Engineering in Civil Engineering
Master of Science in Computer Science
Doctor of Philosophy
ABSTRACT
State Corporate Income Taxes (CIT) generally conform to the basic design and
provisions of the federal tax, which results in corporate income being taxed twice, once at
the corporate level as it is earned, and again at the individual shareholder level. Most
state corporate income taxes also incorporate at least some of the federal provisions that
narrow the corporate income tax base, such as bonus depreciation and the domestic
production activities deduction. State corporate income taxes also have very high
compliance costs relative to revenue, and are a highly volatile source of state revenue. In
addition, state corporate income taxes are generally apportioned among states, using at
least one of the three traditional factors: property, payroll and sales. Such apportionment
results in a highly uneven tax on the apportionment factors that is unrelated to benefits
provided to corporations by state and local governments.
I propose replacing the state corporate income tax with a franchise tax using
property, payroll and sales above specified threshold levels. The proposal would remove
the distortions inherent in the current corporate income tax, substantially reduce
viii
compliance costs, relate corporate taxes more closely with benefits corporations receive
from government expenditures and provide a much more stable source of state revenue.
The uncertain incidence of state corporate income tax has been argued for the past
few decades, although economists have devoted relatively little attention to the incidence
of state franchise taxes. I argue that state corporate franchise taxes are borne by the
factors in the traditional three-factor apportionment formula, i.e., property, sales and
payroll. I argue that state franchise taxes are likely to be borne by residents of the taxing
state as consumers, labor, capital or land owners and a tax would be passed on to the
consumers in the taxing state and not exported to consumers throughout the nation. I
further argue that the factor(s) that are least likely to escape the tax through migration are
taxed. I note that from an economic rents perspective the incidence of state franchise
taxes depends on the nature of rents collected, to extent that ideas and not goods are
produced by franchise taxpayers; the franchise tax is a tax on labor.
Also, historically, corporate income tax revenues are both volatile and difficult to
predict, and increase uncertainty in state budgeting. State corporate income taxes
revenues are extremely sensitive to economic cycles and thus are subject to considerable
uncertainty. During downturns, state CIT revenues are “pro-cyclical” and exacerbate the
drop in state revenues. I argue that a franchise tax based on the three traditional
apportionment factors, i.e. property, sales and payroll, would not only generate a higher
annual revenue but also would be much more stable, helping to reduce uncertainty from
budget forecasting and decision making.
ix
TABLE OF CONTENTS
TABLE OF CONTENTS ............................................................................................... IX
LIST OF FIGURES ........................................................................................................ XI
LIST OF TABLES .........................................................................................................XII
CHAPTER 1 PROPOSAL ................................................................................................1
Introduction ....................................................................................................................1
Our Proposal ..................................................................................................................8
Examples ......................................................................................................................10
Empirical Results .........................................................................................................20
CHAPTER 2 BENEFITS AND DRAWBACKS ...........................................................28
Economic Growth and Efficiency ................................................................................29
Neutrality .....................................................................................................................30
Equity and Fairness ......................................................................................................31
Stability of Revenues ...................................................................................................32
Simplicity, Ease of Administration ..............................................................................33
Compliance ..................................................................................................................34
Transparency and Visibility .........................................................................................35
Tax Shelters .................................................................................................................35
Double-taxation ...........................................................................................................35
The “Nexus Penalty” ...................................................................................................37
Combined Reporting ....................................................................................................38
Internationalization ......................................................................................................39
CHAPTER 3 THE INCIDENCE OF STATE FRANCHISE TAXES ........................41
Literature on Corporate Tax Incidence ........................................................................41
x
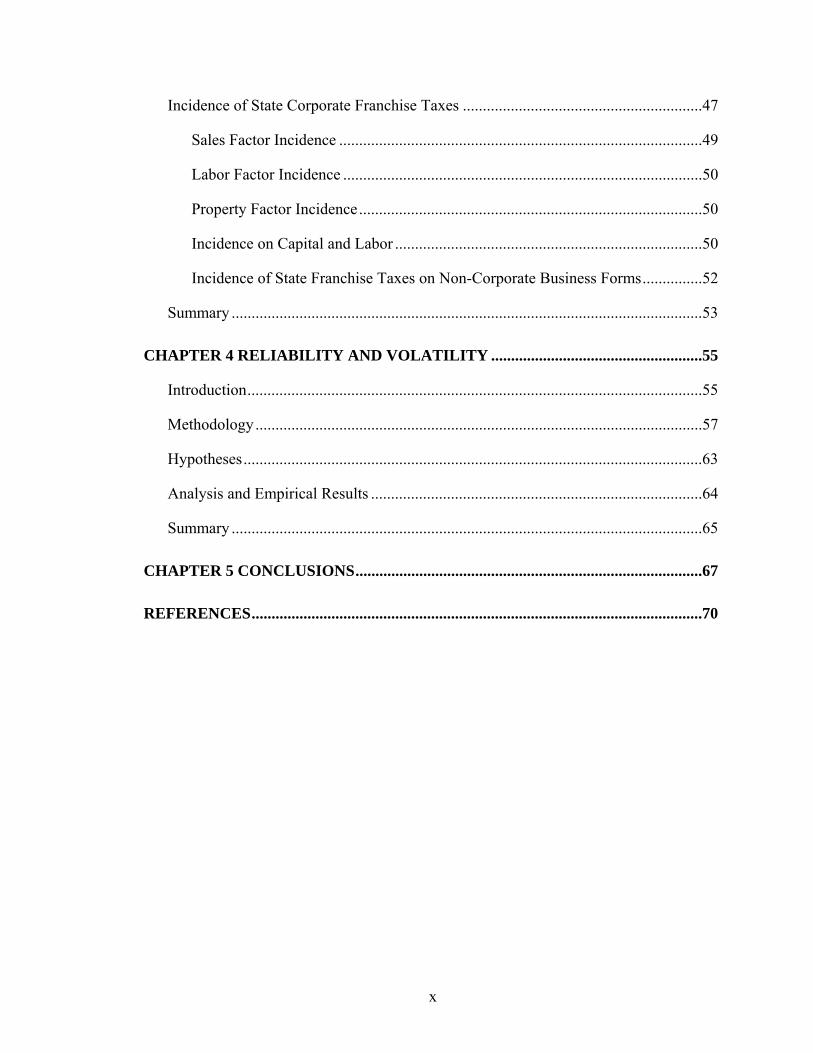
Incidence of State Corporate Franchise Taxes ............................................................47
Sales Factor Incidence ...........................................................................................49
Labor Factor Incidence ..........................................................................................50
Property Factor Incidence ......................................................................................50
Incidence on Capital and Labor .............................................................................50
Incidence of State Franchise Taxes on Non-Corporate Business Forms ...............52
Summary ......................................................................................................................53
CHAPTER 4 RELIABILITY AND VOLATILITY .....................................................55
Introduction ..................................................................................................................55
Methodology ................................................................................................................57
Hypotheses ...................................................................................................................63
Analysis and Empirical Results ...................................................................................64
Summary ......................................................................................................................65
CHAPTER 5 CONCLUSIONS .......................................................................................67
REFERENCES .................................................................................................................70

xi
LIST OF FIGURES
Figure 1: Effective Property Tax Rate for Franchise Tax Payers in New Mexico for the
year 2014 (based on 2006 data) .................................................................................25
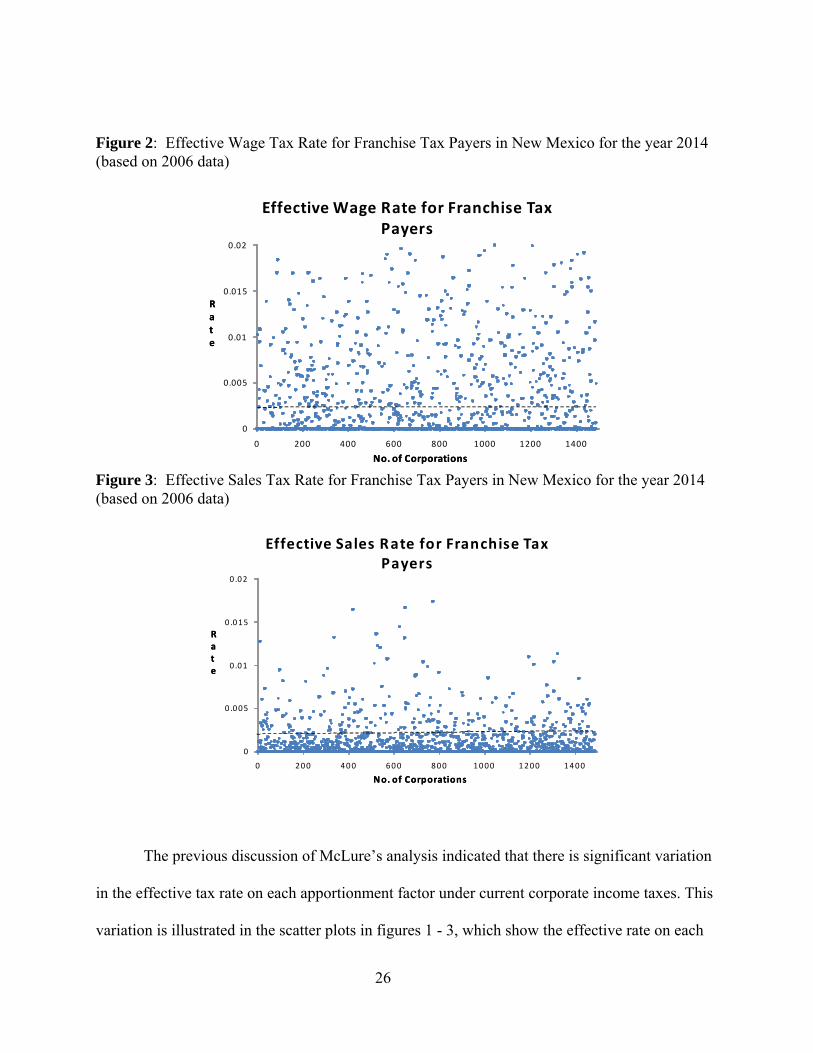
Figure 2: Effective Wage Tax Rate for Franchise Tax Payers in New Mexico for the year
2014 (based on 2006 data) .........................................................................................26
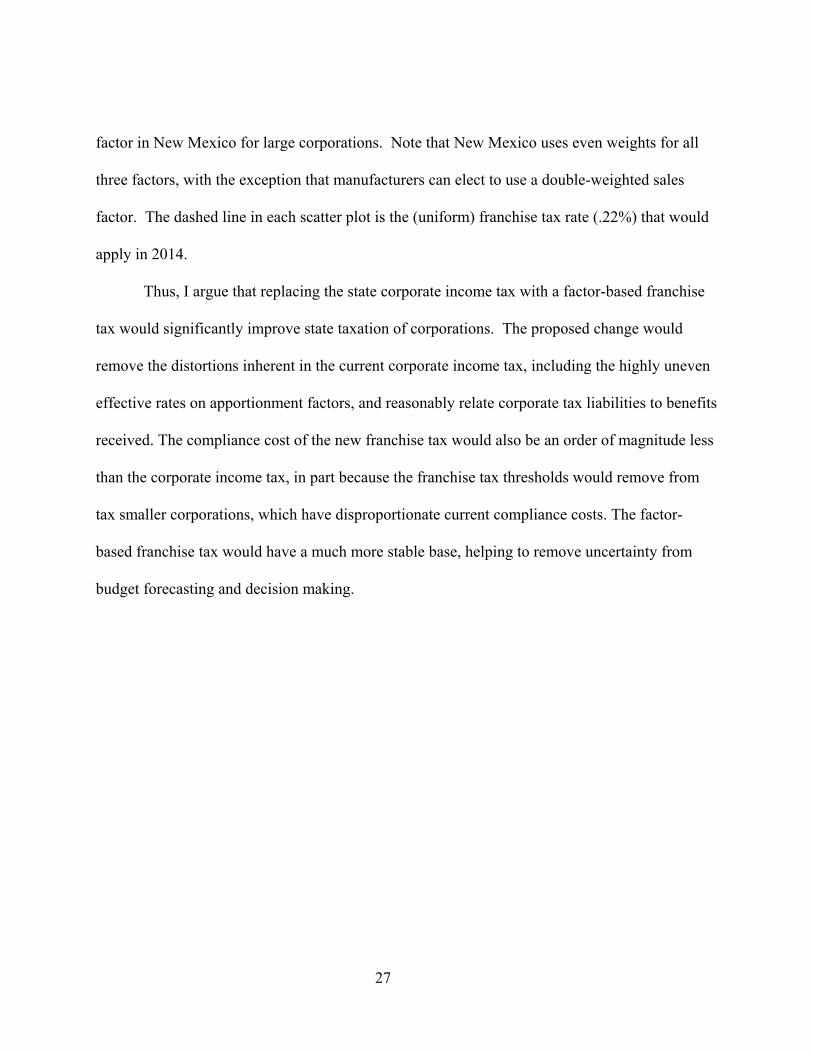
Figure 3: Effective Sales Tax Rate for Franchise Tax Payers in New Mexico for the year
2014 (based on 2006 data) .........................................................................................26
Figure 4: Estimating New Mexico Corporate Income Tax Revenues by the Consensus
Forecast Process .........................................................................................................59
Figure 5: Data Sources used in simulating corporate franchise taxes from 2006 through
2014 ............................................................................................................................62
Figure 6: New Mexico Corporate Income and Corporate Franchise Tax Revenues (in $
millions) .....................................................................................................................65
xii
LIST OF TABLES
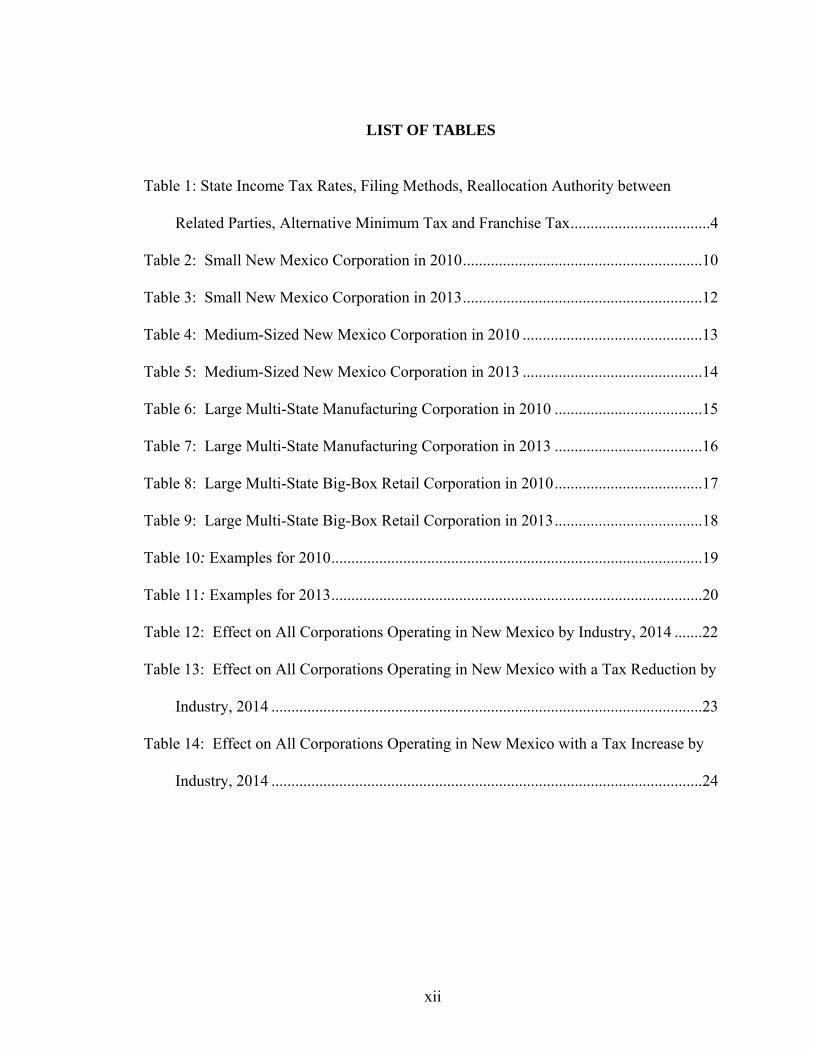
Table 1: State Income Tax Rates, Filing Methods, Reallocation Authority between
Related Parties, Alternative Minimum Tax and Franchise Tax ...................................4
Table 2: Small New Mexico Corporation in 2010 ............................................................10
Table 3: Small New Mexico Corporation in 2013 ............................................................12
Table 4: Medium-Sized New Mexico Corporation in 2010 .............................................13
Table 5: Medium-Sized New Mexico Corporation in 2013 .............................................14
Table 6: Large Multi-State Manufacturing Corporation in 2010 .....................................15
Table 7: Large Multi-State Manufacturing Corporation in 2013 .....................................16
Table 8: Large Multi-State Big-Box Retail Corporation in 2010 .....................................17
Table 9: Large Multi-State Big-Box Retail Corporation in 2013 .....................................18
Table 10: Examples for 2010 .............................................................................................19
Table 11: Examples for 2013 .............................................................................................20
Table 12: Effect on All Corporations Operating in New Mexico by Industry, 2014 .......22
Table 13: Effect on All Corporations Operating in New Mexico with a Tax Reduction by
Industry, 2014 ............................................................................................................23
Table 14: Effect on All Corporations Operating in New Mexico with a Tax Increase by
Industry, 2014 ............................................................................................................24
1
Chapter 1
Proposal
Introduction State corporate income taxes generally conform to the basic design and provisions of the federal
tax. The federal corporate income tax operates as a separate tax from the federal individual
income tax. This means that corporate income is taxed twice: first at the corporate level as it is
earned, and again at the individual shareholder level when (after-tax) corporate income is
distributed to shareholders as dividends or shareholders realize capital gains on the sale of the
corporation’s stock.
Three significant economic distortions arise from this “double tax” design. First, because
partnerships, LLCs and other non-corporate businesses are only taxed once, at the individual
owner level, the corporate income tax discourages forming a business as a corporation. Second,
because undistributed corporate income is taxed at a lower rate than distributed corporate
income, the corporate income tax distorts the decision away from distributing income in favor of
retaining income. Third, because corporate income (the return to equity holders) is generally
taxed at a higher rate than interest on loans (the return to lenders, many of which are tax
exempt), the corporate income tax distorts the decision away from financing with equity in favor
of financing with debt. The federal corporate income tax also contains a number of provisions
that narrow, and therefore distort, its base. Most important among these distortions are
provisions that result in mistiming of deductions and income, such as the provisions for
accelerated forms of cost recovery for investments, including the “bonus depreciation”
provisions of the 2008 and 2009 stimulus bills. In addition to understating certain types of
2
income, these provisions also differentially reduce the effective tax rate on alternative forms of
investment, distorting investment choices. Another important distortion arises from the
deduction for domestic production activities, which favors certain activities over others.
At the state level the “double tax” issue differs between large and small corporations. For
large corporations, the “double tax” primarily arises from the taxes of different states -- the
corporate level tax of the state in which the corporation operates, and the individual- level tax of
the state(s) in which the shareholders reside. The corporate- level tax imposed on a large
corporation by the state in which it operates is necessary to equalize the tax treatment of
corporations and non-corporate businesses operating in the state, since the entire income earned
in the state by non-corporate businesses is taxed by the state, regardless of where the owners
reside. For this reason, a separate corporate- level tax imposed by the state in which a large
corporation operates has a separate justification from the federal corporate tax, even if this state
tax can be thought of as resulting in a “double tax” because another state or states tax the
dividends and capital gains of shareholders. For small corporations, however, both the
corporation and the shareholders are likely to be taxed by the same state, so the state can design
its tax system to mitigate the “double tax” on the income of small corporations.
In addition to economic distortions due to conformity with the federal tax, other
distortions arise from state corporate income tax provisions that determine the appropriate
amount of tax to impose on the income of multi-state businesses. These businesses are typically
part of a large number of related entities that may have multiple transactions among them. Such
transactions include sales, asset transfers, cost sharing arrangements, charges for services and
royalties for the use of intangibles. The number and complexity of these transactions make the
3
determination of the income attributable to each state very difficult. The distortions due to state
corporate income taxes affect the level and location of investment and economic activity. Also,
these distortions may be exacerbated by effect of special provisions on the actual or perceived
“business climate” of a state.
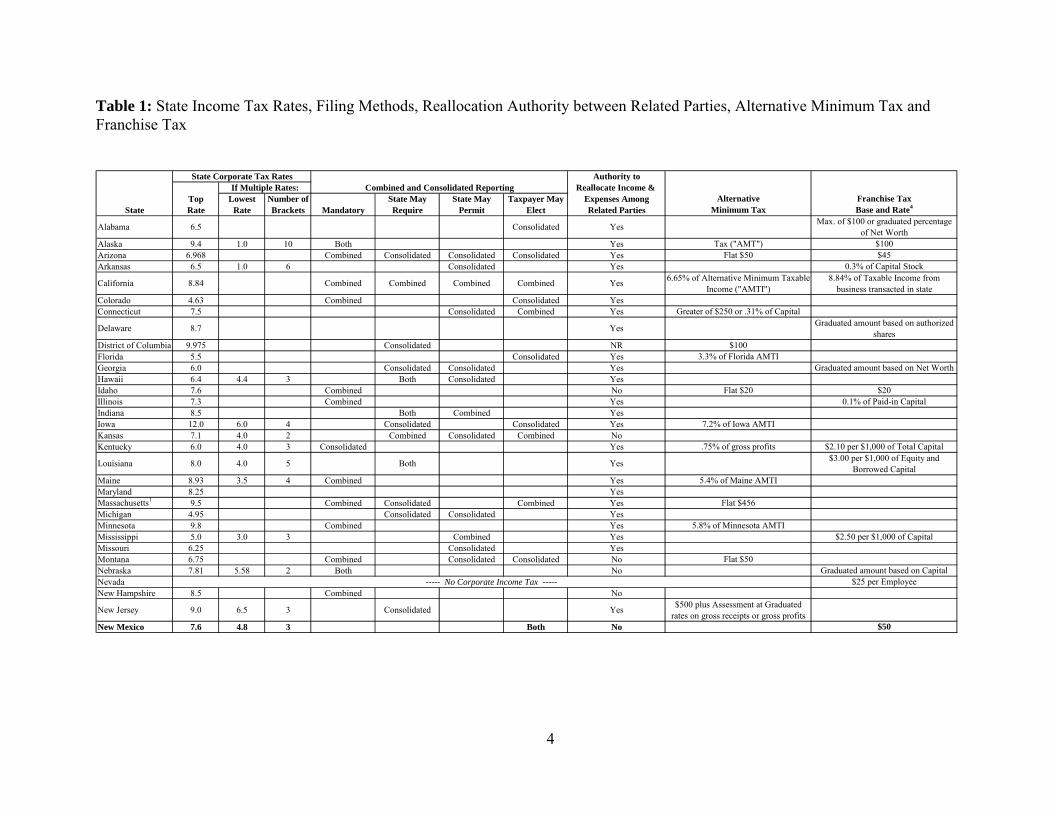
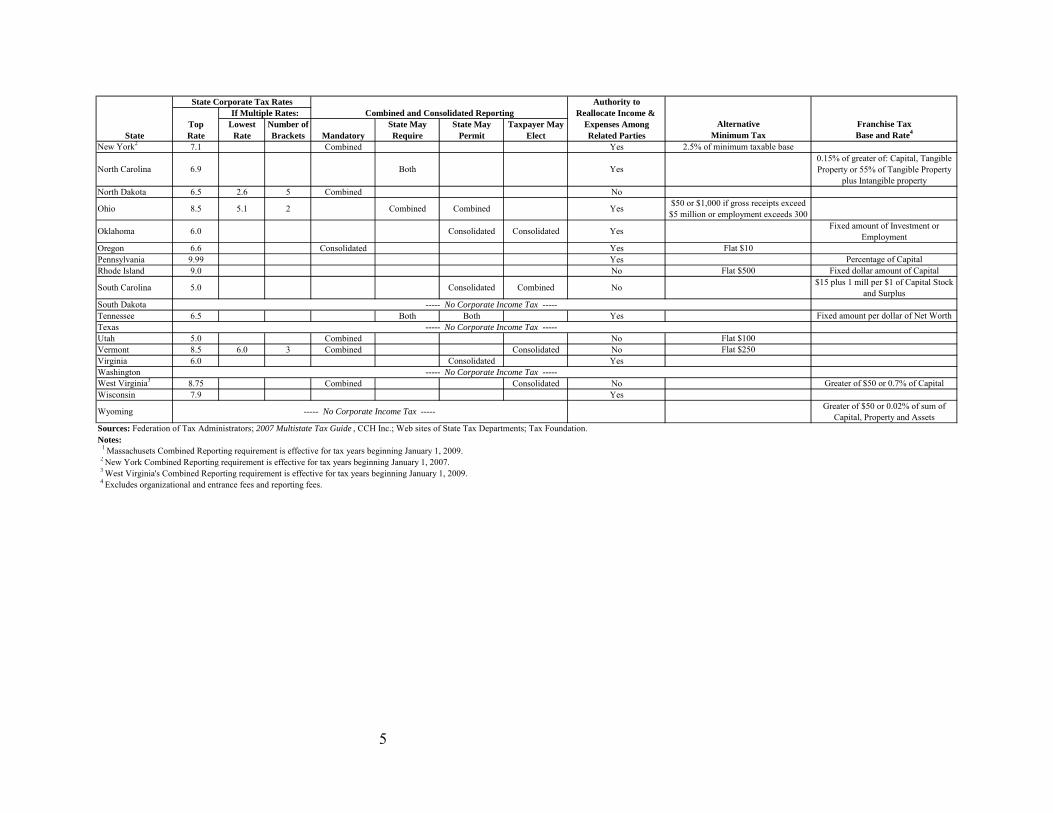
States have introduced special provisions that attempt to properly match the income and
expenses of a multi-state corporation to the activities in a state. These special provisions include
(a) Mandatory combined reporting, (b) Authority to reallocate income, deductions, and other
items between related entities, (c) “Add-back” and “anti-passive investment company”
legislation, (d) Minimum taxes, and (e) Significant franchise taxes. These rules tend to be
complex, requiring significant compliance resources from both corporations and state tax
agencies. They also have generated significant litigation. In addition, the actual or perceived
“business climate” of a state may be heavily influenced by presence and nature of such rules.
Table 1 (next page) shows the state income tax rates, filing method options, reallocation
authority between different parties, alternative minimum tax and franchise tax comparisons
between the different states.
State corporate income taxes are “pro-cyclical”, exacerbating the drop in state revenues
in downturns. GAO (2002) reports that 32.7 percent of large U.S. corporations reported no tax
liability in 1995, and that percentage rose to 45.3 percent by 2000. Nationally, corporate income
tax revenues declined 12.2% in the year ending June 2009, after declining 7.3% in the year
ending June 2008, a cumulative decline of 19.7%, after growth of 15.4% between June 2006 and
June 2007. Auerbach (1984, p. 5) notes that corporate income tax revenues have declined
steadily as a fraction of U.S. GNP over the past three decades. He adds that "one reason for the
decline in corporate tax collections since 1953 has been a decline in corporate profitability.
4
Table 1: State Income Tax Rates, Filing Methods, Reallocation Authority between Related Parties, Alternative Minimum Tax and Franchise Tax
Authority toReallocate Income &
Top Lowest Number of State May State May Taxpayer May Expenses Among Alternative Franchise TaxState Rate Rate Brackets Mandatory Require Permit Elect Related Parties Minimum Tax Base and Rate4
Alaska 9.4 1.0 10 Both Yes Tax ("AMT") $100 Arizona 6.968 Combined Consolidated Consolidated Consolidated Yes Flat $50 $45 Arkansas 6.5 1.0 6 Consolidated Yes 0.3% of Capital Stock
Colorado 4.63 Combined Consolidated YesConnecticut 7.5 Consolidated Combined Yes Greater of $250 or .31% of Capital
District of Columbia 9.975 Consolidated NR $100 Florida 5.5 Consolidated Yes 3.3% of Florida AMTIGeorgia 6.0 Consolidated Consolidated Yes Graduated amount based on Net WorthHawaii 6.4 4.4 3 Both Consolidated YesIdaho 7.6 Combined No Flat $20 $20 Illinois 7.3 Combined Yes 0.1% of Paid-in CapitalIndiana 8.5 Both Combined YesIowa 12.0 6.0 4 Consolidated Consolidated Yes 7.2% of Iowa AMTIKansas 7.1 4.0 2 Combined Consolidated Combined NoKentucky 6.0 4.0 3 Consolidated Yes .75% of gross profits $2.10 per $1,000 of Total Capital
Maine 8.93 3.5 4 Combined Yes 5.4% of Maine AMTIMaryland 8.25 YesMassachusetts1 9.5 Combined Consolidated Combined Yes Flat $456Michigan 4.95 Consolidated Consolidated YesMinnesota 9.8 Combined Yes 5.8% of Minnesota AMTIMississippi 5.0 3.0 3 Combined Yes $2.50 per $1,000 of CapitalMissouri 6.25 Consolidated YesMontana 6.75 Combined Consolidated Consolidated No Flat $50Nebraska 7.81 5.58 2 Both No Graduated amount based on CapitalNevada $25 per EmployeeNew Hampshire 8.5 Combined No
New Mexico 7.6 4.8 3 Both No $50
Alabama Consolidated Yes6.5
----- No Corporate Income Tax -----
Combined Combined
If Multiple Rates:State Corporate Tax Rates
Combined and Consolidated Reporting
5 Both$3.00 per $1,000 of Equity and
Borrowed Capital
Graduated amount based on authorized shares
Yes
8.84% of Taxable Income from business transacted in state
Max. of $100 or graduated percentage of Net Worth
$500 plus Assessment at Graduated rates on gross receipts or gross profits
Combined CombinedCalifornia 8.84
Louisiana 8.0 4.0
Yes6.65% of Alternative Minimum Taxable
Income ("AMTI")
Delaware 8.7
Yes
New Jersey 9.0 6.5 3 Consolidated Yes
5
Authority toReallocate Income &
Top Lowest Number of State May State May Taxpayer May Expenses Among Alternative Franchise TaxState Rate Rate Brackets Mandatory Require Permit Elect Related Parties Minimum Tax Base and Rate4
New York2 7.1 Combined Yes 2.5% of minimum taxable base
North Dakota 6.5 2.6 5 Combined No
Oregon 6.6 Consolidated Yes Flat $10Pennsylvania 9.99 Yes Percentage of CapitalRhode Island 9.0 No Flat $500 Fixed dollar amount of Capital
South DakotaTennessee 6.5 Both Both Yes Fixed amount per dollar of Net WorthTexasUtah 5.0 Combined No Flat $100Vermont 8.5 6.0 3 Combined Consolidated No Flat $250Virginia 6.0 Consolidated YesWashingtonWest Virginia3 8.75 Combined Consolidated No Greater of $50 or 0.7% of CapitalWisconsin 7.9 Yes
Sources: Federation of Tax Administrators; 2007 Multistate Tax Guide , CCH Inc.; Web sites of State Tax Departments; Tax Foundation.Notes: 1 Massachusets Combined Reporting requirement is effective for tax years beginning January 1, 2009. 2 New York Combined Reporting requirement is effective for tax years beginning January 1, 2007. 3 West Virginia's Combined Reporting requirement is effective for tax years beginning January 1, 2009. 4 Excludes organizational and entrance fees and reporting fees.
----- No Corporate Income Tax -----
----- No Corporate Income Tax -----
Combined Yes
Consolidated Consolidated
State Corporate Tax RatesIf Multiple Rates: Combined and Consolidated Reporting
8.5 CombinedOhio 5.1 2$50 or $1,000 if gross receipts exceed $5 million or employment exceeds 300
0.15% of greater of: Capital, Tangible Property or 55% of Tangible Property
plus Intangible property
----- No Corporate Income Tax -----
Fixed amount of Investment or Employment
$15 plus 1 mill per $1 of Capital Stock and Surplus
Greater of $50 or 0.02% of sum of Capital, Property and Assets
----- No Corporate Income Tax -----Wyoming
Oklahoma 6.0
North Carolina Both Yes6.9
Consolidated CombinedSouth Carolina 5.0 No
Yes
6
Another has been the reduction (from 52 percent to 46 percent) in the corporate tax rate.
However, the most important factor has been the introduction of several investment incentives
…". More recently, Gupta, et. al., (2009) document a similar decline in total state corporate
income tax collections relative to total state taxes from 1982 until 2002. Fox et. al. (2007) note
that state corporate income tax revenues as a share of profits are falling.
Also, the federal corporate income tax is complex, and the provisions states have added
also tend to be complex. This complexity results in significant compliance costs for both
corporations and state tax agencies. This complexity has also generated significant, expensive
litigation. Brunori (2002, p. 47) notes that the state corporate income taxes “consume an
inordinate amount of intellectual firepower and economic resources in terms of planning,
compliance, and administration.” Slemrod and Blumenthal estimated that in 1993 the average
state corporate income tax compliance cost for large (Fortune 500) corporations was 30.5% of
total compliance costs of $2.11 million, or about $0.64 million. Adjusted for changes in the CPI,
state compliance costs today would average nearly $1 million, or $21,000 per state for all
corporate income tax states. Importantly, Slemrod and Blumenthal found that these costs rose
much more slowly than company size and increased significantly if the corporation was in a tax
appeal or litigation.
State corporate income taxes are generally the result of apportionment of the total income
(or tax on total income) among the states in which the corporation operates. A multi-state
business‘s corporate income tax liability in a state where it has income tax nexus, is given by the
following formula:
T = [(Pi/P)* FP + (Wi/W)* FW + (Si/S)*FS] *t*�, ………………………………..(1)
7
where T is the Corporate income tax in state i, FP is the factor weight on property, FW is the
factor weight on payroll, FS is the factor weight on sales, P is the total property of the firm, Pi is
the property in state i, W is the total payroll of the firm, Wi is the payroll in state i, S is the total
sales of the firm and Si is the sales in state i, t is the Corporate income tax rate in state i, and � is
the Total profits (taxable income) of the corporation.
McLure (1980, 1981) uses these factors to show that the apportioned state corporate
income tax is equivalent to a tax on the apportionment factors. He concludes (McLure 1980, p.
342), “therefore, any single state would seem to be well-advised at least to replace the
corporation income tax with a tax levied directly on corporate sales, payrolls and property…”.
Similarly, Gordon (1986, p. 221) concludes, “On efficiency grounds, taxes should be designed to
minimize the extent to which economic decisions are made to avoid taxes, for any amount of
revenue raised. This report has argued that corporate [income] taxes create greater efficiency
costs than would a combination of property, payroll, and sales taxes.”
I use the McLure-Gordon prescription as the basis of a proposal to replace the state
corporate income tax with a corporate franchise tax based on the level of in-state apportionment
factors (property, payroll and sales) above specified threshold levels. The rationale for this new
approach is fourfold: (a) The current state corporate income tax is highly inefficient, (b) the
factors provide a reasonable proxy for benefits received, but under a corporate income tax are
taxed very unevenly, exacerbating inefficiencies, (c) the franchise tax thresholds remove tax
from smaller firms that would incur disproportionate compliance costs and greatly reduce
compliance costs for large firms, and (d) revenue from the franchise tax would be much more
stable.
8
This idea to replace or modify corporate income tax is not new. At least six states are or
have been considering proposals to replace their state corporate income taxes. Minnesota
Governor’s 21st century tax reform commission proposed replacing their corporate income tax
with a more broad based sales tax. California tax reform commission recently proposed replacing
their corporate income tax with a form of subtraction Value Added Tax (VAT). Ohio is repealing
its corporate income tax and replacing it partially with a gross receipts tax. Many states are also
using double weighted sales factor to attract manufacturing industry as well as establishment of
corporate headquarters. California provides the option of a three factor formula with an option to
use double weighted sales factor beginning 2011. My proposal provides yet another way of
replacing state corporate income taxes.
The remainder of this chapter presents the proposal, provides detailed examples, and
discusses empirical results. The second chapter focuses on the benefits and drawbacks of the
proposal compared to a standard corporate income tax. The third chapter provides details on the
incidence of state corporate income and franchise taxes. Finally, I present a micro-simulation
study to analyze the stability and volatility of state corporate franchise taxes before presenting
My conclusions in my final chapter.
The Proposal
State corporate income taxes are generally the result of apportionment of the total income
(or tax on total income) among the states in which the corporation operates. Historically three
factors, property (the ratio of property in the state to total property), payroll (the ratio of payroll
in the state to total payroll) and sales (the ratio of sales in the state to total sales), were equally
weighted in the apportionment formula, but many states now weight sales more heavily. Using
9
the historical three factor formula and McLure’s notation from above, the state corporate income
tax can be expressed as:
T = Pi (t/P)/3 + Wi (t/W)/3 + Si (t/S)/3 ………………………………..(2)
where T is the corporate income tax in state i, P is the total property of the corporation, Pi is the
property in state i, W is the total payroll for the corporation, Wi is the payroll in state i, S is the
total sales for the corporation, Si is the sales in state i, t is the corporate income tax rate in state i,
and is the total profits (taxable income) of the corporation. The terms in McLure’s formula,
(t/P)/3, (t/W)/3, and (t/S)/3 are simply the effective rate of tax imposed by state i on Pi, Wi,
and Si, respectively. In practice, the effective rates on factors vary significantly across factors
and across companies (see below), distorting input and location choices.
As a case study, I pick the thresholds for each of the apportionment factors and the
effective rate such that corporate income tax rates are reduced to zero over a period of 4 years
with the tax base remaining unchanged. This new approach is described and analyzed below as it
could be implemented in New Mexico, but the essential features could apply to any state with a
corporate income tax. The specific implementation would reduce New Mexico corporate income
tax rates in steps between 2010 and 2013 and repeal the corporate income tax altogether in 2014,
with the revenue in each year replaced by setting the appropriate rate for the new corporate
franchise tax.1
1 As part of the proposal (not modeled here), related business entities would be defined as corporations and partnerships and LLCs not taxed as corporations in which the corporation holds (directly or indirectly) more than a 20 percent ownership interest. Also, business entities with a common owner (of more than 20 percent) would be deemed related and an ownership of 80 percent or more would be treated as 100 percent ownership. This type of provision is necessary to avoid having corporate activity split into smaller corporate or non-corporate entities to avoid the new franchise tax.
10
Corporate income tax rates in New Mexico are 4.8% on the first $500,000 of net
(taxable) income, 6.4% on the next $500,000 of net income, and 7.6% on net income over $1
million. In My case study, corporate income tax rates would be reduced over the 2010 – 2013
period. In 2010, the rate on the first $250,000 of net income is reduced to zero. In 2011, the zero
rate extends to $500,000 and the top rate is reduced to 6.9%. In 2012, the rate for net income in
excess of $500,000 is reduced to 5.9%. In 2013, the rate for net income in excess of $500,000 is
reduced to 4.9%. The New Mexico corporate income tax would be repealed for taxable years
beginning on or after January 1, 2014. The new franchise tax amount would be based on a
corporation’s property, payroll and sales (as currently defined for apportionment of corporate
income tax) in excess of a property threshold of $5 million, a payroll threshold of $1.2 million,
and a sales threshold of $9.3 million. The rate of the new corporate franchise tax would be
phased in to maintain revenue neutrality of the proposal. In the first year, 2010, the rate would be
0.04%. In 2011, the rate would be 0.08%, in 2012, 0.14%, and in 2013, 0.17%. Finally, in 2014
and thereafter, with the corporate income tax repealed, the rate would be 0.22%. The tentative
franchise tax (New Mexico property, payroll and sales times the applicable rate for the year)
would be reduced, but not below zero, by the corporation’s (and any related corporations’)
income tax liability for the year.
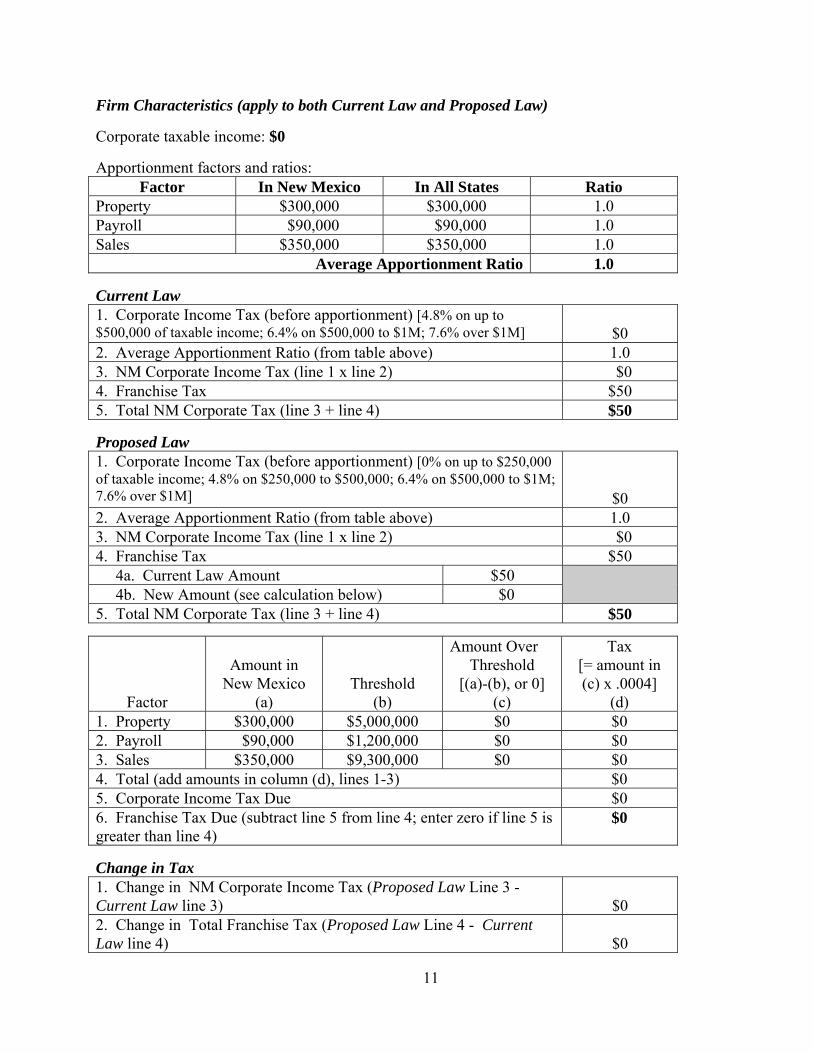
Examples
Below are some examples based on hypothetical firms that are composed based on
information reported on New Mexico corporate income tax returns filed for 2006.
Table 2: Small New Mexico Corporation in 2010
11
Firm Characteristics (apply to both Current Law and Proposed Law)
Corporate taxable income: $0
Apportionment factors and ratios: Factor In New Mexico In All States Ratio
Property $300,000 $300,000 1.0 Payroll $90,000 $90,000 1.0 Sales $350,000 $350,000 1.0
Average Apportionment Ratio 1.0
Current Law 1. Corporate Income Tax (before apportionment) [4.8% on up to $500,000 of taxable income; 6.4% on $500,000 to $1M; 7.6% over $1M]
$0
2. Average Apportionment Ratio (from table above) 1.0 3. NM Corporate Income Tax (line 1 x line 2) $0 4. Franchise Tax $50 5. Total NM Corporate Tax (line 3 + line 4) $50
Proposed Law 1. Corporate Income Tax (before apportionment) [0% on up to $250,000 of taxable income; 4.8% on $250,000 to $500,000; 6.4% on $500,000 to $1M; 7.6% over $1M]
$0 2. Average Apportionment Ratio (from table above) 1.0 3. NM Corporate Income Tax (line 1 x line 2) $0 4. Franchise Tax $50 4a. Current Law Amount $50 4b. New Amount (see calculation below) $0 5. Total NM Corporate Tax (line 3 + line 4) $50
Factor
Amount in
New Mexico (a)
Threshold (b)
Amount Over Threshold
[(a)-(b), or 0] (c)
Tax [= amount in (c) x .0004]
(d) 1. Property $300,000 $5,000,000 $0 $0 2. Payroll $90,000 $1,200,000 $0 $0 3. Sales $350,000 $9,300,000 $0 $0 4. Total (add amounts in column (d), lines 1-3) $0 5. Corporate Income Tax Due $0 6. Franchise Tax Due (subtract line 5 from line 4; enter zero if line 5 is greater than line 4)
$0
Change in Tax 1. Change in NM Corporate Income Tax (Proposed Law Line 3 - Current Law line 3)
$0
2. Change in Total Franchise Tax (Proposed Law Line 4 - Current Law line 4)
$0
12
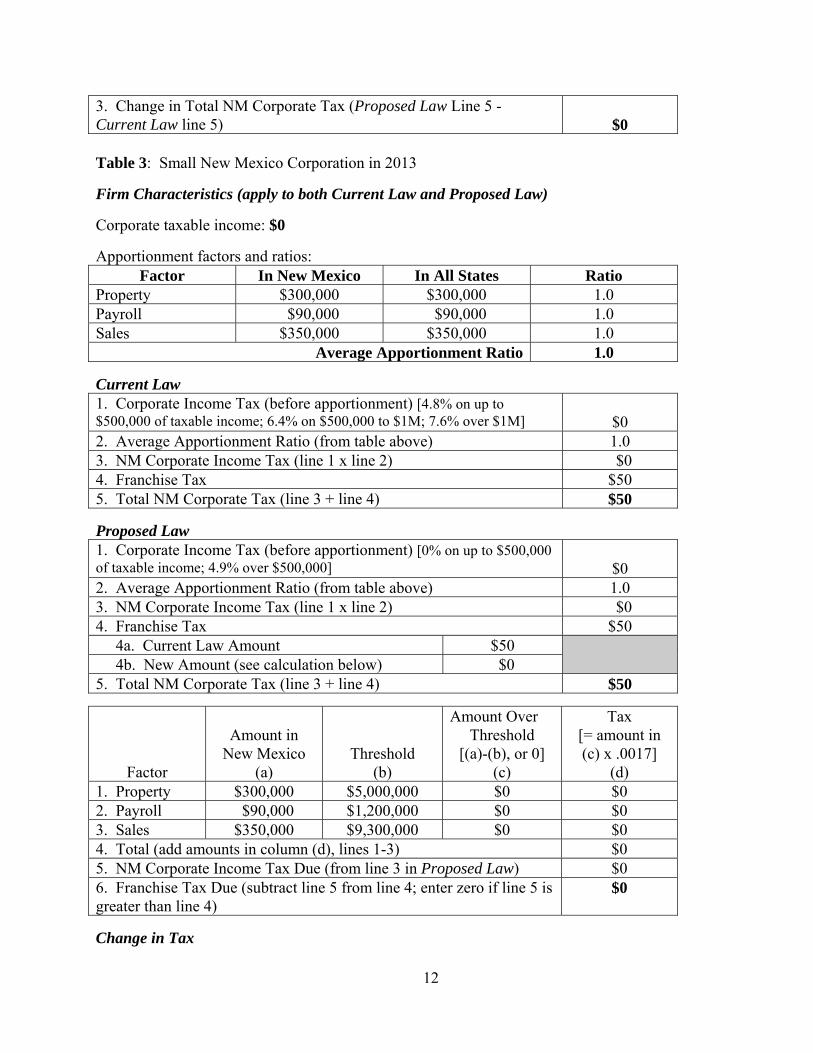
3. Change in Total NM Corporate Tax (Proposed Law Line 5 - Current Law line 5)
$0
Table 3: Small New Mexico Corporation in 2013 Firm Characteristics (apply to both Current Law and Proposed Law)
Corporate taxable income: $0
Apportionment factors and ratios: Factor In New Mexico In All States Ratio
Property $300,000 $300,000 1.0 Payroll $90,000 $90,000 1.0 Sales $350,000 $350,000 1.0
Average Apportionment Ratio 1.0
Current Law 1. Corporate Income Tax (before apportionment) [4.8% on up to $500,000 of taxable income; 6.4% on $500,000 to $1M; 7.6% over $1M]
$0
2. Average Apportionment Ratio (from table above) 1.0 3. NM Corporate Income Tax (line 1 x line 2) $0 4. Franchise Tax $50 5. Total NM Corporate Tax (line 3 + line 4) $50
Proposed Law 1. Corporate Income Tax (before apportionment) [0% on up to $500,000 of taxable income; 4.9% over $500,000]
$0
2. Average Apportionment Ratio (from table above) 1.0 3. NM Corporate Income Tax (line 1 x line 2) $0 4. Franchise Tax $50 4a. Current Law Amount $50 4b. New Amount (see calculation below) $0 5. Total NM Corporate Tax (line 3 + line 4) $50
Factor
Amount in
New Mexico (a)
Threshold (b)
Amount Over Threshold
[(a)-(b), or 0] (c)
Tax [= amount in (c) x .0017]
(d) 1. Property $300,000 $5,000,000 $0 $0 2. Payroll $90,000 $1,200,000 $0 $0 3. Sales $350,000 $9,300,000 $0 $0 4. Total (add amounts in column (d), lines 1-3) $0 5. NM Corporate Income Tax Due (from line 3 in Proposed Law) $0 6. Franchise Tax Due (subtract line 5 from line 4; enter zero if line 5 is greater than line 4)
$0
Change in Tax
13
1. Change in NM Corporate Income Tax (Proposed Law Line 3 - Current Law line 3)
$0
2. Change in Total Franchise Tax (Proposed Law Line 4 - Current Law line 4)
$0
3. Change in Total NM Corporate Tax (Proposed Law Line 5 - Current Law line 5)
$0
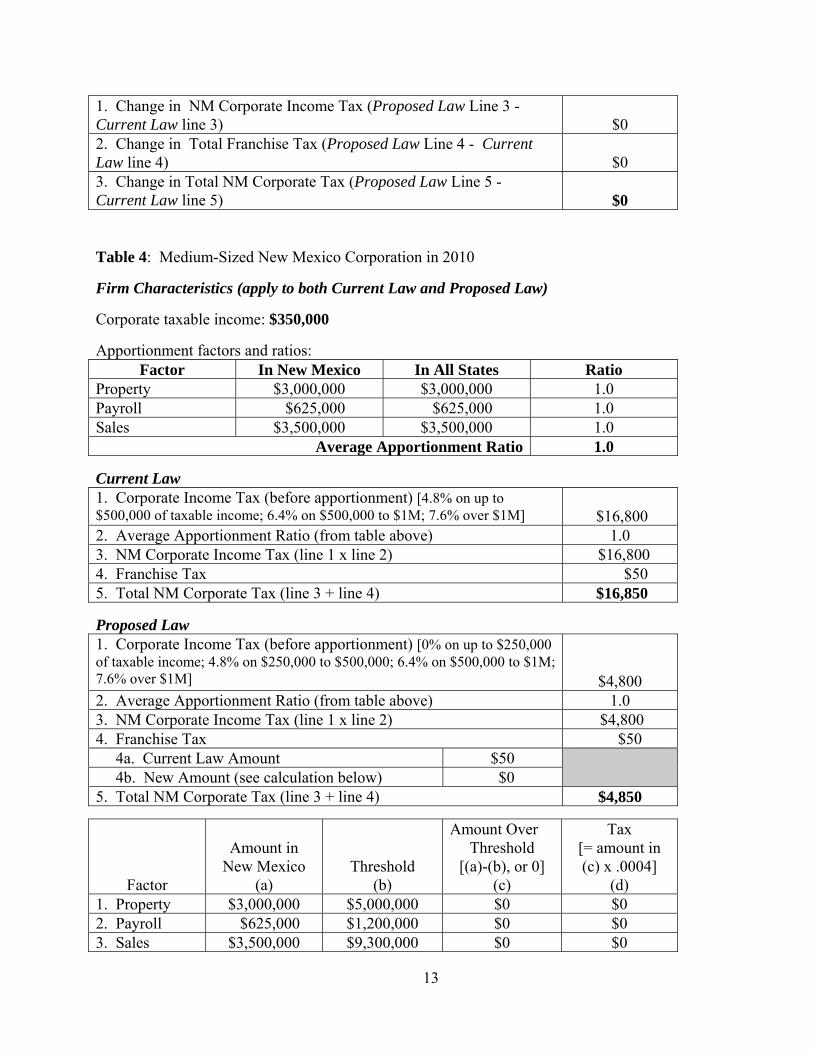
Table 4: Medium-Sized New Mexico Corporation in 2010 Firm Characteristics (apply to both Current Law and Proposed Law)
Corporate taxable income: $350,000
Apportionment factors and ratios: Factor In New Mexico In All States Ratio
Property $3,000,000 $3,000,000 1.0 Payroll $625,000 $625,000 1.0 Sales $3,500,000 $3,500,000 1.0
Average Apportionment Ratio 1.0
Current Law 1. Corporate Income Tax (before apportionment) [4.8% on up to $500,000 of taxable income; 6.4% on $500,000 to $1M; 7.6% over $1M]
$16,800
2. Average Apportionment Ratio (from table above) 1.0 3. NM Corporate Income Tax (line 1 x line 2) $16,800 4. Franchise Tax $50 5. Total NM Corporate Tax (line 3 + line 4) $16,850
Proposed Law 1. Corporate Income Tax (before apportionment) [0% on up to $250,000 of taxable income; 4.8% on $250,000 to $500,000; 6.4% on $500,000 to $1M; 7.6% over $1M]
$4,800 2. Average Apportionment Ratio (from table above) 1.0 3. NM Corporate Income Tax (line 1 x line 2) $4,800 4. Franchise Tax $50 4a. Current Law Amount $50 4b. New Amount (see calculation below) $0 5. Total NM Corporate Tax (line 3 + line 4) $4,850
Factor
Amount in
New Mexico (a)
Threshold (b)
Amount Over Threshold
[(a)-(b), or 0] (c)
Tax [= amount in (c) x .0004]
(d) 1. Property $3,000,000 $5,000,000 $0 $0 2. Payroll $625,000 $1,200,000 $0 $0 3. Sales $3,500,000 $9,300,000 $0 $0
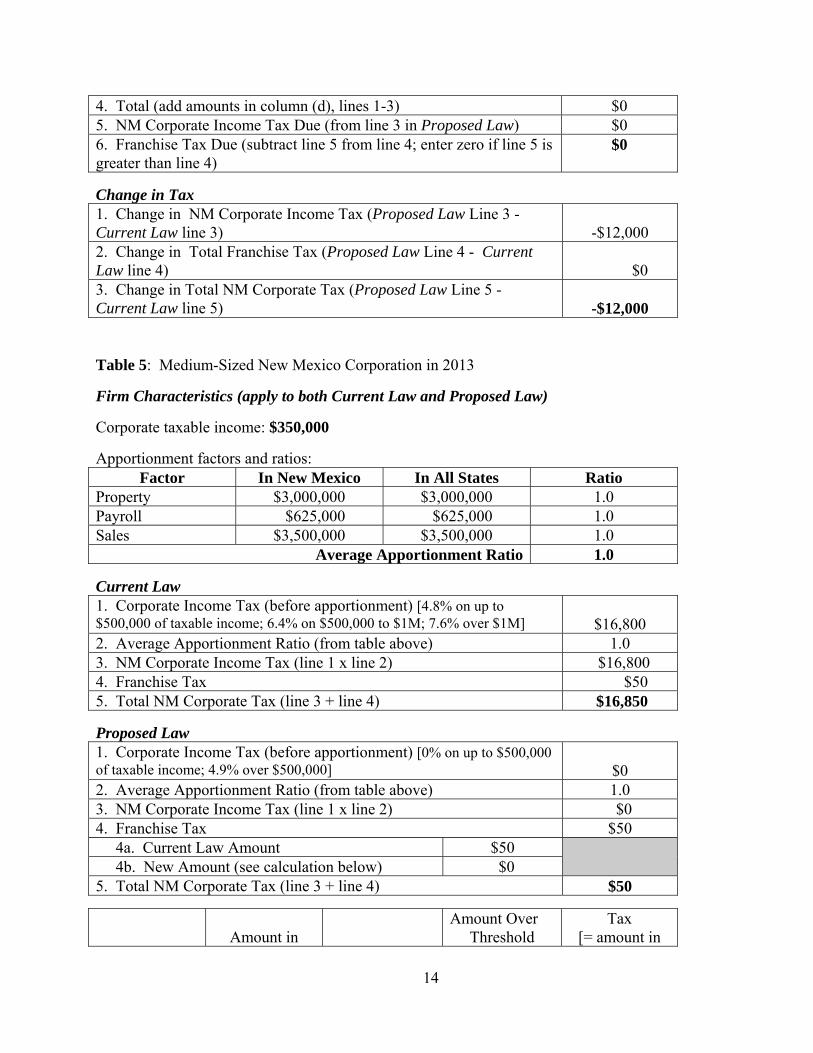
14
4. Total (add amounts in column (d), lines 1-3) $0 5. NM Corporate Income Tax Due (from line 3 in Proposed Law) $0 6. Franchise Tax Due (subtract line 5 from line 4; enter zero if line 5 is greater than line 4)
$0
Change in Tax 1. Change in NM Corporate Income Tax (Proposed Law Line 3 - Current Law line 3)
-$12,000
2. Change in Total Franchise Tax (Proposed Law Line 4 - Current Law line 4)
$0
3. Change in Total NM Corporate Tax (Proposed Law Line 5 - Current Law line 5)
-$12,000
Table 5: Medium-Sized New Mexico Corporation in 2013 Firm Characteristics (apply to both Current Law and Proposed Law)
Corporate taxable income: $350,000
Apportionment factors and ratios: Factor In New Mexico In All States Ratio
Property $3,000,000 $3,000,000 1.0 Payroll $625,000 $625,000 1.0 Sales $3,500,000 $3,500,000 1.0
Average Apportionment Ratio 1.0
Current Law 1. Corporate Income Tax (before apportionment) [4.8% on up to $500,000 of taxable income; 6.4% on $500,000 to $1M; 7.6% over $1M]
$16,800
2. Average Apportionment Ratio (from table above) 1.0 3. NM Corporate Income Tax (line 1 x line 2) $16,800 4. Franchise Tax $50 5. Total NM Corporate Tax (line 3 + line 4) $16,850
Proposed Law 1. Corporate Income Tax (before apportionment) [0% on up to $500,000 of taxable income; 4.9% over $500,000]
$0
2. Average Apportionment Ratio (from table above) 1.0 3. NM Corporate Income Tax (line 1 x line 2) $0 4. Franchise Tax $50 4a. Current Law Amount $50 4b. New Amount (see calculation below) $0 5. Total NM Corporate Tax (line 3 + line 4) $50
Amount in
Amount Over Threshold
Tax [= amount in
15
Factor
New Mexico (a)
Threshold (b)
[(a)-(b), or 0] (c)
(c) x .0017] (d)
1. Property $3,000,000 $5,000,000 $0 $0 2. Payroll $625,000 $1,200,000 $0 $0 3. Sales $3,500,000 $9,300,000 $0 $0 4. Total (add amounts in column (d), lines 1-3) $0 5. NM Corporate Income Tax Due (from line 3 in Proposed Law) $0 6. Franchise Tax Due (subtract line 5 from line 4; enter zero if line 5 is greater than line 4)
$0
Change in Tax 1. Change in NM Corporate Income Tax (Proposed Law Line 3 - Current Law line 3)
-$16,800
2. Change in Total Franchise Tax (Proposed Law Line 4 - Current Law line 4)
$0
3. Change in Total NM Corporate Tax (Proposed Law Line 5 - Current Law line 5)
-$16,800
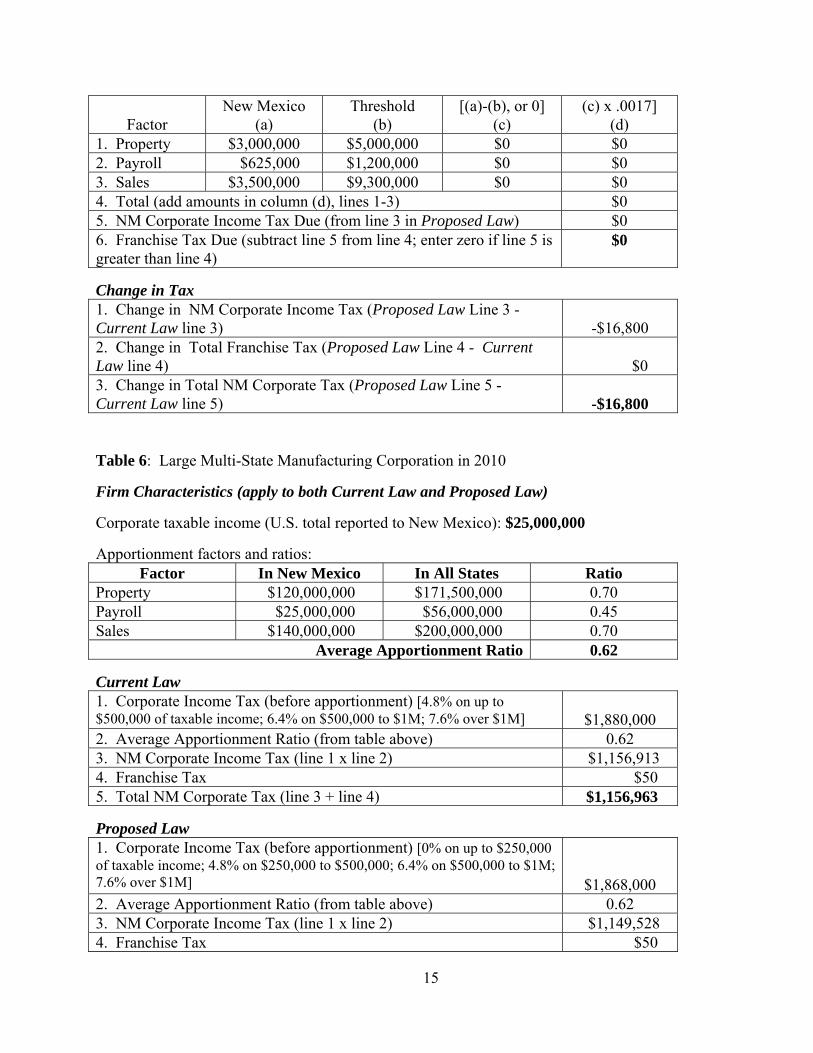
Table 6: Large Multi-State Manufacturing Corporation in 2010 Firm Characteristics (apply to both Current Law and Proposed Law)
Corporate taxable income (U.S. total reported to New Mexico): $25,000,000
Apportionment factors and ratios: Factor In New Mexico In All States Ratio
Property $120,000,000 $171,500,000 0.70 Payroll $25,000,000 $56,000,000 0.45 Sales $140,000,000 $200,000,000 0.70
Average Apportionment Ratio 0.62
Current Law 1. Corporate Income Tax (before apportionment) [4.8% on up to $500,000 of taxable income; 6.4% on $500,000 to $1M; 7.6% over $1M]
$1,880,000
2. Average Apportionment Ratio (from table above) 0.62 3. NM Corporate Income Tax (line 1 x line 2) $1,156,913 4. Franchise Tax $50 5. Total NM Corporate Tax (line 3 + line 4) $1,156,963
Proposed Law 1. Corporate Income Tax (before apportionment) [0% on up to $250,000 of taxable income; 4.8% on $250,000 to $500,000; 6.4% on $500,000 to $1M; 7.6% over $1M]
$1,868,000 2. Average Apportionment Ratio (from table above) 0.62 3. NM Corporate Income Tax (line 1 x line 2) $1,149,528 4. Franchise Tax $50

16
4a. Current Law Amount $50 4b. New Amount (see calculation below) $0 5. Total NM Corporate Tax (line 3 + line 4) $1,149,578
Factor
Amount in
New Mexico (a)
Threshold (b)
Amount Over Threshold
[(a)-(b), or 0] (c)
Tax [= amount in (c) x .0004]
(d) 1. Property $120,000,000 $5,000,000 $115,000,000 $46,000 2. Payroll $25,000,000 $1,200,000 $23,800,000 $9,520 3. Sales $140,000,000 $9,300,000 $130,700,000 $52,280 4. Total (add amounts in column (d), lines 1-3) $107,800 5. NM Corporate Income Tax Due (from line 3 in Proposed Law) $1,149,528 6. Franchise Tax Due (subtract line 5 from line 4; enter zero if line 5 is greater than line 4)
$0
Change in Tax 1. Change in NM Corporate Income Tax (Proposed Law Line 3 - Current Law line 3)
-$7,385
2. Change in Total Franchise Tax (Proposed Law Line 4 - Current Law line 4)
$0
3. Change in Total NM Corporate Tax (Proposed Law Line 5 - Current Law line 5)
-$7,385
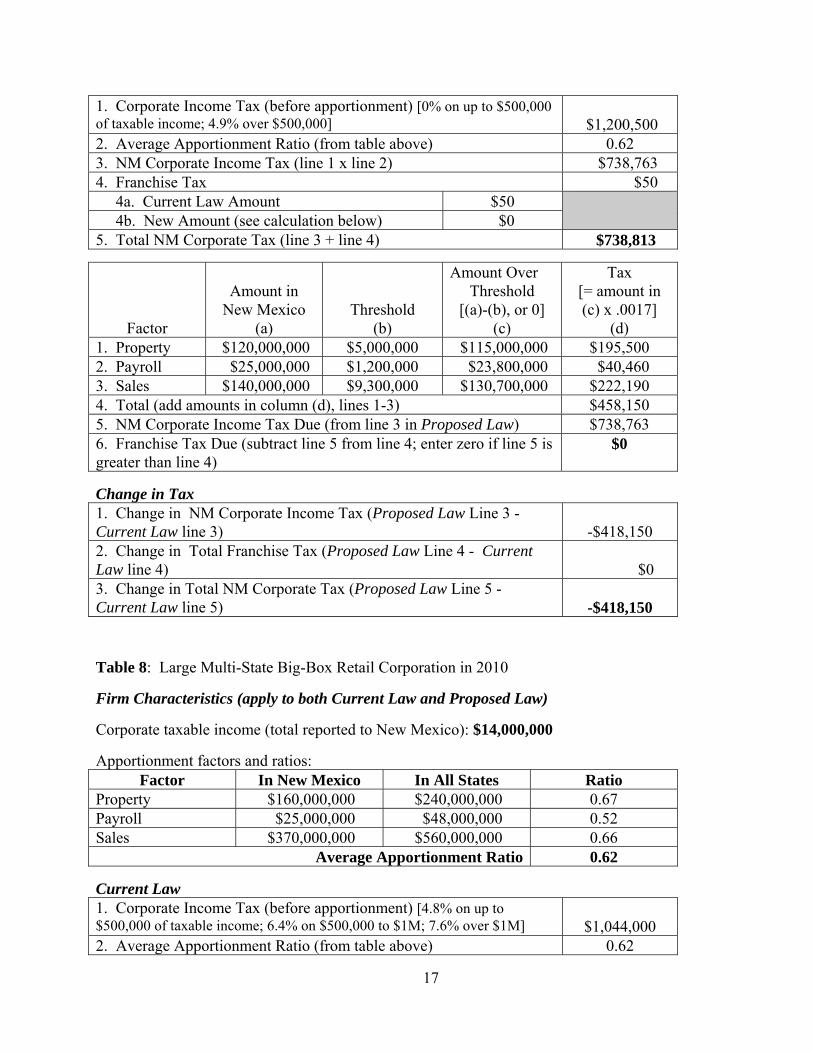
Table 7: Large Multi-State Manufacturing Corporation in 2013 Firm Characteristics (apply to both Current Law and Proposed Law)
Corporate taxable income (total reported to New Mexico): $25,000,000
Apportionment factors and ratios: Factor In New Mexico In All States Ratio
Property $120,000,000 $171,500,000 0.70 Payroll $25,000,000 $56,000,000 0.45 Sales $140,000,000 $200,000,000 0.70
Average Apportionment Ratio 0.62
Current Law 1. Corporate Income Tax (before apportionment) [4.8% on up to $500,000 of taxable income; 6.4% on $500,000 to $1M; 7.6% over $1M]
$1,880,000
2. Average Apportionment Ratio (from table above) 0.62 3. NM Corporate Income Tax (line 1 x line 2) $1,156,913 4. Franchise Tax $50 5. Total NM Corporate Tax (line 3 + line 4) $1,156,963
Proposed Law
17
1. Corporate Income Tax (before apportionment) [0% on up to $500,000 of taxable income; 4.9% over $500,000]
$1,200,500
2. Average Apportionment Ratio (from table above) 0.62 3. NM Corporate Income Tax (line 1 x line 2) $738,763 4. Franchise Tax $50 4a. Current Law Amount $50 4b. New Amount (see calculation below) $0 5. Total NM Corporate Tax (line 3 + line 4) $738,813
Factor
Amount in
New Mexico (a)
Threshold (b)
Amount Over Threshold
[(a)-(b), or 0] (c)
Tax [= amount in (c) x .0017]
(d) 1. Property $120,000,000 $5,000,000 $115,000,000 $195,500 2. Payroll $25,000,000 $1,200,000 $23,800,000 $40,460 3. Sales $140,000,000 $9,300,000 $130,700,000 $222,190 4. Total (add amounts in column (d), lines 1-3) $458,150 5. NM Corporate Income Tax Due (from line 3 in Proposed Law) $738,763 6. Franchise Tax Due (subtract line 5 from line 4; enter zero if line 5 is greater than line 4)
$0
Change in Tax 1. Change in NM Corporate Income Tax (Proposed Law Line 3 - Current Law line 3)
-$418,150
2. Change in Total Franchise Tax (Proposed Law Line 4 - Current Law line 4)
$0
3. Change in Total NM Corporate Tax (Proposed Law Line 5 - Current Law line 5)
-$418,150
Table 8: Large Multi-State Big-Box Retail Corporation in 2010 Firm Characteristics (apply to both Current Law and Proposed Law)
Corporate taxable income (total reported to New Mexico): $14,000,000
Apportionment factors and ratios: Factor In New Mexico In All States Ratio
Property $160,000,000 $240,000,000 0.67 Payroll $25,000,000 $48,000,000 0.52 Sales $370,000,000 $560,000,000 0.66
Average Apportionment Ratio 0.62
Current Law 1. Corporate Income Tax (before apportionment) [4.8% on up to $500,000 of taxable income; 6.4% on $500,000 to $1M; 7.6% over $1M]
$1,044,000
2. Average Apportionment Ratio (from table above) 0.62
18
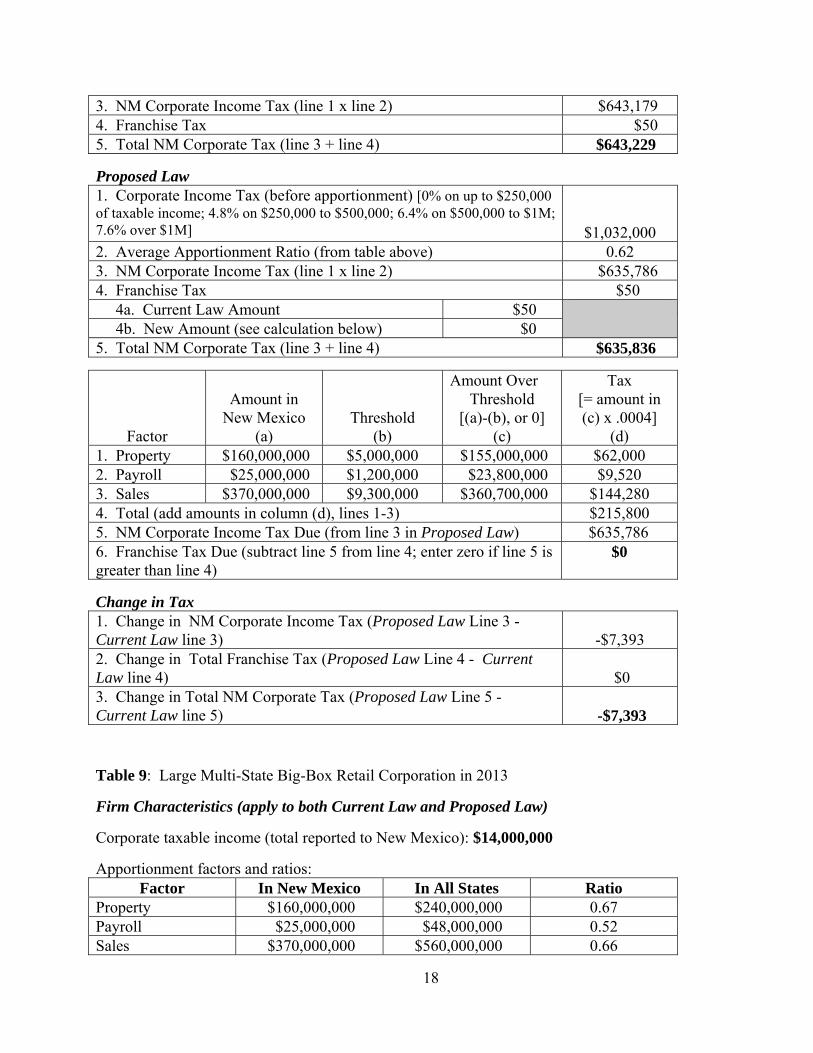
3. NM Corporate Income Tax (line 1 x line 2) $643,179 4. Franchise Tax $50 5. Total NM Corporate Tax (line 3 + line 4) $643,229
Proposed Law 1. Corporate Income Tax (before apportionment) [0% on up to $250,000 of taxable income; 4.8% on $250,000 to $500,000; 6.4% on $500,000 to $1M; 7.6% over $1M]
$1,032,000 2. Average Apportionment Ratio (from table above) 0.62 3. NM Corporate Income Tax (line 1 x line 2) $635,786 4. Franchise Tax $50 4a. Current Law Amount $50 4b. New Amount (see calculation below) $0 5. Total NM Corporate Tax (line 3 + line 4) $635,836
Factor
Amount in
New Mexico (a)
Threshold (b)
Amount Over Threshold
[(a)-(b), or 0] (c)
Tax [= amount in (c) x .0004]
(d) 1. Property $160,000,000 $5,000,000 $155,000,000 $62,000 2. Payroll $25,000,000 $1,200,000 $23,800,000 $9,520 3. Sales $370,000,000 $9,300,000 $360,700,000 $144,280 4. Total (add amounts in column (d), lines 1-3) $215,800 5. NM Corporate Income Tax Due (from line 3 in Proposed Law) $635,786 6. Franchise Tax Due (subtract line 5 from line 4; enter zero if line 5 is greater than line 4)
$0
Change in Tax 1. Change in NM Corporate Income Tax (Proposed Law Line 3 - Current Law line 3)
-$7,393
2. Change in Total Franchise Tax (Proposed Law Line 4 - Current Law line 4)
$0
3. Change in Total NM Corporate Tax (Proposed Law Line 5 - Current Law line 5)
-$7,393
Table 9: Large Multi-State Big-Box Retail Corporation in 2013 Firm Characteristics (apply to both Current Law and Proposed Law)
Corporate taxable income (total reported to New Mexico): $14,000,000
Apportionment factors and ratios: Factor In New Mexico In All States Ratio
Property $160,000,000 $240,000,000 0.67 Payroll $25,000,000 $48,000,000 0.52 Sales $370,000,000 $560,000,000 0.66

19
Average Apportionment Ratio 0.62
Current Law 1. Corporate Income Tax (before apportionment) [4.8% on up to $500,000 of taxable income; 6.4% on $500,000 to $1M; 7.6% over $1M]
$1,044,000
2. Average Apportionment Ratio (from table above) 0.62 3. NM Corporate Income Tax (line 1 x line 2) $643,179 4. Franchise Tax $50 5. Total NM Corporate Tax (line 3 + line 4) $643,229
Proposed Law 1. Corporate Income Tax (before apportionment) [0% on up to $500,000 of taxable income; 4.9% over $500,000]
$661,500
2. Average Apportionment Ratio (from table above) 0.62 3. NM Corporate Income Tax (line 1 x line 2) $407,531 4. Franchise Tax $509,619 4a. Current Law Amount $50 4b. New Amount (see calculation below) $509,619 5. Total NM Corporate Tax (line 3 + line 4) $917,150
Factor
Amount in
New Mexico (a)
Threshold (b)
Amount Over Threshold
[(a)-(b), or 0] (c)
Tax [= amount in (c) x .0017]
(d) 1. Property $160,000,000 $5,000,000 $155,000,000 $263,500 2. Payroll $25,000,000 $1,200,000 $23,800,000 $40,460 3. Sales $370,000,000 $9,300,000 $360,700,000 $613,190 4. Total (add amounts in column (d), lines 1-3) $917,150 5. NM Corporate Income Tax Due (from line 3 in Proposed Law) $407,531 6. Franchise Tax Due (subtract line 5 from line 4; enter zero if line 5 is greater than line 4)
$509,619
Change in Tax 1. Change in NM Corporate Income Tax (Proposed Law Line 3 - Current Law line 3)
-$235,648
2. Change in Total Franchise Tax (Proposed Law Line 4 - Current Law line 4)
$509,569
3. Change in Total NM Corporate Tax (Proposed Law Line 5 - Current Law line 5)
$273,921
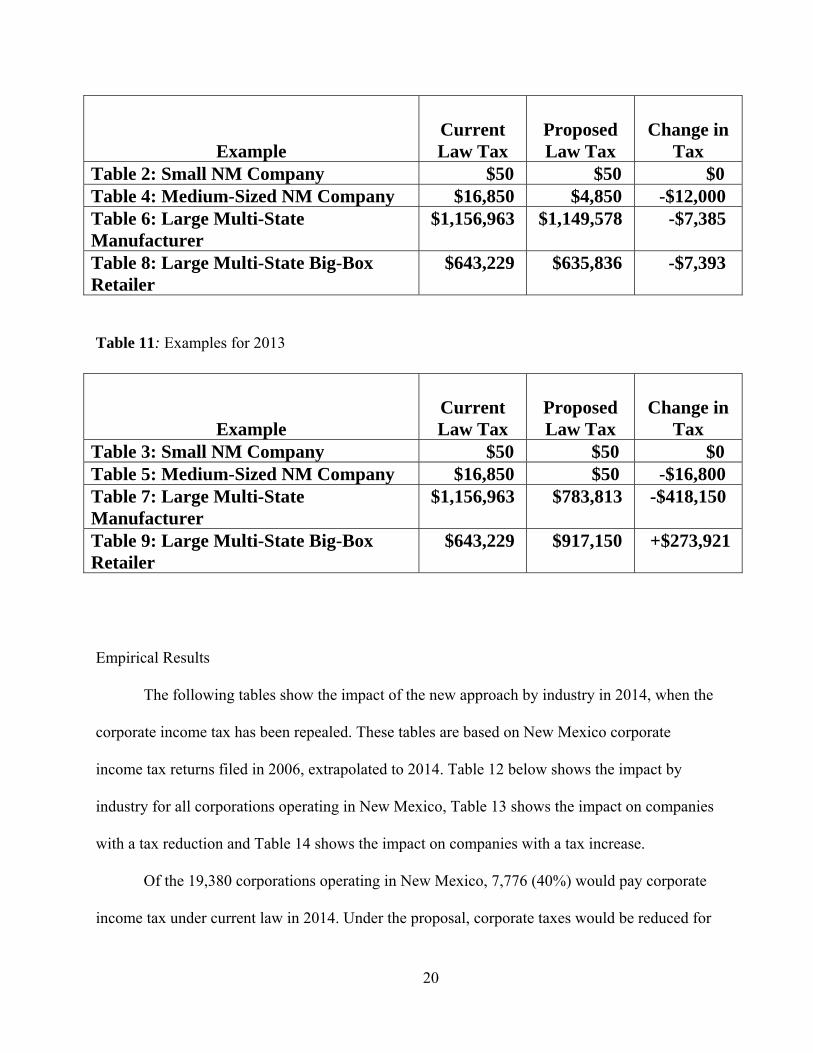
Summary of the Examples Table 10: Examples for 2010
20
Example Current Law Tax
Proposed Law Tax
Change in Tax
Table 2: Small NM Company $50 $50 $0 Table 4: Medium-Sized NM Company $16,850 $4,850 -$12,000 Table 6: Large Multi-State Manufacturer
$1,156,963 $1,149,578 -$7,385
Table 8: Large Multi-State Big-Box Retailer
$643,229 $635,836 -$7,393
Table 11: Examples for 2013
Example Current Law Tax
Proposed Law Tax
Change in Tax
Table 3: Small NM Company $50 $50 $0 Table 5: Medium-Sized NM Company $16,850 $50 -$16,800 Table 7: Large Multi-State Manufacturer
$1,156,963 $783,813 -$418,150
Table 9: Large Multi-State Big-Box Retailer
$643,229 $917,150 +$273,921
Empirical Results The following tables show the impact of the new approach by industry in 2014, when the
corporate income tax has been repealed. These tables are based on New Mexico corporate
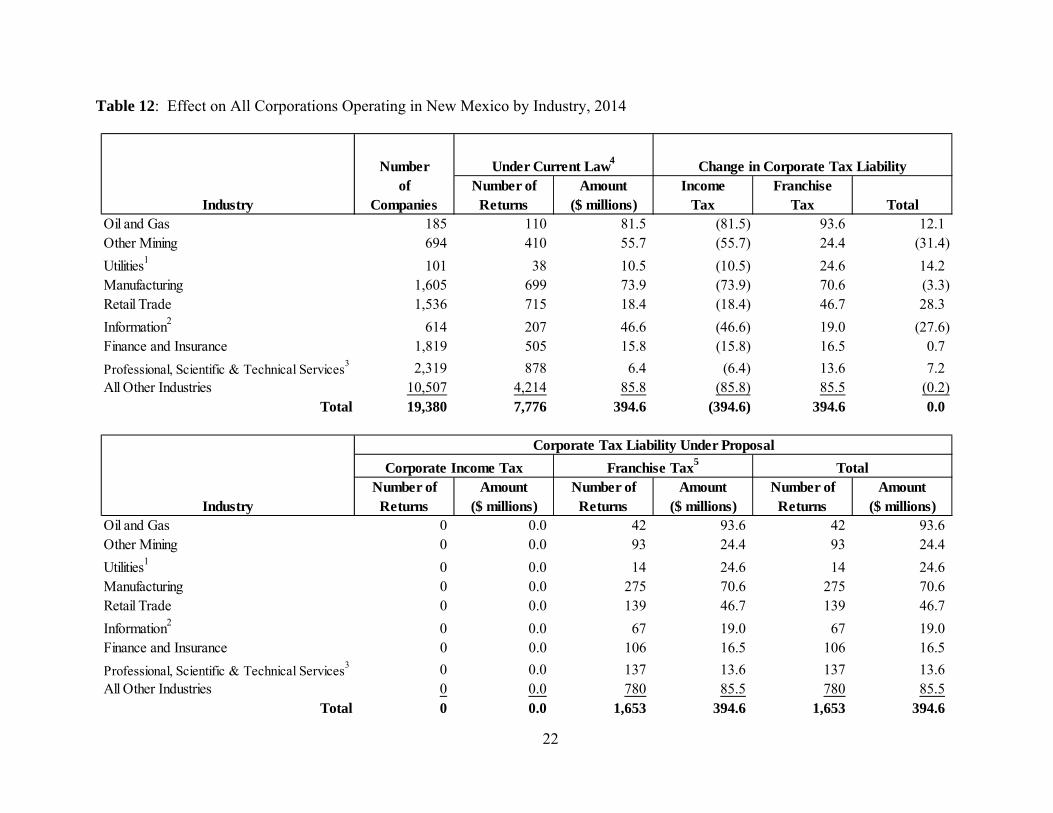
income tax returns filed in 2006, extrapolated to 2014. Table 12 below shows the impact by
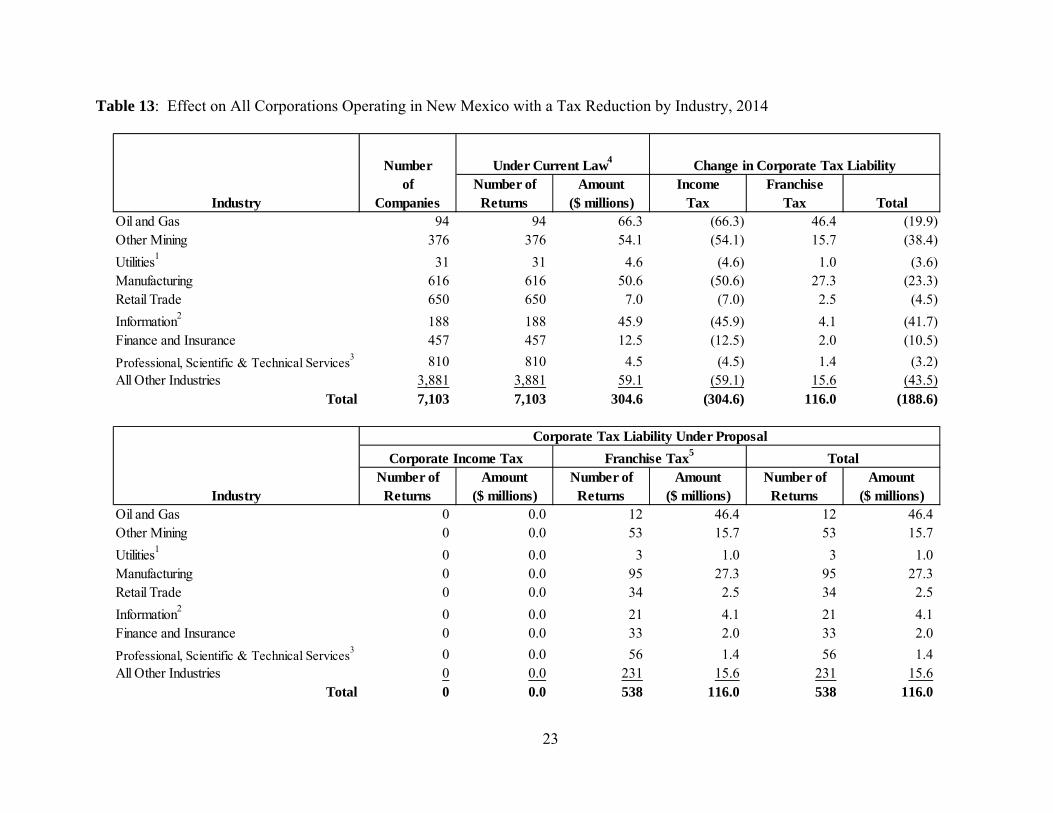
industry for all corporations operating in New Mexico, Table 13 shows the impact on companies
with a tax reduction and Table 14 shows the impact on companies with a tax increase.
Of the 19,380 corporations operating in New Mexico, 7,776 (40%) would pay corporate
income tax under current law in 2014. Under the proposal, corporate taxes would be reduced for
21
7,103 corporations, over 91% of all corporations that would pay corporate income tax under
current law in 2014. The new franchise tax would apply only to 1,653 very large corporations.
Nearly one-third of these corporations (538) would still have a net tax reduction because their
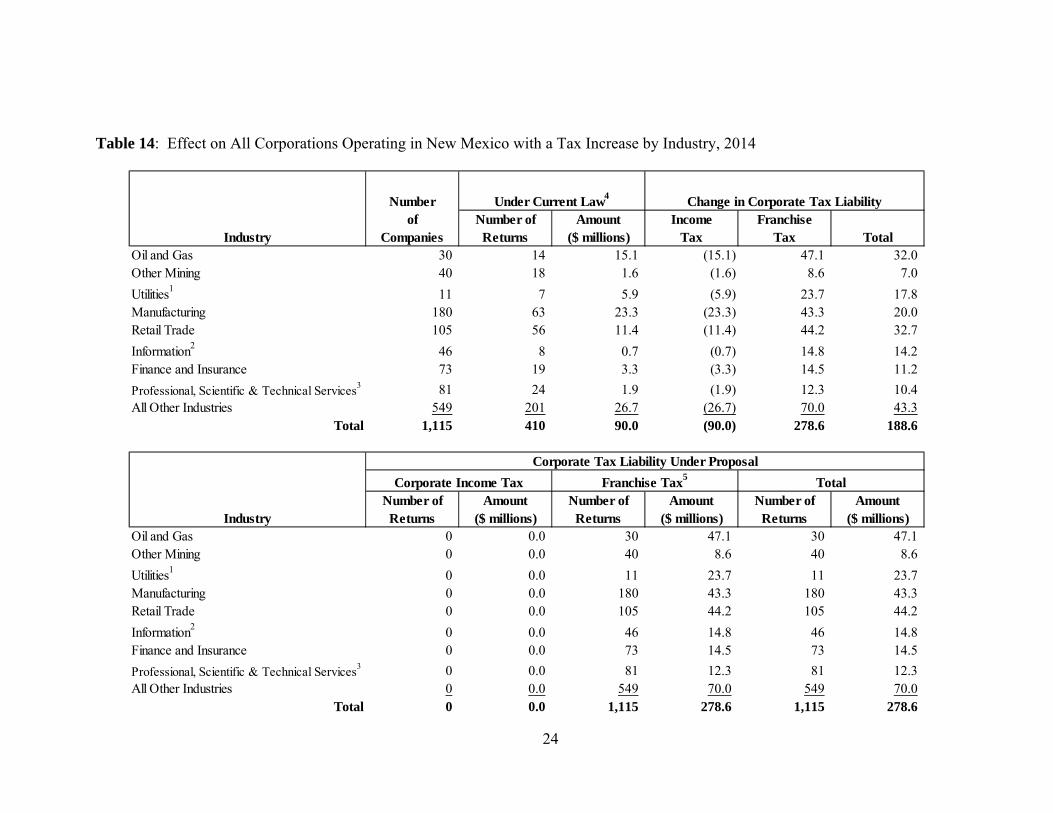
corporate income tax reduction is larger than their franchise tax. The remaining 1,115
corporations paying the new franchise tax would have net tax increases. Only 410, or about one-
22
Table 12: Effect on All Corporations Operating in New Mexico by Industry, 2014
Numberof Number of Amount Income Franchise
Industry Companies Returns ($ millions) Tax Tax TotalOil and Gas 185 110 81.5 (81.5) 93.6 12.1Other Mining 694 410 55.7 (55.7) 24.4 (31.4)
Utilities1 101 38 10.5 (10.5) 24.6 14.2Manufacturing 1,605 699 73.9 (73.9) 70.6 (3.3)Retail Trade 1,536 715 18.4 (18.4) 46.7 28.3
Information2 614 207 46.6 (46.6) 19.0 (27.6)Finance and Insurance 1,819 505 15.8 (15.8) 16.5 0.7
Professional, Scientific & Technical Services3 2,319 878 6.4 (6.4) 13.6 7.2
All Other Industries 10,507 4,214 85.8 (85.8) 85.5 (0.2)Total 19,380 7,776 394.6 (394.6) 394.6 0.0
Number of Amount Number of Amount Number of AmountIndustry Returns ($ millions) Returns ($ millions) Returns ($ millions)
Oil and Gas 0 0.0 42 93.6 42 93.6Other Mining 0 0.0 93 24.4 93 24.4
Utilities1 0 0.0 14 24.6 14 24.6Manufacturing 0 0.0 275 70.6 275 70.6Retail Trade 0 0.0 139 46.7 139 46.7
Information2 0 0.0 67 19.0 67 19.0Finance and Insurance 0 0.0 106 16.5 106 16.5
Professional, Scientific & Technical Services3 0 0.0 137 13.6 137 13.6
All Other Industries 0 0.0 780 85.5 780 85.5Total 0 0.0 1,653 394.6 1,653 394.6
Under Current Law4 Change in Corporate Tax Liability
Corporate Tax Liability Under Proposal
Corporate Income Tax Franchise Tax5 Total
23
Table 13: Effect on All Corporations Operating in New Mexico with a Tax Reduction by Industry, 2014
Numberof Number of Amount Income Franchise
Industry Companies Returns ($ millions) Tax Tax TotalOil and Gas 94 94 66.3 (66.3) 46.4 (19.9)Other Mining 376 376 54.1 (54.1) 15.7 (38.4)
Utilities1 31 31 4.6 (4.6) 1.0 (3.6)Manufacturing 616 616 50.6 (50.6) 27.3 (23.3)Retail Trade 650 650 7.0 (7.0) 2.5 (4.5)
Information2 188 188 45.9 (45.9) 4.1 (41.7)Finance and Insurance 457 457 12.5 (12.5) 2.0 (10.5)
Professional, Scientific & Technical Services3 810 810 4.5 (4.5) 1.4 (3.2)
All Other Industries 3,881 3,881 59.1 (59.1) 15.6 (43.5)Total 7,103 7,103 304.6 (304.6) 116.0 (188.6)
Number of Amount Number of Amount Number of AmountIndustry Returns ($ millions) Returns ($ millions) Returns ($ millions)
Oil and Gas 0 0.0 12 46.4 12 46.4Other Mining 0 0.0 53 15.7 53 15.7
Utilities1 0 0.0 3 1.0 3 1.0Manufacturing 0 0.0 95 27.3 95 27.3Retail Trade 0 0.0 34 2.5 34 2.5
Information2 0 0.0 21 4.1 21 4.1Finance and Insurance 0 0.0 33 2.0 33 2.0
Professional, Scientific & Technical Services3 0 0.0 56 1.4 56 1.4
All Other Industries 0 0.0 231 15.6 231 15.6Total 0 0.0 538 116.0 538 116.0
Corporate Tax Liability Under Proposal
Corporate Income Tax Franchise Tax5 Total
Under Current Law4 Change in Corporate Tax Liability
24
Table 14: Effect on All Corporations Operating in New Mexico with a Tax Increase by Industry, 2014
Numberof Number of Amount Income Franchise
Industry Companies Returns ($ millions) Tax Tax TotalOil and Gas 30 14 15.1 (15.1) 47.1 32.0Other Mining 40 18 1.6 (1.6) 8.6 7.0
Utilities1 11 7 5.9 (5.9) 23.7 17.8Manufacturing 180 63 23.3 (23.3) 43.3 20.0Retail Trade 105 56 11.4 (11.4) 44.2 32.7
Information2 46 8 0.7 (0.7) 14.8 14.2Finance and Insurance 73 19 3.3 (3.3) 14.5 11.2
Professional, Scientific & Technical Services3 81 24 1.9 (1.9) 12.3 10.4All Other Industries 549 201 26.7 (26.7) 70.0 43.3
Total 1,115 410 90.0 (90.0) 278.6 188.6
Number of Amount Number of Amount Number of AmountIndustry Returns ($ millions) Returns ($ millions) Returns ($ millions)
Oil and Gas 0 0.0 30 47.1 30 47.1Other Mining 0 0.0 40 8.6 40 8.6
Utilities1 0 0.0 11 23.7 11 23.7Manufacturing 0 0.0 180 43.3 180 43.3Retail Trade 0 0.0 105 44.2 105 44.2
Information2 0 0.0 46 14.8 46 14.8Finance and Insurance 0 0.0 73 14.5 73 14.5
Professional, Scientific & Technical Services3 0 0.0 81 12.3 81 12.3All Other Industries 0 0.0 549 70.0 549 70.0
Total 0 0.0 1,115 278.6 1,115 278.6
Corporate Tax Liability Under Proposal
Corporate Income Tax Franchise Tax5 Total
Under Current Law4 Change in Corporate Tax Liability

25
Notes for Tables 11 –13:
1 Utilities include electrical generation, electrical transmission, natural gas distribution and water supply. 2 Information includes telecommunications (telephone, mobile phone, internet providers, cable and satellite), radio and television broadcasting and newspaper and magazine publishing. 3 Professional services include legal services, architectural services, accounting and business consulting; scientific and technical services include research, computer hardware and software services, and repair services for appliances and technical equipment. 4 Corporate income tax liability before credits. Excludes current $50 franchise tax. 5 Franchise Tax Thresholds: $5 Million for Property, $1.2 Million for Payroll and $9.3 Million for Sales; Franchise Tax Rate in 2014 is 0.0022 (0.22%).
third, of these corporations would pay corporate income tax under current law. By industry,
retail Trade would have the largest tax increase, followed by utilities and oil and gas; other
mining would have the largest tax reduction, followed by information.
Figure 1: Effective Property Tax Rate for Franchise Tax Payers in New Mexico for the year 2014 (based on 2006 data)
0
0 .005
0 .01
0 .015
0 .02
0 200 400 600 800 1000 1200 1400
Effective Property Rate for Franchise Tax Payers
No. of Corporations
Rate
No. of Corporations
Rate
26
Figure 2: Effective Wage Tax Rate for Franchise Tax Payers in New Mexico for the year 2014 (based on 2006 data)
0
0.005
0.01
0.015
0.02
0 200 400 600 800 1000 1200 1400
Effective Wage Rate for Franchise Tax Payers
No. of Corporations
Rate
No. of Corporations
Rate
Figure 3: Effective Sales Tax Rate for Franchise Tax Payers in New Mexico for the year 2014 (based on 2006 data)
0
0 .005
0 .01
0 .015
0 .02
0 200 400 600 800 1000 1200 1400
Effective Sales Rate for Franchise Tax Payers
No. of Corporations
Rate
No. of Corporations
Rate
The previous discussion of McLure’s analysis indicated that there is significant variation
in the effective tax rate on each apportionment factor under current corporate income taxes. This
variation is illustrated in the scatter plots in figures 1 - 3, which show the effective rate on each
27
factor in New Mexico for large corporations. Note that New Mexico uses even weights for all
three factors, with the exception that manufacturers can elect to use a double-weighted sales
factor. The dashed line in each scatter plot is the (uniform) franchise tax rate (.22%) that would
apply in 2014.
Thus, I argue that replacing the state corporate income tax with a factor-based franchise
tax would significantly improve state taxation of corporations. The proposed change would
remove the distortions inherent in the current corporate income tax, including the highly uneven
effective rates on apportionment factors, and reasonably relate corporate tax liabilities to benefits
received. The compliance cost of the new franchise tax would also be an order of magnitude less
than the corporate income tax, in part because the franchise tax thresholds would remove from
tax smaller corporations, which have disproportionate current compliance costs. The factor-
based franchise tax would have a much more stable base, helping to remove uncertainty from
budget forecasting and decision making.
28
Chapter 2
Benefits and Drawbacks
During the first half of the twentieth century the states used a wide variety of formulas to
apportion business income tax. States strove to uncover a formula that would reflect the
geographic source of the income, while fairly dividing income among the states. With time,
states adopted the standard practice of using a formula with three, equally weighted factors of
property, payroll, and sales. Eventually, a consensus emerged that supported the widespread
adoption of the equally-weighted, three-factor formula. The formula captured the traditional
understanding of "sourcing" in the weight accorded to capital (property) and labor (payroll),
while also reflecting an equitable claim of the "market" state to a share of the income tax base, as
determined by sales transacted in the state. In 1957 the National Conference of Commissioners
on Uniform State Laws (NCCUSL) approved a model law which provided the foundation for
uniform state taxation of corporate income and was called the Uniform Division of Income for
Tax Purposes Act (UDITPA). Incorporated into the Multistate Tax Compact, UDITPA codified
the generally accepted equally weighted three-factor formula. For the formula in the previous
section, UDITPA can also be applied to its three factors.
Adopting the franchise tax is a way to develop a stable source of revenue tied to
corporate income and thus, reduce fluctuations in budget forecasting and decision making. Once
adopted, barring changes to the franchise tax’s thresholds or rates, revenue generated from the
franchise tax would increase in proportion to increases in the three factors of corporations paying
the tax.
29
While smoothing out year-over-year corporate income tax collections, the franchise tax
also has the ability to increase revenues without adversely affecting smaller companies. Once
established, the franchise tax can generate more state revenue by implementing only minimal
rate increases. Another way to increase revenue year-over-year using the franchise tax is to hold
constant threshold levels. When the franchise tax is adopted, if thresholds are mandated to be
held constant in future years, then this can serve as a way to increase revenues without passing
future tax legislation..
The following sections compare and contrast corporate income tax with the new
franchise tax using the principles of good tax policy as well as other criteria.
Economic Growth and Efficiency The general ideal here is that a tax system should not impede or reduce the growth of the
economy. In Johansson’s, et. al., (2008) international study focusing on the effect of tax structure
on productivity and growth, corporate taxes were determined to be the most harmful for growth.
In particular, lowering the corporate tax rate seems to be particularly stimulating for the total
factor production growth of more innovative and dynamic firms. Djankov et. al. (2008) review
the economic performance of 85 countries in light of corporate taxes. Their findings suggest
―The effective corporate tax rate has a negative effect on entrepreneurial activity, aggregate
investment, as well as foreign direct investment. George Zodrow (1999) notices as he critically
reviews state and local taxes that specifically, for a corporation that has most of all of its
operations within a state, a state income tax (that is based on the federal tax) increases the total
30
effective corporate tax rate applied to income generated by the corporation. The distortions of
the state corporate tax thus simply compound the distortions of the federal tax.
However in the case of franchise taxes, efficiency is higher than corporate income taxes
due to several reasons: (1) franchise tax is based more on benefits received (through the use of
factors) and not as uneven as a corporate tax, (2) franchise tax rates tend to be lower than
corporate income tax rates for the same amount of revenue raised due to higher factor bases used
instead of profits, (3) it causes less distortion due to lower compliance costs on smaller firms
especially the ones below the factor thresholds, (4) even for larger corporations the dead-weight
losses are lower, (5) franchise taxes are inherently simple and simpler to administer resulting in
lower dead-weight losses also, and (6) they give the smaller firms the ability to pay lower taxes
till they are well established and become large enough to fall under the higher franchise tax rate
scheme based on the size of their factors.
Neutrality Corporate income taxes may violate the principle of tax neutrality in multiple ways. First,
they can affect corporate leadership decisions on how much to save given that they are placed on
income from capital. Therefore, they can play a deciding role in determining overall capital
investment and economic growth. Second, a corporate income tax often influences decision-
makers on how to organize and structure their businesses, given that the tax is often imposed on
only certain types of business profits. This skews investment and production towards those
business structures which are not obligated to pay corporate income tax. In the United States the
business profits of partnerships and sole proprietorships are often untaxed, while those of
31
corporations with shareholders are taxed. Third, it favors debt over equity as a corporate
financing tool, given that it is not imposed on the return to debt-financed investments, but rather
on income from equity-financed investments. Fourth, because a corporation is legally viewed as
a separate taxable entity from which shareholders receive income dividends, there is a biased
towards capital gains over dividends given its favorable treatment under the individual income
tax. Fifth, investment and production are biased towards more lightly taxed assets and sectors in
light of the fact that the United States imposes different effective rates on different assets and
industries as well as bases its depreciation schedules not necessarily on economic depreciation.
Lastly, the corporate income tax can have a distortive effect on corporate resource allocation by
costly tax compliance work and by adding additional attention to tax planning. However, in case
of the proposed franchise taxes, all businesses are taxed whether they are a corporation or not.
Also, related entities’ apportionment factors are combined for the purposes of imposing franchise
taxes. Business and non-business income is not treated differently in case of franchise taxes.
Neither does debt on equity considerations play a role in determining the franchise tax burden.
Also, different assets are not taxes differently in this proposal as generally are in the case of
corporate income taxes. Hence in general, franchise taxes are far more neutral than corporate
income taxes.
Equity and Fairness The general idea is that similarly situated taxpayers should be taxed similarly. Corporate
franchise taxes are more equitable and fair as they do not have as many provisions to influence
decisions as in the case of corporate income taxes. There are also significant economic distortions
32
in the current federal corporate income tax base. Most important among these distortions are
provisions that result in mistiming of deductions and income, which generally result in an
understatement of net income. The largest of these mistiming provisions are those for
accelerated forms of cost recovery for investments, including the “bonus depreciation”
provisions of the 2008 and 2009 stimulus bills. In addition to understating certain types of
income, these provisions also differentially reduce the effective tax rate on alternative forms of
investment, distorting investment choices. Another important economic distortion in the current
federal income tax is the deduction for domestic production activities, which favors certain
activities over others, distorting business decisions. All tax payers with similar apportionment
factors are taxed similarly.
Stability of Revenues Considered both volatile and somewhat unpredictable, state corporate income tax revenues
add uncertainty to state budgeting. Also, state corporate income taxes are “pro-cyclical” and hence,
in downturns further intensify declines in state revenues. According to GAO (2004), there has been
an increase in large United States corporations reporting no tax liability; in 1995, 32.7 percent of
these corporations reported no tax liability and in 2000 45.3 percent reported no tax liability. In the
year ending June 2009 corporate income tax revenues dropped 12.2% nationally, after experiencing
a drop of 7.3% in the year ending June 2008; this marks a cumulative decline of 19.7%., after
experiencing a surge of 15.4% in the year ending in June 2007. Auerbach (1984) notes that over the
past thirty years, corporate income tax revenues have steadily decreased as a fraction of U.S. GNP.
Auerbach comments that "one reason for the decline in corporate tax collections since 1953 has been
a decline in corporate profitability. Another has been the reduction (from 52 percent to 46 percent) in
33
the corporate tax rate. However, the most important factor has been the introduction of several
investment incentives …" In 2009, Gupta, et. al. note a similar negative trend in total state CIT
collections relative to total state taxes from 1982 until 2002. Fox et. al. (2007) comment that as a
share of profits, CIT revenues are declining.
One of the key arguments in favor of a franchise tax is that the factor-based franchise tax
would have a much more stable base, helping to remove uncertainty from budget forecasting and
decision making. Since, historically the factors of the firms do not fluctuate as much as profits,
the franchise taxes tend to be much more stable and much less volatile compared to state
corporate income taxes.
Simplicity, Ease of Administration According to the Minnesota Department of Revenue, corporate income tax is costly to
administer and is considered one of the most expensive tax programs to administer. For the same
level of collected revenue the cost of administering the program is twice as expensive. According to
the department, for a near peak revenue fiscal year the administrative costs within the Revenue
Department were 1.5¢ per dollar of CIT revenue. However, this sum does not account for all of the
administrative burden that the tax imposes on the government as well as the business. Additionally,
there is significant compliance, judicial, legal and other administrative costs tied to imposing this tax
on involved parties. Businesses are typically part of a large number of related entities that may
have multiple transactions among them, including sales, asset transfers, cost sharing
arrangements, charges for services, and royalties for the use of intangibles. The number and
complexity of these transactions make the determination of the income attributable to each state
very difficult, giving rise to the multiple state income tax provisions that attempt to properly

34
match the income and expenses of a multi-state corporation to the activities in a state. These
provisions include mandatory combined reporting; authority to reallocate income, deductions,
and other items between related entities; “add-back” and “anti-passive investment company”
legislation; minimum taxes; and significant franchise taxes.
Franchise taxes are much simpler and easier to administer since they rely on the factors
instead of profits. They also do not have as many provisions and differential treatments of capital,
income etc. as in the case of corporate income taxes and do not inherently allow for as many tax
planning strategies.
Compliance Federal corporate income tax is considered to be complicated for businesses. Largely,
following federal tax design, state provisions often further complicate the filings for businesses.
Brunori (2002, p. 47) comments that the state corporate income taxes “consume an inordinate
amount of intellectual firepower and economic resources in terms of planning, compliance, and
administration.” The imposition of the tax adds significantly to compliance and litigation costs for
both businesses and state tax departments. Slemrod and Blumenthal estimated that average state
corporate income tax compliance costs in 1993 accounted for 30.5% of total compliance costs for
large (Fortune 500) corporations, or roughly, $0.64 of $2.11 million in compliance costs. If I adjust
for CPI, today state compliance costs would average almost $1 million, or for all corporate income
tax states roughly $21,000 per state.
The franchise tax thresholds remove tax from smaller firms that would incur disproportionate
compliance costs and greatly reduce compliance costs for large firms as they are taxed directly based
on apportionment factors.
35
Transparency and Visibility Similar to other types of business taxes, corporate income tax lacks transparency. It is
primarily passed onto people and in particular, employees and consumers. From a political
perspective, the very lack of transparency is often attractive to policy makers, given that particular
constituent groups are not singled out and anti-corporate rhetoric supports business taxation,
regardless of the realistic tax incidence. However, lack of transparency and visibility is considered
bad tax policy. The proposed franchise tax system is an inherently simpler system allowing it to be
far more transparent than the current state and federal corporate income tax design.
Tax Shelters Companies maintain two different sets of books, one for reporting to shareholders and
one for corporate purposes (Desai, 2005). Graetz (2007) states that corporate tax-shelter
deductions, credits, and losses reduce tax liability without reducing the income reported. In this
way, tax shelters give a company the best of both worlds as lower taxes are paid to the
government while higher profits are reported to shareholders.
To the degree that the franchise tax does not provide for differential tax treatment and enhances
the consistency between book and tax accounting, it further supports the use of this tax form
over a corporate income tax.
Double-taxation

36
As a rule, state corporate income taxes follow the federal corporate income tax’s design
and provisions. The federal corporate income tax is distinct from the federal individual income
tax. As a result, corporate income is taxed twice. First, it is taxed at the corporate level, where it
is earned. Then, it is taxed at the individual shareholder level when it is distributed after-tax as
dividends or realized as capital gains on the sale of shares.
Three notable economic effects occur as a result of this “double tax” design. First, as
previously mentioned, the imposition of corporate income tax encourages businesses to become
partnerships, LLCs and other non-corporate businesses over corporations, given that the former
are taxed once, while the latter is taxed twice.. Second, a corporate income tax encourages
corporations not to distribute income, given that undistributed corporate income is taxed at a
lower rate than distributed corporate income. Lastly, the tax rate on corporate income tax is
higher on corporate income (the return to equity holders) in most cases than it is on the interest
on loans (the return to lenders, some of which are tax exempt) and hence, corporate income tax
favors financing decision-making towards debt and away from equity. One of the most
significant distortions that often occur as a result of particular corporate income tax provisions is
that there is a mistiming of deductions and income, which often leads to an understatement of net
income. One such provision that often results in the understatement of net income is the
accelerated schedules for cost recovery for investments. The “bonus depreciation” provisions of
the 2008 and 2009 stimulus bills are examples of these provisions. While understating income,
these provisions also lower the effective tax rate on other forms of investment, and hence, skew
investment decisions. Corporate income tax deductions for domestic production activities serve
as a second factor that provides a bias in decision making by favoring certain production

37
activities over others. While imposed on a federal level, many states follow the design of this
provision and hence, further the economic distortion.
Multiple studies, the U.S. Department of Treasury (1992) and American Law Institute
(Warren, 1993; Graetz and Warren, 1998), were performed on the subject of how best to
integrate corporate and individual income taxes in order to address the issue of double taxation.
One suggested option is to offer shareholders a credit for any corporate tax income paid on
received dividends. A second option is to exclude dividends either fully or partially from the
calculation of personal income tax. Another option is to allow the deduction of dividends; this is
the least preferred option. I suggest that the imposition of a franchise tax is yet another option
and perhaps a better one in addressing the issue of double taxation.
The “Nexus Penalty” The State apportionment formula coupled with restrictions on state‘s taxing authority imposed by
Public-Law 86-272 result in extremely high and distortionary effective state corporate income tax
rates on a multi-state firm‘s first physical investment into a state where it has sales. This effective tax
rate, which is greater than the statutory rate, only occurs when a multi-state firm already making
sales into a state was previously shielded CIT liability in that state by Public Law 86-272. This nexus
penalty is the result of imposing a state corporate income tax in the presence of Public Law 86-272.
The nexus penalty distorts the firm‘s deployment of capital by rewarding firms that carefully manage
their nexus triggering presence in states imposing corporate income taxes.
Since the proposed franchise tax is levied on firms that have met the threshold for property,
sales or payroll, this design significantly reduces if not mostly eliminates the nexus penalty that
exists in the case of corporate income taxes.

38
Combined Reporting Combined reporting requires that business entities, engaged in a unitary business, file a
combined state corporate income tax return instead of each separate business entity filling
separately. According to Mazerov (2009), the six states, Massachusetts, Michigan, New York,
Vermont, West Virginia, and Wisconsin that have adopted combined reporting since 2004 have
often linked the adoption to a drop in the overall CIT rate. When Vermont began to require
combined reporting in 2004, it also phased in a gradual drop in its statutory CIT rate from 9.75%
to 8.5%. Similarly, when Massachusetts adopted combined reporting, it phased in a reduction of
its CIT rate from 9.5% to 8.05% through 2012. Like these two other states, when West Virginia
adopted combined reporting in 2009, it correspondingly lowered its CIT rate from 8.75% to
6.5% phased in through 2014.
The proponents of combined reporting argue that combined reporting is needed to off set
erosion in the corporate income tax base attributed to tax planning strategies available to
multistate corporations. The proponents of combined reporting also argue that it provides
increased uniformity in the effective tax rates paid by companies that operate as multiple
divisions rather than multiple corporations. However, combined reporting has uncertain effects
on a state’s revenues, making it very difficult to predict the revenue effect of adopting combined
reporting. As part of the 2009 Governor’s Budget Balancing Task Force Report in New Mexico,
I discuss the revenue effects of combined reporting in New Mexico while noting that the
although there is a net revenue increase in the case of New Mexico, the estimate is highly
uncertain, both because of the uncertainty of the underlying forecast of corporate income tax
39
revenues and the varying experiences of other states with mandatory combined reporting. Also
the report notes that "the estimate assumes that mandatory combined reporting would initially
increase corporate income tax revenues before credits by 10% and that the effect would decline
fairly rapidly over time, to zero after four years, as corporations adjust their operations to avoid
the impact of the change. The assumed decline in revenues over time to zero is consistent with
recent econometric research using multiple years of data across states, which indicates that
mandatory combined reporting has no effect on state corporate income tax revenue.
While perhaps mitigating the effect of tax planning on reported taxable income,
combined reporting fosters new distortions. For businesses with no tax planning, the averaging
effect occurs for a large number of taxpayers with different profitability across businesses.
Combined reporting also raises overall compliance costs for businesses and increases state
implementation. Again the franchise tax is an effective means to replace and often increase
corporate income tax revenues, without promoting distortions in business decision-making and
raising compliance and administrative costs.
Internationalization Since 1985 the flow of both direct and portfolio investments into and out of the United
States has significantly increased. Like other countries, the United States has tried to pursue tax
strategies that prevent the taxation of corporate income earned abroad from being taxed both by
the United States and the foreign country. However, correspondingly, the United States does
not want American businesses to move their income to their related foreign companies in order
40
to lower their taxes on their domestic earnings. Congress addressed the issue of limiting benefits
for income earned by related foreign companies in the Tax Reform Act of 1986. One result of the
Act was that foreign income was categorized into nine separate baskets; these baskets then
determined the eligibility for receiving tax credits. In this way, the act restricted companies from
offsetting United States taxes with foreign taxes on unrelated income. Additionally, the Act
limited interest deductions for companies making investments abroad. With increasing
internationalization of business, many OECD countries have lowered their corporate tax rates,
while widening their corporate tax bases (CBO, 2005; Sullivan, 2006). In general, countries are
striving for low corporate income taxes to attract foreign and domestic investments as well as
lower the risk of domestic companies shifting their income abroad. Hence, internationalization
has served as a means to cap corporate income tax rates. The use of a corporate franchise tax can
not only serve to broaden the corporate tax base by appropriately imposing the three
apportionment factors, but it can also serve to supplement corporate income tax revenue in
response to the downward pressure in rates.
41
Chapter 3
The Incidence of State Franchise Taxes
Tax incidence studies are based on the fundamental fact that the person who makes the
tax payment might not be the person whose welfare is reduced, i.e., legal incidence or obligation
to pay often does not correspond to economic incidence. The economic incidence of corporate
tax at both the federal and state levels has been unresolved, although many conclusions
pertaining to federal and state corporate income taxes also apply to state franchise taxes. I argue
that in the very short run, corporate franchise tax incidence falls on corporate shareholders in
proportion to their ownership. However, I also argue that in the long run, the corporate franchise
tax incidence falls not only on the shareholders but also on capital and labor.
Literature on Corporate Tax Incidence
In one of the early works on corporate income tax incidence, Domar and Musgrave
(1944) argue that taxes on capital income provide insurance as well as impose burdens. Some of
the early analysis on economic incidence was also done by Musgrave (1959). However, the
seminal paper that deals with the economic incidence of corporate income taxes is a paper by
Harberger (1962) that employs general equilibrium analysis. He models the corporate income tax
as a single factor tax in one sector. Harberger finds that owners of capital ultimately bear the
corporate income tax. He concludes that all owners of capital bear the incidence of corporate
income taxes, including owners of corporate and non-corporate capital. He assumes perfectly
competitive markets, no risk, fixed factor supplies, perfect mobility of factors, constant returns to
42
scale, incremental tax changes etc. among the major ones to prove the above result. He argues
that capital moves from corporate to non-corporate sectors until the returns in each sector are
equal in the long run. I note here that Harberger's approach has been used to analyze a wide array
of taxes. Miesczkowski’s work on property tax incidence is an example. Krzyzaniak and
Musgrave (1963) followed up on Harberger's work with an econometric analysis and
demonstrate that taxes could shift over a 100 percent. They argued that corporate profits actually
increase with an increase in taxes as firms shift the tax to consumers through price increases. In
1968, Bishop argued that ad valorem and unit taxes have different equilibrium under imperfect
competition than under monopoly market structures'. Upon further analysis Krzyzaniak and
Musgrave (1970), argued that Harberger correctly concluded that capital bears approximately the
full burden of the tax. Diamond (1970) concluded that in certain cases capital declines by a large
amount causing the after tax return on capital to actually increase while the tax burden is shifted
to labor.
In 1973, Stiglitz argued that corporate income tax does not apply to the return of
marginal investment under certain circumstances and hence would not have the distortionary
effects on prices as argued by Harberger. Stiglitz also argued that corporate revenues are a result
of economic rents. This implies that the incidence could depend on the nature of the rents
collected. If the rents are collected as a return to ideas, the tax could be a tax on labor. In a
monopoly model, he suggested that corporate rents do not lead to distortions in production
choices. However in the case of oligopoly, corporate rents would distort production choices.
Stiglitz also argues that corporations use debt as opposed to equities for financing investment as
debt related interest payments are tax deductible. Therefore, a tax on profits, or for that matter
43
dividend, does not distort investment decisions due to corporations using debt to finance their
investment.
Another key paper that explains the tax incidence using a graphical analysis is that of
McLure (1974). He provided a graphical analysis to Harberger's model that has made it easier to
understand and McLure's 1974 paper has now become standard in the literature showing that tax
burden is borne by capital. Also in 1974, Feldstein developed a neoclassical growth model that
analyzes the long run incidence of capital income tax and argues that most of the burden of the
tax is shifted to labor due to a decrease in the capital-labor ratio. Feldstein (1974) also uses a
Solow growth model to demonstrate that labor would bear the burden of corporate tax because it
reduces capital accumulation.
McLure and Thirsk (1975) provide a simplified back-of-the-envelope calculation of the
Harberger's model's incidence by applying functional forms to Harberger's equations and
allowing large tax changes. Vandendorpe and Friedlaender (1976) extend Harberger's analysis
by relaxing some of his restrictive assumptions and make their analysis applicable to any large,
pre-existing tax changes. Shoven (1976) uses twelve sectors to show the response to a large
corporate tax. However, he shows that Harberger's results hold for a two sector model. Feldstein
(1977) argues that land not only serves as a factor of production but also as an asset. Therefore a
tax on land allows investors to increase other assets and as a result causes physical capital to
increase. This causes wages to go up due to a higher capital-labor ratio. Also in 1977, Miller
argues that firms would use equity to finance only the portion of the value in excess of invested
capital. He also argues that under a progressive tax system, there may be investors that are in a
high enough tax brackets that the extra taxation at the corporate level is more than offset by

44
preferential treatment of individual equity income. According to the Miller model, corporate tax
is largely borne by corporate shareholders. He argues that taxpayers hold specialized portfolios
according to their tax brackets and status. He also argues that people with high income tax rates
would therefore face a different tax burden on equities than bonds.
Bradford (1978) uses an international version of the Harberger's model. He assumes that
United States is the corporate sector in the world-wide closed economy. He argues that if the
United States were very small relative to the rest of the world, the world rate of return on capital
would decline by only a small amount. He demonstrates that foreign labor would gain because
of the outflow of capital from the United States. Ballentine (1978) uses a Solow growth model
to mimic the incidence of a corporate income tax. His approach specifies plausible values to the
interest elasticity of labor to find that in the long run capital bears between 20 and 98 percent of
corporate income taxes. Broadway (1979) uses a model where capital tax revenue replaces wage
tax revenue. He argues that in the transition period, labor when corporate income taxes are
imposed benefit from a higher after tax wages. He argues, however, that in the long run the tax
would indeed harm labor.
In a key paper, Feldstein and Horioka (1980) argue that in a closed economy, national
investment and savings are necessarily identical. However, if international capital is mobile,
national saving and investment are not identical due to cross-border capital flows that equate the
net international rate of return to capital among trading nations. Bernheim (1981) provides a
model to think about analyze welfare changes that result from imposing corporate income taxes
as the economic system moves to a new general equilibrium. Also in 1981, Summers adds
capital income tax to the standard life-cycle model to argue that interest elasticity of savings is

45
seriously understated. He also argues that demand for non-corporate capital will temporarily
increase the cost of installed capital in that sector as corporate income taxes are imposed. Kay
and Keen (1983) analyze oligopolistic markets to conclude that consumer welfare or utility can
be affected by product variety, price and quantity changes caused by corporate income taxes.
Also, Auerbach (1983) build an overlapping generations computable general equilibrium model
with a representative agent in each group and use consumer preferences to calculate the changes
in savings behavior due to a change in tax.
In 1985, Katz and Rosen demonstrate that the results of corporate income taxes in
oligopolistic markets do not lie between those of perfect competition and monopoly. Gordon
(1985) argues that most of the corporate tax revenue is attributable to the return to risk. He
argues that the return to capital is close to zero without risk which leads to the conclusion that
corporate income tax would not be much of a burden. However, since the corporate income tax
does not produce full offset to losses, the corporate income tax does impose a net burden on the
shareholders. Also, Pechman (1985), provided scenarios of corporate tax incidence under
varying assumptions reflecting on the fact that it was uncertain which assumption was the best.
Judd (1985) uses a capitalist and worker model to argue that the burden of the corporate tax is
shifted entirely to labor. He argues that in the long run, the net return to capital remains constant
in spite of taxation by assuming that people are infinitely lived and have a perfect foresight.
Using his model he argues that capital goes down to compensate for a tax increase causing the
burden to be shifted entirely to labor due to lower productivity. Mutti and Grubert (1985) argue
that foreign and domestic assets do not have to be very substitutable for labor to bear most of the
burden of corporate income tax. Kotlikoff and Summers (1987) use a time period model to argue
46
that while savings increase after the first period after a corporate income tax is imposed, it is not
possible to clearly demonstrate that labor will bear the net burden of the tax. They argue that the
total burden of corporate income tax on capital need not fall with the ability of the US to affect
the international rate of return.
Auerbach (1989) looks at the effects of distinguishing between old and new capital and
estimates the impact of the Tax Reform Act of 1986 on the value of equipment and structures.
Also in 1989, Gravelle and Kotlikoff model the corporate-non-corporate distinction and argue
that production will balance between the two sectors when the non-corporate advantage is offset
by the economies of scale. Gordon and Mackie-Mason (1997) and Goolsbee (1998) find smaller
changes in response to changes in taxation and argue that the deadweight losses might be
smaller.
Auten and Kalambokidis (2000) argue that a cash-flow tax is in essence a value-added
tax because wages are deducted from the corporate tax base. Devereux and Griffith (2003) argue
that corporate shareholders can shift not only a tax on capital but also on rents which strengthens
the impact of a corporate tax rate. Auerbach (2006) argues that an increase in cash-flow tax does
not distort investment decisions as associated with new capital purchases. He thus argues that
shareholders bear the corporate tax burden because a change in cash flow would cause a
proportional change in share prices. Gravelle and Smetters (2006) find that the percentage of the
burden that falls on domestic labor in the long run declines from 71 percent to 38 percent when
the product substitution elasticity is reduced from 100 to 3 even when foreign and domestic
capital are near perfect substitutes. Randolph (2006) uses arithmetic examples to argue that labor
bears about 70 percent of the corporate income tax while capital bears only 30 percent.
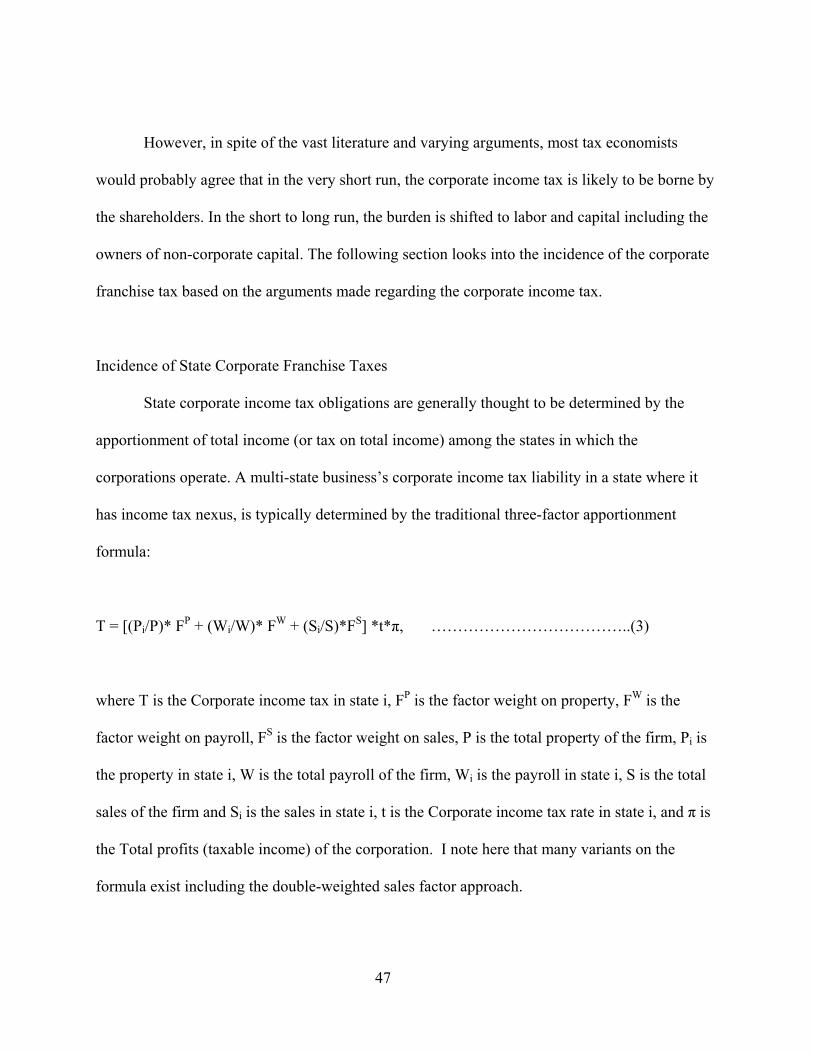
47
However, in spite of the vast literature and varying arguments, most tax economists
would probably agree that in the very short run, the corporate income tax is likely to be borne by
the shareholders. In the short to long run, the burden is shifted to labor and capital including the
owners of non-corporate capital. The following section looks into the incidence of the corporate
franchise tax based on the arguments made regarding the corporate income tax.
Incidence of State Corporate Franchise Taxes State corporate income tax obligations are generally thought to be determined by the
apportionment of total income (or tax on total income) among the states in which the
corporations operate. A multi-state business’s corporate income tax liability in a state where it
has income tax nexus, is typically determined by the traditional three-factor apportionment
formula:
T = [(Pi/P)* FP + (Wi/W)* FW + (Si/S)*FS] *t*π, ………………………………..(3)
where T is the Corporate income tax in state i, FP is the factor weight on property, FW is the
factor weight on payroll, FS is the factor weight on sales, P is the total property of the firm, Pi is
the property in state i, W is the total payroll of the firm, Wi is the payroll in state i, S is the total
sales of the firm and Si is the sales in state i, t is the Corporate income tax rate in state i, and π is
the Total profits (taxable income) of the corporation. I note here that many variants on the
formula exist including the double-weighted sales factor approach.
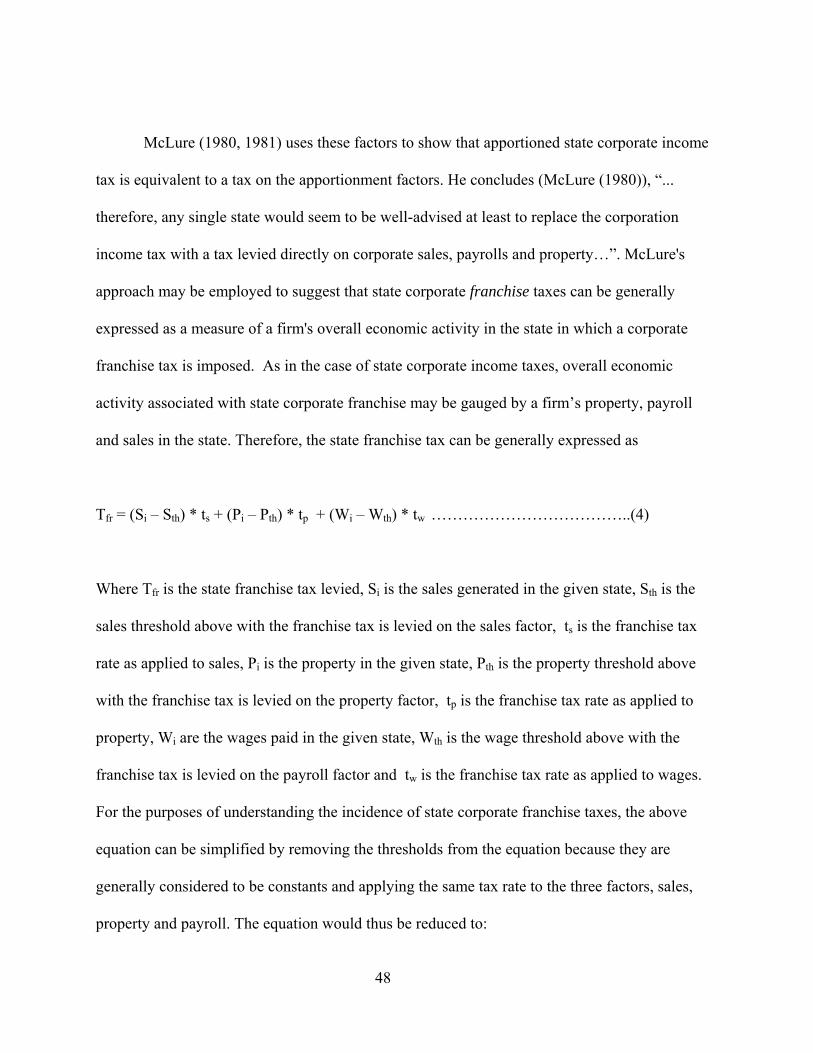
48
McLure (1980, 1981) uses these factors to show that apportioned state corporate income
tax is equivalent to a tax on the apportionment factors. He concludes (McLure (1980)), “...
therefore, any single state would seem to be well-advised at least to replace the corporation
income tax with a tax levied directly on corporate sales, payrolls and property…”. McLure's
approach may be employed to suggest that state corporate franchise taxes can be generally
expressed as a measure of a firm's overall economic activity in the state in which a corporate
franchise tax is imposed. As in the case of state corporate income taxes, overall economic
activity associated with state corporate franchise may be gauged by a firm’s property, payroll
and sales in the state. Therefore, the state franchise tax can be generally expressed as
Tfr = (Si – Sth) * ts + (Pi – Pth) * tp + (Wi – Wth) * tw ………………………………..(4)
Where Tfr is the state franchise tax levied, Si is the sales generated in the given state, Sth is the
sales threshold above with the franchise tax is levied on the sales factor, ts is the franchise tax
rate as applied to sales, Pi is the property in the given state, Pth is the property threshold above
with the franchise tax is levied on the property factor, tp is the franchise tax rate as applied to
property, Wi are the wages paid in the given state, Wth is the wage threshold above with the
franchise tax is levied on the payroll factor and tw is the franchise tax rate as applied to wages.
For the purposes of understanding the incidence of state corporate franchise taxes, the above
equation can be simplified by removing the thresholds from the equation because they are
generally considered to be constants and applying the same tax rate to the three factors, sales,
property and payroll. The equation would thus be reduced to:
49
Tfr = [(Si + Pi + Wi) * tfr ] / 3 ………………………………..(5)
where tfr is the franchise tax rate in that state.
The above equation can be employed to explain the incidence of state franchise taxes.
Understanding, the incidence of state taxes requires understanding how the taxes are levied. If all
the states levied a standard corporate franchise tax, it might be possible to understand the tax by
studying it at a national or even international level. But since tax systems vary widely, it is
necessary to understand the incidence at the state level. The portion of state franchise tax that is
exported to residents and nonresidents of the taxing state is determined by the extent to which
the burden of the tax is borne by consumers and capital owners. This can be understood by
considering each of the terms in the above equation.
Sales Factor Incidence
The incidence of the first factor in equation (5) above -- sales -- is likely to be similar to
the incidence of a gross receipts or standard sales tax. Determining how much of the burden is
carried by the sales factor requires understanding how sales are defined in the state that imposes
the tax. If the sales are attributable to the destination state, the incidence of the sales portion
should be generally considered to be the same as that of a standard sales tax. This implies
consumers of products in the given state pay for this portion of the franchise tax. This argument
is similar to analysis of McLure (1981) implies that the sales portion of the tax cannot be
generally shifted to consumers in national or global markets. In other words, to the extent that
50
corporations operating in the taxing state sell in national markets, it is likely that the tax would
be passed on to the consumers in the taxing state and not throughout the nation. This is
consistent with the argument that the tax burden is borne by those who can least avoid it i.e., it is
regressive by nature, as are sales taxes.
Labor Factor Incidence
If labor is immobile between states, it is likely that labor will absorb the part of the tax
that relates to payroll or wages. If labor is used in the state to make products that are exported,
the incidence of a franchise tax falls on labor that is unable to avoid the tax through migration. If
labor is mobile between the states, the portion of the labor that is unable to migrate would be
bearing the payroll-related portion of the corporate franchise tax.
Property Factor Incidence
Since property is generally considered to be immobile, it is likely that the property
portion of the franchise tax is generally similar to that of a standard property tax on commercial
property. If the property is used to produce products that are exported outside the producing
state, the incidence is borne by the portion of the property that is unable to avoid the tax through
migration.
Incidence on Capital and Labor
Because firms operating in a given state usually compete for capital and labor in national
markets, state franchise tax burdens are unlikely to be borne by capital except in the short run. In
51
the very short run, the franchise tax burden may fall on shareholders. According to the Miller
model, federal corporate tax is largely borne by corporate shareholders. Miller argues that
taxpayers hold specialized portfolios based on their tax brackets and filing status. This applies to
franchise taxation as well. Beyond the short run, the tax is then shifted to capital and labor in the
proportion that labor and capital are used in producing the goods to be sold in the given state.
Labor and capital rates of return shift until rate of return comes to equilibrium. In an open
economy, capital and labor rates shift till the domestic rate of return equals the world rate of
return. Similarly, in the case of a closed economy, the rate of return to capital and wages
between the states would come to a new equilibrium, after the introduction of the franchise tax in
a given state. In this sense, open and closed economy arguments are very similar. Also,
Feldstein’s (1977) argument that land not only serves as a factor of production but also as an
asset holds in the case of the corporate franchise tax. Therefore, it can be argued that a tax on
land allows investors to increase other assets and as a result causes physical capital to increase.
This causes wages to go up due to a higher capital-labor ratio in the long run. Also, even in the
long run, some of the burden is borne by the shareholders. The burden cannot be entirely shifted
off of the shareholders to labor and capital alone.
From an economic rents perspective, the incidence of state franchise taxes depends on the
nature of rents collected. To the extent that ideas and not goods are produced, the franchise tax is
a tax on labor. If goods are also being sold, the tax is passed on to the goods to the extent that
goods are sold in the local markets. But in case of the services industry, the tax can be
considered as a tax on labor for the most part. To the extent that property is involved in
generating the economic activity, it is taxed. The 1973 Stiglitz’s argument that corporate income
52
tax does not apply to the return of marginal investment under certain circumstances and hence
would not have the distortionary effects on prices as argued by Harberger holds in the case of
corporate franchise taxes also. His argument that in a monopoly model, corporate rents do not
lead to distortions is also true. However in the case of oligopoly, corporate rents would distort
production choices. Stiglitz also argues that corporations use debt as opposed to equities for
financing investment as debt related interest payments are tax deductible. Therefore, a tax on
profits or for that matter dividend does not distort investment decisions due to corporations using
debt to finance their investment.
Incidence of State Franchise Taxes on Non-Corporate Business Forms
Market forces tend to equalize the return to capital on corporate and non-corporate forms
of business. Depending on the nature and the extent of taxes on labor, labor shifts between
corporate and non-corporate sectors until the net or effective wage rates are equalized. From this
standpoint, franchise tax is a tax on labor as well as capital. Kotlikoff and Summers (1987) time
period model applies to franchise tax in that while savings increase after the first period, it is not
possible to clearly demonstrate that labor will bear the net burden of the tax. Their argument that
the total burden on capital need not fall with the ability of the US to affect the international rate
of return still holds in the case of a franchise tax.
Looking at the corporate tax in terms of risk, the return to a risky asset can be separated
into two components, the safe rate of return plus the excess return that comes from risk. If t
represents the tax rate on the risk-free return and t* represents the tax rate on the excess return,
the taxpayer is indifferent to the value of t*, as the taxpayer can undo taxation of the excess
53
return by shifting to a portfolio with a greater share of the risky asset. This appears to be true
more in case of the state corporate tax rather than the state franchise tax since the franchise tax is
not a tax on income. It can be argued that the tax payer would have already shifted to the riskier
portfolio if it was to give a greater rate of return, even in the absence of a franchise tax.
Summary
State corporate franchise tax generally reflect a firm's overall economic activity in a
particular state which is, in turn, commonly measured by the firm’s property, payroll and sales in
the state. I argue along the lines of McLure (1980, 1981) to show that the apportioned state
corporate franchise tax is equivalent to a tax on the apportionment factors. The incidence of the
first factor in the above formula, sales is considered to be along the lines of a gross receipts or a
standard sales tax. To the extent that the corporations operating in the taxing state, sell in
national markets, it is likely that the tax would be passed on to the consumers in the taxing state
and not throughout the nation. The property portion of the franchise tax can be considered to be
generally similar to that of a standard property tax. Finally, if labor is mobile between the states,
then the argument would be that the portion of the labor that is unable to migrate would be
bearing the payroll related portion of the corporate franchise tax.
From an economic rents argument, the incidence depends on the nature of rents collected.
To the extent that ideas and not goods are being produced, the franchise tax is a tax on labor.
Also, in the very short run, the franchise tax burden may fall on the shareholders. According to
the Miller model, corporate tax is largely borne by corporate shareholders. He argues that
taxpayers hold specialized portfolios according to their tax brackets and status. This applies to

54
franchise taxation as well. Beyond the short run, the tax is then shifted to capital and labor in the
proportion that labor and capital are used in producing the goods to be sold in the given state.
Understanding who bears the burden of corporate franchise tax provides taxpayers and
policymakers with information on how equitably the tax is distributed. I highlight the need for
further study and research on the subject to better understand the incidence to propose changes in
tax on business or for that matter even change in tax rates.
55
Chapter 4
Reliability and Volatility
Introduction The relative contribution of corporate tax revenues at the federal level is currently at
about the same level that it was in the early 1970s. At the state level, corporate income tax
revenues are both volatile and difficult to predict, and add uncertainty to state budgeting. State
corporate income taxes are “pro-cyclical”, exacerbating the drop in state revenues in downturns.
GAO (2004) reports that 32.7 percent of large U.S. corporations reported no tax liability in 1995
and that percentage rose to 45.3 percent by 2000. Nationally, corporate income tax revenues
declined 12.2% in the year ending June 2009, after declining 7.3% in the year ending June 2008,
a cumulative decline of 19.7%, after growth of 15.4% between June 2006 and June 2007.
It is generally known that the corporate tax structure in most states begins with federal
corporate taxable income and then allows for certain additions and subtractions. Thus a decrease
in the federal base also decreases the state corporate tax base. Auerbach (1984) notes that
corporate income tax revenues have declined steadily as a fraction of U.S. GNP over the past
three decades. He adds that "one reason for the decline in corporate tax collections since 1953
has been a decline in corporate profitability.
More recently, the State Corporate Income Tax (CIT) revenues have dropped
dramatically. State CIT revenues are extremely sensitive to economic cycles and thus are subject
to considerable uncertainty. Shrinkage of the base appears to explain the general tendency over
the last decade, although multiple causes for the deterioration of revenues can be identified.
Cyclical declines in corporate profits, aggressive corporate tax planning by corporations and

56
federal and state decisions to reduce the corporate tax base and tax burdens. Gupta, et. al.,
(2009) document a decline in total state CIT collections relative to total state taxes from 1982
until 2002. Fox et al (2007) note that even before the recession state CIT revenue was falling as a
share of profits.
Therefore, it is also generally agreed by tax economists that CIT revenues are difficult to
forecast. In fact, CIT revenues are an order of magnitude more volatile than for example personal
income tax revenues. As a result, the one of the things the States are moving towards is
increasing the use of the sales factor to apportion corporate income. More over, at least six states
are considering proposals to repeal their state corporate income tax (CIT). Ohio is completing
the repeal of its corporate income tax which was partially replaced by a gross receipts tax.
California‘s tax reform commission proposed replacing the California CIT and sales tax with a
subtraction VAT. Minnesota Governor‘s 21st Century Tax Reform Commission proposed
replacing the corporate income tax with a broader sales tax base including more consumer
purchases of goods and services.
Another proposed replacement of the state corporate income tax is the introduction of a
state corporate franchise tax. The State corporate franchise tax is a measure of the firms overall
economic activity in the state which is calculated commonly by assessing the firms property,
payroll and sales in the state. Therefore, the state franchise tax can be expressed as
Tfr = (Si – Sth) * ts + (Pi – Pth) * tp + (Wi – Wth) * tw ………………………………..(6)
Si,n = ƒ(Si,n-1 , TGR n-1, , TGR n) ………………………………..(7)
Pi,n = ƒ(Pi,n-1 , POP n-1 , POP n) ………………………………..(8)

57
Wi,n = ƒ (Wi,n-1 , PWS n-1, PWS n) ………………………………..(9)
Where Tfr is the state franchise tax levied, Si is the sales generated in the given state, Sth is the
sales threshold above which the franchise tax is levied on the sales factor, ts is the franchise tax
rate as applied to sales, Pi is the property in the given state, TGR n-1, , TGR n are the New Mexico
taxable gross receipts forecast using the consensus revenue process for years n-1 and n, POP n-1 ,
POP n are the New Mexico population forecast from New Mexico Bureau of Business and
Economic Research (BBER) for years n-1 and n, PWS n-1, PWS n are the New Mexico private
wage and salary forecasts from the For-UNM forecast produced by BBER for years n-1 and n,
Pth is the property threshold above which the franchise tax is levied on the property factor, tp is
the franchise tax rate as applied to property, Wi are the wages paid in the given state, Wth is the
wage threshold above which the franchise tax is levied on the payroll factor and tw is the
franchise tax rate as applied to wages. One of the key arguments in favor of a franchise tax is
that the factor-based franchise tax would have a much more stable base, helping to remove
uncertainty from budget forecasting and decision making.
I use micro-simulation techniques to analyze the stability and volatility of state franchise
tax as compared to the state corporate income tax. The chapter is organized as follows. Section II
covers the methodology and related techniques used in estimating the revenues, Section III lists
the hypotheses to be tested, Section IV describes the analysis and results, and Section V details
the conclusions and policy implications.
Methodology

58
Our analysis of the steadiness and volatility of corporate and franchise tax revenues is
carried out in three distinct steps. First I estimate the past and present gross corporate income tax
revenues. Second, I carry out a micro-simulation analysis of corporate income tax data (from
2006 tax year) using standard estimates and economic predictions provided by Bureau of
Business and Economic Research as well as General Insight to estimate the federal corporate
franchise tax revenues. Thirdly, I compare the two to determine which of the revenues is more
reliable and less volatile.
For the purpose of my analysis, corporate income tax revenues from 2006 through 2014
are collected from two sources. The past corporate income tax revenues are obtained from the
Taxation and Revenue department of the State of New Mexico. Future corporate income tax
revenues are estimated for the State of New Mexico using a consensus revenue forecast process.
In this chapter I use the corporate income tax revenue estimates from the July 2010 consensus
revenue forecast as the estimated future corporate revenues.
Corporate income tax rates in New Mexico are 4.8% on the first $500,000 of net
(taxable) income, 6.4% on the next $500,000 of net income, and 7.6% on net income over $1
million. The gross New Mexico corporate income tax revenues are forecasted (by applying the
appropriate rates and ratios) based on estimates of federal corporate profits and federal
corporate tax receipts from Congressional Budget Office (CBO) and Global Insight (GI), cash flow
model using corporate receipt patterns over the past several years along with a model that
estimates New Mexico CIT revenues based on estimating two components industry groups i.e.
oil and gas and other industries by utilizing their respective growth patterns. Results from the
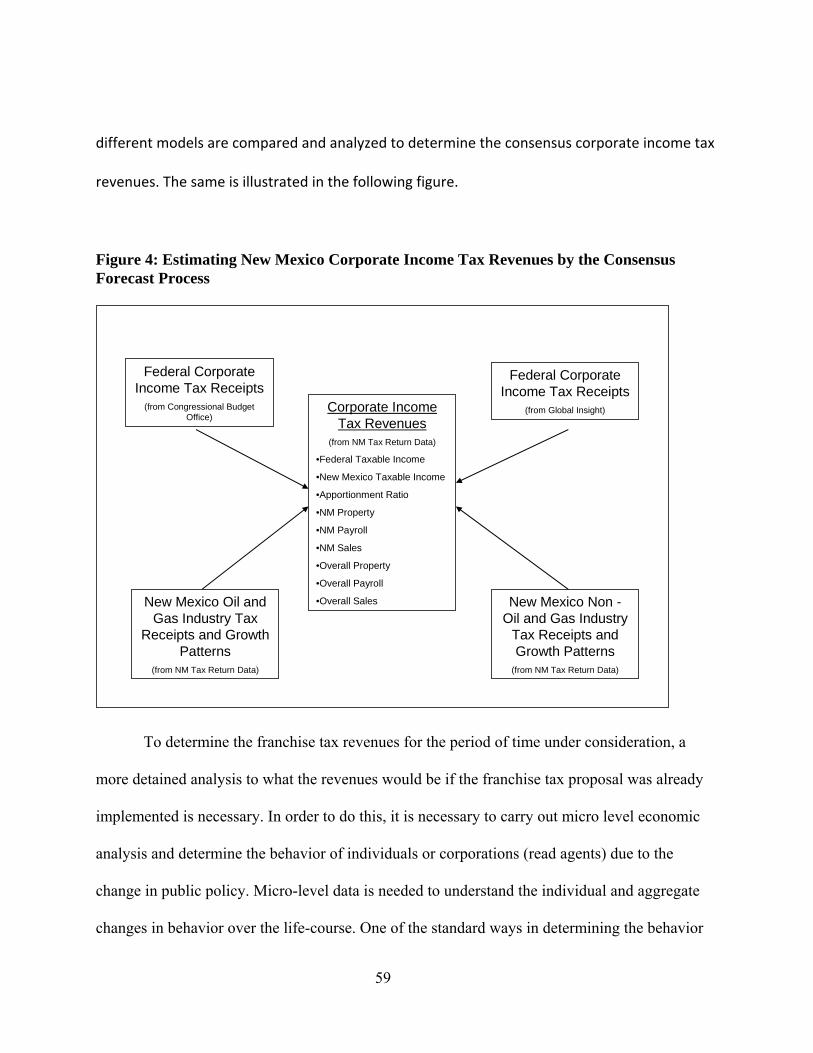
59
different models are compared and analyzed to determine the consensus corporate income tax
revenues. The same is illustrated in the following figure.
Figure 4: Estimating New Mexico Corporate Income Tax Revenues by the Consensus Forecast Process
To determine the franchise tax revenues for the period of time under consideration, a
more detained analysis to what the revenues would be if the franchise tax proposal was already
implemented is necessary. In order to do this, it is necessary to carry out micro level economic
analysis and determine the behavior of individuals or corporations (read agents) due to the
change in public policy. Micro-level data is needed to understand the individual and aggregate
changes in behavior over the life-course. One of the standard ways in determining the behavior
Corporate Income Tax Revenues
(from NM Tax Return Data)
•Federal Taxable Income
•New Mexico Taxable Income
•Apportionment Ratio
•NM Property
•NM Payroll
•NM Sales
•Overall Property
•Overall Payroll
•Overall Sales
Federal Corporate Income Tax Receipts
(from Congressional Budget Office)
Federal Corporate Income Tax Receipts
(from Global Insight)
New Mexico Oil and Gas Industry Tax
Receipts and Growth Patterns
(from NM Tax Return Data)
New Mexico Non -Oil and Gas Industry
Tax Receipts and Growth Patterns
(from NM Tax Return Data)

60
of agents over time is by using microsimulation techniques. A microsimulation model is a model
which uses simulation techniques and takes micro level units as the basic units of analysis when
investigating the effects of social and economic policies. The differences before and after the
change, can be analyzed at the micro level or aggregated to show the overall effect of the
change. Micro simulation analysis can be either static or dynamic. Static microsimulation
analysis is conducted when the behavior or attributes of the individuals or agents does not
change over time i.e. there is no ageing. When their behavior changes over time, dynamic
microsimulation models are used i.e. the characteristics of the agents change in response to
accumulated experience or the passage of time. In this method, as the agents get older, stochastic
and deterministic methods are used to predict the changes in behavior of the agents. In this way,
dynamic models generate long-term or life-time data about agents.
The choice of using a static or dynamic microsimulation model and whether to include
ageing depends on the data available and the problem being addressed. A static micro-simulation
is generally employed when only cross sectional data is used to answer a question for example
the understanding the change in revenues due to a change in tax policy. That is to say that static
microsimulation helps us understand the first round effects. However, dynamic methods are used
when a set of repeated cross sections are needed and the agents change their behavior in response
to a change in either tax policy or tax rate. By analyzing the changes in behavior which might
occur over a period of time, they help us understand not only the first term effects but also the
full effects. However, the introduction of the behavior component introduces an additional
degree of uncertainty generated by the parameters assumed. As such, all microsimulation models
are subject to a certain degree of error. Also, the steps involved in performing microsimulation
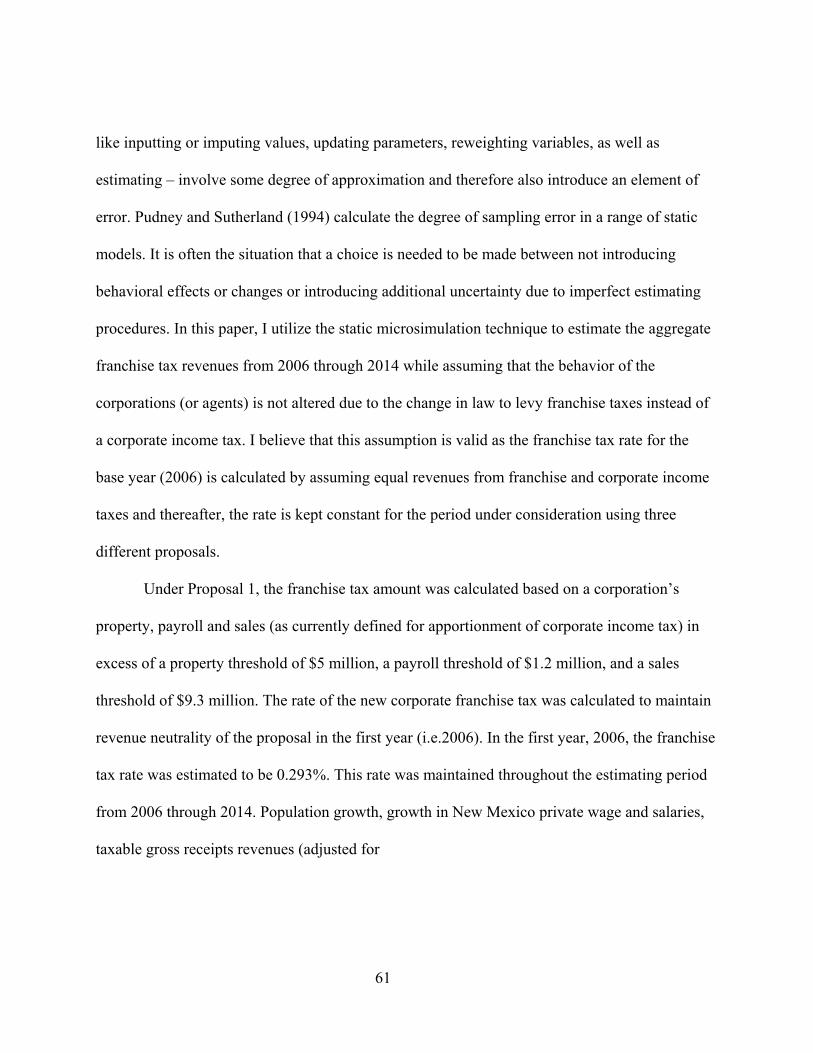
61
like inputting or imputing values, updating parameters, reweighting variables, as well as
estimating – involve some degree of approximation and therefore also introduce an element of
error. Pudney and Sutherland (1994) calculate the degree of sampling error in a range of static
models. It is often the situation that a choice is needed to be made between not introducing
behavioral effects or changes or introducing additional uncertainty due to imperfect estimating
procedures. In this paper, I utilize the static microsimulation technique to estimate the aggregate
franchise tax revenues from 2006 through 2014 while assuming that the behavior of the
corporations (or agents) is not altered due to the change in law to levy franchise taxes instead of
a corporate income tax. I believe that this assumption is valid as the franchise tax rate for the
base year (2006) is calculated by assuming equal revenues from franchise and corporate income
taxes and thereafter, the rate is kept constant for the period under consideration using three
different proposals.
Under Proposal 1, the franchise tax amount was calculated based on a corporation’s
property, payroll and sales (as currently defined for apportionment of corporate income tax) in
excess of a property threshold of $5 million, a payroll threshold of $1.2 million, and a sales
threshold of $9.3 million. The rate of the new corporate franchise tax was calculated to maintain
revenue neutrality of the proposal in the first year (i.e.2006). In the first year, 2006, the franchise
tax rate was estimated to be 0.293%. This rate was maintained throughout the estimating period
from 2006 through 2014. Population growth, growth in New Mexico private wage and salaries,
taxable gross receipts revenues (adjusted for
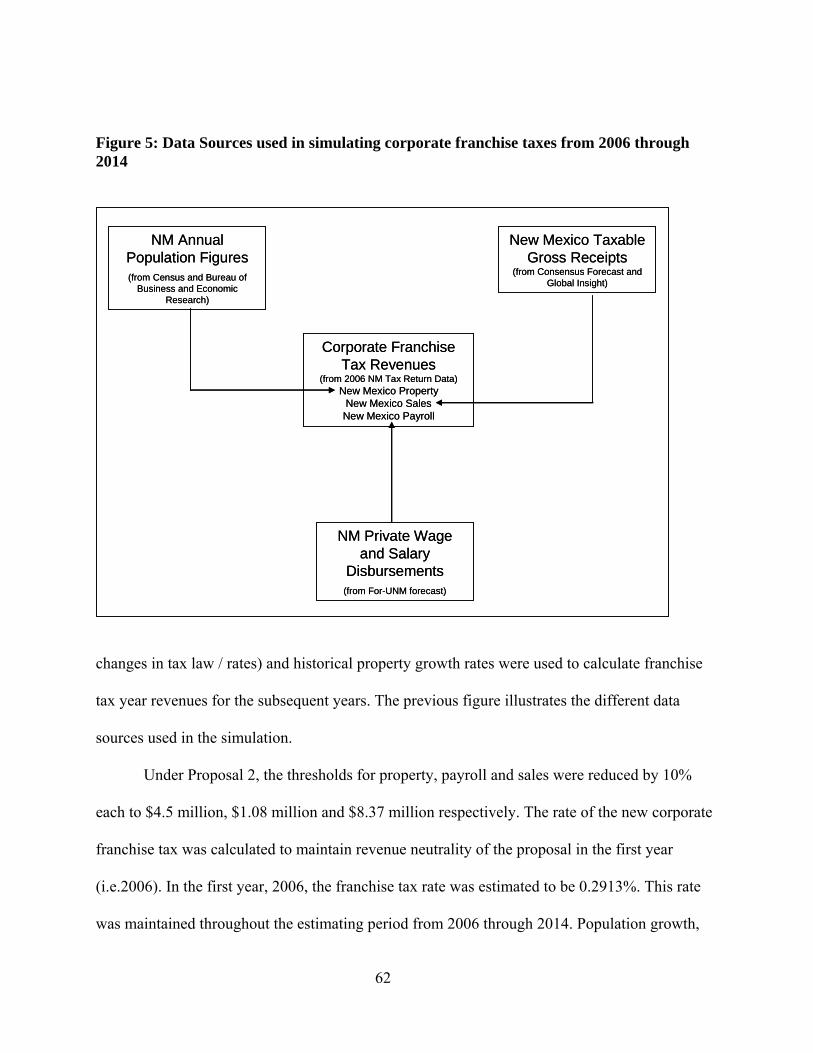
62
Figure 5: Data Sources used in simulating corporate franchise taxes from 2006 through 2014
changes in tax law / rates) and historical property growth rates were used to calculate franchise
tax year revenues for the subsequent years. The previous figure illustrates the different data
sources used in the simulation.
Under Proposal 2, the thresholds for property, payroll and sales were reduced by 10%
each to $4.5 million, $1.08 million and $8.37 million respectively. The rate of the new corporate
franchise tax was calculated to maintain revenue neutrality of the proposal in the first year
(i.e.2006). In the first year, 2006, the franchise tax rate was estimated to be 0.2913%. This rate
was maintained throughout the estimating period from 2006 through 2014. Population growth,
Corporate Franchise Tax Revenues
(from 2006 NM Tax Return Data)New Mexico Property
New Mexico SalesNew Mexico Payroll
NM Annual Population Figures(from Census and Bureau of
Business and Economic Research)
New Mexico Taxable Gross Receipts
(from Consensus Forecast and Global Insight)
NM Private Wage and Salary
Disbursements(from For-UNM forecast)
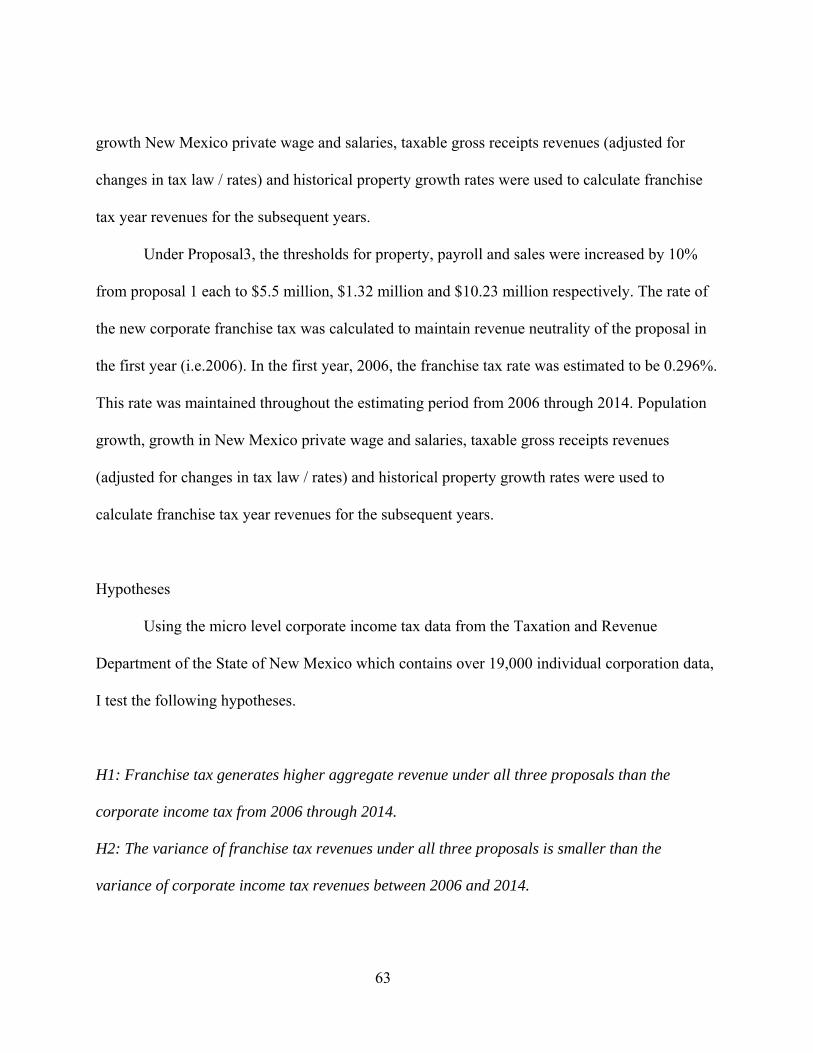
63
growth New Mexico private wage and salaries, taxable gross receipts revenues (adjusted for
changes in tax law / rates) and historical property growth rates were used to calculate franchise
tax year revenues for the subsequent years.
Under Proposal3, the thresholds for property, payroll and sales were increased by 10%
from proposal 1 each to $5.5 million, $1.32 million and $10.23 million respectively. The rate of
the new corporate franchise tax was calculated to maintain revenue neutrality of the proposal in
the first year (i.e.2006). In the first year, 2006, the franchise tax rate was estimated to be 0.296%.
This rate was maintained throughout the estimating period from 2006 through 2014. Population
growth, growth in New Mexico private wage and salaries, taxable gross receipts revenues
(adjusted for changes in tax law / rates) and historical property growth rates were used to
calculate franchise tax year revenues for the subsequent years.
Hypotheses Using the micro level corporate income tax data from the Taxation and Revenue
Department of the State of New Mexico which contains over 19,000 individual corporation data,
I test the following hypotheses.
H1: Franchise tax generates higher aggregate revenue under all three proposals than the
corporate income tax from 2006 through 2014.
H2: The variance of franchise tax revenues under all three proposals is smaller than the
variance of corporate income tax revenues between 2006 and 2014.
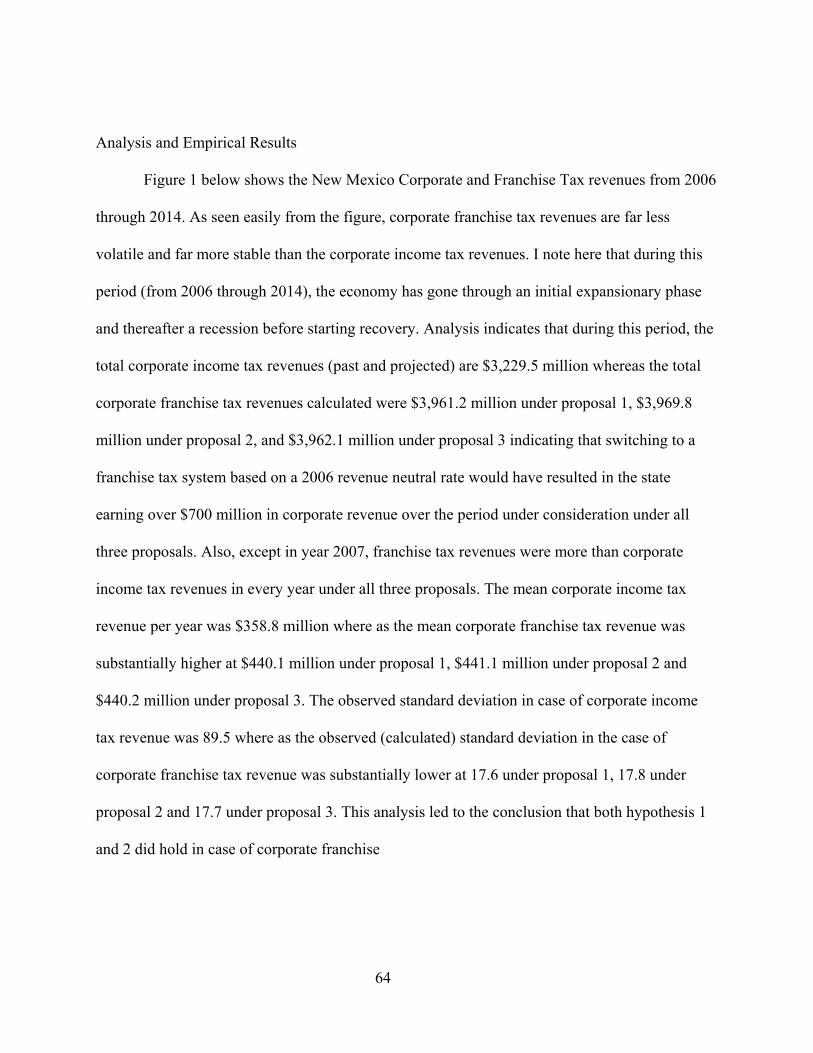
64
Analysis and Empirical Results Figure 1 below shows the New Mexico Corporate and Franchise Tax revenues from 2006
through 2014. As seen easily from the figure, corporate franchise tax revenues are far less
volatile and far more stable than the corporate income tax revenues. I note here that during this
period (from 2006 through 2014), the economy has gone through an initial expansionary phase
and thereafter a recession before starting recovery. Analysis indicates that during this period, the
total corporate income tax revenues (past and projected) are $3,229.5 million whereas the total
corporate franchise tax revenues calculated were $3,961.2 million under proposal 1, $3,969.8
million under proposal 2, and $3,962.1 million under proposal 3 indicating that switching to a
franchise tax system based on a 2006 revenue neutral rate would have resulted in the state
earning over $700 million in corporate revenue over the period under consideration under all
three proposals. Also, except in year 2007, franchise tax revenues were more than corporate
income tax revenues in every year under all three proposals. The mean corporate income tax
revenue per year was $358.8 million where as the mean corporate franchise tax revenue was
substantially higher at $440.1 million under proposal 1, $441.1 million under proposal 2 and
$440.2 million under proposal 3. The observed standard deviation in case of corporate income
tax revenue was 89.5 where as the observed (calculated) standard deviation in the case of
corporate franchise tax revenue was substantially lower at 17.6 under proposal 1, 17.8 under
proposal 2 and 17.7 under proposal 3. This analysis led to the conclusion that both hypothesis 1
and 2 did hold in case of corporate franchise

65
Figure 6: New Mexico Corporate Income and Corporate Franchise Tax Revenues (in $ millions)
New Mexico Corporate and Franchise Tax Revenues (in $Millions)
0
100
200
300
400
500
600
2006 2007 2008 2009 2010 2011 2012 2013 2014
Year
Rev
enu
e ($
Mill
ion
s)
Corporate Income Tax Revenues Franchise Tax Revenues- Proposal 1
Franchise Tax Revenues Proposal 2 Franchise Tax Revenues Proposal 3
and income taxes. I then perform a simple f-test on the three proposals to determine if the
variance is statistically significant. The f-test values in the three proposals were 0.000123,
0.000133 and 0.000127 respectively which indicates that the variance between corporate income
tax and corporate franchise tax under all three proposals is statistically significant.
Summary At the state level, corporate income tax revenues are volatile and difficult to predict,
adding uncertainty to state budgeting. Also, state corporate income taxes are “pro-cyclical”,
exacerbating the drop in state revenues in downturns. This chapter used micro-simulation
techniques to analyze the stability and volatility of state franchise tax as compared to the state
66
corporate income tax and My analysis indicates that switching to a franchise tax system based on
a 2006 revenue neutral rate would have resulted in the state earning over $700 million in
corporate revenue over the period under consideration. Also, the mean corporate income tax
revenue per year was $358.8 million where as the mean corporate franchise tax revenue was
substantially higher at $440.1 million. I also show that corporate franchise tax revenues are less
volatile than corporate income tax revenues. Hence I argue that switching to a franchise tax
system is not only beneficial in terms of higher revenues with less volatility but also is a fairer
and efficient way of imposing taxes based on economic activity of corporations in the state.
I wish to note here that other options including adjusting the rates to make the franchise tax
revenues revenue neutral over a period of time (instead of it being revenue neutral just for the
2006 year), adjusting rates annually to minimize significantly increasing revenues etc. exist and
could be employed based on the objective being considered I also note that this proposal would
cause one of the advantages of the corporate income tax to be lost, namely distribution out of net
earnings i.e., when companies do well, they pay more and when they do poorly they pay less.
67
Chapter 5
Conclusions
It is well known that state corporate income taxes are distortionary, have high compliance
costs, and are an unreliable source of revenue; they need to be replaced by other forms of
taxation. I argue that replacing the state corporate income tax with a factor-based franchise tax
would significantly improve state taxation of corporations. The proposed change would remove
the distortions inherent in the current corporate income tax, including the highly uneven effective
rates on apportionment factors, and reasonably relate corporate tax liabilities to benefits
received. The compliance cost of the new franchise tax would also be an order of magnitude less
than the corporate income tax, in part because the franchise tax thresholds would remove from
tax smaller corporations, which have disproportionate current compliance costs. The factor-
based franchise tax would have a much more stable base, helping to remove uncertainty from
state budget forecasting and decision making.
Also, state corporate franchise taxes generally reflect a firm's overall economic activity in
a particular state, which, in turn iscommonly measured by the firms property, payroll and sales in
the state. I argue along the lines of McLure (1980, 1981) that the apportioned state corporate
franchise tax is equivalent to a tax on the apportionment factors. The incidence of the first factor
in the above formula, sales is considered to be along the lines of a gross receipts or a standard
sales tax. To the extent that the corporations operating in the taxing state sell in national markets,
it is likely that the tax would be passed on to the consumers in the taxing state and not
throughout the nation. The property portion of the franchise tax can be considered to be
generally similar to that of a standard property tax. Finally, if the labor is mobile between the
68
states, then the argument would be that the portion of the labor that is unable to migrate would
be bearing the payroll related portion of the corporate franchise tax.
From an economic rents argument, the incidence depends on the nature of rents collected.
To the extent that ideas and not goods are being produced, the franchise tax is a tax on labor.
Also, in the very short run, the franchise tax burden may fall on the shareholders. According to
the Miller model, corporate tax is largely borne by corporate shareholders. He argues that
taxpayers hold specialized portfolios according to their tax brackets and status. This applies to
franchise taxation as well. Beyond the short run, the tax is then shifted to capital and labor in the
proportion that labor and capital are used in producing the goods to be sold in the given state.
Understanding who bears the burden of corporate franchise tax provides taxpayers and
policymakers with information on how equitably the tax is distributed. I highlight the need for
further study and research on the subject to better understand the incidence to propose changes in
tax on business or for that matter even change in tax rates.
I use micro-simulation techniques to analyze the stability and volatility of state franchise
tax as compared to the state corporate income tax and my analysis indicates that switching to a
franchise tax system based on a 2006 revenue neutral rate would have resulted in the state
earning over $700 million in corporate revenue over the period under consideration. Also, the
mean corporate income tax revenue per year was $358.8 million where as the mean corporate
franchise tax revenue was substantially higher at $440.1 million. I also show that corporate
franchise tax revenues are less volatile than corporate income tax revenues. Hence I argue that
switching to a franchise tax system is not only beneficial in terms of higher revenues with less
volatility, but also is a fairer and more efficient way of imposing taxes based on economic
69
activity of corporations in the state. I further argue that this proposal can be adopted in most
other state that levy corporate income taxes with changes to rate, thresholds and structure based
on the corporate structure that exists in that state. While further research and investigation is
needed in the state that intends to adopt this proposal, I feel that similar results could be achieved
in terms of making this a more benefits based tax.
I wish to note here that since this proposal alters the composition of tax across the
different sectors differently, general equilibrium analysis using tools like IMPLAN could be
undertaken to better understand the secondary effects of the introduction of this new tax scheme
into the economy including understanding total employment (number) as well as wage and salary
implications.
70
References
Auerbach, Alan J. (1983). "Taxation, Corporate Financial Policy, and the Cost of Capital," Journal of Economic Literature, 21: 905-940.
Auerbach, Alan J. (1984) The Economic Effects of Corporate Income Tax: Changing Revenues and Changing Views. NBER Working Paper No. 1519. Cambridge, MA. National Bureau of Economic Research,.
Auerbach, Alan (1996). “Tax Reform, Capital Allocation, Efficiency, and Growth.” In
Economic Effects of Fundamental Tax Reform edited by Henry J. Aaron and William Gale (Brookings Institution Press: Washington, DC): 29-73.
Auerbach, Alan J. (2006). “Who Bears the Corporate Tax? A Review of What I Know.”
In Tax Policy and The Economy Volume 20 edited by James M. Poterba (National Bureau of Economic Research: Cambridge, MA):1-40.
Auten, Gerald and Laura Kalambokidis (2000). “The Effect on the Distribution of the
Tax Burden of Replacing the Corporate Income Tax with a Consumption Tax.” Mimeo presented at the ASSA Meetings, January, 1996, revised March, 2000.
Ballentine, Gregory (1978). “The Incidence of a Corporation Income Tax in a Growing
Economy.” Journal of Political Economy 86:863-875. Bayoumi, Tamim (1997). Financial Integration and Real Activity. University of
Michigan Press, Ann Arbor. Bernheim, B. Douglas (1981). "A Note on Dynamic Tax Incidence." Quarterly Journal of
Economics 96(4): 705-23. Blanchard, Olivier and Francesco Giavazzi. (2002). “Current Account Deficits in the
Euro Area: the End of the Feldstein-Horioka Puzzle?” Brookings Papers on Economic Activity 2: 147-209.
Boadway, Robin (1979). “Long-Run Tax Incidence: A Comparative Dynamic
Approach.” Review of Economic Studies 46:505-511. Bradford, David F. (1978). “Factor Prices May be Constant but Factor Returns Are Not.”
Economics Letters 1(3):199-203. Brunori, David (2002). Stop Taxing Corporate Income, State Tax Notes, June 25, 2002. Chamley, Christophe (1986). “Optimal Taxation of Capital Income in General
Equilibrium with Infinite Lives.” Econometrica, 54(3):607-622,.

71
Coakley, Jerry, F. Kulasi and R. Smith (1998). “The Feldstein-Horioka Puzzle and
Capital Mobility: a Review.” International Journal of Finance and Economics (3):169-188. Conesa, Juan, Sagiri Kitao and Dirk Krueger (2007). “Taxing Capital? Not a Bad Idea
After All!” NBER Working Paper 12880. Congressional Budget Office. (1996). The Incidence of the Corporate Income Tax
Congressional Budget Office, Washington, D.C.. Congressional Budget Office. (2005). Corporate Income Tax Rates: International
Comparisons. Congressional Budget Office, Washington, D.C.. Department of the Treasury (2000). Report to the Congress on Depreciation Recovery
Periods and Methods, July. Diamond, Peter A. (1970). “Incidence of an Interest Income Tax.” Journal of Economic
Theory 2:211-224. Djankov, Sineon, Tim Ganser, Caralee McLiesh, Rita Ramalho, and Andrei Shleifer
(2008), "The Effect of Corporate Taxes on Investment and Entrepreneurship," NBER Working paper 13756.
Feldstein, Martin (1974). “Incidence of a Capital Income Tax in a Growing Economy
with Variable Savings Rates.” The Review of Economic Studies 74:505-513. Feldstein, Martin (1977). "The Surprising Incidence of a Tax on Pure Rent: A New
Answer to an Old Question." Journal of Political Economy 85(2): 349-60.
Feldstein, Martin (1999). Tax Avoidance and the Deadweight Loss of the Income Tax." Review of Economics and Statistics 81:4.: 674-680.
Feldstein, Martin (2005). “Monetary Policy in a Changing International Environment:
the Role of Capital Flows.” NBER Working Paper 11856. Feldstein, Martin and Charles Horioka. (1980). “Domestic Saving and International
Capital Flows.” Economic Journal 90:314-329. Fox, William F., LeAnn Luna, and Matthew N. Murray (2005). "How Should a
Subnational Corporate Income Tax on Multistate Businesses Be Structured?" National Tax Journal 58:1: 139-159.
Fox, William F., LeAnn Luna, and Matthew N. Murray. (2007) Emerging State Business
Tax Policy: More of the Same, or Fundamental Change? State Tax Notes. 393-405, May 7, 2007.
72
Fullerton, Don and Gilbert E. Metcalf (2002). “Tax Incidence.” In Handbook of Public
Economics: Volume 4, edited by Alan Auerbach and Martin Feldstein. (Elsevier Science Publishers: Amsterdam), 1787-1872.
General Accounting Office (GAO) (2002). Financial Statement Restatements: Trends,
Market Impacts, Regulatory Responses, and Remaining Challenges. Washington, D.C. Government Accounting Office (2005). Tax Expenditures Represent a Substantial
Federal Commitment and Need to Be Re-Examined. Government Performance and Accountability, GAO-05-690. http://www.gao.gov/new.items/d05690.pdf.
Gordon, Roger H. (1985). “Taxation of Corporate Capital Income: Tax Revenues versus
Tax Distortions.” Quarterly Journal of Economics 100(1):1-27. Gordon, Roger H. (1986). A Critical Look at Formula Apportionment. In Final Report of
the Minnesota Tax Study Commission: Volume 2: Staff Papers, edited by Robert D. Ebel and Therese J. McGuire, 209-222. St. Paul, MN.: Butterworths.
Goulder, L., J. Shoven and J. Whalley (1983). “Domestic Tax Policy and the Foreign
Sector.” In Simulation Methods in Tax Policy Analysis, edited by Martin Feldstein. (National Bureau of Economic Research, University of Chicago Press), 333-364.
Graetz, Michael J. (1995). “Paint by Numbers Lawmaking.” Columbia Law Review
95(3): 609.
Graetz, Michael J. (1999). The U.S. Income Tax: What It Is, How It Got That Way, and Where I Go From Here. New York: Norton.
Graetz, Michael J. (2001). “The David R. Tillinghast Lecture: Taxing International
Income— Inadequate Principles, Outdated Concept, and Unsatisfactory Policy.” Tax Law Review 54(3): 261.
Graetz, Michael J. (2002). “100 Million Unnecessary Returns: A Fresh Start for the U.S. Tax System.” Yale Law Journal 112(2): 261.
Graetz, Michael J. (2005). A Fair and Balanced Tax System for the Twenty-First Century. In Toward Fundamental Tax Reform, ed. Auerbach, Alan J. and Kevin A. Hassett, 48–69. Washington, D.C.: AEI Press.
Graetz, Michael J. (2005). Testimony before the President’s Advisory Panel on Tax Reform. http://www.tax.reformpanel.gov/meetings/docs/ graetz_052005.ppt.
73
Graetz, Michael J., and Alvin C. Warren, Jr. (1998). Integration of the U.S. Corporate and Individual Income Taxes. The Treasury Department and American Law Institute Reports. Washington D.C.: Tax Analysts.
Gravelle, Jane G., and Kent A. Smetters. (2006). “Does the Open Economy Assumption
Really Mean that Labor Bears the Burden of a Capital Income Tax?” Advances in Economic Analysis & Policy 6(1):article 3, available at http://www.bepress.com/bejeap/advances/vol6/iss1/art3.
Grubert, Harry and John Mutti. (1994). “International Aspects of Corporate Tax
Integration: The Contrasting Role of Debt and Equity Flows.” National Tax Journal 47:111-133. Gupta, Sanjay, and Lilliam F. Mills (2003). Does Disconformity in State Corporate
Income Tax Systems affect Compliance Cost Burdens? National Tax Journal 56(2): 355–72. Gupta, Sanjay, Jared Moore, Jeffrey Gramlich, and Mary Ann Hofmann (2009).
Empirical Evidence on the Revenue Effects of State Corporate Income Tax Policies, National Tax Journal 62(2) 237-267, June, 2009.
Harberger, Arnold C. (1962). “The Incidence of the Corporation Income Tax.” Journal of
Political Economy 70:215-240. Harberger, Arnold C. (1995). “The ABCs of Corporate Tax Incidence: Insights into the
Open Economy Case.” Tax Policy and Economic Growth (Washington, D.C.: American Council for Capital Formation), 51-73.
Harberger, Arnold C. (2006). “Corporation Tax Incidence: Reflections on What is
Known, Unknown, and Unknowable.” Mimeo, University of California, Los Angeles. April. Johansson, Asa, Christopher 1. Heady, Jens Arnold, Bert Brys, and Laura Vartia (2008).
Tax and Economic Growth. OECD Economics Department Working Paper No. 620. Judd, Kenneth L. 1985. “Redistributive Taxation in a Simple Perfect Foresight Model.”
Journal of Public Economics 28:59-83. Katz, Michael, and Harvey S. Rosen 1985. "Tax Analysis in an Oligopoly Model." Public
Finance Quarterly 13(1): 3-19. Kay, John A., and Michael J. Keen 1983. "How Should Commodities Be Taxed?"
European Economic Review 23(3): 339-358. Kotlikoff, Laurence J. and Lawrence H. Summers. 1979. “Tax Incidence in a Life Cycle
Model with Variable Labor Supply.” The Quarterly Journal of Economics 93:705-718.
74
Kotlikoff, Laurence J. and Lawrence H. Summers. 1987. “Tax Incidence.” In Handbook of Public Economics: Volume 2, edited by Alan Auerbach and Martin Feldstein. (Elsevier Science Publishers: Amsterdam).
Krzyzaniak, Marian, and Richard A. Musgrave. 1963. The Shifting of the Corporate
Income Tax (Baltimore, MD: Johns Hopkins Press). Krzyzaniak, Marian, and Richard A. Musgrave 1970. Corporation Tax Shifting: A
Response. The Journal of Political Economy 78(4): 768-773 Mazerov, Michael (2009). A Majority of States Have Now Adopted a Key Corporate Tax
Reform – Combined Reporting. Center for Budget and Policy Priorities. McLure, Charles E., Jr. (1974). "A Diagrammatic Exposition of the Harberger Model
with One Immobile Factor." Journal of Political Economy 82(1): 56-82. McLure, Charles E., Jr., and Wayne R. Thirsk (1975). "A Simplified Exposition of the
Harberger Model, I: Tax Incidence." National Tax Journal 28(1): 1-27. McLure, Charles E. Jr. (1980). The State Corporate Income Tax: Lamb in Wolves’
Clothing. In The Economics of Taxation, edited by Henry J. Aaron and Michael J. Boskin, 327-348. Washington, DC.: The Brookings Institution.
McLure, Charles E. Jr. (1981). The Elusive Incidence of the Corporate Income Tax: The State Case. NBER Working Paper No. 616. Cambridge, MA. National Bureau of Economic Research.
Melvin, James R. (1982). “The Corporate Income Tax in an Open Economy.” Journal of
Public Economics 17:393-403. Miller, Merton. (1977). “Debt and Taxes.” Journal of Finance 32(2):261-276. Mutti, John and Harry Grubert (1985). “The Taxation of Capital Income in an Open
Economy: the Importance of Resident-Nonresident Tax Treatment.” Journal of Public Economics 27:291-309.
Musgrave, Richard A., The Theory of Public Finance, (New York: McGraw-Hill, 1959) Pudney, Stephen & Sutherland, Holly (1994). How reliable are microsimulation results? :
An analysis of the role of sampling error in a U.K. tax-benefit model, Journal of Public Economics 53(3), pages 327-365.
Randolph, William C. (2006). “International Burdens of the Corporate Income Tax.”
Congressional Budget Office Working Paper 2006-09.
75
Shoven, John B. (1976). "The Incidence and Efficiency Effects of Taxes on Income from
Capital." Journal of Political Economy 84(6): 1261-83. Shoven, John B., and John Whalley. 1984. "Applied General Equilibrium Models of
Taxation and International Trade: An Introduction and Survey." Journal of Economic Literature 22(3): 1007-1051.
Slemrod, Joel, and Marsha Blumenthal (1993). The Income Tax Compliance Cost of Big
Business. Washington, DC. Tax Foundation.
Spry, John A. (2009). Corporate Tax Reform in the States. Presented at the Annual Conference on Taxation of the National Tax Association.
Stiglitz, Joseph E. (1973). “Taxation, Corporate Financial Policy and the Cost of
Capital.” Journal of Public Economics 2(1):1-34. Sullivan, Martin A. (2006). “A New ERA in Corporate Taxation.” Tax Notes Today 20-
8. U.S. Department of the Treasury. (1992). Integration of the Individual and Corporate Tax
Systems: Taxing Business Income Once. http://www.ustreas.gov/offices/tax-policy/library/ integration-paper/.
Vandendorpe, Adolf L., and Ann F. Friedlaender. (1976). "Differential Incidence in the
Presence of Initial Distorting Taxes." Journal of Public Economics 6(3): 205-229. Warren, Alvin C. Jr. (1993). Integration of Individual and Corporate Income Taxes.
Philadelphia: American Law Institute. Whalley, John (1980). “Discriminatory Features of Domestic Factor Tax Systems in a
Goods Mobile – Factors Immobile Trade Model: An Empirical General Equilibrium Approach.” Journal of Political Economy 88: 1177-1202.
Zodrow, George R. (1999) State Sales and Income Taxes: An Economic Analysis.
College Station, Texas: Texas A&M University Press.