A New Agenda for Addressing the Impacts and Management … · A New Agenda for Addressing the...
93
A New Agenda for Addressing A New Agenda for Addressing the Impacts and Management of the Impacts and Management of Coastal Invasions Coastal Invasions Edwin Grosholz Edwin Grosholz Department of Environmental Science Department of Environmental Science and Policy and Policy University of California, Davis USA University of California, Davis USA
Transcript of A New Agenda for Addressing the Impacts and Management … · A New Agenda for Addressing the...
A New Agenda for Addressing A New Agenda for Addressing the Impacts and Management of the Impacts and Management of
Coastal InvasionsCoastal Invasions
Edwin GrosholzEdwin Grosholz
Department of Environmental Science Department of Environmental Science and Policyand Policy
University of California, Davis USAUniversity of California, Davis USA

Consequences of Consequences of Biological InvasionsBiological Invasions•• Biological invasions are Biological invasions are ““nonnon--native speciesnative species””
moved beyond their normal range limits due moved beyond their normal range limits due to human activitiesto human activities
•• Biological invasions are the second most Biological invasions are the second most important threat to global biodiversity, behind important threat to global biodiversity, behind habitat loss (Chapin 2000, Sala 2000)habitat loss (Chapin 2000, Sala 2000)
•• In the U.S., 10% of all plants and animals are In the U.S., 10% of all plants and animals are introduced (OTA 1993)introduced (OTA 1993)
•• Introduced species are a significant risk factor Introduced species are a significant risk factor for > 40% of listed threatened and for > 40% of listed threatened and endangered species in the U.S. (Wilcove et al. endangered species in the U.S. (Wilcove et al. 1998)1998)

Invasions and Natural Invasions and Natural Range ExpansionsRange Expansions•• Movement of species beyond their Movement of species beyond their
normal range is naturally occurring normal range is naturally occurring process (range expansion) process (range expansion)
•• For marine/estuarine species, human For marine/estuarine species, human activities have increased the rate of activities have increased the rate of introduction by ~10introduction by ~1066
•• Increase above natural rates is Increase above natural rates is similar to human mediated increase similar to human mediated increase in extinction ratesin extinction rates

The Extent of Invasions in The Extent of Invasions in Coastal SystemsCoastal Systems
•• Coastal bays and estuaries are among Coastal bays and estuaries are among most heavily invaded aquatic habitatsmost heavily invaded aquatic habitats
•• There are ~500 spp. of introduced There are ~500 spp. of introduced species in coastal U.S. watersspecies in coastal U.S. waters
•• There is a new species introduced into There is a new species introduced into San Francisco Bay every 14 weeks San Francisco Bay every 14 weeks (Cohen and Carlton 1995)(Cohen and Carlton 1995)

Economic Consequences of Economic Consequences of Biological InvasionsBiological Invasions
•• Invasive species cost the worldInvasive species cost the world’’s s economy hundreds of billions per year economy hundreds of billions per year (IUCN)(IUCN)
•• In the U.S., invasive species cost $128 In the U.S., invasive species cost $128 billion per year (Pimentel et al. 2000) billion per year (Pimentel et al. 2000)
•• Zebra mussels in the Great Lakes cost Zebra mussels in the Great Lakes cost >$100 million per year in U.S. (Michigan >$100 million per year in U.S. (Michigan Sea Grant)Sea Grant)

OutlineOutline•• Ecological impacts of introduced speciesEcological impacts of introduced species
–– Effects from populations to ecosystemsEffects from populations to ecosystems–– Specific example of Specific example of Spartina Spartina cordgrass in San cordgrass in San
Francisco Bay, CA, USAFrancisco Bay, CA, USA•• Economic impacts of introduced speciesEconomic impacts of introduced species
–– Summary of examples of estimated impactsSummary of examples of estimated impacts–– Formal analysis of economic impacts of Formal analysis of economic impacts of
European green crab in U.S. European green crab in U.S. •• A new agenda for invasive species A new agenda for invasive species
researchresearch–– Focusing science to assist invasive species Focusing science to assist invasive species
managementmanagement

Examples of Invasion Consequences
Grosholz , E. 2002. Trends Ecol. Evol.

EstuarineEstuarine--WideWide Ecosystem ImpactsEcosystem Impacts
•• In 1986, In 1986, Corbula (=Potamocorbula)Corbula (=Potamocorbula) amurensisamurensis first found in San Francisco Bay, California first found in San Francisco Bay, California
•• Densities of thousands per mDensities of thousands per m22, filter entire , filter entire water column every three days (Kimmerer et al water column every three days (Kimmerer et al 1994) 1994)
•• Clams can remove 8% of all copepod nauplii Clams can remove 8% of all copepod nauplii (larvae) per day(larvae) per day
•• Three native copepods and phytoplankton Three native copepods and phytoplankton abundances dropped 50abundances dropped 50--90% (Alpine and 90% (Alpine and Cloern 1992)Cloern 1992)

Ecosystem Ecosystem ImpactsImpacts

New Invaders Accelerating New Invaders Accelerating Older InvasionsOlder Invasions
•• Hundreds of species have accumulated in Hundreds of species have accumulated in coastal waters worldwidecoastal waters worldwide
•• Currently most are benign invasions with little Currently most are benign invasions with little impactimpact
•• New invasions can change the habitat facilitating New invasions can change the habitat facilitating other invasionsother invasions
•• Positive feedback among invasions could result Positive feedback among invasions could result in extensive ecosystem degradation (invasional in extensive ecosystem degradation (invasional meltdown?)meltdown?)
1111

San Francisco Bay
Bodega Harbor
Invasion of European Invasion of European Green CrabGreen Crab
Carcinus maenas
Eastern Gem Clam Eastern Gem Clam ((Gemma gemmaGemma gemma))
Native Clam (Nutricola confusa)
Native Clam (Nutricola tantilla)

Indirect Effects Produce Positive Indirect Effects Produce Positive Feedbacks Among InvadersFeedbacks Among Invaders•• Introduced Introduced Gemma gemma Gemma gemma was benign invasion was benign invasion
in Bodega Harbor, California USA with restricted in Bodega Harbor, California USA with restricted distribution for >40 yearsdistribution for >40 years
•• European green crabs invaded system in 1994European green crabs invaded system in 1994
–– Reduced density of native Reduced density of native Nutricola Nutricola by >90% by >90% (but not (but not GemmaGemma) within two years) within two years
•• Indirect effects of green crab invasionIndirect effects of green crab invasion
–– Invasion of Invasion of Gemma Gemma rapidly accelerated rapidly accelerated throughout Bodega Harborthroughout Bodega Harbor
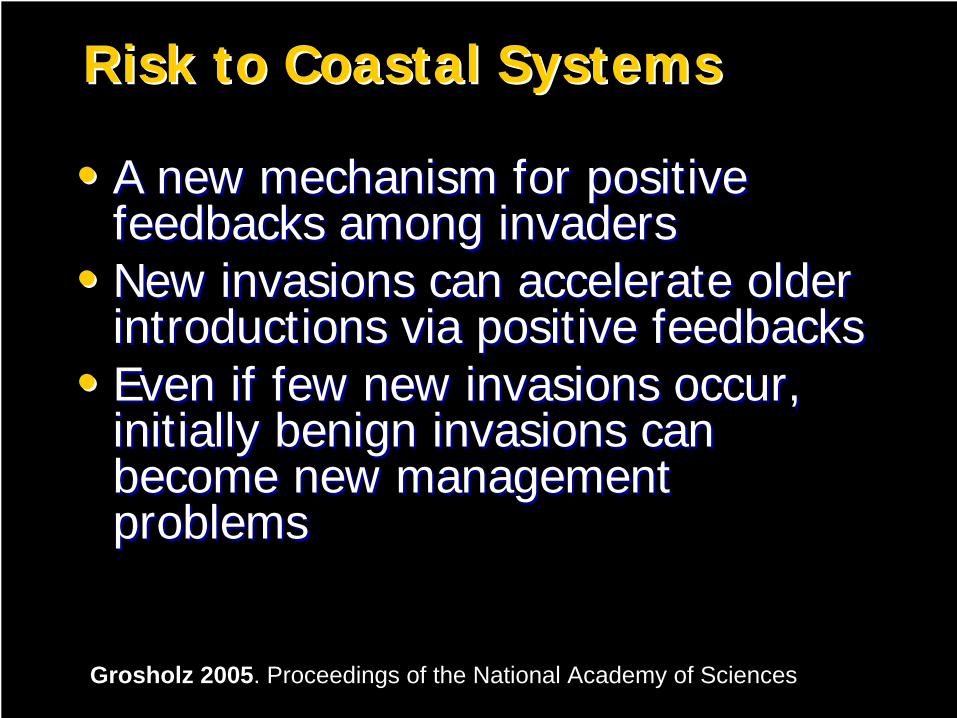
Risk to Coastal SystemsRisk to Coastal Systems
•• A new mechanism for positive A new mechanism for positive feedbacks among invadersfeedbacks among invaders
•• New invasions can accelerate older New invasions can accelerate older introductions via positive feedbacksintroductions via positive feedbacks
•• Even if few new invasions occur, Even if few new invasions occur, initially benign invasions can initially benign invasions can become new management become new management problemsproblems
Grosholz 2005. Proceedings of the National Academy of Sciences

Risks to Fisheries and Risks to Fisheries and Offshore SystemsOffshore Systems•• Nearshore bays and coastal habitats are Nearshore bays and coastal habitats are
more invaded than deeper subtidal and more invaded than deeper subtidal and offshore habitatsoffshore habitats
•• However, these habitats are already being However, these habitats are already being negatively impacted by a small but negatively impacted by a small but significant number of invasionssignificant number of invasions
1515

Invasions of Invasions of Gelatinous Gelatinous ZooplanktonZooplankton•• Offshore areas are subject to invasion by Offshore areas are subject to invasion by
gelatinous zooplanktongelatinous zooplankton•• The spotted jelly The spotted jelly Phyllorhiza punctataPhyllorhiza punctata has has
caused significant problems for shrimp fishers caused significant problems for shrimp fishers in the Gulf of Mexico by fouling nets ($10 in the Gulf of Mexico by fouling nets ($10 million in losses, Purcell et al. 2007)million in losses, Purcell et al. 2007)
•• Data suggests ctenophores Data suggests ctenophores Mnemiopsis leidyi Mnemiopsis leidyi contributed to the collapse of fisheries in contributed to the collapse of fisheries in Black and Caspian seas (Daskalov et al. Black and Caspian seas (Daskalov et al. 2007)2007)

Invasive Tunicates Invasive Tunicates and Offshore and Offshore FisheriesFisheries
•• Invasive fouling species are Invasive fouling species are increasingly becoming problems in increasingly becoming problems in deeper, offshore areasdeeper, offshore areas
•• Didemnum Didemnum sp. is established in benthic sp. is established in benthic habitats (to 81 m) in important fishing habitats (to 81 m) in important fishing areas including Stellwagen, Tillies and areas including Stellwagen, Tillies and GeorgeGeorge’’s Bank (Bullard et al. 2007)s Bank (Bullard et al. 2007)
•• Up to 50Up to 50--90% cover in some areas 90% cover in some areas (Bullard et al. 2007)(Bullard et al. 2007)

Undaria Undaria in in ArgentinaArgentina
•• Undaria pinnatifida Undaria pinnatifida grows abundantly in grows abundantly in the Golfo Nuevo, adjacent to Puerto the Golfo Nuevo, adjacent to Puerto Madryn, ArgentinaMadryn, Argentina
•• It seasonally senesces and accumulates in It seasonally senesces and accumulates in large mats with significant negative large mats with significant negative impacts on benthic communities and impacts on benthic communities and fisheries (Cassas et al. 2004)fisheries (Cassas et al. 2004)
1818

Invasive Algae Invasive Algae in the in the MediterraneanMediterranean
•• Invasive Invasive Caulerpa taxifolia Caulerpa taxifolia rapidly covered rapidly covered thousands of hectares of the northern thousands of hectares of the northern Mediterranean in the 1980Mediterranean in the 1980--90s90s
•• Grow to depth of 100 m impacting native Grow to depth of 100 m impacting native species (overgrowth, Ceccherelli et al. species (overgrowth, Ceccherelli et al. 2002) and local fisheries (Meinesz 1999)2002) and local fisheries (Meinesz 1999)
•• Subsequent invasion by Subsequent invasion by C. racemosa C. racemosa is is adding to impacts (Piazzi et al. 2005)adding to impacts (Piazzi et al. 2005) 1919

Plant Invasions in Plant Invasions in Coastal SystemsCoastal Systems
• Introduced plants can strongly influence food webs (ecosystem engineers)– Change primary producers– Alter physical environment (light penetration,
water flow)– Provide habitat or trophic support for other
species including invaders• Alter biogeochemical processes
– Detrital inputs– Nutrient availability– Carbon and nitrogen storage, cycling

San Francisco Bay
Pacific Ocean
Invasive Salt Marsh CordgrassInvasive Salt Marsh Cordgrass in San Francisco Bay, CA, USAin San Francisco Bay, CA, USA

Spartina Spartina Invading Open MudflatInvading Open Mudflat

Shorebirds Avoiding Shorebirds Avoiding SpartinaSpartina

Invasion of Hybrid Invasion of Hybrid Spartina Spartina in San Francisco Bayin San Francisco Bay
•• Spartina alterniflora Spartina alterniflora was intentionally introduced was intentionally introduced from the eastern U.S. (native) in 1975 by US from the eastern U.S. (native) in 1975 by US Army Corp of Engineers for marsh restorationArmy Corp of Engineers for marsh restoration
•• It hybridized with native It hybridized with native Spartina foliosa Spartina foliosa (locally (locally extinct at some sites) and spread quicklyextinct at some sites) and spread quickly
•• Hybrid Hybrid Spartina Spartina has greater tidal range (higher has greater tidal range (higher and lower) than native plants and lower) than native plants
•• Invades unvegetated mudflats (focus today) and Invades unvegetated mudflats (focus today) and upper marsh displacing native plantsupper marsh displacing native plants

HybridSpartina
System MetabolismSediment Biogeochemistry
Other Invasions
7.5
10
12.5
15
17.5
20
δ15N
-22 -20 -18 -16 -14 -12δ13C
Spartinahybrid live
Spartinahybrid dead
Ulva
Cyanobacteria/Mixed mat
POMDiatoms
SOM
HYBRID
Gnorimosphaeroma
Eteone dilatae
Boccarida
CapitellaNereis
OrchestiaTubificidae
Venerupis
Exogone
Urosalpinx
trophic shift
Food Web Structure
Invertebrate Communities
Migratory Shorebirds Resident Canada Geese
Impacts of Impacts of SpartinaSpartina InvasionInvasion

Neira, Grosholz, Levin and Blake. 2006. Ecological Applications.
Physical Changes Following Spartina Invasion

0
10
20
30
40
50
Hybrid Mudflat
pore
wat
er N
H 4+
0200400600800
10001200
Hybrid Mudflat
pore
wat
er S2-
Sediment PorewaterSediment Porewater
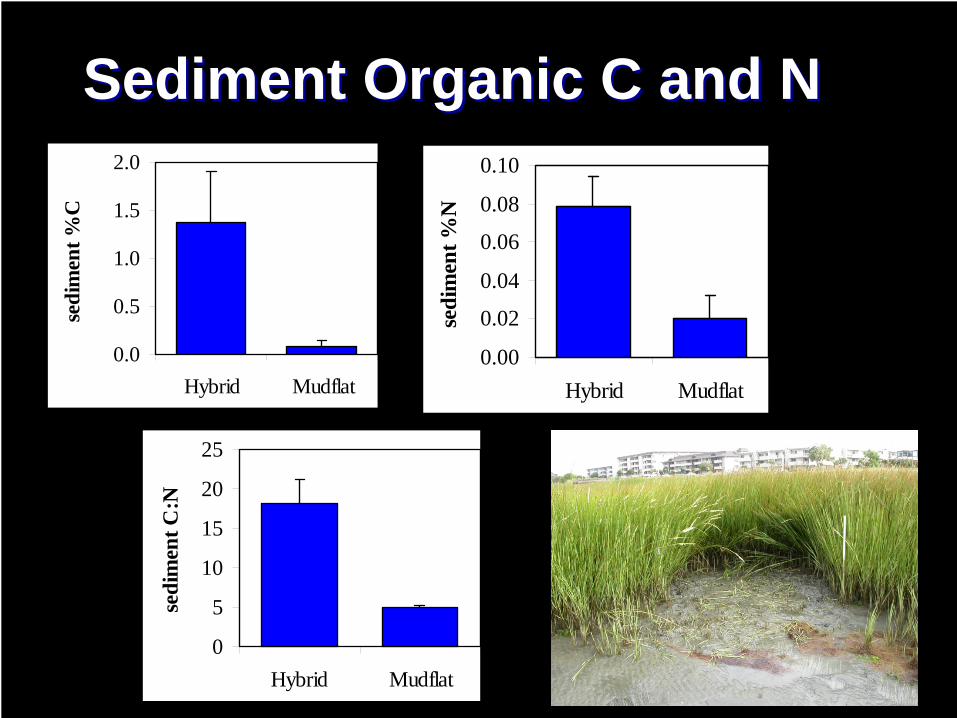
0.00
0.02
0.04
0.06
0.08
0.10
Hybrid Mudflat
sedi
men
t %N
0.0
0.5
1.0
1.5
2.0
Hybrid Mudflat
sedi
men
t %C
0
5
10
15
20
25
Hybrid Mudflat
sedi
men
t C:N
Sediment Organic C and NSediment Organic C and N

HybridSpartina
System MetabolismSediment Biogeochemistry
Other Invasions
7.5
10
12.5
15
17.5
20
δ15N
-22 -20 -18 -16 -14 -12δ13C
Spartinahybrid live
Spartinahybrid dead
Ulva
Cyanobacteria/Mixed mat
POMDiatoms
SOM
HYBRID
Gnorimosphaeroma
Eteone dilatae
Boccarida
CapitellaNereis
OrchestiaTubificidae
Venerupis
Exogone
Urosalpinx
trophic shift
Food Web Structure
Invertebrate Communities
Migratory Shorebirds Resident Canada Geese
Impacts of Impacts of SpartinaSpartina InvasionInvasion

System MetabolismSystem Metabolism
•• Measure COMeasure CO22 flux over flux over time in chamberstime in chambers
•• Compare estimates in Compare estimates in light (photosynthesis) light (photosynthesis) with dark with dark measurements measurements (respiration) (respiration)

System MetabolismSystem Metabolism
-600-500-400-300
-200-100
0
Hybrid Mudflatsedi
men
t GPP
(mg
C m
-2 d
-1)
-600
-400
-200
0
200
400
600
Hybrid Mudflat
net m
etab
olism
(mg
C m
-2 d
-1)
Microalgal productiongreater in mudflat
Sediments only (no vascular plant PP)Switch from autotrophic mudflatto heterotrophic hybrid meadow

HybridSpartina
System MetabolismSediment Biogeochemistry
Other Invasions
7.5
10
12.5
15
17.5
20
δ15N
-22 -20 -18 -16 -14 -12δ13C
Spartinahybrid live
Spartinahybrid dead
Ulva
Cyanobacteria/Mixed mat
POMDiatoms
SOM
HYBRID
Gnorimosphaeroma
Eteone dilatae
Boccarida
CapitellaNereis
OrchestiaTubificidae
Venerupis
Exogone
Urosalpinx
trophic shift
Food Web Structure
Invertebrate Communities
Migratory Shorebirds Resident Canada Geese
Impacts of Impacts of SpartinaSpartina InvasionInvasion

Neira, Levin, and Grosholz. 2005. Mar. Ecol. Prog. Ser.
Hybrid Mudflat0
100000
200000
300000
400000
500000
600000Macrofaunal Density
Mea
n D
ensi
ty (#
/ m2 )
p = 0.008
Invertebrate DensityInvertebrate Density

HybridSpartina
System MetabolismSediment Biogeochemistry
Other Invasions
7.5
10
12.5
15
17.5
20
δ15N
-22 -20 -18 -16 -14 -12δ13C
Spartinahybrid live
Spartinahybrid dead
Ulva
Cyanobacteria/Mixed mat
POMDiatoms
SOM
HYBRID
Gnorimosphaeroma
Eteone dilatae
Boccarida
CapitellaNereis
OrchestiaTubificidae
Venerupis
Exogone
Urosalpinx
trophic shift
Food Web Structure
Invertebrate Communities
Migratory Shorebirds Resident Canada Geese
Impacts of Impacts of SpartinaSpartina InvasionInvasion

Relative Abundance of Native and Introduced Crabs
# C
rabs
/ Tr
ap
0
1
2
3
4
Carcinus HemigrapsusIntroduced Native
HybridMudflat
p=0.002
p=0.36


Abundance of Introduced Atlantic Gastropods
Treatment
Dowels Mudflat Clipped Unclipped
Abu
ndan
ce (#
/ 1.
0 m
2 )
0
10
20
30
40
(Control) (Control)
IlyanassaUrosalpinx
a
b b
c
x
yz
y

HybridSpartina
System MetabolismSediment Biogeochemistry
Other Invasions
7.5
10
12.5
15
17.5
20
δ15N
-22 -20 -18 -16 -14 -12δ13C
Spartinahybrid live
Spartinahybrid dead
Ulva
Cyanobacteria/Mixed mat
POMDiatoms
SOM
HYBRID
Gnorimosphaeroma
Eteone dilatae
Boccarida
CapitellaNereis
OrchestiaTubificidae
Venerupis
Exogone
Urosalpinx
trophic shift
Food Web Structure
Invertebrate Communities
Migratory Shorebirds Resident Canada Geese
Impacts of Impacts of SpartinaSpartina InvasionInvasion

Food Web Changes Using Food Web Changes Using Stable Isotope TracersStable Isotope Tracers
•• 1515NN labeled ammonium labeled ammonium nitrate to label nitrate to label Spartina Spartina detritusdetritus
•• 1313CC labeled sodium labeled sodium bicarbonate to label bicarbonate to label microalgaemicroalgae
•• Spray Spray 1313C bicarbonate on C bicarbonate on surface (uptake by surface (uptake by microalgae)microalgae)
•• Place Place 1515N detritus in N detritus in surface sediments and in surface sediments and in below ground litter bagsbelow ground litter bags

0
10
20
30
Δ δ
13 C
G. j
apon
ica
G. g
emm
a
M. p
etal
um
P. c
ornu
ta
P. n
ucha
lis
S. b
ened
icti
Thar
yx sp
.
Ven
erup
is sp
.
H. f
ilifo
rmis
Cap
itella
sp.
T. d
iver
sus
Tubi
ficid
ae
Tubi
ficoi
des s
p.
Spha
eros
yllis
sp.
E. c
alifo
rnic
a
Gly
cind
e sp
.
H. i
mbr
icat
a
N. s
ucci
nea
Ant
hozo
a
Taxon
Tidal Flat 17 da
4 da
0
10
20
30
Δ δ
13 C
G. j
apon
ica
G. g
emm
a
M. p
etal
um
P. c
ornu
ta
P. n
ucha
lis
S. b
ened
icti
Thar
yx sp
.
Vene
rupi
s sp.
H. f
ilifo
rmis
Cap
itella
sp.
T. d
iver
sus
Tubi
ficid
ae
Tubi
ficoi
des s
p.
Spha
eros
yllis
sp.
E. c
alifo
rnic
a
Gly
cind
e sp
.
H. i
mbr
icat
a
N. s
ucci
nea
Anth
ozoa
Hybrid17 da
4 da
Levin, Neira and Grosholz. 2006. Ecology.
1313C UptakeC Uptake

0
20
40
δ15 N
SF SSDF C/O
Time 0
0
20
40
δ15 N
SF SSDF C/O
74 da
0
20
40
δ15 N
SF SSDF C/O
Time 0
0
20
40
60δ1
5 N
SF SSDF C/O
74 da
1
1
P = 0.134
P = 0.001
P = 0.183
P = 0.134
Levin, Neira and Grosholz. 2006. Ecology
HybridArea
TidalMudflat
1515N UptakeN Uptake

Food Web EffectsFood Web Effects
•• Microalgae consumed more by surface feeders Microalgae consumed more by surface feeders and and Spartina Spartina detritus more by subsurface detritus more by subsurface feedersfeeders
•• Invaded areas have much higher densities of Invaded areas have much higher densities of subsurface feeders and lower densities of subsurface feeders and lower densities of surface feederssurface feeders
•• Spartina Spartina has shifted the system from a largely has shifted the system from a largely primary production based system to a largely primary production based system to a largely detrital based systemdetrital based system

HybridSpartina
System MetabolismSediment Biogeochemistry
Other Invasions
7.5
10
12.5
15
17.5
20
δ15N
-22 -20 -18 -16 -14 -12δ13C
Spartinahybrid live
Spartinahybrid dead
Ulva
Cyanobacteria/Mixed mat
POMDiatoms
SOM
HYBRID
Gnorimosphaeroma
Eteone dilatae
Boccarida
CapitellaNereis
OrchestiaTubificidae
Venerupis
Exogone
Urosalpinx
trophic shift
Food Web Structure
Invertebrate Communities
Migratory Shorebirds Resident Canada Geese
Impacts of Impacts of SpartinaSpartina InvasionInvasion

What are the Consequences of Hybrid What are the Consequences of Hybrid Spartina Spartina Invasion for Shorebirds?Invasion for Shorebirds?

Quantifying Spartina Spread with Tidal Elevation Estimated from LIDAR
Estimate Increase in Area Invaded

Shorebird ImpactsShorebird Impacts
•• Invertebrate biomass declines with tidal Invertebrate biomass declines with tidal height height
•• Time available for foraging by shorebirds Time available for foraging by shorebirds declines with tidal heightdeclines with tidal height
•• Spartina Spartina colonizes upper intertidal areas colonizes upper intertidal areas leaving areas with longer inundation leaving areas with longer inundation period and fewer invertebratesperiod and fewer invertebrates

HybridSpartina
System MetabolismSediment Biogeochemistry
Other Invasions
7.5
10
12.5
15
17.5
20
δ15N
-22 -20 -18 -16 -14 -12δ13C
Spartinahybrid live
Spartinahybrid dead
Ulva
Cyanobacteria/Mixed mat
POMDiatoms
SOM
HYBRID
Gnorimosphaeroma
Eteone dilatae
Boccarida
CapitellaNereis
OrchestiaTubificidae
Venerupis
Exogone
Urosalpinx
trophic shift
Food Web Structure
Invertebrate Communities
Migratory Shorebirds Grazing Canada Geese
Impacts of Impacts of SpartinaSpartina InvasionInvasion


Goose Grazing Preferences on Intact Clones
Stems Leaves
Rem
aini
ng P
lant
s (%
)
0
20
40
60
80
100
HybridS. foliosa
*
***
P<0.01
P<0.0001

Effects of Goose Herbivory on Hybrid Spartina Lateral Expansion
TreatmentExclusion Control
Hyb
rid E
xpan
sion
(m /y
r)
0.0
0.5
1.0
1.5
2.0
2.5
p<0.005

HybridSpartina
System MetabolismSediment Biogeochemistry
Other Invasions
7.5
10
12.5
15
17.5
20
δ15N
-22 -20 -18 -16 -14 -12δ13C
Spartinahybrid live
Spartinahybrid dead
Ulva
Cyanobacteria/Mixed mat
POMDiatoms
SOM
HYBRID
Gnorimosphaeroma
Eteone dilatae
Boccarida
CapitellaNereis
OrchestiaTubificidae
Venerupis
Exogone
Urosalpinx
trophic shift
Food Web Structure
Invertebrate Communities
Migratory Shorebirds Resident Canada Geese
Impacts of Impacts of SpartinaSpartina InvasionInvasion

OutlineOutline•• Ecological impacts of introduced speciesEcological impacts of introduced species
–– Effects from populations to ecosystemsEffects from populations to ecosystems–– Specific example of Specific example of Spartina Spartina cordgrass in San cordgrass in San
Francisco Bay, CA, USAFrancisco Bay, CA, USA•• Economic impacts of introduced speciesEconomic impacts of introduced species
–– Summary of examples of estimated impactsSummary of examples of estimated impacts–– Formal analysis of economic impacts of Formal analysis of economic impacts of
European green crab in U.S. European green crab in U.S. •• A new agenda for invasive species A new agenda for invasive species
researchresearch–– Focusing science to assist invasive species Focusing science to assist invasive species
managementmanagement

Examples of Economic Impactsof Marine Invasions

Types of Economic Impacts of Aquatic Types of Economic Impacts of Aquatic InvadersInvaders
•• Production impacts Production impacts •• Price and market effects Price and market effects •• Trade impacts Trade impacts •• Management and prevention Management and prevention
costscosts•• Recreational impactsRecreational impacts•• Aesthetic impactsAesthetic impacts•• Human and wildlife health Human and wildlife health
impactsimpacts5555
Photo: Canada Department of Fisheries and Oceans.

Estimating Impacts of the European Estimating Impacts of the European Green Crab (Green Crab (Carcinus MaenasCarcinus Maenas))
•• Goal of Study: Estimate the Goal of Study: Estimate the economic impacts of the GC on economic impacts of the GC on the West and East Coasts of the the West and East Coasts of the U.S. U.S. –– Current impactsCurrent impacts–– Future impacts (West Coast)Future impacts (West Coast)–– Consider future alternative Consider future alternative
scenarios for West Coast scenarios for West Coast expansion and controlexpansion and control
5656

5757Source: USGS, 2006; Yamada et al., 2001; Yamada et al., 2005; Grosholz, unpubl. data; Holmes, 2001; Jamieson, 2006; Steves et al. unpubl. data; Audet et al., 2003.

5858
Species Preyed Upon by the European Species Preyed Upon by the European Green CrabGreen Crab
• Consumes over 35 different species, including multiple commercially viable types of shellfish.
• Species affected include: • Manila Clams• Northern Quahogs• Softshell Clams• Blue Mussels• Bay Scallops • Pacific Oysters• Razor Clams• Native California Clams
City of Edmonds, WA. 2003
Britannica Concise
Penn Cove Shellfish, LLC

Potential Economic ImpactsPotential Economic Impacts
•• Commercial and recreational fishing and shellfishingCommercial and recreational fishing and shellfishing•• Damage to eelgrass beds and effects on habitat Damage to eelgrass beds and effects on habitat
restorationrestoration•• Indirect impacts on shorebirds due to reduction in prey, Indirect impacts on shorebirds due to reduction in prey,
with impacts on recreational birdingwith impacts on recreational birding•• NonNon--use impacts (e.g., existence of healthy aquatic use impacts (e.g., existence of healthy aquatic
community)community)
5959WA State, Dept. of Ecology
Rob RobinsonBowdoin College

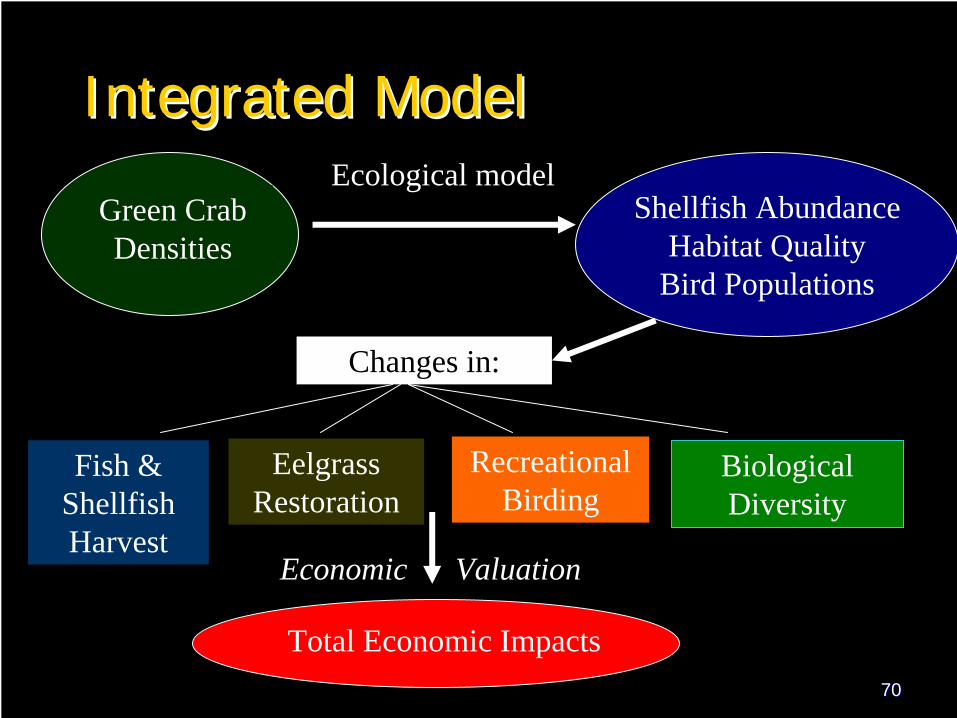
Integrated ModelIntegrated Model
6060
Economic Valuation
Green Crab Densities
Shellfish AbundanceHabitat Quality
Bird Populations
Fish & Shellfish Harvest
Eelgrass Restoration
Recreational Birding
Biological Diversity
Changes in:
Total Economic Impacts
Ecological model

Integrating Ecological and Economic Integrating Ecological and Economic Models for Impacts on ShellfishModels for Impacts on Shellfish
•• Use GARP (Steves Use GARP (Steves et al.et al.) to predict the outer ) to predict the outer boundaries of the potential future GC boundaries of the potential future GC distribution on the West Coast; use logistic distribution on the West Coast; use logistic regression models to predict invasion of specific regression models to predict invasion of specific estuariesestuaries
•• Use statistical models to determine relationship Use statistical models to determine relationship between Green Crab densities in estuaries and between Green Crab densities in estuaries and survival rates for shellfish survival rates for shellfish
•• Use economic models to estimate damages to Use economic models to estimate damages to fishermen, seafood consumers, and recreational fishermen, seafood consumers, and recreational users users
6161

Modeling Probability of Green Crab Modeling Probability of Green Crab PresencePresence
Probability of Green Crab PresenceProbability of Green Crab Presence ((pp ii ):):
6262
1+++++
=)exp(
)exp(γ
γ
ii
iii a
apZβX
ZβX
Where:
X is a vector of variables thatmeasure estuary characteristics and
Z is a vector of spatial variables.
Independent VariablesIndependent Variables
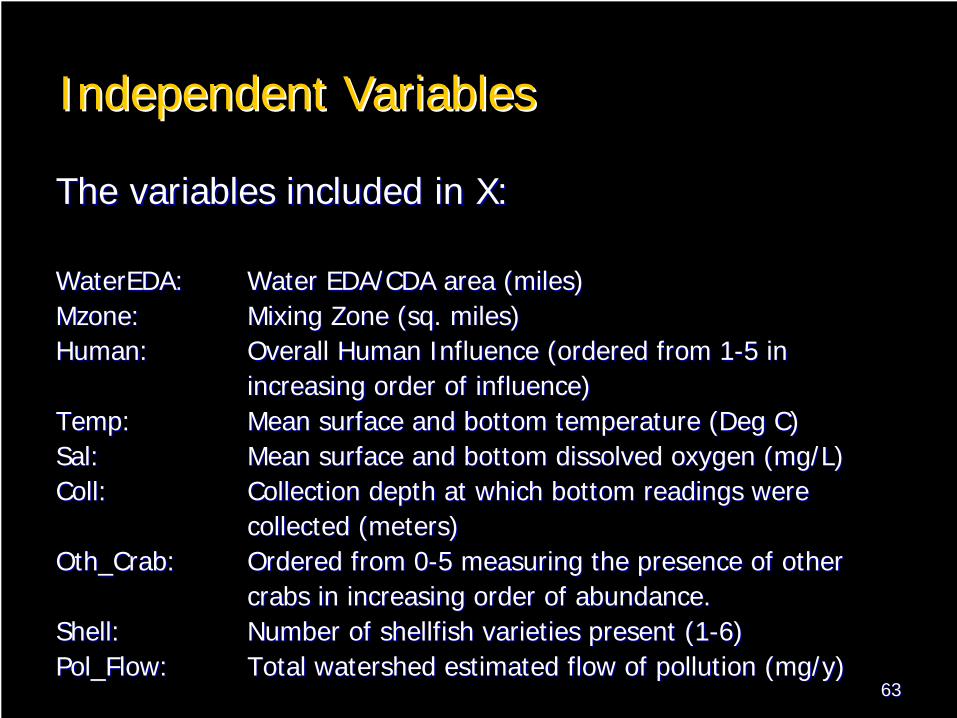
The variables included in X:The variables included in X:
WaterEDA:WaterEDA: Water EDA/CDA area (miles)Water EDA/CDA area (miles)Mzone:Mzone: Mixing Zone (sq. miles)Mixing Zone (sq. miles)Human:Human: Overall Human Influence (Overall Human Influence (ordered from 1ordered from 1--5 in 5 in
increasing order of influence)increasing order of influence)Temp:Temp: Mean surface and bottom temperature (Deg C) Mean surface and bottom temperature (Deg C) Sal:Sal: Mean surface and bottom dissolved oxygen (mg/L)Mean surface and bottom dissolved oxygen (mg/L)Coll:Coll: Collection depth at which bottom readings wereCollection depth at which bottom readings were
collected (meters)collected (meters)Oth_Crab:Oth_Crab: Ordered from 0Ordered from 0--5 measuring the presence of other5 measuring the presence of other
crabs in increasing order of abundance.crabs in increasing order of abundance.Shell:Shell: Number of shellfish varieties present (1Number of shellfish varieties present (1--6) 6) Pol_Flow: Pol_Flow: Total watershed estimated flow of pollution (mg/y)Total watershed estimated flow of pollution (mg/y)
6363

Independent Variables (cont.)Independent Variables (cont.)
The spatial variables included in Z:The spatial variables included in Z:
DistanceSF:DistanceSF: Distance of estuary from San FranciscoDistance of estuary from San FranciscoBay (miles)Bay (miles)
Cont_Num:Cont_Num: Number of contiguous estuaries withNumber of contiguous estuaries withGreen Crab presenceGreen Crab presence
6464

Integrated ModelIntegrated Model
6565
Economic Valuation
Green Crab Densities
Shellfish AbundanceHabitat Quality
Bird Populations
Fish & Shellfish Harvest
Eelgrass Restoration
Recreational Birding
Biological Diversity
Changes in:
Total Economic Impacts
Ecological model

6666
Ecological Damage Model: Ecological Damage Model:
Species Considered:
• Manila Clams
• Softshell Clams
• Hardshell Clams
• Blue Mussels
• Scallops

• Manila Clams– data from Tomales Bay, CA (from Grosholz et al. 2001)
• Softshell Clams – data from Rowley River, MA (from MA Dept. of Fish & Game 2001)
• Hardshell Clams– data from 10 sites on Martha’s Vineyard, MA (from Walton 2003)
• Blue Mussels– data from Menai Straits, North Wales (from Dare & Edwards 1976)
• Scallops:– data from the Poquonock River, CT (from Tettelbach 1986).
6767
Ecological Damage Model: Ecological Damage Model:
Data Sources Data Sources

6868
0%
5%
10%
15%
20%
25%
30%
35%
40%
45%
1 11 21 31 41 51 61 71 81 91 101
Green Crab CPUE
% S
hellf
ish
Lost
Green Crab Impacts on ShellfishGreen Crab Impacts on Shellfish
Percent Shellfish Lost by Green Crab DensityPercent Shellfish Lost by Green Crab Density
• Based on combined dataset for manila clams, hardshell clams, softshell clams, bay scallops and blue mussels
Edmonds Discovery Programs. 2005
City of Edmonds, WA. 2003
Penn Cove Shellfish, LLC
mehp.vetmed.ucdavis.edu
For CPUE<=30
y=0.0114362x
For CPUE >30
y=0.4201406/(1+EXP(-0.0646836*x))

Limitations of Ecological ModelsLimitations of Ecological Models
•• Lack of data on green crab effects on Lack of data on green crab effects on many species, including many species, including –– other shellfish speciesother shellfish species–– finfish finfish –– shore birdsshore birds
•• Data used in this analysis are limited to a Data used in this analysis are limited to a few observations and thus do not allow few observations and thus do not allow rigorous statistical modelingrigorous statistical modeling
6969
Integrated ModelIntegrated Model
7070
Economic Valuation
Green Crab Densities
Shellfish AbundanceHabitat Quality
Bird Populations
Fish & Shellfish Harvest
Eelgrass Restoration
Recreational Birding
Biological Diversity
Changes in:
Total Economic Impacts
Ecological model

Modeling Market Impacts of GC:Modeling Market Impacts of GC:
•• Estimate changes in commercial harvest due to Estimate changes in commercial harvest due to GC predation (in pounds)GC predation (in pounds)
•• Use data on dockside prices to estimate gross Use data on dockside prices to estimate gross value of changes in harvest value of changes in harvest
•• Estimate changes in producerEstimate changes in producer’’s normal profit s normal profit (PS) as a proportion of changes in gross value. (PS) as a proportion of changes in gross value. Producers net benefit ratios: Producers net benefit ratios: –– aquaculture = 0.5; aquaculture = 0.5; –– wild shellfish harvest =0.58 wild shellfish harvest =0.58
•• Estimate welfare changes (CS) to final and Estimate welfare changes (CS) to final and commercial consumers of fish due to changes in commercial consumers of fish due to changes in shellfish price. shellfish price. 7171
7272
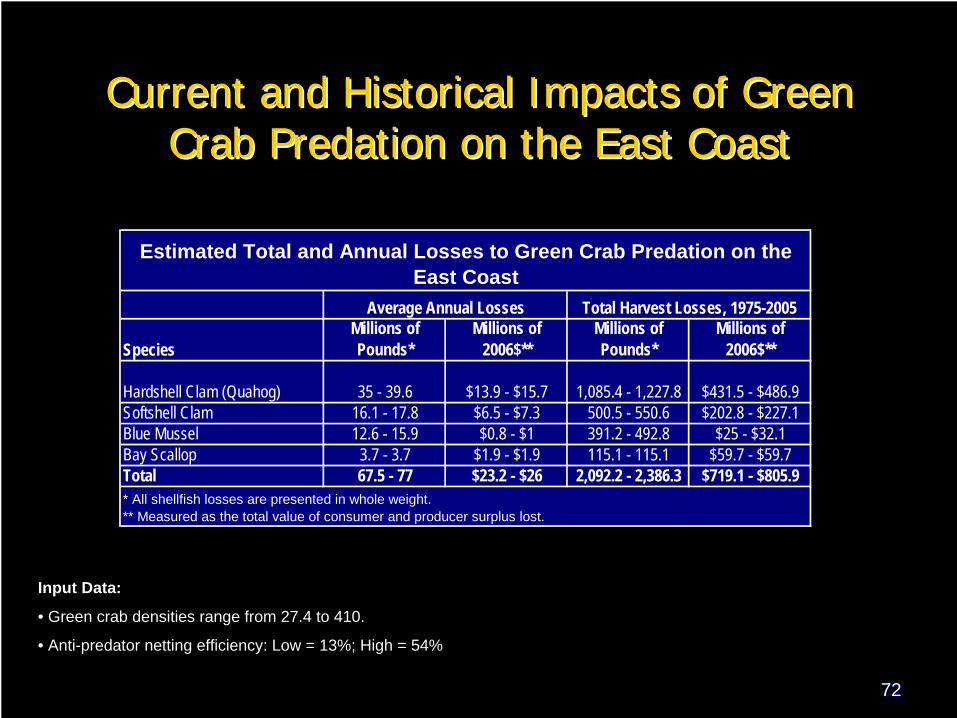
Current and Historical Impacts of Green Current and Historical Impacts of Green Crab Predation on the East CoastCrab Predation on the East Coast
Input Data:
• Green crab densities range from 27.4 to 410.
• Anti-predator netting efficiency: Low = 13%; High = 54%
SpeciesMillions of Pounds*
Millions of 2006$**
Millions of Pounds*
Millions of 2006$**
Hardshell Clam (Quahog) 35 - 39.6 $13.9 - $15.7 1,085.4 - 1,227.8 $431.5 - $486.9Softshell Clam 16.1 - 17.8 $6.5 - $7.3 500.5 - 550.6 $202.8 - $227.1Blue Mussel 12.6 - 15.9 $0.8 - $1 391.2 - 492.8 $25 - $32.1Bay Scallop 3.7 - 3.7 $1.9 - $1.9 115.1 - 115.1 $59.7 - $59.7Total 67.5 - 77 $23.2 - $26 2,092.2 - 2,386.3 $719.1 - $805.9
Estimated Total and Annual Losses to Green Crab Predation on the East Coast
Average Annual Losses Total Harvest Losses, 1975-2005
* All shellfish losses are presented in whole weight.** Measured as the total value of consumer and producer surplus lost.

7373
Current Annual Commercial Shellfish Harvest Current Annual Commercial Shellfish Harvest Losses due to Green Crab Predation on the Losses due to Green Crab Predation on the
West CoastWest Coast(Preliminary Estimates)(Preliminary Estimates)
Input Data:
• Current green crab density ranges (CPUE): CA = 0.005-15.3; OR = 0.05-1.15; WA = 0.06-0.14
• Potential future green crab densities range from 0.01 to 31.5 CPUE.
• Anti-predator netting efficiency: Low = 13%; High = 54%
000's of Pounds*
000's of 2006$**
000's of Pounds*
000's of 2006$** 000's of Pounds*
000's of 2006$**
000's of Pounds*
000's of 2006$**
000's of Pounds*
000's of 2006$**
Hardshell Clam 0 $0 0*** $0* - $0* 0 $0 0 $0 0 - 0 $0 - $0
Softshell Clam 0 $0 0*** $0* - $0* 0 $0 0 $0 0 - 0 $0 - $0
Manila Clam 0.7 - 1.4 $0.4 - $0.8 0 $0 0.3 - 0.5 $0.1 - $0.3 0 $0 1 - 1.9 $0.6 - $1.1
Blue Mussel 0.2 - 0.4 $0.1 - $0.2 0 $0 0 0 0 $0 0.2 - 0.4 $0.1 - $0.2
Total 1 - 1.8 $0.5 - $1 0 - 0 $0 0.3 - 0.5 $0.1 - $0.3 0 - 0 $0 1.2 - 2.3 $0.7 - $1.3* All shellfish losses are presented in whole weight.** Measured as the total value of consumer and producer surplus lost.***Value >0
AlaskaCalifornia Oregon Washington West Coast TotalCurrent Annual Losses by Species and State

7474
(Preliminary Estimates)(Preliminary Estimates)
Potential Future Commercial Shellfish Harvest Potential Future Commercial Shellfish Harvest Losses due to Green Crab Predation on the Losses due to Green Crab Predation on the
West CoastWest Coast
Net Present Value of potential losses over 25 years: $15 -
$29 million (discounted at 3%)
000's of Pounds*
000's of 2006$**
000's of Pounds*
000's of 2006$** 000's of Pounds*
000's of 2006$**
000's of Pounds*
000's of 2006$**
000's of Pounds*
000's of 2006$
Hardshell Clam 0 $2.4 - $6 0.1 - 0.1 $0.3 - $0.7 16.3 - 26.6 $9.9 - $16.3 10.1 - 15 $6.1 - $8.9 26.6 - 41.8 $18.8 - $31.9
Softshell Clam 0 $1.5 - $5.7 0*** $0.2 - $0.6 76.3 - 146.9 $12 - $23.5 0 $0 - $0.1 76.3 - 146.9 $13.7 - $29.9
Manila Clam 2.2 - 4.4 $56.4 - $169 0 $5.6 - $17 920.3 – 1,596.9 $396.9 - $691.6 0 $1.0 - $3.1 922.6 - 1601.3 $460 - $880.6
Blue Mussel 44 - 84.2 $24.6 - $65.3 0 $1.0 - $3.8 191.4 - 368.5 $64.6 - $127.5 0.2 - 0.4 $0.3 - $0.8 235.6 - 453.1 $90.5 - $197.4
Total 46.2 - 88.6 $85 - $245.9 0.2 - 0.2 $7.2 - $22.1 1204.4 - 2138.9 $483.4 - $858.9 10.3 - 15.4 $7.4 - $12.9 1261.1 - 2243 $583 - $1139.7* All shellfish losses are presented in whole weight.** Measured as the total value of consumer and producer surplus lost.*** Value >0
West Coast TotalPotential Future Annual Losses by Species and State
California Oregon Washington Alaska
Net Present Value of potential losses over 25 years: $15 -
$29 million (discounted at 3%)

Modeling NonModeling Non--market Impacts of GC:market Impacts of GC:
•• Recreational shellfishing/fishingRecreational shellfishing/fishing•• Bird watchingBird watching•• Eelgrass restoration effortsEelgrass restoration efforts•• Impacts on biological communities/species Impacts on biological communities/species
assemblageassemblage
7575

7676
Costs of Green Crab Management Options*
As Estimated in the Management Plan for the European Green Crab (2002)
Values are likely underestimate activity costs (2006$)
Prevention and Containment
• $50K in 2005; not estimated for later years
Detection and Forecasting
• $222K/ year in 2005-2006; $194K/year in 2007-2010
Control, Eradication and Mitigation
• $111K/year in 2005-2010
Information Management
• $11K/year
Potential Total Cost per Year
• $316K to $394K per year
* While the cost estimates include both the East and West Coast,
most of the activities are likely to take place on the West Coast.

7777
Costs and Benefits Comparison
Potential total cost per year to prevent further expansion of Green Crabs
$316K to $394K per year*
Potential avoided damages to commercial shellfishing from preventing green crab expansion further north in WA and AK ($/year)
$681K per year (average estimate)
Both costs and benefits are likely to be underestimated. Additional benefit categories may include:
• Avoided damages to other shellfish species
• Avoided damages to recreational users (shellfish harvest and birding)
•Avoided damages to habitat restoration efforts in the state of WA
• Nonuse values
* While the cost estimates include both the East and West Coast,
most of the activities are likely to take place on the West Coast.

OutlineOutline•• Ecological impacts of introduced speciesEcological impacts of introduced species
–– Effects from populations to ecosystemsEffects from populations to ecosystems–– Specific example of Specific example of Spartina Spartina cordgrass in San cordgrass in San
Francisco Bay, CA, USAFrancisco Bay, CA, USA•• Economic impacts of introduced speciesEconomic impacts of introduced species
–– Summary of examples of estimated impactsSummary of examples of estimated impacts–– Formal analysis of economic impacts of Formal analysis of economic impacts of
European green crab in U.S. European green crab in U.S. •• A new agenda for invasive species A new agenda for invasive species
researchresearch–– Focusing science to assist invasive species Focusing science to assist invasive species
managementmanagement
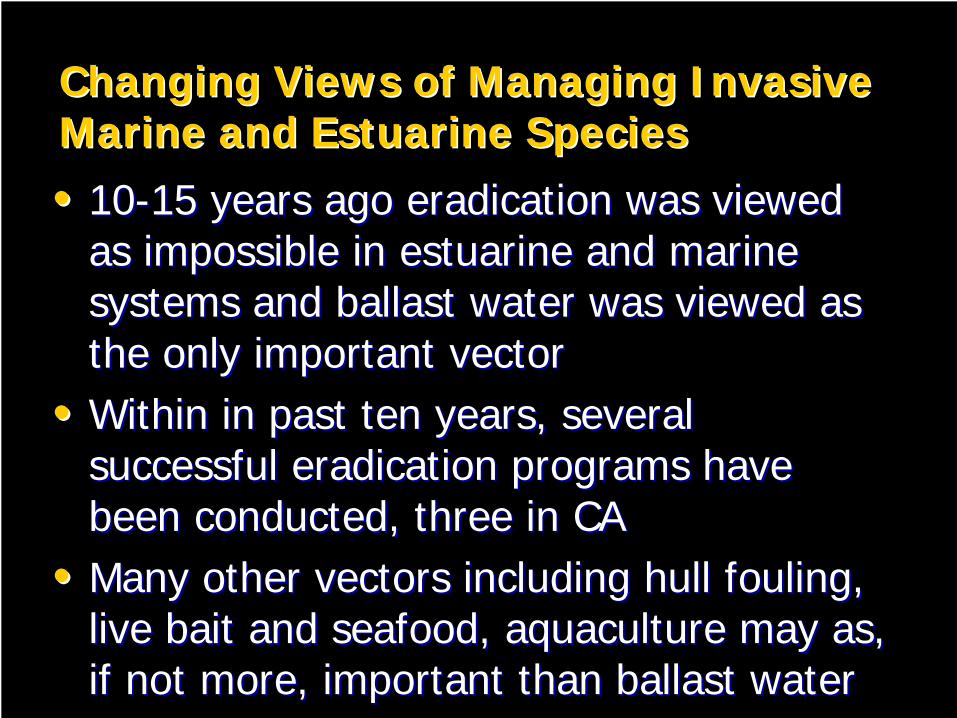
Changing Views of Managing Invasive Changing Views of Managing Invasive Marine and Estuarine SpeciesMarine and Estuarine Species
•• 1010--15 years ago eradication was viewed 15 years ago eradication was viewed as impossible in estuarine and marine as impossible in estuarine and marine systems and ballast water was viewed as systems and ballast water was viewed as the only important vectorthe only important vector
•• Within in past ten years, several Within in past ten years, several successful eradication programs have successful eradication programs have been conducted, three in CAbeen conducted, three in CA
•• Many other vectors including hull fouling, Many other vectors including hull fouling, live bait and seafood, aquaculture may as, live bait and seafood, aquaculture may as, if not more, important than ballast waterif not more, important than ballast water

A New Agenda for Management A New Agenda for Management Focused ResearchFocused Research
•• New methods for eradication and controlNew methods for eradication and control–– Biological control, chemical control, transgenic Biological control, chemical control, transgenic
approaches, pheromonal controlapproaches, pheromonal control
•• Understanding connectivityUnderstanding connectivity–– Molecular genetics, trace elements, dispersal Molecular genetics, trace elements, dispersal
modelsmodels–– Prioritize control methodsPrioritize control methods
•• Ecological economics modelsEcological economics models–– Incorporating nonIncorporating non--market impactsmarket impacts
From Williams and Grosholz, 2008. Estuaries and Coasts.

Examplesof Eradication
Attempts inMarine/Estuarine
Systems
From Williams and Grosholz, 2008. Estuaries and Coasts.

Costs of Successful EradicationCosts of Successful Eradication
Species Site
Mytilopsis sallei(black striped mussel) Australia (NT)Caulerpa taxifolia(Med algae)
California (SD, HB)
Terebrasabella heteroucinata(SA abalone parasite) California (MB)
Ascophyllum nodosum(NE algae) California (SF)
Approx. Area Affected (ha)0.001 0.01 0.1 1 10 100
App
roxi
mat
e C
ost (
x 1,
000
US
$$)
1
10
100
1000
10000
Grosholz, unpubl. data

Conceptual Model to Guide Conceptual Model to Guide Eradication Decisions Eradication Decisions
From Williams and Grosholz, 2008. Estuaries and Coasts.

A New Agenda for Management A New Agenda for Management Focused ResearchFocused Research
•• Community and ecosystem impacts of Community and ecosystem impacts of ecosystem engineersecosystem engineers–– Identifying the most important impactsIdentifying the most important impacts
•• TraitTrait--based approaches for preventionbased approaches for prevention–– Screening targeted speciesScreening targeted species
•• Decision supportDecision support–– Delivery of information about management Delivery of information about management
methods, species biology, etc.methods, species biology, etc.From Williams and Grosholz, 2008. Estuaries and Coasts.

Major Functional Groups of Concern
From Williams and Grosholz, 2008. Estuaries and Coasts.also Grosholz and Ruiz, 2009. Marine Bioinvasions: Ecology, Conservation and Management Perspectives.

A New Agenda for Management A New Agenda for Management Focused ResearchFocused Research
•• Early detectionEarly detection–– Genetic dip sticks, shotgun sequencing for Genetic dip sticks, shotgun sequencing for
screening water columnscreening water column
•• Improved systematicsImproved systematics–– Increasing experts, faster/accessible methodsIncreasing experts, faster/accessible methods
•• Evolutionary potentialEvolutionary potential–– Rapid evolution, changing invadersRapid evolution, changing invaders
From Williams and Grosholz, 2008. Estuaries and Coasts.

Linking Overconsumption by Linking Overconsumption by USA with Sea Level RiseUSA with Sea Level Rise

A New Agenda for Management A New Agenda for Management Focused ResearchFocused Research
•• Climate change impactsClimate change impacts–– Increasing temperature and Increasing temperature and
shifting/expanding rangesshifting/expanding ranges–– Rising sea levels and changing inundation Rising sea levels and changing inundation
patternspatterns–– Increasing pCOIncreasing pCO22 and decreasing pHand decreasing pH–– Changes in wind stress, upwelling, and Changes in wind stress, upwelling, and
advection of propagulesadvection of propagulesFrom Williams and Grosholz, 2008. Estuaries and Coasts.

Climate Change and Coastal Climate Change and Coastal InvasionsInvasions
•• Bays and estuaries highly invaded and highly Bays and estuaries highly invaded and highly susceptible to climate change impactssusceptible to climate change impacts
•• Shallow coastal systems are expected to Shallow coastal systems are expected to show greater warming show greater warming
•• Estuaries (lower alkalinity) are more Estuaries (lower alkalinity) are more susceptible to lower pHsusceptible to lower pH
•• Inundation patterns in coastal habitats Inundation patterns in coastal habitats strongly affected by rising sea levelsstrongly affected by rising sea levels
Overall ConclusionsOverall Conclusions•• Measuring ecological impacts will require Measuring ecological impacts will require
more comprehensive approach involving a more comprehensive approach involving a broader range of response variable and broader range of response variable and spatio/temporal scalesspatio/temporal scales
•• Quantifying economic impacts will require Quantifying economic impacts will require better ecological and fisheries data with better ecological and fisheries data with new valuation and modeling methodsnew valuation and modeling methods
•• Future invasion research should require a Future invasion research should require a broader dialogue between science and broader dialogue between science and management management -- scientists need to listenscientists need to listen 9090

Acknowledgements for Acknowledgements for Research on Research on Spartina Spartina ImpactsImpacts
•• Funding from National Science Foundation Biocomplexity Program Funding from National Science Foundation Biocomplexity Program •• CoCo--authors: Lisa Levin (Scripps Institution of Oceanography), Carloauthors: Lisa Levin (Scripps Institution of Oceanography), Carlos s
Neira (SIO), Christy Tyler (Rochester Institute of Technology)Neira (SIO), Christy Tyler (Rochester Institute of Technology)•• Collaborators and postdocs: Debra Ayres (UC Davis), Jeff Black, Collaborators and postdocs: Debra Ayres (UC Davis), Jeff Black,
(Humboldt State Univ.), John Lambrinos (Oregon State Univ.), Pab(Humboldt State Univ.), John Lambrinos (Oregon State Univ.), Pablo lo Rosso, Cully Nordby Rosso, Cully Nordby
•• Grad students and technicians: Elizabeth Brusati, Randall HughesGrad students and technicians: Elizabeth Brusati, Randall Hughes, , Christine Whitcraft (SIO), Rachael Blake, Ursula Mahl, Nicole Christine Whitcraft (SIO), Rachael Blake, Ursula Mahl, Nicole Christiansen Nicki Rayl, Steve Norton, Cascade Sorte, Christal LChristiansen Nicki Rayl, Steve Norton, Cascade Sorte, Christal Love, ove, Nicole Smith, Philip Colombano, Guillermo Mendonca (SIO) and Nicole Smith, Philip Colombano, Guillermo Mendonca (SIO) and many volunteersmany volunteers

Acknowledgements Acknowledgements for Bioeconomic for Bioeconomic Analysis Analysis •• Funding from US Environmental Protection Agency Funding from US Environmental Protection Agency
(National Center for Environmental Economics and Office (National Center for Environmental Economics and Office of Wetlands, Oceans and Watersheds, National Oceanic of Wetlands, Oceans and Watersheds, National Oceanic and Atmospheric Administration (NOAA), National Sea and Atmospheric Administration (NOAA), National Sea Grant College ProgramGrant College Program
•• Coauthors Sabrina Lovell, US EPA (now NOAA) and Elena Coauthors Sabrina Lovell, US EPA (now NOAA) and Elena Besedin and Tulika Narayan, ABT Associates,Besedin and Tulika Narayan, ABT Associates,
•• Greg Ruiz and Brian Steves, Smithsonian Environmental Greg Ruiz and Brian Steves, Smithsonian Environmental Research Center (SERC) for use of Research Center (SERC) for use of Carcinus maenas Carcinus maenas GARP model resultsGARP model results

Acknowledgements Acknowledgements for a for a ‘‘New Research New Research AgendaAgenda’’
•• Thanks to C. Duarte for Thanks to C. Duarte for OdumOdum Synthesis invitation Synthesis invitation •• Coauthor and collaborator Susan Williams, Director, Coauthor and collaborator Susan Williams, Director,
University of University of California, Davis, Bodega Marine LaboratoryCalifornia, Davis, Bodega Marine Laboratory
•• Comments on MS from C. Duarte, N. Comments on MS from C. Duarte, N. BaxBax, and J. T. , and J. T. CarltonCarlton
•• Input from many colleagues: G. Ruiz, C. Hewitt, L. Levin, Input from many colleagues: G. Ruiz, C. Hewitt, L. Levin, A. Kuris, S. Morgan, A. Chang, W. Miller, and many A. Kuris, S. Morgan, A. Chang, W. Miller, and many othersothers