A need for ‘joined up thinking’: Groundwater management in rural Uganda Carolyn Roberts...
42
A need for ‘joined up thinking’: Groundwater management in rural Uganda Carolyn Roberts University of Gloucestershire, UK Association of American Geographers AGM, San Francisco, USA, April 2007
-
date post
22-Dec-2015 -
Category
Documents
-
view
215 -
download
0
Transcript of A need for ‘joined up thinking’: Groundwater management in rural Uganda Carolyn Roberts...

A need for ‘joined up thinking’: Groundwater
management in rural Uganda
Carolyn Roberts University of Gloucestershire, UK
Association of American Geographers AGM, San Francisco, USA, April 2007

U ganda
Lake Victoria
Location

Key influences on water policy and management in Uganda
Economic fragility and high levels of indebtedness Rapid population growth in rural and urban areas,
leading to inability to meet basic needs Post-colonial political instability and ethnic
tensions, leading to infrastructural collapse in the 1970s and 80s
Low levels of literacy (<50%) 1.4m people displaced by civil insurrection Weak infrastructure, institutions, technical
expertise, investment
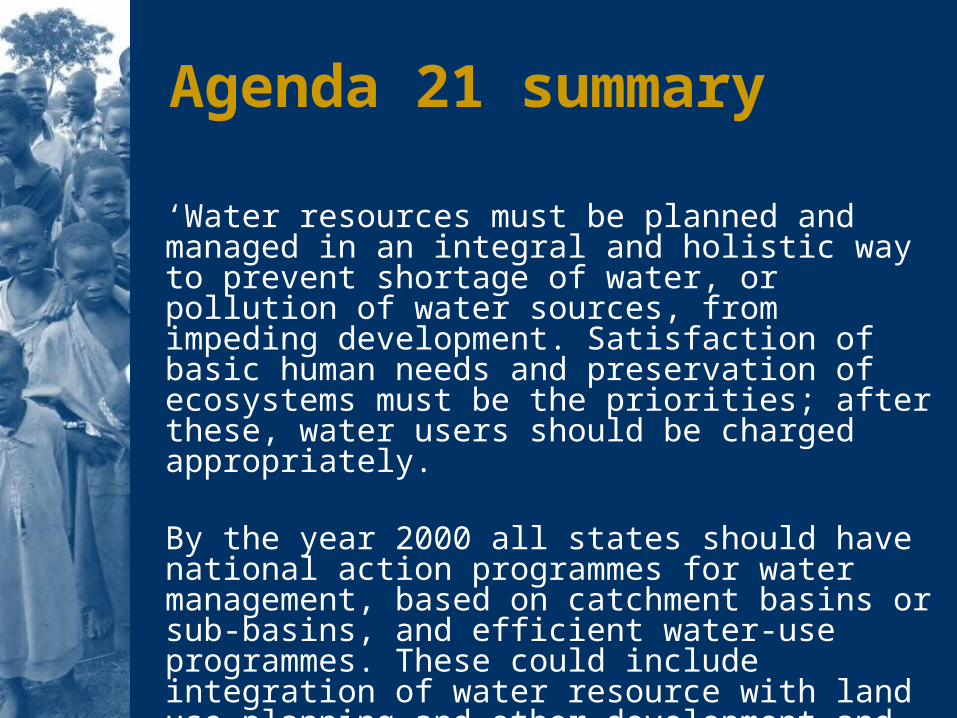
Agenda 21 summary
‘Water resources must be planned and managed in an integral and holistic way to prevent shortage of water, or pollution of water sources, from impeding development. Satisfaction of basic human needs and preservation of ecosystems must be the priorities; after these, water users should be charged appropriately.
By the year 2000 all states should have national action programmes for water management, based on catchment basins or sub-basins, and efficient water-use programmes. These could include integration of water resource with land use planning and other development and conservation activities, demand management through pricing or regulation.’

Water-related Millennium Development Goals for Uganda100% rural population to have access to safe and
adequate water and sanitation (latrines) by 2015Access is defined as a ‘safe source’ within 1.5 kmReductions in water-related diseases such as
diarrhoeaSome progress (World Bank, 2002) but probably
currently lagging behind targets on both water supplies and sanitation

UNESCO Water Supply and Sanitation Sector Assessment, 2000
Urban water
supply
Rural
water supply
Urban sanitatio
n
Rural sanitation
Population 000’s
(A.D. 2000)
3,083 18,695 3,083 18,695
Pop with house connection/
public sewer
204 229 220 28
Pop with Public Waterpoint/non-sewer sanitation
1,341 2,763 1,834 10,274
Population Served
2,200 8,600 2,960 13,460
% Population served
72 46 96 72

Uganda’s physical environment
24,000 sq km high altitude (1000m+) equatorial territory, in the Nile Basin
17% open water with lakes and swamps
Granitic basement Lateritic Fe/Al soils, clay
loams Monsoonal climate Tropical forest/savannah
mosaic

Uganda’s human background
Population c. 25 m Growth rate 3.1% /a 50% population under
15 Mean family size 5.5-6
children Life expectancy at
birth c.M46, F51 yrs GDP $310 /hd Inflation 6% 154th in world ranking
of economic indicators

Approx. 80% rural population

Large villages and small towns

Water availability in Uganda Uganda apparently has a
large volume of available water per head
Mean water use in Africa is 47l/hd/day
UNEP estimate 25 African countries, including Uganda, will experience water ‘scarcity’ or ‘stress’ in the next 20-30 years, mainly because of population growth
Climate change will increase uncertainty
Distribution and quality problems also influence ‘scarcity’

Ugandan policies on water 1990 Water and Sanitation Programme began for rural towns
(500-50,000 people) 1992 UNCED (Integrated Water Resource Management) 1994 Uganda Water Action Plan 1995 Uganda Water Statute 1996 Uganda (Draft) Water Policy 1998 Regulations for the control of water resources, water and
sewerage and waste water discharges Uganda Wetlands Conservation Strategy 1999-2000 Africa’s Water Vision (U.N.) 2000 Uganda Rural Water and Sanitation Investment Plan and
Strategy 2001 Nile Basin Strategic Action Programme

Current emphases in Ugandan water policy Rational use of water, in an integrated way Decentralisation of responsibility for implementation from the
Ministry of Water, Lands and Environment’s Water Development Department to District Offices
Full cost recovery with some cross-subsidisation of safe water services for poor people
Full stakeholder involvement (Mobilisation Officers) NGO/aid agency and private sector involvement Accountability Safe storage, treatment and disposal of waste, according to
the ‘Polluter Pays’ principle Technical training at local level Increasing emphasis on privatisation

Key areas for research
Comparison of supply management situation in 2001-6 with the late 1960s
Environmental ‘footprints’ of settlementsEnvironmental impacts of water management
strategiesEconomic and social costs and benefits of water
supply arrangementsSustainability criteria for water supplies in
developing areas (Loucks and Gladwell, 1999)Field investigation conducted by UoG and NTCK staff and students

Gilbert White’s ‘Drawers of Water’, 1972
Drawers of Water, 2004

Kamuli
Iganga
Kaliro
Case study villages

Alternative supplies of water in rural areas
Household connected to mains supply, pumped from river, reservoir or borehole
Public or private standpipe with tapBorehole with handpumpWellSpring or protected springRiver, lake or swampPuddle

High tech pumped supply from small reservoir: Kamuli
Cost and maintenance issues

Metered mains household supply: Kamuli
Take up is very low; most residents continue to use alternative sources
Mean daily use in Kamuli in c. 1968 by tap holders was 86l/hd/day (Iganga 85l/hd/d)
‘Rural’ use was c 13-16 l/hd/day
Borehole supplies are also preferred by local people on quality grounds

Public or private pumped supplies to standpipes,
Iganga
Colonial system, disused
Diesel-pumped borehole, with taps

Borehole and hand pumps
Frequently funded from foreign aid programmes

Protected spring
Open well
Protected springs and wells are universal

Surface and groundwater quality parameters
pH Conductivity Nitrate Nitrite Ammonia Phosphate Iron Chloride E. Coli (partial
coverage)

Questionnaire with users, undertaken at the source using NTCK student interpretersGender Indirect estimates of relative wealth (e.g. shoes,
bicycle, clothes?)Distance travelled and mode of transportHousehold sizes (adults, children)Frequency and volume of collections per household,
per dayPrice of waterViews on water quality at source, and any required
treatment prior to consumptionOther water sources used, and reasons

Payment for interviews

3500
35503500
NATWANA
KaliroStation
600
200
200
200
300
300
400
400
500
500
KALIRO R esidentia l area
Sw am ps
R iver
M inor road
R ailw ay line (d isused)
C ontour (m )
Borehole
N ew borehole
N ew area for p ipes
CONDUCTIVITY
600 Sµ
500 Sµ
400 Sµ
300 Sµ
200 Sµ
0 1km
(Approx)
Groundwater contamination Kaliro

3650
3700
3750
3700
3700
3650
700
600
200
300
400
500
IGANGA
Built U p Area
Sw am ps
R iver
M inor R oad
M ajor R oad
D isused Railway L ine
Contour (m ) Borehole
CONDUCTIVITY
700 Sµ
600 Sµ
500 Sµ
400 Sµ
300 Sµ
200 Sµ
0 1km
(Approx)
Groundwater contamination, Iganga

Water quality findingsVillage/town impacts on groundwater quality in Kamuli,
Iganga and Kaliro are clear and apparently repeatable, year on year
Simple analytical technology is adequate Comparison with official data suggests comparable
picture for nitrate, phosphate, ammonia, pH, conductivity, iron, chloride
Bacteriological data may not be requiredContamination is the result of lack of sanitation, pit
latrine seepage and detergent disposalUsers frequently draw on contaminated sources, in all
settings

Basic findings on water use Typical consumption by
borehole users in Iganga, Kaliro and Kamuli is c. 20l/hd/day
UK domestic consumption is between 200 and 300 l/hd/day
US domestic consumption is c 400 l/hd/day
Fetching water requires about 5-10% typical calorific intake (White et al)

The ‘safe water chain’
Lack of sanitation and effective drainage impedes progress on sustainable supplies
Implementation is problematic despite the efforts of mobilisation officers

The socio economic impact of scarcity is as severe as in the 1960s For most rural Ugandan
women in 2006 the ‘rhythm’ of the working day is still made up of walking, queuing and carrying water

Iganga: Diesel-driven pumped borehole supplying standpipes
Water sellers’ prices are approximately twice that of personally carried supplies
Take up by wealthier residents is significant

Policy Impact OneRapid population growth leading to inadequate facilitiesPolicy suggests that a new borehole/facility is requiredMaximum population within 1.5 km soughtBoreholes installed in urban/suburban areasLocal groundwater is contaminated from pit latrines and
other waste waterPeople abandon traditional sources and walk into town
to collect water from boreholesPerception that water quality is good, no perceived
need or no fuel for boiling Increased risk of water-borne diseases

Health and social wellbeing impacts

What happens next: Policy Impact Two
Water yields are relatively low per boreholeTypical use is only c. 20 l/hd/dayWomen and children queue for hoursBorehole area is poorly maintained and leakage,
spillage or animal trampling occursStagnant water supports mosquitoesPeople are infected with malaria whilst queuing into
the eveningPrivatised health care providers flourish Inhabitants perceive higher levels of healthcare in
urban areas, promoting rural-urban migration

Key findings
Villages and small towns have a significant environmental footprint on groundwater
Water quality may be estimated adequately by using simple determinands such as conductivity, reducing the need to wait for official assessments to become available
Water supply provision must be matched by investment in sanitation
Education is significant, but needs to be based on appropriate scientific information

Strategic targets are being overwhelmed by population growth

The impact of privatisation?
Lack of technical capacity in local government, plus issues of non-compliance with central policy by aid agencies has promoted privatisation
Some sources are removed altogether
Water costs have risen to approximately 10% of family income in sampled villages

Concepts of sustainability
‘Sustainable water resource systems are those designed and managed to fully contribute to the objectives of society, now and in the future, while maintaining their ecological, environmental, and hydrological integrity’
Loucks and Gladwell, 1999

Concepts of Sustainability
1. Engineering
2. Economics
3. Environment
4. Equity
Concepts of sustainability
ResilienceAdaptive capacityVulnerability

Acknowledgements Staff and students from
National Teachers’ College Kaliro, Uganda
Staff and students from University of Gloucestershire
Ministry of Water, Lands and Environment, Kampala, Uganda
Uganda Bureau of Statistics
Busoga Trust White G.F., Bradley D.J.,
and White A.U. 1972 Drawers of Water University of Chicago Press