A Natural State Reservoir Modelling of Salak Geothermal Field
13
~Allen Haryanto Lukmana~ Vol. 4 No. 1 2020 p. 1 - 13 A Natural State Reservoir Modelling of Salak Geothermal Field Allen Haryanto Lukmana Petroleum Engineering, Universitas Pembangunan Nasional Veteran Yogyakarta, Indonesia. Email korespondensi: [email protected] ABSTRACT The Awibengkok or Salak Geothermal Field is a geothermal reservoir dominated by water. The Awibengkok Reservoir is a medium to high temperature geothermal source (240-312 ◦C) producing electricity up to 377 MW. Reservoirs with young volcanism and intrusion in highlands to the west of Mount Salak and east of the Cianten caldera, the collapsed andesite stratocon. Reservoir 3D modeling simulation is used in this research. 3D reservoir model to meet requirements in the natural state stage. Calibrate the reservoir 3D model by aligning pressure and temperature with P&T well data. Well located for use in matching is in western region of the Salak geothermal field and in the eastern region of the reservoir. The 3-dimensional model of the Salak geothermal field reaches its natural state with a simulation time of up to millions of years. The results from 3D modeling in a natural state illustrate the type of reservoir that is dominated by water and has a steam cap in the western and eastern model regions. Rock material in two different regions for different initial conditions. Higher temperatures in west. The reservoir has a gas saturation that varies from 0.13 to 0.5 and there is a caprock with 9 mD permeability. Keywords: awibengkok; geothermal; modeling; natural state ABSTRAK Lapangan panas bumi Awibengkok atau Salak adalah reservoir panas bumi yang didominasi oleh air. Waduk Awibengkok adalah sumber panas bumi bersuhu sedang hingga tinggi (240-312 ◦C) yang menghasilkan listrik hingga 377 MW. Reservoir dengan vulkanisme muda dan intrusi di dataran tinggi di sebelah barat Gunung Salak dan timur kaldera Cianten, stratocon andesit yang runtuh. Simulasi pemodelan reservoir 3D digunakan dalam penelitian ini. Model reservoir 3D untuk memenuhi persyaratan dalam tahap keadaan alami. Kalibrasi model 3D reservoir dengan menyelaraskan tekanan dan suhu dengan data sumur P&T. Lokasi yang cocok untuk digunakan dalam pencocokan adalah di wilayah barat lapangan panas bumi Salak dan di wilayah timur waduk. Model 3-dimensi dari bidang panas bumi Salak mencapai keadaan alami dengan waktu simulasi hingga jutaan tahun. Hasil dari pemodelan 3D dalam keadaan alami menggambarkan jenis reservoir yang didominasi oleh air dan memiliki tutup uap di wilayah model barat dan timur. Bahan batuan di dua daerah berbeda untuk kondisi awal yang berbeda. Temperatur lebih tinggi di barat. Reservoir memiliki saturasi gas yang bervariasi dari 0,13 hingga 0,5 dan ada caprock dengan permeabilitas 9 mD. Kata kunci: awibengkok; natural state; panas bumi; pemodelan, I. INTRODUCTION The Salak (Awibengkok) geothermal field is located 100 km west of Bandung, West Java, Indonesia on the southwestern flank of the Gunung Salak volcano (2,211 m above the sea level) presented in Figure 1. Exploration and initial development for commercial power generation was done by Union Oil of California (Unocal Geothermal Indonesia or UGI) through a Joint Operation Contract (JOC) with Pertamina, and an Energy Sales Contract with Pertamina and PLN for the sale of steam (to PLN). The field has been managed by Chevron Geothermal Salak since August 2005, when Chevron acquired Unocal (Peter, Kusumah, & Ryder, 2015). Commercial power generation at Salak began in 1994 with the installation of a 110 MWe plant (2 x 55 MWe or Units 1 and 2) operated by PLN. Production was increased to 330 MWe in 1997 with the addition of Unit 3, also operatedby PLN and installed adjacent to Units 1 and 2, and Units 4, 5 and 6, operated by Chevron and installed at a separate location; Units 3, 4 5 and 6 are all 55 MWe plants. Generation was increased to 377 MWe in 2002. Currently, Salak is the largest producer of geothermal power in Indonesia (Peter, Kusumah, & Ryder, 2015). Salak is a liquid-dominated geothermal system with a moderate- to high-temperature (240-316°C). This fracture- controlled reservoir hosting benign and low to moderate non-condensable gas (NCG) fluids. The reservoir is contained within a sequence of volcanic rocks of predominantly andesitic to rhyodacite composition with a basement of Miocene marine sedimentary rocks; both volcanic and sedimentary rocks are cut by igneous intrusions (Stimac et al., 2008).
Transcript of A Natural State Reservoir Modelling of Salak Geothermal Field

~Allen Haryanto Lukmana~
Vol. 4 No. 1 2020 p. 1 - 13
A Natural State Reservoir Modelling of Salak Geothermal Field
Allen Haryanto Lukmana
Petroleum Engineering, Universitas Pembangunan Nasional Veteran Yogyakarta, Indonesia.
Email korespondensi: [email protected]
ABSTRACT
The Awibengkok or Salak Geothermal Field is a geothermal reservoir dominated by water. The Awibengkok Reservoir
is a medium to high temperature geothermal source (240-312 ◦C) producing electricity up to 377 MW. Reservoirs with
young volcanism and intrusion in highlands to the west of Mount Salak and east of the Cianten caldera, the collapsed
andesite stratocon. Reservoir 3D modeling simulation is used in this research. 3D reservoir model to meet requirements
in the natural state stage. Calibrate the reservoir 3D model by aligning pressure and temperature with P&T well data.
Well located for use in matching is in western region of the Salak geothermal field and in the eastern region of the
reservoir. The 3-dimensional model of the Salak geothermal field reaches its natural state with a simulation time of up
to millions of years. The results from 3D modeling in a natural state illustrate the type of reservoir that is dominated by
water and has a steam cap in the western and eastern model regions. Rock material in two different regions for
different initial conditions. Higher temperatures in west. The reservoir has a gas saturation that varies from 0.13 to 0.5
and there is a caprock with 9 mD permeability.
Keywords: awibengkok; geothermal; modeling; natural state
ABSTRAK
Lapangan panas bumi Awibengkok atau Salak adalah reservoir panas bumi yang didominasi oleh air. Waduk
Awibengkok adalah sumber panas bumi bersuhu sedang hingga tinggi (240-312 ◦C) yang menghasilkan listrik hingga
377 MW. Reservoir dengan vulkanisme muda dan intrusi di dataran tinggi di sebelah barat Gunung Salak dan timur
kaldera Cianten, stratocon andesit yang runtuh. Simulasi pemodelan reservoir 3D digunakan dalam penelitian ini.
Model reservoir 3D untuk memenuhi persyaratan dalam tahap keadaan alami. Kalibrasi model 3D reservoir dengan
menyelaraskan tekanan dan suhu dengan data sumur P&T. Lokasi yang cocok untuk digunakan dalam pencocokan
adalah di wilayah barat lapangan panas bumi Salak dan di wilayah timur waduk. Model 3-dimensi dari bidang panas
bumi Salak mencapai keadaan alami dengan waktu simulasi hingga jutaan tahun. Hasil dari pemodelan 3D dalam
keadaan alami menggambarkan jenis reservoir yang didominasi oleh air dan memiliki tutup uap di wilayah model barat
dan timur. Bahan batuan di dua daerah berbeda untuk kondisi awal yang berbeda. Temperatur lebih tinggi di barat.
Reservoir memiliki saturasi gas yang bervariasi dari 0,13 hingga 0,5 dan ada caprock dengan permeabilitas 9 mD.
Kata kunci: awibengkok; natural state; panas bumi; pemodelan,
I. INTRODUCTION
The Salak (Awibengkok) geothermal field is located 100 km west of Bandung, West Java, Indonesia on the
southwestern flank of the Gunung Salak volcano (2,211 m above the sea level) presented in Figure 1. Exploration and
initial development for commercial power generation was done by Union Oil of California (Unocal Geothermal
Indonesia or UGI) through a Joint Operation Contract (JOC) with Pertamina, and an Energy Sales Contract with
Pertamina and PLN for the sale of steam (to PLN). The field has been managed by Chevron Geothermal Salak since
August 2005, when Chevron acquired Unocal (Peter, Kusumah, & Ryder, 2015).
Commercial power generation at Salak began in 1994 with the installation of a 110 MWe plant (2 x 55 MWe or Units 1
and 2) operated by PLN. Production was increased to 330 MWe in 1997 with the addition of Unit 3, also operatedby
PLN and installed adjacent to Units 1 and 2, and Units 4, 5 and 6, operated by Chevron and installed at a separate
location; Units 3, 4 5 and 6 are all 55 MWe plants. Generation was increased to 377 MWe in 2002. Currently, Salak is
the largest producer of geothermal power in Indonesia (Peter, Kusumah, & Ryder, 2015).
Salak is a liquid-dominated geothermal system with a moderate- to high-temperature (240-316°C). This fracture-
controlled reservoir hosting benign and low to moderate non-condensable gas (NCG) fluids. The reservoir is contained
within a sequence of volcanic rocks of predominantly andesitic to rhyodacite composition with a basement of Miocene
marine sedimentary rocks; both volcanic and sedimentary rocks are cut by igneous intrusions (Stimac et al., 2008).

~Allen Haryanto Lukmana~
ISSN 2549-7197 (cetak), ISSN 2549-564X (online)
JMEL, Volume 4 Nomor 1, 2020
2
Figure 1. Location map of Awibengkok Geothermal Field (Source: Stimac, Nordquist, Suminar, & Sirad Azwar, 2008)
Numerical simulation is the techniques in repeating the system procedures. In this paper, a natural state model
simulation of Salak geothermal field was made using numerical simulation. The method used for model calibration is
through pressure and temperature matching of two wells P-T logging data (Acuna, Stimac, Sirad-Azwar, & Pasikki,
2008). One of the wells is located on the western region of Salak geothermal field, while the other is located on the
eastern region. The natural state model would represent the subsurface condition of this field, and could be used for
further uses such as history matching and forecasting.
II. METHODS
The method to model natural state reservoir is basically started by literature studies about conceptual model and
geological, geochemical, and geophysical data of Salak geothermal field. The data acquisitions were acquired from
Salak geothermal field from several references. The conceptual model was acquired from Salak geothermal fields. This
conceptual model is basically built by 5 components, those are: heat source, reservoir (shape, form), reservoir
temperature, water source, and surface manifestations. The other components that are usually necessary are the
dispersion and type of rocks, rock density, directional permeability, porosity, heat conductivity, and specific heat. Then
natural state modelling would use numerical simulation until we get a constant pressure, temperature, and reservoir
condition. Last step is model calibration, the model would be validated by comparing the natural state model
calculations to the real data on the field. The parameters in the natural state model would be changed until the data
match with field data. Figure 2 shows the process of natural state modelling.
The Awibengkok Geothermal System is associated with Cianten Quarternary Volcanic Complex as volcanism product
of Indo-Australia and Eurasia Plate subduction. The oldest volcanism activity from this area was recognized as Cianten
Volcanic product that deposited from 1610 to 670 k.a. based on K-Ar dating (Stimac el.al., 2008). This volcanic product
overlies on shallow-marine carbonates and epiclastic sedimentary rocks basement. Last activity of Cianten Volcanism
was identified by caldera morphology on western side of Awibengkok Field. Within Cianten Caldera there were
younger intrusions like Mt.Salak,Mt.Gagak, Mt.Perbakti, and Mt.Endutthat served as Awibengkok Geothermal heat
sources in Figure 3.
a. Reservoir Stratigraphy
Lithology of Awibengkok reservoirs mainly consists of andesite, basalt, rhyolite, pyroclastic breccia, tuff, and lahar. As
the result of difference depositional sequence on western and eastern side, this affected reservoir characteristic on both
side. There are 4 majorformation stratigraphics that represent each geological event (Figure 4).
Basement, The shallow marine carbonate sedimentary rocks that contain tuff, volcanic fragments, lithic debris, and
volcanic ash. Based on fossil assemblage in this formation show deposition age from Miocene with shallow shelf
environment. The younger intrusion results locally high temperature metamorphism, like marl, hornsfels, and foliated
mudstone. Lower Volcanic, This formation considered as transition environment between shallow-

~Allen Haryanto Lukmana~
ISSN 2549-7197 (cetak), ISSN 2549-564X (online)
JMEL, Volume 4 Nomor 1, 2020
3
marine to subaerial volcanic. The lithology consists of andesitic to basaltic lava, hyaloclastic, and breccia. The upper
Rhyodacite Marker widespread from this formation was known as silicic eruptionand Cianten Caldera construction.
Figure 2. Research Flowchart Methodology
Figure 3. Surface Geology of the Awibengkok Area (Source: Stimac, Nordquist, Suminar, & Sirad-Azwar, 2008)
Middle Volcanic, The next volcanic activity overlie Cianten Caldera is Middle Volcanic Formation that consists of
andesitic-to-dacitic lavas, tuffs, lahars, and debris flows. This formation lithological sequences interpreted as volcanic
materials collapse and erosion from the older formation (Lower Volcanic Fm.) Upper Volcanic, Youngest formation in
Awibengkok Area that comprises of andesitic, dacitic-rhyolitic rocks sequences.Caldera associated depositional system

~Allen Haryanto Lukmana~
ISSN 2549-7197 (cetak), ISSN 2549-564X (online)
JMEL, Volume 4 Nomor 1, 2020
4
provides lateral lithology distributionwithin this geothermal system. Figure 4 shows the subsurface geology condition.
Figure 4. Subsurface Geology of Awibengkok (Sources: Stimac, Nordquist, Suminar, & Sirad-Azwar, 2008)
b. Geological Structure
In this reservoir numerical model, there are 3 main faults namely Gagak Fault, Cibeureum Fault, and Awi Fault show in
Figure 3. These geological structure have been identified based on surface and subsurface data (i.e. XRMI Log,
Lithology Offset, MEQ). These faulst impact to reservoir sub-boundary that divided Awibengkok Reservoir into four
compartements namely Western Cell, Central Cell, Eastern Cell, and Far-Eastern Cell (Figure 5). The faults occurence
also give high significant impacts to Awibengkok reservoir properties (Aprilina et al., 2015).
Figure 5. Geology Structure of Awibengkok Reservoir (Source: Aprilina et al., 2015)

~Allen Haryanto Lukmana~
ISSN 2549-7197 (cetak), ISSN 2549-564X (online)
JMEL, Volume 4 Nomor 1, 2020
5
c. Resistivity Boundary
Magnetotelluric method was used to identify low resistivity layer beneath Awibengkok Geothermal Area. These layers
associated with shallow smectite-rich cap that indicate reservoir zone below the layers. Using <10 Ω-m resistivity
countours, proven production zones of Awibengkok show correlation with shallow resistivity layers (Figure 6). The
reservoir boundary in numerical model also refer to these shallow conductors distribution (Stimac, Nordquist, Suminar,
& Sirad-Azwar, 2008).
Figure 6. Low Resistivity Boundary based on MT Survey (Source: Stimac, Nordquist, Suminar, & Sirad-Azwar, 2008
III. RESULT AND DISCUSSION
Salak is a liquid-dominated geothermal system with benign fluid chemistry. At initial conditions the reservoir had a
liquid pressure profile up to the highest point of the reservoir at approximately 560 m above sea level (masl). The main
feature of the reservoir geometry as described by (James Stimac, 2000) is a relatively shallow reservoir top on the
eastern side of the field. The reservoir top is deeper on the hotter western and southern sides of the field. The Western
well (Well_1) had the highest initial measured temperatures (290 - 312 ◦C). The Eastern well has initial 250 to 260 oC
temperatures. The P-T data of the two wells is given by the following graph and table show in Figure 7.
Figure 7. Pre-Exploitation Pressure Gradient (dashed line) and Temperature Distribution in Western and Eastern Part in
Awibengkok as Determined (Source: Acuna, Stimac, Sirad-Azwar, & Pasikki, 2008)

~Allen Haryanto Lukmana~
ISSN 2549-7197 (cetak), ISSN 2549-564X (online)
JMEL, Volume 4 Nomor 1, 2020
6
Only one feed zone in those wells. The observed pressure depletion rates throughout most of the reservoir are similar,
although some areas appear to be separated by semi-permeable barriers that correspond primarily to zones of faulting
and recent intrusion (Stimac, Nordquist, Suminar, & Sirad-Azwar, 2008)
a. Numerical Model
The geothermal system is interpreted by reservoir model. To build reservoir model, comprehensive 3-G data should be
collected. Modeler will process those data and able to give feedback to update the conceptual model of the system. In
this paper, reservoir model study will be focused on before exploitation condition. Gathering data is done by collecting
information from published technical paper.
The design of the grid for the Awibengkok model covered an area of 18 km2. Its grid design consisted of 8 layers,
where each layer is divided into 31 rows (NE-SW, x direction) and 24 columns (NW-SE, y direction). The total number
of elements or blocks was 6144. However, Awibengkok model consider the topography Figure 8.
Figure 8. Vertical layers for the Awibengkokmodel. The top of the model follows the topography and the base of the
model is set at -1552.3 mbsl
The data file contains rock properties and the deep heat and mass flows for the model. The rock properties are set up by
deciding on the rock-types to be used in the model and their parameters such as density, porosity, permeability, thermal
conductivity and specific heat. The assignment of the rock-types for each block in the model is also set in this data file.
The rock properties in the new Awibengkok model were initially divided into three major rock-types: Andesitic–
Rhyodacitic. Several identified faults were also included in the model and assigned their own rock-type. The rocks and
faults for the model were assigned based on the 3G data (geology, geochemistry, geophysics) and the conceptual model.
All rocks and faults were assumed to have a rock density of 2600 kg/m3, a thermal conductivity of 2.5 W/m.K and a
specific heat of 1000 J/kg.K. The porosity value is assumed to be 10%. Some of the heat and mass flows into or out of
the model were also set. The deep heat and mass flows were set at the blocks at base (bottom layer). The outflows are
based on two wells which located in western part and eastern part of the whole reservoir show in Figure 9.
Atmospheric conditions are assigned at the top surface in block “ATM” (pressure of 1 bara and mean annual
temperature of 25°C). All the side boundaries are assumed to be no-flow boundaries. This means there is no heat or
mass coming into or out of the system. Since the Awibengkok Geothermal System is a liquid dominated reservoir, mass
inflows are specified at parts of the base of the model (Layer 8), distributed across several locations around the potential
production area. The determination of the best locations for the hot up flows is part of the model calibration process
Figure 10.
The enthalpy of the deep mass flow varies from 1000-1100 kJ/kg. Initially the mass flows were located at the points
suggested by the conceptual model, mainly beneath Well 1. These sources provided a convective effect in the model
and a maximum base temperature of about 335°C. However, during the calibration process, several adjustments were
made and the mass flow was spread out into several locations. The total mass flow in this model is 75 kg/s.

~Allen Haryanto Lukmana~
ISSN 2549-7197 (cetak), ISSN 2549-564X (online)
JMEL, Volume 4 Nomor 1, 2020
7
Figure 9. Material Distribution in Model
Figure 10. Initial mass flow location (red circles)
b. Equations-of-State (EOS)
The Computer model in TOUGH2 will use EOS1, the equation of state (EOS) model used formulation phase water and
tracer. The Awibengkok reservoir model was used to simulate the natural state conditions of the reservoir. The results
from that simulation can be used to check whether the initial conceptual model is viable or not and to predict the
reservoir conditions in the surrounding area as well as in the proven/drilled area. The unexplored area is of interest
because it may have potential in the future.
In this study, the natural state calibration process involves matching temperature profiles from 2 pre-exploitation wells
in Awibengkok represent western and eastern area of reservoir.
There are applied in the manual calibration process, adjusting the deep inflows/mass flow locations at the bottom layer
of the model (spreading out the mass flow). The initial location of the mass flow, based on conceptual model, was
beneath Well 1. Then, Adjusting the magnitude and enthalpy of the deep mass flow. These inputs more heat into the
reservoir and increases the bottom temperatures along temperature distribution. Then, changing the permeability of the
rock types. In the initial model, the assigned permeability is based on the best estimates from the conceptual model and
3G data. Run being made from those data and try to match conceptual model with created model. And so, for reservoir
permeabilities value can be interpreted from 400 to 1000 mD.
~Allen Haryanto Lukmana~
ISSN 2549-7197 (cetak), ISSN 2549-564X (online)
JMEL, Volume 4 Nomor 1, 2020
8
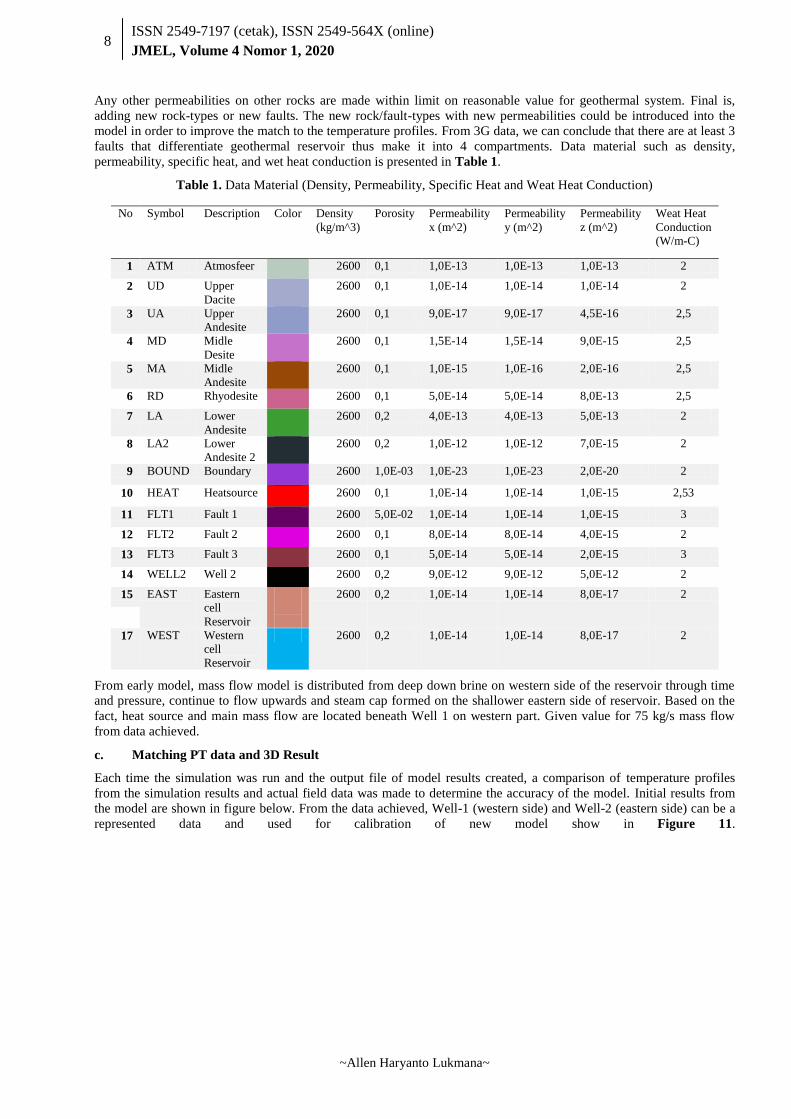
Any other permeabilities on other rocks are made within limit on reasonable value for geothermal system. Final is,
adding new rock-types or new faults. The new rock/fault-types with new permeabilities could be introduced into the
model in order to improve the match to the temperature profiles. From 3G data, we can conclude that there are at least 3
faults that differentiate geothermal reservoir thus make it into 4 compartments. Data material such as density,
permeability, specific heat, and wet heat conduction is presented in Table 1.
Table 1. Data Material (Density, Permeability, Specific Heat and Weat Heat Conduction)
No Symbol Description Color Density
(kg/m^3)
Porosity Permeability
x (m^2)
Permeability
y (m^2)
Permeability
z (m^2)
Weat Heat
Conduction
(W/m-C)
1 ATM Atmosfeer 2600 0,1 1,0E-13 1,0E-13 1,0E-13 2
2 UD Upper
Dacite
2600 0,1 1,0E-14 1,0E-14 1,0E-14 2
3 UA Upper
Andesite
2600 0,1 9,0E-17 9,0E-17 4,5E-16 2,5
4 MD Midle
Desite
2600 0,1 1,5E-14 1,5E-14 9,0E-15 2,5
5 MA Midle
Andesite
2600 0,1 1,0E-15 1,0E-16 2,0E-16 2,5
6 RD Rhyodesite 2600 0,1 5,0E-14 5,0E-14 8,0E-13 2,5
7 LA Lower
Andesite
2600 0,2 4,0E-13 4,0E-13 5,0E-13 2
8 LA2 Lower
Andesite 2
2600 0,2 1,0E-12 1,0E-12 7,0E-15 2
9 BOUND Boundary 2600 1,0E-03 1,0E-23 1,0E-23 2,0E-20 2
10 HEAT Heatsource 2600 0,1 1,0E-14 1,0E-14 1,0E-15 2,53
11 FLT1 Fault 1 2600 5,0E-02 1,0E-14 1,0E-14 1,0E-15 3
12 FLT2 Fault 2 2600 0,1 8,0E-14 8,0E-14 4,0E-15 2
13 FLT3 Fault 3 2600 0,1 5,0E-14 5,0E-14 2,0E-15 3
14 WELL2 Well 2 2600 0,2 9,0E-12 9,0E-12 5,0E-12 2
15 EAST Eastern
cell
Reservoir
2600 0,2 1,0E-14 1,0E-14 8,0E-17 2
17 WEST Western
cell
Reservoir
2600 0,2 1,0E-14 1,0E-14 8,0E-17 2
From early model, mass flow model is distributed from deep down brine on western side of the reservoir through time
and pressure, continue to flow upwards and steam cap formed on the shallower eastern side of reservoir. Based on the
fact, heat source and main mass flow are located beneath Well 1 on western part. Given value for 75 kg/s mass flow
from data achieved.
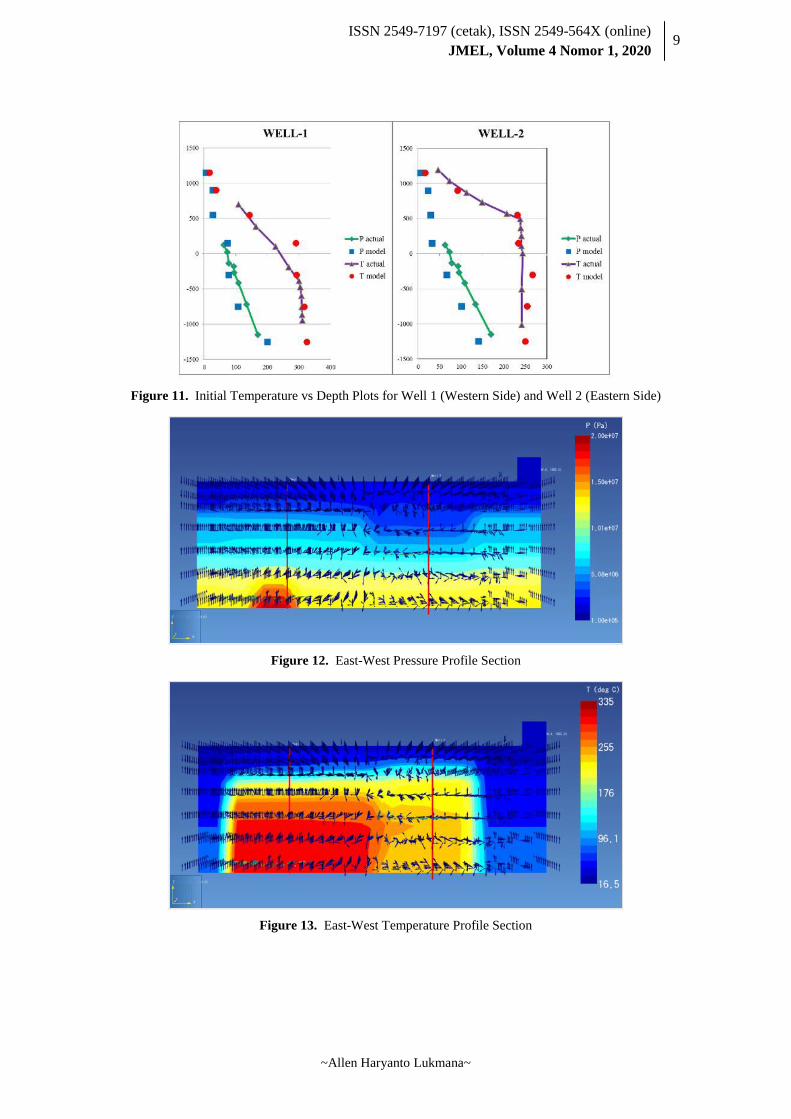
c. Matching PT data and 3D Result
Each time the simulation was run and the output file of model results created, a comparison of temperature profiles
from the simulation results and actual field data was made to determine the accuracy of the model. Initial results from
the model are shown in figure below. From the data achieved, Well-1 (western side) and Well-2 (eastern side) can be a
represented data and used for calibration of new model show in Figure 11.
~Allen Haryanto Lukmana~
ISSN 2549-7197 (cetak), ISSN 2549-564X (online)
JMEL, Volume 4 Nomor 1, 2020
9
Figure 11. Initial Temperature vs Depth Plots for Well 1 (Western Side) and Well 2 (Eastern Side)
Figure 12. East-West Pressure Profile Section
Figure 13. East-West Temperature Profile Section
~Allen Haryanto Lukmana~
ISSN 2549-7197 (cetak), ISSN 2549-564X (online)
JMEL, Volume 4 Nomor 1, 2020
10
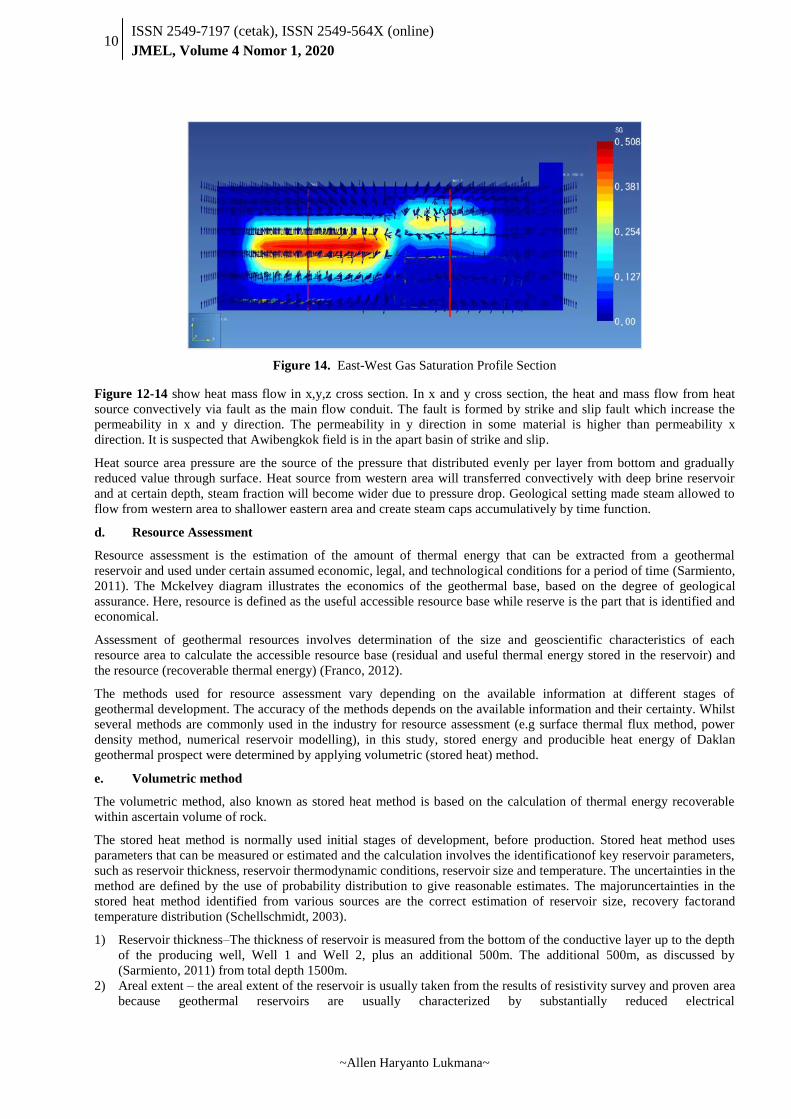
Figure 14. East-West Gas Saturation Profile Section
Figure 12-14 show heat mass flow in x,y,z cross section. In x and y cross section, the heat and mass flow from heat
source convectively via fault as the main flow conduit. The fault is formed by strike and slip fault which increase the
permeability in x and y direction. The permeability in y direction in some material is higher than permeability x
direction. It is suspected that Awibengkok field is in the apart basin of strike and slip.
Heat source area pressure are the source of the pressure that distributed evenly per layer from bottom and gradually
reduced value through surface. Heat source from western area will transferred convectively with deep brine reservoir
and at certain depth, steam fraction will become wider due to pressure drop. Geological setting made steam allowed to
flow from western area to shallower eastern area and create steam caps accumulatively by time function.
d. Resource Assessment
Resource assessment is the estimation of the amount of thermal energy that can be extracted from a geothermal
reservoir and used under certain assumed economic, legal, and technological conditions for a period of time (Sarmiento,
2011). The Mckelvey diagram illustrates the economics of the geothermal base, based on the degree of geological
assurance. Here, resource is defined as the useful accessible resource base while reserve is the part that is identified and
economical.
Assessment of geothermal resources involves determination of the size and geoscientific characteristics of each
resource area to calculate the accessible resource base (residual and useful thermal energy stored in the reservoir) and
the resource (recoverable thermal energy) (Franco, 2012).
The methods used for resource assessment vary depending on the available information at different stages of
geothermal development. The accuracy of the methods depends on the available information and their certainty. Whilst
several methods are commonly used in the industry for resource assessment (e.g surface thermal flux method, power
density method, numerical reservoir modelling), in this study, stored energy and producible heat energy of Daklan
geothermal prospect were determined by applying volumetric (stored heat) method.
e. Volumetric method
The volumetric method, also known as stored heat method is based on the calculation of thermal energy recoverable
within ascertain volume of rock.
The stored heat method is normally used initial stages of development, before production. Stored heat method uses
parameters that can be measured or estimated and the calculation involves the identificationof key reservoir parameters,
such as reservoir thickness, reservoir thermodynamic conditions, reservoir size and temperature. The uncertainties in the
method are defined by the use of probability distribution to give reasonable estimates. The majoruncertainties in the
stored heat method identified from various sources are the correct estimation of reservoir size, recovery factorand
temperature distribution (Schellschmidt, 2003).
1) Reservoir thickness–The thickness of reservoir is measured from the bottom of the conductive layer up to the depth
of the producing well, Well 1 and Well 2, plus an additional 500m. The additional 500m, as discussed by
(Sarmiento, 2011) from total depth 1500m.
2) Areal extent – the areal extent of the reservoir is usually taken from the results of resistivity survey and proven area
because geothermal reservoirs are usually characterized by substantially reduced electrical

~Allen Haryanto Lukmana~
ISSN 2549-7197 (cetak), ISSN 2549-564X (online)
JMEL, Volume 4 Nomor 1, 2020
11
3) resistivity relative to their surroundings. They mainly represent conductive layer which is the formation of cap rock
that serves to contain the geothermal fluid. The bottom of this conductive layer is usually measured as the area of
the reservoir. The areal extent of the Awibengkok geothermal prospect was measured from Figure 6 covered by the
base of the conductive layer, which is around 24 km2. Both area and thickness can still be subdivided further by
considering the distribution of temperature gradient.
4) Rock porosity – rock porosity is defined as the ratio of volume of pore space to the volume of the system. Unless a
geothermal area has been extensively cored or studied, values for porosity is usually assumed.
5) Rock density – to estimate the rock density of a Andesite Rock type, the correlation made by Siegfried(2003)was
used, with values ranging from 2200 to 3000 kg/m3.
6) Rock specific heat – to estimate the specific heat of the rock, which is temperature dependent, the correlation SNI
13-6482-2000 was used, with values 1kJ/kg oC for high temperature.
7) Reservoir temperature–the bottom hole temperature taken from Well 1 (335oC) and Well 2 (240
oC) will be
considered for thevolumetric reserve estimation. Likewise, for the Monte Carlo simulation, the average reservoir
temperature will be considered. A cut-off temperature of 180oC is also adapted.
8) Recovery factor-reserve estimation is especially sensitive to recovery factor and conversion efficiency. The values
used usuallyvaries but are also not supported by reasonable justification on its use. Based on the review given in
SKM (Lawless 2007), a recovery factor of 2.5 times porosity was used forthis study.
9) Conversion efficiency–it is the ratio of net electric power generated to the geothermal heat produced (S. J. Zarrouk
2013). From thework of SNI 13-6482-2000, conversion efficiency is depend on the resource temperature/enthalpy
10) Plant life–a geothermal project in the Philippines is initially given a 30-year contract, thus a plant life of 30 years is
adapted.
The result of the calculation reveals that the Awibengkok area can support a 507.5 MWe development for 30 years.
f. Monte Carlo simulation
Monte Carlo simulation technique is used as the probabilistic approach for the assessment of low temperature
geothermal field. This method relies on a specified probability distribution of each of the input variables and generates
an estimate of the overall uncertainty in the prediction due to all uncertainties in the variables (Whitlock, 2008). For
estimating geothermal production capacity, this method is applied to the parameters of the volumetric stored heat
equation where the parameters are allowed to vary over a range of values and within a defined probability distribution
function (Grant, 2011).
Table 2. Probability Distribution
Variable Min Max
Area (sq-km) = 18 24
Thickness (m) = 1000 2000
Rock Dens. (kg/cu-m) = 2400 2700
Porosity (fract) = 0.1
Rock Heat Cap. (kJ/(kg.deg-C)) = 1 1.5
Life Time (years) = 30
RF (fract) = 0.25 0.5
Elect. Eff. (fract) = 0.1 0.11
Ti (deg-C) = 240 335
Tf (deg-C) = 180
Water Sat. Init. (fract) = 0.9
Water Sat. Fina. (fract) = 0.3 0.5
Various input parameters to this analysis are summarized in Table 2. Most likely estimates are given as well as
estimated probability distributions and minimum and maximum values for different input parameters. These input
parameters are used in the Monte Carlo simulation in excel spreadsheet. The simulation runs can be as much as time
~Allen Haryanto Lukmana~
ISSN 2549-7197 (cetak), ISSN 2549-564X (online)
JMEL, Volume 4 Nomor 1, 2020
12
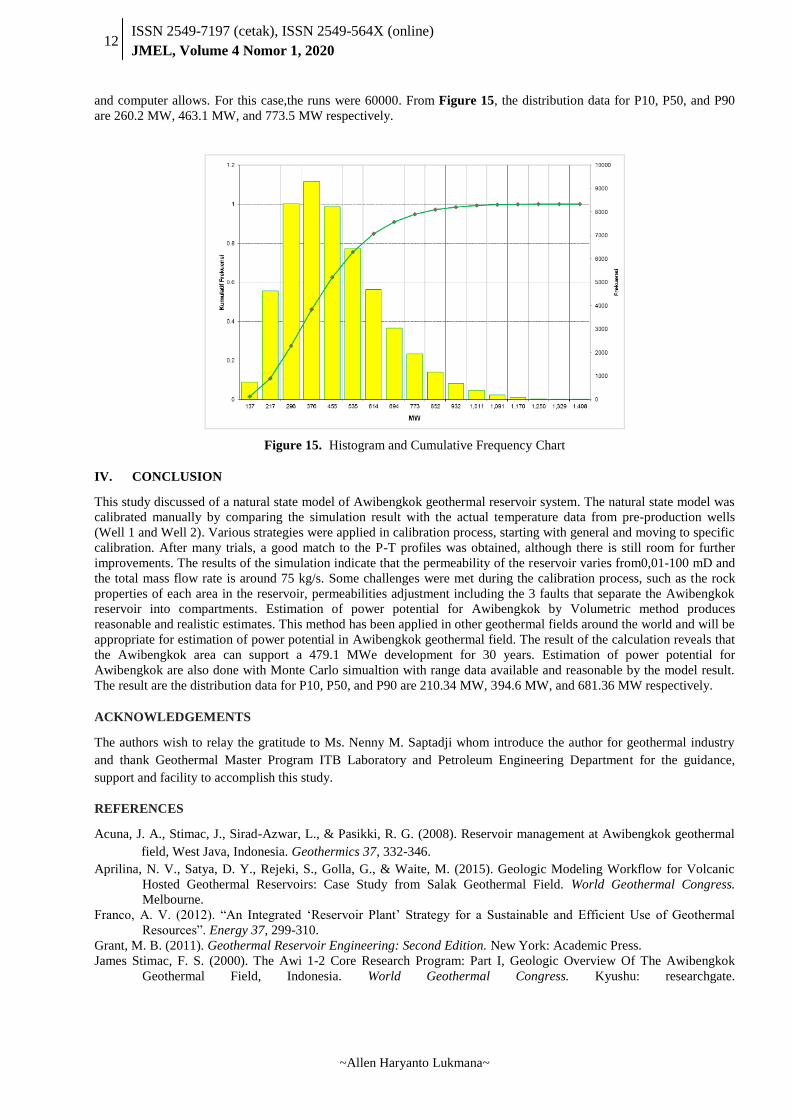
and computer allows. For this case,the runs were 60000. From Figure 15, the distribution data for P10, P50, and P90
are 260.2 MW, 463.1 MW, and 773.5 MW respectively.
Figure 15. Histogram and Cumulative Frequency Chart
IV. CONCLUSION
This study discussed of a natural state model of Awibengkok geothermal reservoir system. The natural state model was
calibrated manually by comparing the simulation result with the actual temperature data from pre-production wells
(Well 1 and Well 2). Various strategies were applied in calibration process, starting with general and moving to specific
calibration. After many trials, a good match to the P-T profiles was obtained, although there is still room for further
improvements. The results of the simulation indicate that the permeability of the reservoir varies from0,01-100 mD and
the total mass flow rate is around 75 kg/s. Some challenges were met during the calibration process, such as the rock
properties of each area in the reservoir, permeabilities adjustment including the 3 faults that separate the Awibengkok
reservoir into compartments. Estimation of power potential for Awibengkok by Volumetric method produces
reasonable and realistic estimates. This method has been applied in other geothermal fields around the world and will be
appropriate for estimation of power potential in Awibengkok geothermal field. The result of the calculation reveals that
the Awibengkok area can support a 479.1 MWe development for 30 years. Estimation of power potential for
Awibengkok are also done with Monte Carlo simualtion with range data available and reasonable by the model result.
The result are the distribution data for P10, P50, and P90 are 210.34 MW, 394.6 MW, and 681.36 MW respectively.
ACKNOWLEDGEMENTS
The authors wish to relay the gratitude to Ms. Nenny M. Saptadji whom introduce the author for geothermal industry
and thank Geothermal Master Program ITB Laboratory and Petroleum Engineering Department for the guidance,
support and facility to accomplish this study.
REFERENCES
Acuna, J. A., Stimac, J., Sirad-Azwar, L., & Pasikki, R. G. (2008). Reservoir management at Awibengkok geothermal
field, West Java, Indonesia. Geothermics 37, 332-346.
Aprilina, N. V., Satya, D. Y., Rejeki, S., Golla, G., & Waite, M. (2015). Geologic Modeling Workflow for Volcanic
Hosted Geothermal Reservoirs: Case Study from Salak Geothermal Field. World Geothermal Congress.
Melbourne.
Franco, A. V. (2012). “An Integrated „Reservoir Plant‟ Strategy for a Sustainable and Efficient Use of Geothermal
Resources”. Energy 37, 299-310.
Grant, M. B. (2011). Geothermal Reservoir Engineering: Second Edition. New York: Academic Press.
James Stimac, F. S. (2000). The Awi 1-2 Core Research Program: Part I, Geologic Overview Of The Awibengkok
Geothermal Field, Indonesia. World Geothermal Congress. Kyushu: researchgate.

~Allen Haryanto Lukmana~
ISSN 2549-7197 (cetak), ISSN 2549-564X (online)
JMEL, Volume 4 Nomor 1, 2020
13
Peter, P., Kusumah, Y. I., & Ryder, A. (2015). Evaluation of Production Multilateral Well in Salak Geothermal Field,
Indonesia. World Geothermal Congress. Melbourne.
Sarmiento. (2011). Application of well testing in assessing geothermal resources Proceedings of the “Short Course on
Geothermal Drilling, Resource Development and Power Plants”. LaGeo (p. 13 pp). Santa Tecla, El Salvador,
13 pp: UNU-GTP .
Schellschmidt, H.-D. V. (2003). Influence of temperature on thermal conductivity, thermal capacity and thermal
diffusivity for different types of rock. Physics and Chemistry of the Earth, Parts A/B/C , 499-509.
Stimac, J., Nordquist, G., Suminar, A., & Sirad-Azwar, L. (2008). An Overview of the Awibengkok Geothermal
System, Indonesia. Geothermics 37, 300-331.
Whitlock, M. H. (2008). Monte Carlo Methods, Second Edition. Wiley‐VCH Verlag GmbH & Co. KGaA.