A NATIONAL SURVEY ON THE USE OF - … A NATIONAL SURVEY ON THE USE OF MEDICINES (NSUM) BY MALAYSIAN...
103
1
Transcript of A NATIONAL SURVEY ON THE USE OF - … A NATIONAL SURVEY ON THE USE OF MEDICINES (NSUM) BY MALAYSIAN...

1

2
A NATIONAL SURVEY ON THE USE OF MEDICINES (NSUM) BY MALAYSIAN
CONSUMERS
Edited and prepared by: Mohamed Azmi H, Fahad S
With contributions from: Mohd Dziehan M, Che Pun B, Salmiah MA, Siti Fauziah A, Norazlin AK, Abdul Haniff MY,
Kamarudin A, Siew LJ , Lai ST
A publication of the
Pharmaceutical Services Division
Ministry of Health Malaysia

3
Jun 2016
© Ministry of Health Malaysia
Published by:
Quality Use of Medicines
Pharmaceutical Services Division
Ministry of Health Malaysia
Lot 36, Jalan Universiti,
46350 Petaling Jaya,
Selangor Darul Ehsan,
Malaysia.
Tel : (603) 7841 3200
Fax : (603) 7968 2222
Website : http://www.pharmacy.gov.my
This report is copyrighted. Reproduction and dissemination of this report in part or in whole for
research, educational or other non-commercial purposes are authorised without any prior
written permission from the copyright holders provided the source is fully acknowledged.
Suggested citation is: Pharmaceutical Services Division, Ministry of Health Malaysia. A
National Survey on the Use of Medicines (NSUM) by Malaysian Consumers 2015.
This report is also published electronically on the website of the Pharmaceutical Services
Division at: http://www.pharmacy.gov.my.
NMRR ID:
The National Survey on the Use of Medicines (NSUM) by Malaysian Consumers 2015 had
been registered at National Medical Research Registry with the given ID No.: NMRR- 15-265-
24824.

4
CONTENTS PAGE
Acknowledgement 5
Executive Summary 6
NSUM Project Team 9
Data Collectors 10
List of tables 13
1.0 Introduction 15
2.0 Objectives 17
3.0 Methodology 17
3.1 Sample size 18
3.2 Sampling method 18
3.3 Ethical issue 19
4.0 Results 19
4.1 Demographic data 19
4.2 Pattern of medicines use 22
4.3 Access to healthcare professionals 23
4.4 Access to medicines 25
4.5 Perceptions towards medicines labelling 33
4.6 Awareness towards appropriate use of medicines 47
4.7 Assessment towards medication compliance 64
4.8 Assessment of medicine information resources 67
4.9 Awareness on ‘Know Your Medicines’ programme 79
5.0 Discussions 84
6.0 Conclusions 89
7.0 Limitations 89
References 90
Appendixes 94

5
ACKNOWLEDGEMENT
First and foremost we would like to express our most gratitude to the Director General of Health Malaysia for the permission in publishing this report. Sincere appreciation also to the Ministry of Health Malaysia (MOH) for giving us the opportunity to collaborate in this project and coming up with the third report after eight years Quality Use of Medicines-Consumer campaign was launched.
To evaluate the performance of the campaign, A National Survey on the Use of Medicines (NSUM) by Malaysian Consumers were conducted in year 2015. Indeed it was a great effort by all the parties involved in the survey until this report is published.
We also would like to thank all the data collectors from the various parts of the nation whose enthusiasm, determination and perseverance shown during the training and data collecting sessions which yielded excellent data to be used in this report. Finally, we would like to thank all our colleagues from MOH, Universiti Sains Malaysia (USM) for the excellent intellectual inputs in making this research project a success. We really hope that the output of this report could be utilized by those interested parties in improving consumer use of medicines.
Pharmaceutical Services Division Ministry of Health Malaysia

6
EXECUTIVE SUMMARY
Quality Use of Medicines (QUM) is one of the central objectives of Malaysia’s National
Medicines Policy. Within the context of QUM framework, it is crucial to get current data
from the general population in order to assess their understanding on issues related
to rational use of medicines. In addition, information from the survey will help the policy
makers to evaluate the impact of strategies that had been taken in order to improve
quality use of medicines among consumers in this country. Furthermore, the data gain
from such survey will be useful for devising future strategies to further enhance quality
use of medicines among Malaysian population.
In order to get in-depth data and information on issues related to medicines use among
Malaysian consumers, a cross sectional national survey for a period of 3 months
(June-August 2015) was conducted among 3,081 consumers across the country. The
study findings showed that:
Malaysian consumers were found to be using some form of pharmaceuticals,
traditional health compounds and beauty products in their everyday life to manage
their health, general well-being and appearance. Of these,
30.3% were on chronic medications,
21.5-31.8% were using vitamins, minerals & supplements,
7.9-16.8% were using traditional medicines in the form of herbal beverages,
processed and non-processed herbs, and
10.9% were using beauty products.
Spending on medicines obtained from private hospitals recorded an average of
RM296.98 monthly while in private pharmacies was average RM135.20 monthly.

7
Despite extensive use of pharmaceuticals,
18.6% did not fully understand the proper use of their medicines,
46.8% were not able to identify the trade or generic name of their medicines,
17.0% had no knowledge on proper medicine storage,
29.7% were not aware of common side effects of their medicines and
31.6% were not aware of the possible interactions between traditional and modern
medicines.
The study also found that;
Doctors were the respondents’ first point of reference when experiencing problems
with health, with slightly more than half of them (58.6%) opted to consult a doctor
in the government sector.
The three most common facilities where consumers obtained their medicines were
clinics (88.4%), hospitals (80.3%) and community pharmacies (76.1%).
Over 90% of respondents perceived medicines labels as adequate and did not
report any difficulties in reading the labels.
75.2% of the respondents considered price of medicine as an essential element to
be displayed on the label. Furthermore, 59.4% of the respondents rated price as a
factor in maintaining medication compliance.
Although an increasing proportion of consumers were more aware of the safety
and regulatory issues of medicines, compliance remained a problem, whereby
73.1% of the respondents were declared as non-compliant where they admitted
forgotten to take their prescribed medication.
An emerging problem with sharing of medicines can be anticipated with as many
as 33.9% of consumers reported to be sharing medications.

8
When acquiring medicines information, consumers’ first point of reference was the
doctors (49.6%) followed by the pharmacists (31.1%).
75.1% of the consumers preferred additional written information on medicines.
70.8% of the consumers stated that they require additional medicines counselling
sessions with pharmacists in order to understand and overcome problems
pertaining to their medicines.
Awareness of the national effort to promote quality use of medicines via the ‘Know
Your Medicines’ programme among consumers was marginally good but
participation remains relatively low.
Of those who had participated in the ‘Know Your Medicines’ programme, majority
of the respondents were satisfied with the campaign activities.

9
NSUM PROJECT TEAM Advisor Pn. Abida Haq Binti Syed M.Haq
Director of Pharmacy Practice & Development Pharmaceutical Services Division Ministry of Health, Malaysia
Consultants Prof. Dr. Mohamed Azmi bin Ahmad Hassali Deputy Dean, School of Pharmaceutical Sciences Universiti Sains Malaysia Dr. Fahad Saleem Senior Lecturer Ph.D (Social Pharmacy) School of Pharmaceutical Sciences Universiti Sains Malaysia Prof. Dr. Salmiah binti Mohd. Ali Deputy Dean (Research and Development) Head of Department & Professor of Pharmacy Practice MAHSA University
Principal Investigator Mr. Mohd. Dziehan bin Mustapa Senior Principal Assistant Director Pharmaceutical Services Division Ministry of Health, Malaysia
Co-Investigators Madam Che Pun binti Bujang Deputy Director of Pharmacy Practice and Development, Pharmaceutical Services Division Ministry of Health, Malaysia Ms. Siti Fauziah binti Abu Deputy Director Pharmacy Policy & Strategic Planning Division Ministry of Health, Malaysia Madam Norazlin binti Abd. Kadir Senior Principal Assistant Director Pharmaceutical Services Division Ministry of Health, Malaysia Mr. Abdul Haniff bin Mohamad Yahaya Pharmacist U52 Teluk Intan Hospital, Perak
Mr. Kamarudin Bin Ahmad Pharmacist U52 Miri Hospital, Sarawak Madam Siew Lee Jin Senior Assistant Director Pharmaceutical Services Division Ministry of Health, Malaysia
Madam Lai Sook Tze Senior Assistant Director Pharmaceutical Services Division, Sarawak

10
DATA COLLECTORS
PERLIS
Wan Irnayufzan Hani Wan Ab Rahman
Pharmacist Pharmaceutical Services Division, Perlis
Tan Yean Yong Pharmacist
Kampung Gial Health Clinic
Nurul Hidayah Mahamud Pharmacist
Pharmaceutical Services Division, Perlis
KEDAH
Edi Aswad Mohd Nain
Pharmacist Sultanah Bahiyah Hospital
Noraishah Abu Bakar
Pharmacist Pharmaceutical Services Division, Kedah
Saravanapriya a/p Thillaivanam
Pharmacist Kulim Hospital
Khor Chee Hau
Pharmacist Baling Hospital
PENANG
Shirley Lim Sheh Lee
Pharmacist Pulau Pinang Hospital
Kong Kee Foong
Pharmacist Seberang Jaya Hospital
Tan Moi Kiang
Pharmacist District Health Office, Seberang Perai Selatan
Look Chun Hua
Pharmacist District Health Office, Timur Laut, Pulau
PERAK
Nor Fadhilahanim Ramli
Pharmacist Pharmaceutical Services Division, Perak
Nurul Akma Harun
Pharmacist Batu Gajah Hospital
Shahrunnisak Abdul Karim
Pharmacist Taiping Health Clinic
Kong Pui Chin Pharmacist
Slim River Hospital
Hema a/p Krishnan Pharmacist
Gunung Rapat Health Clinic
SELANGOR
Brendan Su Hau Teck
Pharmacist Pharmaceutical Services Division, Selengor
P’ng Xiu Wen
Pharmacist Tengku Ampuan Rahimah Hospital
Muhammad Shafiq Aziz
Pharmacist Kajang Hospital
Nurul Nadiah Abu Bakar
Pharmacist Rawang Health Clinic
Ahmad Firdaus An-Nasr Nasri
Pharmacist Dengkil Health Clinic
Nurul Syazwani Mohamad
Pharmacist Telok Panglima Garang Health Clinic
Thiagarajan a/l Chandra Sekaran
Pharmacist Ijok Health Clinic
Abdul Aziz Ahmad Adli
Pharmacist Sekinchan Health Clinic
Poon Sook Fun
Pharmacist Rasa Health Clinic
Omar Othman
Pharmacist Kalumpang Health Clinic
KUALA LUMPUR
Nuruz Zakiah Md Zin Pharmacist
Pharmaceutical Services Division, JKWP KL
Gan Chin Bao Pharmacist
Cheras Health Clinic

11
Nurul Nafisah Hassan Pharmacist
Putrajaya Presnit 18 Health Clinic
Nur Fathiah Md Isa Pharmacist
Pharmaceutical Services Division, JKWP KL
Abdul Qayyum Zainal Pharmacist
Kuala Lumpur Hospital
NEGERI SEMBILAN
Teong Seng Chew Pharmacist
Pharmaceutical Services Division, Negeri Sembilan
Muhammad Fikri Abdul Halim Pharmacist
Tuanku Jaafar Hospital
Siow Yee Zhen Pharmacist
Bahau Health Clinic
MELAKA
Nurul Hayani Norddin
Pharmacist Pharmaceutical Services Division, Melaka
Fakarrudin Karim
Pharmacist Melaka Hospital
Nurul Izaty Othaman
Pharmacist Padang Sebang Health Clinic
JOHOR
Raudhatun Sa'adiah Ithnin
Pharmacist Pharmaceutical Services Division, Johor
Ahmad Nizamuddin Malek Reedzwan
Pharmacist Pharmaceutical Services Division, Johor
Mohd Norhafizi Abdul Hamid
Pharmacist Kota Tinggi Hospital
Amiruddin Mad Yusuf
Pharmacist Chaah Health Clinic
Nor Lailah Mohamad
Pharmacist Enche’ Besar Hajjah Khalsom Hospital
Mohd Azmer Lias Pharmacist
Tenggaroh Health Clinic
PAHANG Prasyaanth a/l Nadarajan
Pharmacist Pharmaceutical Services Division, Pahang
Yasodha a/p Govindasamy
Pharmacist Raub Hospital
Juliza Yahya
Pharmacist Bandar Kuantan Health Clinic
Nurhazirah Saridin
Pharmacist Chini Health Clinic
KELANTAN
Nur Haida Muhamad Pharmacist
Pharmaceutical Services Division, Kelantan
Lim Ee Laine Pharmacist
Raja Perempuan Zainab II Hospital
Mohamad Zaid Md Nor Pharmacist Jeli Hospital
Nurul Hasikin Mohd Taib
Pharmacist Tanah Merah Hospital
TERENGGANU
Nurul Fatimah Sulaiman Pharmacist
Pharmaceutical Services Division, Terengganu
Norsyaheera Young Rockie Pharmacist
Bukit Payong Health Clinic
Nor Idamarlini Mohamad Pharmacist
Kemaman Hospital
Tun Maizatul Hafiza Tuan Ahmad Pharmacist
Hulu Terengganu Hospital
SARAWAK
Heriman Mahali
Pharmacist Makmal Ubat & Stor Miri

12
Yong Hui Chu Pharmacist
Kota Sentosa Health Clinic
Vaisnavi a/p Kanthabalan Pharmacist
Sri Aman Hospital
Law Meng Hong Pharmacist
Makmal Ubat & Stor Bahagian Sarikei
Nikki Wong Shin Chyn Pharmacist
Sematan Health Clinic
SABAH
Noor Fazreen Mohd Aris
Pharmacist Pharmaceutical Services Division, Sabah
Lam Wai Hang
Pharmacist Duchess Of Kent Hospital
Dipisha a/p Babu
Pharmacist Tawau Hospital
Woo Chee Yen
Pharmacist Keningau Hospital
Tong See Nee
Pharmacist Kudat Hospital
Hana Fariza Muhammad Yunus
Pharmacist Kuala Penyu Hospital
LABUAN
Chan Chiew Ting Pharmacist
Pharmaceutical Services Division, Labuan
Tan Chee Hoong Pharmacist
Pharmaceutical Services Division, Labuan

13
LIST OF TABLES
Table 1 Demographic characteristics of respondents
Table 2 Pattern of medicine use among respondents
Table 3 General spending on prescription and non-prescription medicines
in the last 3 months
Table 4 First action taken by respondents if experiencing any health problems
Table 5 Association between consumers’ first action taken by respondents if experiencing any health problems and demographics
Table 6 Consumers’ choice of facilities to obtain medicines
Table 7 (a) Factors associated with consumers’ choice of facilities to obtain medicines
Table 7 (b) Factors associated with consumers’ choice of facilities to obtain medicines
Table 8 Consumers' perceptions towards medicines labelling
Table 9 Factors affecting medicine-label reading and consumers’ perceived labelling adequacy
Table 10 Consumers' perceptions towards medicine pricing
Table 11 Association between medicine pricing and demographic characteristics
Table 12 Consumers' perceptions towards difficulties in reading medicine labels
Table 13 Association between difficulties in reading medicine labels with demographic characteristics
Table 14 Association between labelling satisfaction with demographic characteristics
Table 15 Association between ability to identify medicines by trade/generic name with demographic characteristics
Table 16 Association between the knowledge on proper use and storage of medicine with demographic characteristics
Table 17 Association between the awareness on the side effects and shelf life of medicines with demographic characteristics
Table 18 Factors affecting the awareness on food-medicines and modern-traditional medicines interaction
Table 19 Factors Affecting medication disposal
Table 20 Response to “Did you know that all modern and traditional medicines should be registered with Ministry of Health?” based on demographic characteristics
Table 21 Factors affecting knowledge on Meditag® availability
Table 22 Association between medication adherence and demographic characteristics
Table 23 First person to contact in case of medicine related concern
Table 24 Ease of obtaining medicines related information
Table 25 Frequency of obtaining medicines information from various information sources among Malaysian consumers
14
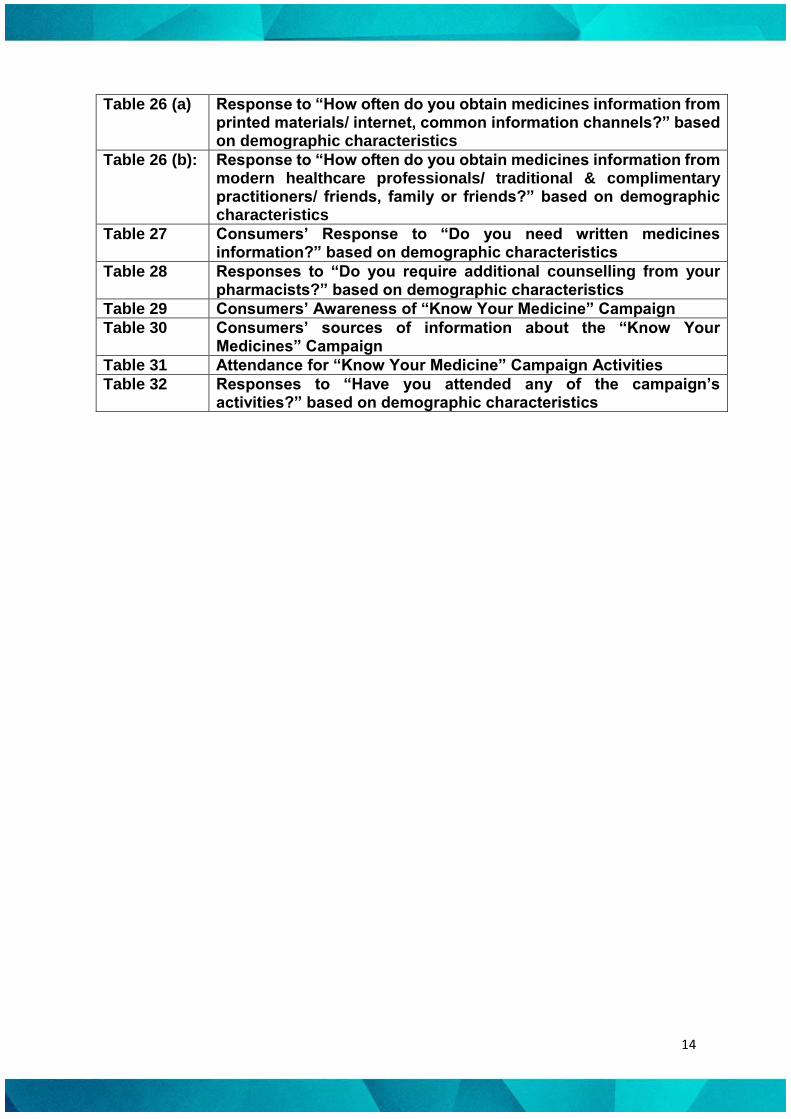
Table 26 (a) Response to “How often do you obtain medicines information from printed materials/ internet, common information channels?” based on demographic characteristics
Table 26 (b): Response to “How often do you obtain medicines information from modern healthcare professionals/ traditional & complimentary practitioners/ friends, family or friends?” based on demographic characteristics
Table 27 Consumers’ Response to “Do you need written medicines information?” based on demographic characteristics
Table 28 Responses to “Do you require additional counselling from your pharmacists?” based on demographic characteristics
Table 29 Consumers’ Awareness of “Know Your Medicine” Campaign
Table 30 Consumers’ sources of information about the “Know Your Medicines” Campaign
Table 31 Attendance for “Know Your Medicine” Campaign Activities
Table 32 Responses to “Have you attended any of the campaign’s activities?” based on demographic characteristics

15
1.0 INTRODUCTION
The discovery and use of medicines is associated with human evolution. It is also the everyday
task of hundreds of thousands of physicians, pharmacists and researchers worldwide. While
medications can help keep people healthy, they also can cause serious problems when used
incorrectly (1). It was estimated that 60% of medicines in public health facilities and 70% of
medicines in private facilities were prescribed and sold inappropriately in developing countries
(2). This inapt use of medicines results in not only reduced safety and quality of health care but
also increase the enormous wastage of health resources. Selection of medicines without
consideration for cost-effectiveness and efficacy, inefficient procurement of unnecessarily
expensive drugs, failure to prescribe medicines in accordance with standard treatment protocols,
poor dispensing practices resulting in medication errors, improper patients adherence to dosing
schedules and treatment regimens, and inappropriate self-medication are key issues associated
with irrational medicine use (3, 4). Inline to what is reported, Pirmohamed et al reported that
irrational use of medicines cost US$870 million to provide care and treatment for those who
were admitted to the hospital due to adverse medical events in the UK (5). Additionally,
irrational use of medicines was listed among the top 10 causes of morbidity and mortality in
the USA (6).
As a general concept, ‘‘Quality Use of Medicines (QUM)’’ is defined as ‘‘patients receive
medications appropriate to their clinical needs, in doses that meet their own individual
requirements for an adequate period of time, and the lowest cost to them and their community’’
(7, 8). It is now acknowledged that inappropriate use of drugs can relate to poor or negative
health outcomes, increase adverse events and health costs among healthcare consumers around
the world (9-12). This inappropriate medication use in the community is a complex issue with
no single factor being responsible. Minimising the risk of medications errors involves doctors,
patients, the practice and broader system based approaches to promote patient safety.

16
Medication errors are estimated to affect around 10% of general practice patients and up to 25%
of high risk patients who report medicine adverse events (13).
In order to achieve a holistic process of medication use, the concept of ‘Quality Use of
Medicines’ (QUM) is been widely recognized and used around the world. The very concept
not only applies to medicines in the general practice setting, but also to all medicines used by
individual patients that can affect their health.
This whole-health system view is necessary as general practice patients obtain their
medications from a range of sources such as those initiated by themselves, other general
practitioners, other medical specialists, pharmacists and complementary therapists (14). Within
this context, it was reported that 55.6% of Malaysian consumers did not understand the proper
use of their medicines (15).
In order to embark upon the unsafe use of medicines in Malaysia, the Malaysian Government,
through the Ministry of Health (MOH) developed a comprehensive National Strategy for
Quality Use of Medicines-Consumers (QUM-C). A key principle of the strategy was the
primacy of consumers in any initiative to promote QUM through effective self-care practices
via “Know Your Medicines” campaign. Whereas patients and health care providers have
always shared these decisions to some extent, the current availability medications, both
prescriptions and non-prescriptions items allows greater potential range of decision making for
patients acting with and without direct provider guidance.
Therefore, this strategy was planned in tandem with the aspiration of one of the important
components in the Malaysian National Medicines Policy that directly stresses the importance
of the QUM concept among consumers of this nation. Thus, in order to understand how
effective Malaysian healthcare consumers use their medicines and the impact on promoting the
QUM campaign, it is essential to get current data so that the health authorities can plan

17
necessary strategies to enhance consumers understanding on the concept of rational use of
drugs which is one of the main agenda in the Malaysian National Medicines Policy (16).
2.0 OBJECTIVES
i. To identify prescription and non-prescription medicine use pattern among consumers,
ii. To explore current knowledge of consumers on medicines usage,
iii. To document sources of medicines information channels that widely been used by
consumers and
iv. To evaluate consumers’ awareness toward educational programs on use of medicines.
3.0 METHODOLOGY
In order to achieve objectives of Survey, a cross sectional survey for a period of 3 months
(Starting from 1st June– 31st August 2015) was conducted with potential respondents across the
country. The questionnaire that was used in this study had been developed via consultation
with all the selected representatives involved with the “Malaysian Comprehensive National
Project on the Rational Use of Drugs” and extensive review of available literatures pertaining
to consumer surveys on rational use of medicines conducted elsewhere. The developed
questionnaire was tested for its content validity by engaging 250 patients from different
socioeconomic status and 50 pharmacists practicing in government health centres. The final
version of questionnaire consisted of six major domains, which includes demographic profile
of respondents (7 items), pattern of medicines use (3 items), access to medicines (2 items),
patient understanding on medicines (part 1 – 5 items, part 2 – 9 items, part 3 – 3 items), sources
of medicines information (5 items) and awareness of Know Your Medicines campaign (5
items). Distribution of the final version of the questionnaire was made via all the trained data

18
collectors that had been appointed by the Pharmaceutical Services Department, The Ministry
of Health Malaysia.
Inclusion criteria
i. Age 18 years and above,
ii. Non-hospitalized,
iii. Able to read, write and listen (for those who are illiterate), and
iv. Provide written consent to participate (ethical requirement)
3.1 Sample size
A cross sectional survey-involving consumers from both urban and rural areas in Malaysia was
undertaken by trained data collectors in each state. For each state, consumers were approached
for participation base on ratio of rural: urban (3:1). Based on the 95% confidence interval and
margin of error of 5%, using sample size calculator, 385 participants were needed (17). As a
national survey with an estimation of 70% participation rate, individual data collectors in each
state administered the survey, the estimated sample size was 641. By applying a common
design effect of 4 for large sample surveys, the actual sample size of population that needs to
be surveyed was 2,564 (18). For the purpose on this study, 3,081 respondents were surveyed.
3.2 Sampling method
One stage random cluster sampling technique was employed to conduct this survey.
Respondents were approached in each state based on urban to rural ratio, which was 3:1 as
from population dataset available from Malaysian Department of Statistics. By using this
method, 2,250 respondents were surveyed from urban areas whereas 750 respondents were
surveyed from rural areas. In each state, 50-250 respondents were surveyed in each cluster
(rural and urban) based on population density respectively. As for Selangor, Sabah, and Johor,
which have a higher population density in Malaysia, a larger sample size was included for

19
sampling purposes. For Selangor, sampling size was adjusted to 580 respondents and for Sabah
and Johor, around 350 respondents were surveyed (rural and urban) respectively. The public
areas, centres or recreational parks in each selected urban or rural cluster served as a point for
the conduct of the survey. The respective assigned data collectors surveyed those who visit to
this reference point randomly.
3.3 Ethical issue
The survey was approved by the Medical Research & Ethics Committee, Ministry of health
Malaysia (NMRR-15-265-24824). A written consent was obtained from each respondent
before the start of the survey. No findings, which could identify any individual participant, was
published. Participation in this research was entirely voluntary.
4.0 RESULTS
4.1 Demographic data
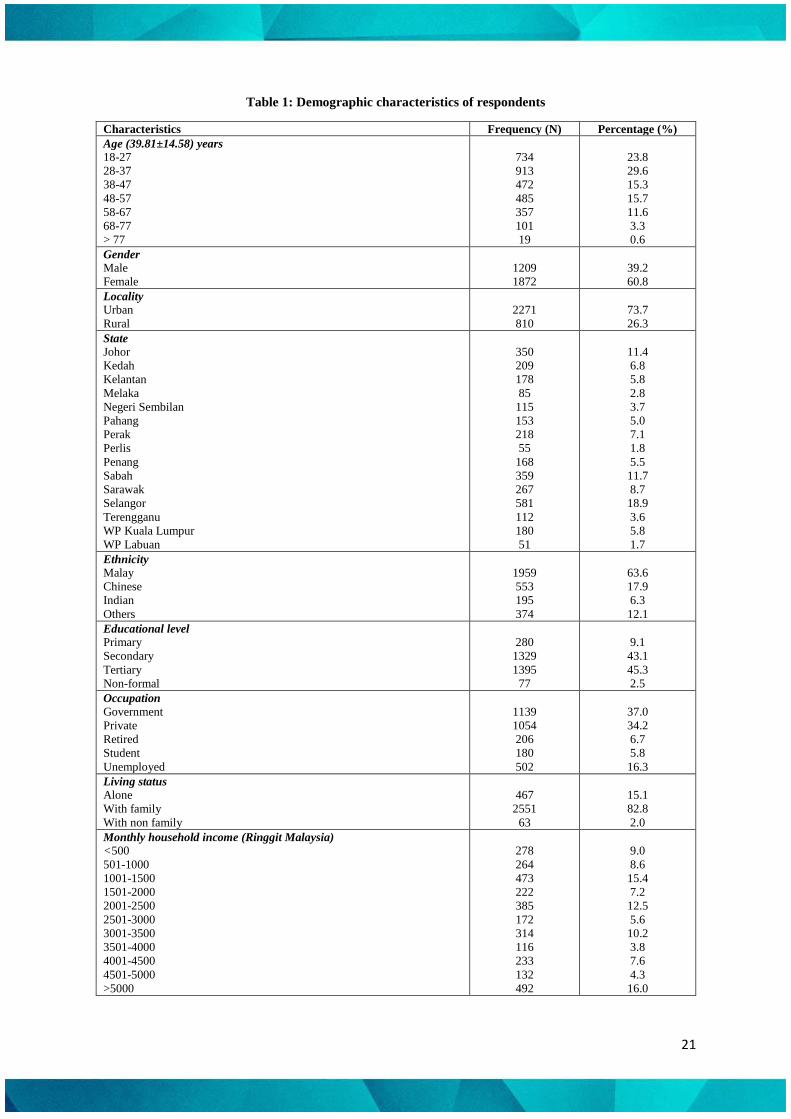
3081 responses were included in the final analysis. The mean age of the respondents was 39.81
(14.58) years. The cohort was dominated by females (1872, 60.8%) and 73.7% of the
respondents belonged to the urban locality. Preponderance of the respondents were reported
from the state of Selangor (581, 18.9%) followed by Sabah (359, 11.7%) and Johor (350,
11.4%). Malay participants consisted of 63.6% (n=1959) of the whole sample while 553
(17.9%) of the participants were Chinese followed by 374 (12.1%) belonging to the others
ethnic groups and 195 (6.3%) from the Indian ethnic group.
In terms of level of education, 1395 (45.3%) of the respondents received tertiary level of
education, while 1329 (43.1%) received the secondary level. Only 280 (9.1%) had primary
level of education and 77 (2.5%) had no formal education. 37% (n=1139) of the participants

20
were government employee while private sector employee made up of 34.2% (n= 1054) of the
participants. Majority of the participants (n=2551, 82.8%) lived with their families. 16.0% of
the respondents had monthly income of more than 5000 Ringgit Malaysia (RM) followed by
473 (15.4%) and 385 (12.5%) having RM 1001-1500 and RM 2001-2500 of monthly income
respectively
21
Table 1: Demographic characteristics of respondents
Characteristics Frequency (N) Percentage (%)
Age (39.81±14.58) years
18-27
28-37
38-47
48-57
58-67
68-77
> 77
734
913
472
485
357
101
19
23.8
29.6
15.3
15.7
11.6
3.3
0.6
Gender
Male
Female
1209
1872
39.2
60.8
Locality
Urban
Rural
2271
810
73.7
26.3
State
Johor
Kedah
Kelantan
Melaka
Negeri Sembilan
Pahang
Perak
Perlis
Penang
Sabah
Sarawak
Selangor
Terengganu
WP Kuala Lumpur
WP Labuan
350
209
178
85
115
153
218
55
168
359
267
581
112
180
51
11.4
6.8
5.8
2.8
3.7
5.0
7.1
1.8
5.5
11.7
8.7
18.9
3.6
5.8
1.7
Ethnicity
Malay
Chinese
Indian
Others
1959
553
195
374
63.6
17.9
6.3
12.1
Educational level
Primary
Secondary
Tertiary
Non-formal
280
1329
1395
77
9.1
43.1
45.3
2.5
Occupation
Government
Private
Retired
Student
Unemployed
1139
1054
206
180
502
37.0
34.2
6.7
5.8
16.3
Living status
Alone
With family
With non family
467
2551
63
15.1
82.8
2.0
Monthly household income (Ringgit Malaysia)
<500
501-1000
1001-1500
1501-2000
2001-2500
2501-3000
3001-3500
3501-4000
4001-4500
4501-5000
>5000
278
264
473
222
385
172
314
116
233
132
492
9.0
8.6
15.4
7.2
12.5
5.6
10.2
3.8
7.6
4.3
16.0

22
4.2 Pattern of medicines use
Table 2 shows the types of medicine used by consumers. Approximately, 30.3% of the
respondents reported to be on chronic medicines. Meanwhile 31.8% of the respondents were
taking vitamins, followed by minerals and supplements (21.5%). The use of non-processed and
processed herbs was reported in 7.9% and 11.5% of the respondents respectively. In addition,
16.8% of the respondents were taking herbal beverages and 10.9% of them were using beauty
care products.
Table 2: Pattern of medicine use among respondents
Items in questionnaire Frequency (N) Percentage (%)
Chronic medications
Yes
No
935
2146
30.3
69.7
Vitamins
Yes
No
980
2101
31.8
68.2
Minerals
Yes
No
661
2420
21.5
78.5
Non-processed herbs
Yes
No
244
2837
7.9
92.1
Processed herbs
Yes
No
355
2726
11.5
88.5
Herbal beverages
Yes
No
518
2563
16.8
83.2
Beauty care products derived from herbs, supplements, chemicals or
animals
Yes
No
337
2744
10.9
89.1
23
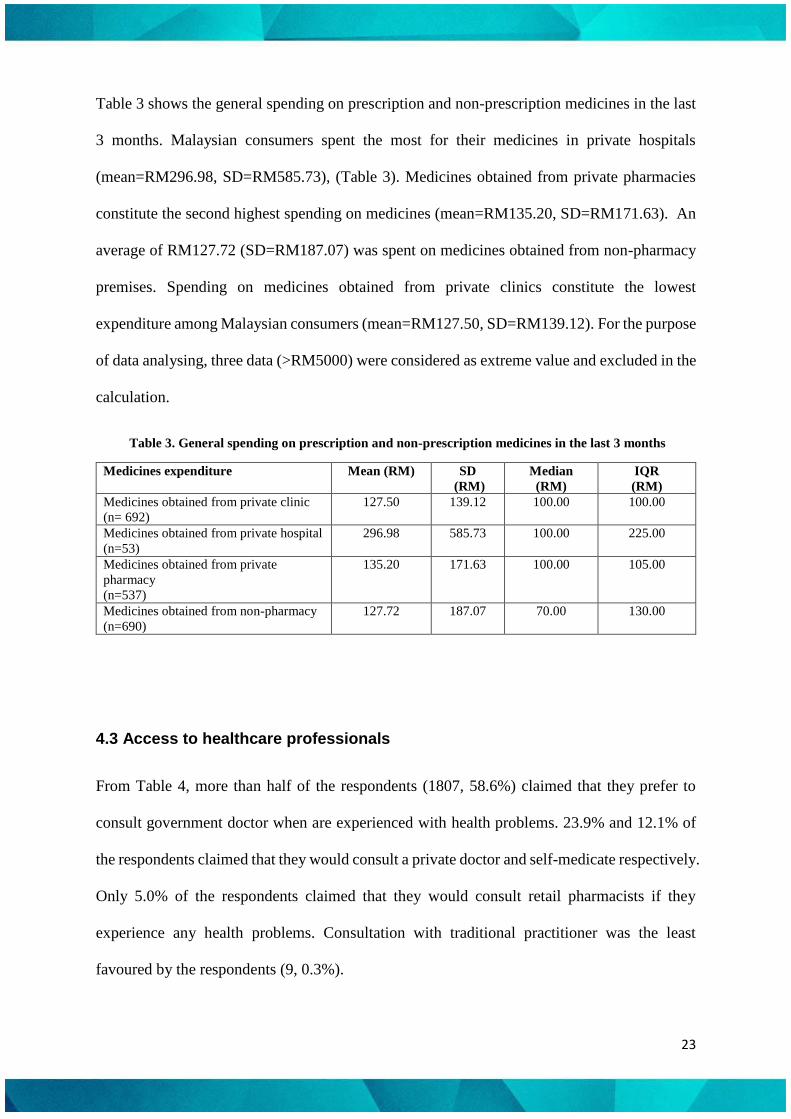
Table 3 shows the general spending on prescription and non-prescription medicines in the last
3 months. Malaysian consumers spent the most for their medicines in private hospitals
(mean=RM296.98, SD=RM585.73), (Table 3). Medicines obtained from private pharmacies
constitute the second highest spending on medicines (mean=RM135.20, SD=RM171.63). An
average of RM127.72 (SD=RM187.07) was spent on medicines obtained from non-pharmacy
premises. Spending on medicines obtained from private clinics constitute the lowest
expenditure among Malaysian consumers (mean=RM127.50, SD=RM139.12). For the purpose
of data analysing, three data (>RM5000) were considered as extreme value and excluded in the
calculation.
Table 3. General spending on prescription and non-prescription medicines in the last 3 months
Medicines expenditure Mean (RM) SD
(RM)
Median
(RM)
IQR
(RM)
Medicines obtained from private clinic
(n= 692)
127.50 139.12 100.00 100.00
Medicines obtained from private hospital
(n=53)
296.98 585.73 100.00 225.00
Medicines obtained from private
pharmacy
(n=537)
135.20 171.63 100.00 105.00
Medicines obtained from non-pharmacy
(n=690)
127.72 187.07 70.00 130.00
4.3 Access to healthcare professionals
From Table 4, more than half of the respondents (1807, 58.6%) claimed that they prefer to
consult government doctor when are experienced with health problems. 23.9% and 12.1% of
the respondents claimed that they would consult a private doctor and self-medicate respectively.
Only 5.0% of the respondents claimed that they would consult retail pharmacists if they
experience any health problems. Consultation with traditional practitioner was the least
favoured by the respondents (9, 0.3%).

24
Table 4: First action taken by respondents if experiencing any health problems
If you experience any health problems, what is the FIRST action that you’ll take? N (%)
Consult government doctor 1807 (58.6)
Consult private doctor 736 (23.9)
Consult pharmacist at pharmacy outlet 155 (5.0)
Consult traditional practitioner 9 (0.3)
Self-medication 374 (12.1)
The association between consumers’ first point of reference when experiencing any health
problems and demographic variables is reported in Table 5. The first reference point was found
to be significantly associated (p<0.001) with participants’ age, locality, ethnicity, educational
level, occupation, living status and monthly household income with effect size (φc) ranging
from 0.057 to 0.212 indicating a positive week relationship between demographics and related
study variable.
Table 5: Association between consumers’ first action taken by respondents if experiencing any health
problems and demographics
Statement p-value*
Age Gender Locality Ethnicity Educational
level
Occupation Living
status
Household
income
First action
taken by respondents if
experiencing
any health problem
<0.001
(φc=0.107)
0.081 <0.001
(φc=0.212)
<0.001
(φc=0.137)
<0.001
(φc=0.149)
<0.001
(φc=0.134)
0.012
(φc=0.057)
<0.001
(φc=0.149)
*Significant at p < 0.05; *Chi square test

25
4.4 Access to medicines
Table 6 presents consumers’ choice of facilities to obtain medicines. It was found that majority
of the respondents usually obtained their medicines from clinics (88.4%), hospitals (80.3%)
and community pharmacies (76.1%). A small proportion of consumers obtained medicines
from grocery shops (13.3%) traditional medicine outlet (7.3%), direct sales facilities (6.6%)
and night market (0.2%).
Table 6: Consumers’ choice of facilities to obtain medicines
Facility Preferred choice
N (%)
Non-preferred choice
N (%)
Hospital 2474 (80.3) 607 (19.7)
Clinic 2725 (88.4) 353 (11.5)
Community pharmacy 2346 (76.1) 733 (23.8)
Traditional medicines outlet 226 (7.3) 2855 (92.7)
Direct sales 204 (6.6) 2877 (93.4)
Grocery shop 411 (13.3) 2670 (86.7)
Night market 6 (0.2) 3075 (99.8)
Others 24 (0.8) 3057 (99.2)
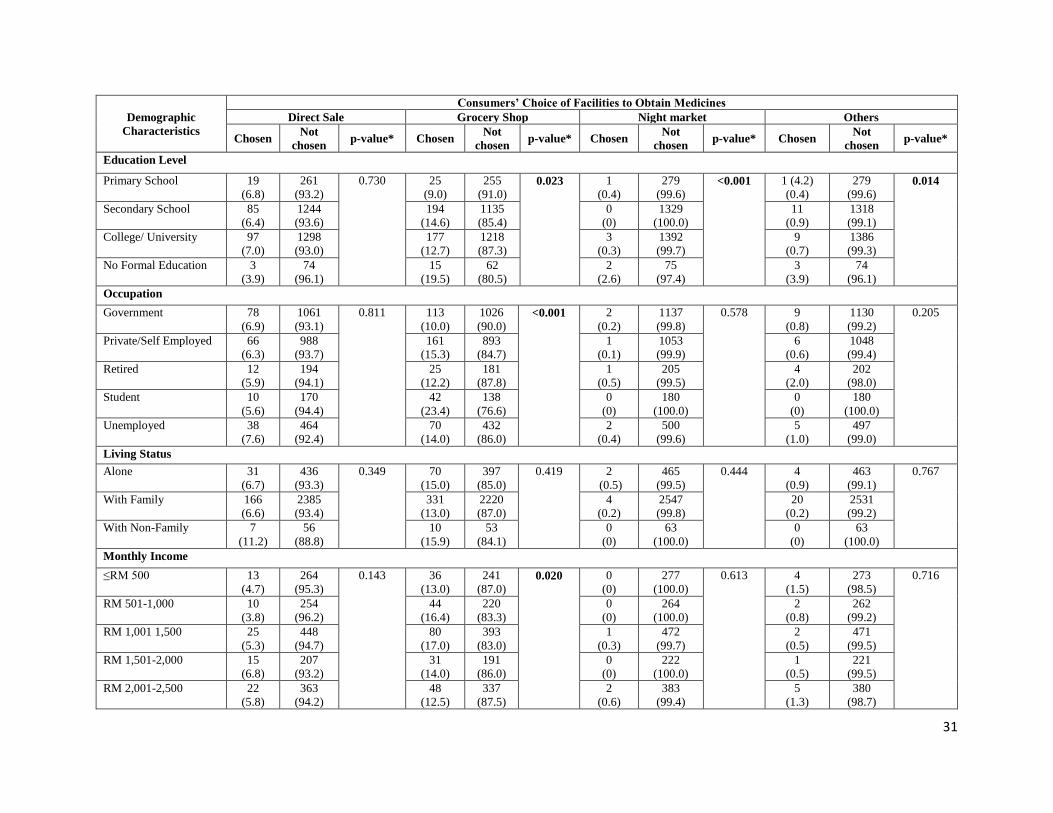
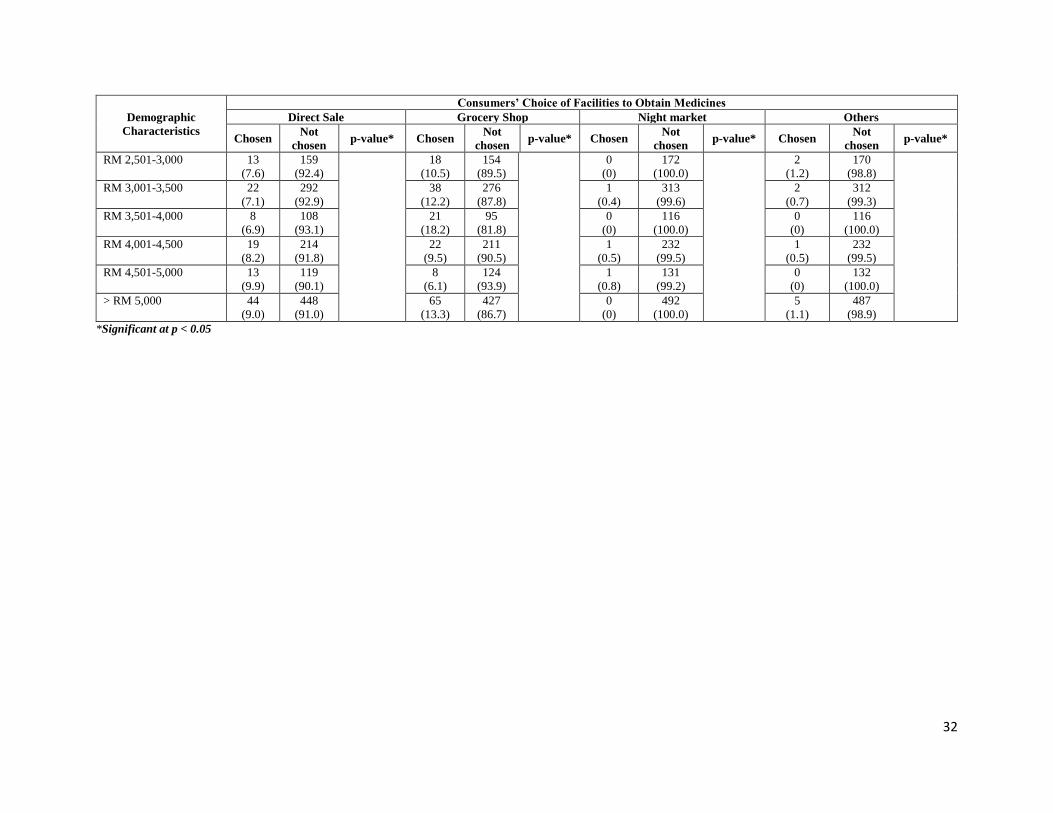
Table 7 summarize the factors associated with consumers’ choice of facilities to obtain
medicines. Consumers’ age, area of settlement, ethnicity, education, occupation, living status
and monthly household income were found to significantly (p<0.05) affect their choice to
obtain medicines from hospitals. Rural dwellers (83.1%) and Indian respondents (89.2%),
preferred to obtain their medicines from hospitals. Additionally, hospital was also preferred as
a source of medicines by retirees (85.4%), having primary education (86.4%), living with
families (81.5%) and with monthly household income of RM 501-1000 (87.5%).
Consumers’ choice to obtain medicines from clinic was associated with majority of the
demographic variables. It was found that a higher proportion of consumers living in the urban

26
area (89.0%), females (88.7%), having college/university education and working with
government sector claimed to obtain their medicines from clinic compared to their counter
parts. On the other hand, consumers’ choice to obtain medicines from community pharmacy
were found to be influenced by the locality, age, ethnicity, education level, occupation and
monthly income. Respondents who lived in urban area (80.4%), aged between 18 to 27 years
(82.4%), of Indian ethnicity (82.5%) and with college/university education (84.7%) were
found to be more prone to choose community pharmacy as their source of medicine.
As for traditional medicine outlet, the number of respondents who prefer to obtain medicines
from this facility was significantly affected by their ethnicity, education and occupation.
Chinese respondents (13.9%) and those with no formal education (16.9%) obtained medicines
from traditional medicine outlet. Additionally, urban consumers (7.6%), females (7.8%)
and belonging to the Chinese ethnic group (7.8%) were found to independently influence
Malaysian consumers’ preferences to obtain their medicines from direct sales facilities.
Besides that, consumers’ locality, age, gender, ethnicity, education level, occupation and
monthly income were also found to significantly affect the participants’ choice in obtaining
medicines from a grocery shop. Participants from urban area (14.1%), of Malay ethnicity
(15.1%) and with no formal education (19.5%) claimed to prefer to obtain medicines from a
grocery shop. Educational status was also found to affect those who have chosen night market
as their source of medicine. Consumers with no formal education (2.6%) were found to prefer
to obtain their medicines from night market compared to the other respondents.

27
Table 7 (a): Factors associated with consumers’ choice of facilities to obtain medicines
Demographic
Characteristics
Consumers’ Choice of Facilities to Obtain Medicines
Hospital Clinic Community pharmacy Traditional medicine outlet
Chosen Not
chosen p-value* Chosen
Not
chosen p-value* Chosen
Not
chosen p-value* Chosen
Not
chosen p-value*
Locality
Urban 1801
(72.8)
470
(27.2) 0.020 2022
(89.0)
247
(10.9)
0.096 1825
(80.4)
444
(19.6) <0.001 172
(7.6)
2099
(92.4)
0.395
Rural 673
(83.1)
137
(16.9)
703
(86.8)
106
(13.1)
521
(64.3)
289
(35.7)
54
(6.7)
756
(93.3)
Age
18-27 557
(75.8)
177
(24.2) 0.013 657
(89.6)
76
(10.4) 0.033 598
(82.4)
136
(17.6) <0.001 45
(6.2)
689
(93.8)
0.088
28-37 755
(82.6)
158
(17.4)
822
(90.0)
91
(10.0)
721
(78.9)
192
(21.1)
58
(6.3)
855
(93.6)
38-47 370
(78.3)
102
(21.7)
416
(88.5)
54
(11.5)
362
(77.0)
108
(23.0)
31
(6.5)
441
(93.4)
48-57 398
(82.0)
87
(18.0)
422
(87.0)
63
(13.0)
348
(71.7)
137
(28.3)
46
(9.4)
439
(90.5)
58-67 296
(82.9)
61
(17.1)
300
(84.0)
57
(16.0)
242
(67.7)
115
(32.3)
36
(10.0)
321
(90.0)
68-77 83
(80.1)
18
(19.9)
89
(88.1)
12
(11.9)
60
(59.4)
41
(40.6)
9
(8.9)
92
(91.0)
> 77 15
(78.9)
4
(21.1)
19
(100.0)
0
(0)
15
(78.9)
4
(21.1)
1
(5.2)
18
(94.7)
Gender
Male 983
(81.3)
226
(18.6)
0.258 1066
(88.2)
142
(11.8)
0.675 915
(75.7)
293
(24.2)
0.653 96
(7.9)
1113
(92.1)
0.301
Female 1491
(79.6)
381
(20.4)
1659
(88.7)
211
(11.2)
1431
(76.4)
440
(23.6)
130
(6.9)
1742
(93.1)
Ethnicity
Malay 1574
(80.3)
385
(19.7)
<0.001 1772
(90.5)
184
(9.5)
<0.001 1505
(76.9)
452
(23.1)
<0.001 133
(6.7)
1826
(93.2)
<0.001
Chinese 402
(72.6)
151
(27.3)
497
(89.8)
56
(10.1)
440
(79.5)
113
(20.4)
77
(13.9)
476
(86.1)
Indian 174
(89.2)
21
(10.7)
171
(87.6)
24
(12.3)
161
(82.5)
34
(17.4)
12
(6.1)
183
(93.8)
Others 324
(86.0)
50
(14.0)
285
(76.2)
89
(23.7)
240
(64.1)
134
(35.8)
4
(1.1)
370
(98.9)

28
Demographic
Characteristics
Consumers’ Choice of Facilities to Obtain Medicines
Hospital Clinic Community pharmacy Traditional medicine outlet
Chosen Not
chosen p-value* Chosen
Not
chosen p-value* Chosen
Not
chosen p-value* Chosen
Not
chosen p-value*
Education Level
Primary School 242
(86.4)
38
(13.7) <0.001 230
(82.1)
50
(17.9) <0.001 174
(62.1)
106
(37.7) <0.001 18
(6.4)
262
(93.6) 0.013
Secondary School 1100
(82.7)
229
(17.2)
1150
(86.6)
178
(13.4)
952
(71.7)
376
(28.3)
94
(7.0)
1235
(93.0)
College/ University 1070
(76.7)
325
(23.2)
1282
(92.0)
111
(8.0)
1181
(84.7)
213
(15.3)
101
(7.2)
1294
(92.8)
No Formal Education 62
(80.5)
15
(19.5)
63
(81.8)
14
(18.2)
39
(50.6)
38
(49.4)
13
(16.9)
64
(83.1)
Occupation
Government 919
(80.1)
220
(19.9) 0.006 1027
(90.4)
109
(9.6) 0.005 933
(82.0)
204
(18.0) <0.001 74
(6.5)
1065
(93.5) 0.008
Private/Self Employed 835
(79.2)
219
(20.8)
928
(88.0)
126
(12.0)
805
(76.4)
249
(23.7)
71
(6.7)
983
(93.3)
Retired 176
(85.4)
30
(14.6)
176
(85.4)
30
(14.6)
133
(64.6)
73
(35.4)
28
(12.3)
178
(87.7)
Student 129
(71.7)
51
(28.3)
166
(88.2)
14
(11.8)
157
(87.2)
23
(12.8)
15
(8.3)
165
(91.7)
Unemployed 415
(82.7)
87
(17.3)
428
(85.2)
74
(14.8)
318
(63.3)
184
(36.7)
38
(7.6)
464
(92.4)
Living Status
Alone 348
(74.5)
119
(25.5) 0.002 417
(89.3)
50
(10.7)
0.786 354
(75.8)
113
(24.2)
0.331 40
(8.6)
427
(91.4)
0.417
With Family 2078
(81.5)
473
(18.5)
2251
(88.3)
297
(11.7)
1939
(76.0)
610
(24.0)
183
(7.2)
2368
(92.8)
With Non-Family 48
(76.2)
15
(23.8)
57
(90.5)
6
(9.5)
53
(84.1)
10
(15.9)
3
(4.8)
60
(95.2)
Monthly Income
≤RM 500 223
(80.5)
54
(19.5) <0.001 230
(83.0)
47
(17.0) <0.001 187
(67.5)
90
(32.5) <0.001 19
(6.9)
258
(93.1)
0.999
RM 501-1,000 231
(87.5)
33
(12.5)
204
(77.3)
60
(22.7)
157
(59.4)
107
(40.5)
20
(7.6)
244
(92.4)
RM 1,001-1,500 387
(81.8)
86
(18.2)
418
(88.4)
54
(11.6)
332
(70.2)
140
(29.8)
36
(7.7)
437
(92.3)
RM 1,501-2,000 191
(86.0)
31
(14.0)
196
(88.3)
26
(11.7)
161
(72.5)
61
(27.4)
17
(7.7)
205
(92.3)

29
Demographic
Characteristics
Consumers’ Choice of Facilities to Obtain Medicines
Hospital Clinic Community pharmacy Traditional medicine outlet
Chosen Not
chosen p-value* Chosen
Not
chosen p-value* Chosen
Not
chosen p-value* Chosen
Not
chosen p-value*
RM 2,001-2,500 320
(83.1)
65
(16.9)
342
(88.8)
42
(11.2)
300
(77.9)
84
(22.1)
25
(6.5)
360
(93.5)
RM 2,501-3,000 138
(80.2)
34
(19.8)
160
(93.0)
12
(7.0)
132
(76.7)
40
(23.3)
14
(8.2)
158
(91.8)
RM 3,001-3,500 247
(78.7)
67
(21.3)
281
(89.5)
32
(10.5)
256
(81.5)
58
(18.5)
24
(7.6)
290
(92.3)
RM 3,501-4,000 83
(71.6)
33
(28.4)
101
(87.1)
15
(12.9)
90
(77.5)
26
(22.5)
10
(8.7)
106
(91.3)
RM 4,001-4,500 184
(79.0)
49
(21.0)
216
(92.7)
17
(7.3)
200
(85.8)
33
(14.2)
17
(7.3)
216
(92.7)
RM 4,501-5,000 104
(78.8)
28
(21.2)
124
(94.0)
8
(6.0)
114
(86.4)
18
(13.6)
11
(8.4)
121
(91.6)
> RM 5,000 365
(74.2)
127
(25.8)
452
(91.9)
40
(8.1)
416
(84.6)
76
(15.4)
33
(6.8)
459
(93.2)
*Significant at p < 0.05

30
Table 7 (b): Factors associated with consumers’ choice of facilities to obtain medicines
Demographic
Characteristics
Consumers’ Choice of Facilities to Obtain Medicines
Direct Sale Grocery Shop Night market Others
Chosen Not
chosen p-value* Chosen
Not
chosen p-value* Chosen
Not
chosen p-value* Chosen
Not
chosen p-value*
Locality
Urban 172
(7.6)
2099
(92.4) <0.001 320
(14.1)
1951
(85.9) 0.040 3
(0.2)
2268
(99.)
0.187 18
(0.8)
2253
(99.2)
0.885
Rural 32
(4.0)
778
(96.0)
91
(11.2)
719
(88.8)
3
(0.4)
807
(99.6)
6
(0.8)
804
(99.2)
Age
18-27 36
(5.0)
698
(95.0)
0.241 133
(18.2)
601
(81.8) 0.002 2
(0.3)
732
(99.7)
0.652 3
(0.5)
731
(99.5)
0.361
28-37 66
(7.3)
847
(92.7)
106
(11.7)
807
(88.3)
1
(0.2)
912
(99.8)
7
(0.8)
906
(99.2)
38-47 32
(6.8)
440
(93.2)
61
(13.0)
411
(87.0)
0
(0)
472
(100.0)
5
(1.1)
467
(98.9)
48-57 42
(8.7)
443
(91.3)
54
(11.2)
431
(88.8)
1
(0.3)
484
(99.7)
2
(0.5)
483
(99.5)
58-67 22
(6.2)
335
(93.8)
45
(12.7)
312
(87.3)
2
(0.6)
355
(99.4)
6
(1.7)
351
(98.3)
68-77 5
(5.0)
96
(95.0)
9
(9.0)
92
(91.0)
0
(0)
101
(100.0)
1
(1.0)
100
(99.0)
> 77 1
(5.3)
18
(94.7)
3
(15.8)
16
(84.2)
0
(0)
19
(100.0)
0
(0)
19
(100.0)
Gender
Male 59
(4.9)
1150
(95.1) 0.002 184
(15.3)
1025
(84.7) 0.014 4
(0.4)
1205
(99.6)
0.169 9
(0.8)
1200
(99.2)
0.861
Female 145
(7.8)
1727
(92.2)
227
(12.2)
1645
(87.8)
2
(0.2)
1870
(99.8)
15
(0.9)
1857
(99.1)
Ethnicity
Malay 138
(7.1)
1821
(92.9) 0.046 294
(15.1)
1665
84.9() 0.003 4
(0.3)
1955
(99.7)
0.624 17
(0.9)
1942
(99.1)
0.650
Chinese 43
(7.8)
510
(92.2)
55
(10.0)
498
(90.0)
1
(0.2)
552
(99.8)
4
(0.8)
549
(99.2)
Indian 7
(3.6)
188
(96.4)
25
(12.9)
170
(87.1)
1
(0.6)
194
(99.4)
2
(1.1)
193
(98.9)
Others 16
(4.3)
358
(95.7)
37
(9.9)
337
(90.1)
0
(0)
374
(100.0)
1
(0.3)
373
(99.7)
31
Demographic
Characteristics
Consumers’ Choice of Facilities to Obtain Medicines
Direct Sale Grocery Shop Night market Others
Chosen Not
chosen p-value* Chosen
Not
chosen p-value* Chosen
Not
chosen p-value* Chosen
Not
chosen p-value*
Education Level
Primary School 19
(6.8)
261
(93.2)
0.730 25
(9.0)
255
(91.0) 0.023 1
(0.4)
279
(99.6) <0.001 1 (4.2)
(0.4)
279
(99.6) 0.014
Secondary School 85
(6.4)
1244
(93.6)
194
(14.6)
1135
(85.4)
0
(0)
1329
(100.0)
11
(0.9)
1318
(99.1)
College/ University 97
(7.0)
1298
(93.0)
177
(12.7)
1218
(87.3)
3
(0.3)
1392
(99.7)
9
(0.7)
1386
(99.3)
No Formal Education 3
(3.9)
74
(96.1)
15
(19.5)
62
(80.5)
2
(2.6)
75
(97.4)
3
(3.9)
74
(96.1)
Occupation
Government 78
(6.9)
1061
(93.1)
0.811 113
(10.0)
1026
(90.0) <0.001 2
(0.2)
1137
(99.8)
0.578 9
(0.8)
1130
(99.2)
0.205
Private/Self Employed 66
(6.3)
988
(93.7)
161
(15.3)
893
(84.7)
1
(0.1)
1053
(99.9)
6
(0.6)
1048
(99.4)
Retired 12
(5.9)
194
(94.1)
25
(12.2)
181
(87.8)
1
(0.5)
205
(99.5)
4
(2.0)
202
(98.0)
Student 10
(5.6)
170
(94.4)
42
(23.4)
138
(76.6)
0
(0)
180
(100.0)
0
(0)
180
(100.0)
Unemployed 38
(7.6)
464
(92.4)
70
(14.0)
432
(86.0)
2
(0.4)
500
(99.6)
5
(1.0)
497
(99.0)
Living Status
Alone 31
(6.7)
436
(93.3)
0.349 70
(15.0)
397
(85.0)
0.419 2
(0.5)
465
(99.5)
0.444 4
(0.9)
463
(99.1)
0.767
With Family 166
(6.6)
2385
(93.4)
331
(13.0)
2220
(87.0)
4
(0.2)
2547
(99.8)
20
(0.2)
2531
(99.2)
With Non-Family 7
(11.2)
56
(88.8)
10
(15.9)
53
(84.1)
0
(0)
63
(100.0)
0
(0)
63
(100.0)
Monthly Income
≤RM 500 13
(4.7)
264
(95.3)
0.143 36
(13.0)
241
(87.0) 0.020 0
(0)
277
(100.0)
0.613 4
(1.5)
273
(98.5)
0.716
RM 501-1,000 10
(3.8)
254
(96.2)
44
(16.4)
220
(83.3)
0
(0)
264
(100.0)
2
(0.8)
262
(99.2)
RM 1,001 1,500 25
(5.3)
448
(94.7)
80
(17.0)
393
(83.0)
1
(0.3)
472
(99.7)
2
(0.5)
471
(99.5)
RM 1,501-2,000 15
(6.8)
207
(93.2)
31
(14.0)
191
(86.0)
0
(0)
222
(100.0)
1
(0.5)
221
(99.5)
RM 2,001-2,500 22
(5.8)
363
(94.2)
48
(12.5)
337
(87.5)
2
(0.6)
383
(99.4)
5
(1.3)
380
(98.7)
32
Demographic
Characteristics
Consumers’ Choice of Facilities to Obtain Medicines
Direct Sale Grocery Shop Night market Others
Chosen Not
chosen p-value* Chosen
Not
chosen p-value* Chosen
Not
chosen p-value* Chosen
Not
chosen p-value*
RM 2,501-3,000 13
(7.6)
159
(92.4)
18
(10.5)
154
(89.5)
0
(0)
172
(100.0)
2
(1.2)
170
(98.8)
RM 3,001-3,500 22
(7.1)
292
(92.9)
38
(12.2)
276
(87.8)
1
(0.4)
313
(99.6)
2
(0.7)
312
(99.3)
RM 3,501-4,000 8
(6.9)
108
(93.1)
21
(18.2)
95
(81.8)
0
(0)
116
(100.0)
0
(0)
116
(100.0)
RM 4,001-4,500 19
(8.2)
214
(91.8)
22
(9.5)
211
(90.5)
1
(0.5)
232
(99.5)
1
(0.5)
232
(99.5)
RM 4,501-5,000 13
(9.9)
119
(90.1)
8
(6.1)
124
(93.9)
1
(0.8) 131
(99.2)
0
(0)
132
(100.0)
> RM 5,000 44
(9.0)
448
(91.0)
65
(13.3)
427
(86.7)
0
(0)
492
(100.0)
5
(1.1)
487
(98.9)
*Significant at p < 0.05

33
4.5 Perceptions towards medicines labelling
As reported in table 8, majority (90.3%) of the respondents agreed that they are provided with
adequate information regarding medication labels. Moreover, 93.2% of the respondents agreed
that they read the information on the medicine labels before consuming the medicine.
Table 8: Consumers' perceptions towards medicines labelling
Statements Yes
(n, %)
No
(n, %)
Every time you are supplied with medicines, are you given adequate information on
your medicines label?
2783 (90.3) 298 (9.7)
Before taking your medicines, do you read the information on your medicines label? 2873 (93.2) 208 (6.8)
Table 9 summarizes the consumers’ perception towards medicines labelling. Consumers’
perceived labelling adequacy was significantly associated with the locality, age, gender,
ethnicity, education level, occupation and monthly income (P < 0.05). Meanwhile, the habit
of reading a label prior to using a medicine was found to be associated with consumers’ age,
gender, ethnicity, education level, occupation, living status and monthly income.

34
Table 9: Factors affecting medicine-label reading and consumers’ perceived labelling adequacy
Demographic
Characteristics
Outcome
Labelling adequacy Read Label
Yes
n (%)
No
n (%)
p-value* Yes
n (%)
No
n (%)
p-value*
Locality
Urban
Rural
2023 (89.0)
760 (93.8)
248 (11.0)
50 (6.2) <0.001 2115 (93.1)
758 (93.5)
156 (6.9)
52 (6.5)
0.662
Age
18-27
28-37
38-47
48-57
58-67
68-77
> 77
637 (86.8)
820 (89.8)
430 (91.1)
452 (93.1)
331 (92.7)
95 (94.0)
18 (94.7)
97 (13.2)
93 (10.2)
42 (8.9)
33 (6.9)
26 (7.3)
6 (6.0)
1 (5.3)
0.003 691 (94.1)
871 (95.3)
444 (94.0)
445 (91.7)
325 (91.0)
81 (80.2)
16 (84.2)
43 (5.9)
42 (4.7)
28 (6.0)
40 (8.3)
32 (9.0)
20 (19.8)
3 (15.8)
<0.001
Gender
Male
Female
1074 (88.8)
1709 (91.2)
135 (11.2)
163 (8.8) 0.024 1109 (91.7)
1764 (94.2)
100 (8.3)
108 (5.8) 0.007
Ethnicity
Malay
Chinese
Indian
Others
1798 (91.7)
468 (84.6)
168 (86.1)
349 (93.3)
161 (8.3)
85 (15.4)
27 (13.9)
25 (6.7)
<0.001 1849 (94.3)
488 (88.2)
182 (93.3)
354 (94.6)
110 (5.7)
65 (11.8)
13 (6.7)
20 (5.4)
<0.001
Education Level
Primary School
Secondary School
College/ University
No Formal Education
258 (92.1)
1236 (93.0)
1217 (87.2)
72 (93.5)
22 (7.9)
93 (7.0)
178 (12.8)
5 (6.5)
<0.001 241 (86.0)
1239 (93.2)
1329 (95.2)
64 (83.1)
39 (14.0)
90 (6.8)
66 (4.8)
13 (16.9)
<0.001
Occupation
Government
Private/Self Employed
Retired
Student
Unemployed
1018 (89.3)
944 (89.5)
198 (96.1)
152 (84.4)
471 (93.8)
121 (10.7)
110 (10.6)
8 (3.9)
28 (15.6)
31 (6.2)
<0.001 1103 (96.8)
970 (92.0)
187 (90.7)
167 (92.7)
446 (88.8)
36 (3.2)
84 (8.0)
19 (9.3)
13 (7.3)
56 (11.2)
<0.001
Living Status
Alone
With Family
With Non-Family
420 (89.9)
2305 (90.3)
58 (92.0)
47 (10.1)
246 (9.7)
5 (8.0)
0.860 448 (95.9)
2369 (92.8)
56 (88.8)
19 (4.1)
182 (7.2)
7 (11.2)
0.020
Monthly Income
≤RM 500
RM 501-1,000
RM 1,001-1,500
RM 1,501-2,000
RM 2,001-2,500
RM 2,501-3,000
RM 3,001-3,500
RM 3,501-4,000
RM 4,001-4,500
RM 4,501-5,000
> RM 5,000
255 (92.0)
240 (90.9)
441 (93.2)
209 (94.1)
339 (88.0)
156 (90.6)
287 (91.4)
103 (88.7)
210 (90.1)
115 (87.1)
427 (86.7)
22 (8.0)
24 (9.1)
32 (6.8)
13 (5.9)
46 (12.0)
16 (9.4)
27 (8.6)
13 (11.3)
23 (9.9)
17 (12.9)
65 (13.3)
0.021 246 (88.8)
241 (91.2)
446 (94.2)
211 (95.0)
361 (93.7)
170 (98.8)
289 (92.0)
104 (89.6)
218 (93.5)
125 (94.6)
461 (93.6)
31 (11.2)
23 (8.8)
27 (5.8)
11 (5.0)
24 (6.3)
2 (1.2)
25 (8.0)
12 (10.4)
15 (6.5)
7 (5.4)
31 (6.4)
0.006
*Significant at p < 0.05

35
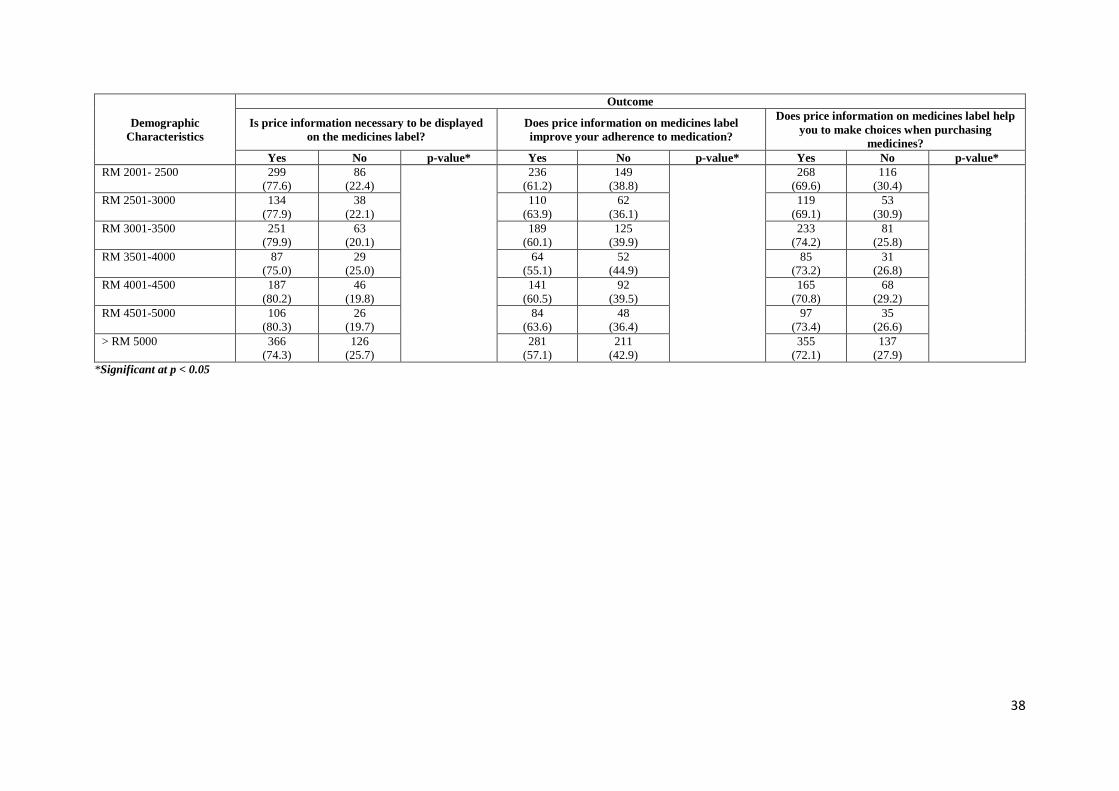
According to three quarter of the respondents (75.2%), price-related information necessary to
be displayed on the medicine label (Table 10). 68.5% of the respondents rated price as a key
variable in selection and purchasing of medicines. However, 1251 (40.6%) of the respondents
claimed that price of medicine has no impact on their medication taking behaviour.
Table 10: Consumers' perceptions towards medicine pricing
Statements Yes
(n, %)
No
(n, %)
Is price information necessary to be displayed on the medicines label? 2316 (75.2) 765 (24.8)
Does price information on medicines label improve your adherence to medication? 1830 (59.4) 1251 (40.6)
Does price information on medicines label help you to make choices when
purchasing medicines?* 2112 (68.5) 965 (31.3)
*Missing value=4
The associations between price-related issues and demographic variables are presented in Table
11. The importance of pricing information on medicine label was significantly associated with
age, gender, ethnicity, educational level, occupation, living status and monthly income.
Additionally, the correlation among medicine price and medication adherence was also
significant in terms of respondents’ locality, age, ethnicity, and occupation. In relation to price
and buying behaviour, all demographic variables reported a significant association as shown in
Table 11.

36
Table 11: Association between medicine pricing and demographic characteristics
Demographic
Characteristics
Outcome
Is price information necessary to be displayed
on the medicines label?
Does price information on medicines label
improve your adherence to medication?
Does price information on medicines label help
you to make choices when purchasing
medicines?
Yes No p-value* Yes No p-value* Yes No p-value*
Locality
Urban 1689
(74.3)
582
(25.7) 0.086
1289
(56.7)
982
(43.3) <0.001
1526
(67.1)
741
(32.9) 0.011
Rural 627
(77.4)
183
(22.6)
541
(66.7)
269
(33.3)
586
(72.3)
224
(27.7)
Age
18-27 555
(75.6)
179
(24.4)
<0.001
420
(57.2)
314
(42.8)
0.008
513
(69.9)
221
(30.2)
<0.001
28-37 734
(80.3)
179
(19.7)
556
(60.8)
357
(39.2)
676
(74.0)
236
(26.0)
38-47 354
(75.0)
118
(25.0)
299
(63.3)
173
(36.7)
319
(67.5)
153
(32.5)
48-57 348
(71.7)
137
(28.3)
284
(58.5)
201
(41.5)
318
(65.5)
166
(34.5)
58-67 253
(70.8)
104
(29.2)
215
(60.2)
142
(39.8)
235
(65.8)
121
(34.2)
68-77 62
(61.3)
39
(38.7)
51
(50.4)
50
(49.6)
45
(44.5)
56
(55.6)
> 77 10
(52.6)
9
(47.4)
5
(26.3)
14
(73.7)
7
(36.8)
12
(63.2)
Gender
Male 870
(71.9)
339
(28.1) 0.001
703
(58.1)
506
(41.9) 0.257
804
(66.5)
404
(33.5) 0.041
Female 1446
(77.2)
426
(22.8)
1127
(60.2)
745
(39.8)
1308
(69.8)
561
(30.2)
Ethnicity
Malay 1489
(76.0)
470
(24.0)
0.005
1208
(61.6)
751
(38.4)
<0.001
1347
(68.7)
608
(31.3)
0.033
Chinese 390
(70.5)
163
(29.5)
276
(49.9)
277
(50.1)
368
(66.5)
185
(33.5)
Indian 139
(71.2)
56
(28.8)
107
(54.8)
88
(45.2)
122
(62.5)
73
(37.5)
Others 298
(79.6)
76
(20.4)
239
(63.9)
135
(36.1)
275
(73.5)
99
(26.5)

37
Demographic
Characteristics
Outcome
Is price information necessary to be displayed
on the medicines label?
Does price information on medicines label
improve your adherence to medication?
Does price information on medicines label help
you to make choices when purchasing
medicines?
Yes No p-value* Yes No p-value* Yes No p-value*
Education Level
Primary School 183
(65.3)
97
(34.7)
<0.001
163
(58.2)
117
(41.8)
0.074
165
(58.9)
114
(41.1)
<0.001
Secondary School 993
(74.7)
336
(25.3)
803
(60.4)
526
(39.6)
867
(65.2)
459
(34.8)
College/ University 1094
(78.4)
301
(21.6)
829
(59.4)
566
(40.6)
1045
(74.9)
350
(25.1)
No Formal Education 46
(59.7)
31
(40.3)
35
(45.4)
42
(54.6)
35
(45.4)
42
(54.6)
Occupation
Government 945
(82.9)
194
(17.1)
<0.001
752
(66.0)
387
(34.0)
<0.001
847
(74.3)
292
(25.7)
<0.001
Private/Self Employed 757
(71.8)
297
(28.2)
581
(55.1)
473
(44.9)
699
(66.3)
354
(33.7)
Retired 134
(65.0)
72
(35.0)
118
(57.2)
88
(42.8)
127
(61.6)
78
(38.4)
Student 127
(70.5)
53
(29.5)
96
(53.3)
84
(46.7)
121
(67.2)
59
(32.8)
Unemployed 353
(70.3)
149
(29.7)
283
(56.3)
219
(43.7)
318
(63.3)
182
(36.7)
Living status
Alone 372
(79.6)
95
(20.4)
0.044
298
(63.8)
169
(36.2)
0.094
351
(75.1)
116
(24.9)
0.005 With Family 1899
(74.4)
652
(25.6)
1493
(58.5)
1058
(41.5)
1719
(67.3)
828
(32.7)
With Non-Family 18
(28.5)
45
(71.5)
39
(61.9)
24
(38.1)
42
(66.6)
21
(33.4)
Monthly income
0.002
0.480
0.006
≤RM 500 185
(66.7)
92
(33.3)
151
(54.5)
126
(45.5)
174
(62.8)
103
(37.2)
RM 501-1000 180
(68.1)
84
(31.9)
150
(56.8)
114
(43.2)
162
(61.3)
100
(38.7)
RM 1001- 1500 353
(74.6)
120
(25.4)
286
(60.4)
187
(39.6)
300
(63.4)
172
(36.6)
RM 1501- 2000 167
(75.2)
55
(24.8)
138
(62.1)
84
(37.9)
153
(68.9)
69
(31.1)
38
Demographic
Characteristics
Outcome
Is price information necessary to be displayed
on the medicines label?
Does price information on medicines label
improve your adherence to medication?
Does price information on medicines label help
you to make choices when purchasing
medicines?
Yes No p-value* Yes No p-value* Yes No p-value*
RM 2001- 2500 299
(77.6)
86
(22.4)
236
(61.2)
149
(38.8)
268
(69.6)
116
(30.4)
RM 2501-3000 134
(77.9)
38
(22.1)
110
(63.9)
62
(36.1)
119
(69.1)
53
(30.9)
RM 3001-3500 251
(79.9)
63
(20.1)
189
(60.1)
125
(39.9)
233
(74.2)
81
(25.8)
RM 3501-4000 87
(75.0)
29
(25.0)
64
(55.1)
52
(44.9)
85
(73.2)
31
(26.8)
RM 4001-4500 187
(80.2)
46
(19.8)
141
(60.5)
92
(39.5)
165
(70.8)
68
(29.2)
RM 4501-5000 106
(80.3)
26
(19.7)
84
(63.6)
48
(36.4)
97
(73.4)
35
(26.6)
> RM 5000 366
(74.3)
126
(25.7)
281
(57.1)
211
(42.9)
355
(72.1)
137
(27.9)
*Significant at p < 0.05

39
Table 12 presents the respondents’ perception towards difficulties in reading medicine labels.
Majority (n=2600, 84.4%) reported no problem in reading medicine labels supplied from public
hospitals or clinics. In terms of non-adequacy, medicine labels issued from private clinics were
rated as unsatisfactory, as 446 (14.5%) of the respondents had problems in understanding
medicine labels.
Respondents were found satisfied with the labelling information provided by public hospitals
and clinics (n=2664, 86.5%). Dissatisfaction with labelling information was reported from
private clinics whereby 16.6% of the respondents were not satisfied with the information received
from the private clinics.
Table 12: Consumers' perceptions towards difficulties in reading medicine labels
Statements Yes
(n, %)
No
(n, %)
Do you have trouble reading label for medicines supplied from:*
Government hospital/clinic
Private hospital
Private clinics
Community pharmacy
328 (10.6)
245 (8.0)
446 (14.5)
327 (10.6)
2600 (84.4)
1544 (50.1)
1908 (61.9)
1937 (62.9)
Are you satisfied with the information written on the labels given by:**
Government hospital/clinic
Private hospital
Private clinics
Community pharmacy
2664 (86.5)
1486 (48.2)
1813 (58.8)
1807 (58.6)
251 (8.1)
269 (8.7)
510 (16.6)
429 (13.9)
Missing values: *=153, 1292, 727, 817 and **166, 1326, 758, 845 respectively

40
Further exploration to identify factors that were associated with difficulties in reading medicines
label found that consumers’ locality, age, ethnicity, education level, occupation, living status and
monthly income level were among the factors that affect consumers’ perceived difficulty in
reading medicines label obtained from various health institutions (Table 13). Respondents who
had primary education, privately employed and with income RM 501-1000 generally perceived
more difficulty in reading medicines label obtained from government facilities. Nevertheless, we
found that age, education level and living status were not significantly associated with difficulties
in reading medicines label in public hospitals/clinics.
From Table 14, significant association between satisfaction with the information written in the
labels by various healthcare institutes and demographic variables were reported. The study found
that for public hospitals/clinics, respondents’ ethnicity and occupation were significantly
associated with labelling satisfaction. Nevertheless, factors associated with satisfaction with the
labelling from private hospitals, private clinics and community pharmacies were participants’
locality, age, ethnicity, education level, occupation, living status and monthly income.

41
Table 13: Association between difficulties in reading medicine labels with demographic characteristics
Demographic
Characteristics
Outcome
Difficulties in Reading Medicines
Label from Government Hospital/
Clinics
Difficulties in Reading Medicines
Label Private Hospitals
Difficulties in Reading Medicines
Label from Private Clinics
Difficulties in Reading Medicines Label
from Community Pharmacies
Yes No p-value* Yes No p-value* Yes No p-value* Yes No p-value*
Locality
Urban 240
(10.6)
1893
(83.4) 0.003
182
(8.0)
1201
(52.9) <0.
001
345
(15.2)
1502
(66.1) <0.001
260
(11.4)
1485
(65.4) <0.001
Rural 88
(10.9)
707
(87.3)
63
(7.8)
343
(42.3)
101
(12.5)
406
(50.1)
67
(8.3)
452
(55.8)
Age
18-27 83
(11.3)
604
(82.3)
0.255
72
(9.8)
424
(57.8)
<0.001
111
(15.1)
503
(68.5)
<0.001
81
(11.0)
508
(69.2)
<0.001
28-37 89
(9.7)
791
(86.6)
87
(9.5)
538
(58.9)
155
(17.0)
618
(67.7)
93
(10.2)
636
(69.7)
38-47 41
(8.7)
400
(84.7)
29
(6.1)
230
(48.7)
54
(11.4)
302
(64.0)
42
(8.9)
306
(64.8)
48-57 57
(11.8)
404
(83.3)
34
(7.0)
204
(42.1)
77
(15.9)
257
(53.0)
65
(13.4)
266
(54.8)
58-67 42
(11.8)
299
(83.8)
17
(4.8)
114
(31.9)
39
(10.9)
167
(46.8)
35
(9.8)
169
(47.3)
68-77 13
(12.9)
87
(86.1)
6
(5.9)
31
(30.7)
10
(9.9)
47
(46.5)
11
(10.9)
39
(38.6)
> 77 3
(15.8)
15
(78.9)
0
(0)
3
(15.8)
0
(0)
14
(73.7)
0
(0)
13
(68.4)
Gender
Male 129
(10.7)
1014
(83.9) 0.486
96
(7.9)
611
(50.5) 0.696
173
(14.3)
746
(61.7) 0.775
127
(10.5)
745
(61.6) 0.199
Female 199
(10.6)
1586
(84.7)
149
(8.0)
933
(49.8)
273
(14.6)
1162
(62.1)
200
(10.7)
1192
(63.7)
Ethnicity
Malay 187
(9.5)
1712
(87.4)
<0.001
165
(8.4)
1014
(51.8)
<0.001
297
(15.2)
1264
(64.5)
<0.001
217
(11.1)
1272
(64.9)
<0.001
Chinese 58
(10.5)
421
(76.1)
40
(7.2)
293
(53.0)
86
(15.6)
354
(64.0)
60
(10.8)
357
(64.6)
Indian 33
(16.9)
158
(81.0)
21
(10.8)
95
(48.7)
41
(21.0)
102
(52.3)
26
(13.3)
117
(60.0)
Others 50
(13.4)
309
(82.6)
19
(5.1)
142
(38.0)
22
(5.9)
188
(50.3)
24
(6.4)
191
(51.1)

42
Demographic
Characteristics
Outcome
Difficulties in Reading Medicines
Label from Government Hospital/
Clinics
Difficulties in Reading Medicines
Label Private Hospitals
Difficulties in Reading Medicines
Label from Private Clinics
Difficulties in Reading Medicines Label
from Community Pharmacies
Yes No p-value* Yes No p-value* Yes No p-value* Yes No p-value*
Education Level
Primary School 38
(13.6)
238
(85.0)
0.475
18
(6.4)
75
(26.8)
<0.001
32
(11.4)
109
(38.9)
<0.001
25
(8.9)
118
(42.1)
<0.001
Secondary School 158
(11.9)
1105
(83.1)
90
(6.8)
599
(45.1)
172
(12.9)
786
(59.1)
140
(10.5)
769
(57.9)
College/ University 123
(8.8)
1192
(85.4)
134
(9.6)
856
(61.4)
235
(16.8)
987
(70.8)
154
(11.0)
1026
(73.5)
No Formal
Education
9
(11.7)
65
(84.4)
3
(3.9)
14
(18.2)
7
(9.1)
26
(33.8)
8
(10.4)
24
(31.2)
Occupation
Government 95
(8.3)
1017
(89.3)
<0.001
114
(10.0)
656
(57.6)
<0.001
199
(17.5)
753
(66.1)
<0.001
122
(10.7)
817
(71.7)
<0.001
Private/Self
Employed
134
(12.7)
827
(78.5)
79
(7.5)
550
(52.2)
146
(13.9)
673
(63.9)
123
(11.7)
643
(61.0)
Retired 24
(11.7)
181
(87.9)
11
(5.3)
89
(43.2)
18
(8.7)
108
(52.4)
21
(10.2)
107
(51.9)
Student 20
(11.1)
145
(80.6)
15
(8.3)
99
(55.0)
25
(13.9)
126
(70.0)
16
(8.9)
125
(69.4)
Unemployed 55
(11.0)
430
(85.7)
26
(5.2)
150
(29.9)
58
(11.6)
248
(49.4)
45
(9.0)
245
(48.8)
Living Status
Alone 43
(9.2)
402
(86.1)
0.477
40
(8.6)
281
(60.2)
<0.001
69
(14.8)
326
(69.8)
<0.001
45
(9.6)
328
(70.2)
<0.001 With Family 275
(10.8)
2147
(84.2)
201
(7.9)
1231
(48.3)
369
(14.5)
1535
(60.2)
275
(10.8)
1560
(61.2)
With Non-Family 10
(15.9)
51
(81.0)
4
(6.3)
32
(50.8)
8
(12.7)
47
(74.6)
7
(11.1)
49
(77.8)
Monthly Income
≤RM 500 34
(12.3)
233
(84.1)
0.066
24
(8.7)
99
(35.7)
<0.001
36
(13.0)
131
(47.3)
<0.001
28
(10.1)
145
(52.3)
<0.001 RM 501-1000 42
(15.9)
214
(81.1)
15
(5.7)
76
(28.8)
18
(6.8)
114
(43.2)
24
(9.1)
120
(45.5)
RM 1001- 1500 57
(12.1)
399
(84.4)
32
(6.8)
233
(49.3)
67
(14.2)
281
(59.4)
44
(9.3)
281
(59.4)
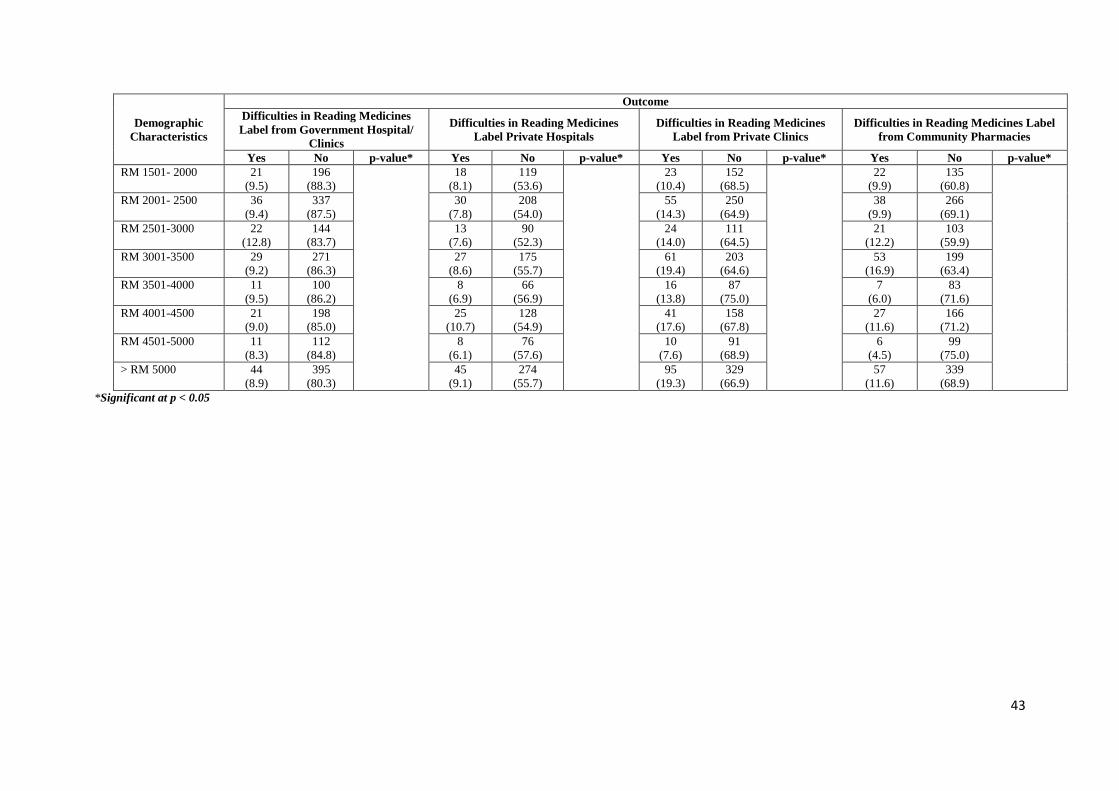
43
Demographic
Characteristics
Outcome
Difficulties in Reading Medicines
Label from Government Hospital/
Clinics
Difficulties in Reading Medicines
Label Private Hospitals
Difficulties in Reading Medicines
Label from Private Clinics
Difficulties in Reading Medicines Label
from Community Pharmacies
Yes No p-value* Yes No p-value* Yes No p-value* Yes No p-value*
RM 1501- 2000 21
(9.5)
196
(88.3)
18
(8.1)
119
(53.6)
23
(10.4)
152
(68.5)
22
(9.9)
135
(60.8)
RM 2001- 2500 36
(9.4)
337
(87.5)
30
(7.8)
208
(54.0)
55
(14.3)
250
(64.9)
38
(9.9)
266
(69.1)
RM 2501-3000 22
(12.8)
144
(83.7)
13
(7.6)
90
(52.3)
24
(14.0)
111
(64.5)
21
(12.2)
103
(59.9)
RM 3001-3500 29
(9.2)
271
(86.3)
27
(8.6)
175
(55.7)
61
(19.4)
203
(64.6)
53
(16.9)
199
(63.4)
RM 3501-4000 11
(9.5)
100
(86.2)
8
(6.9)
66
(56.9)
16
(13.8)
87
(75.0)
7
(6.0)
83
(71.6)
RM 4001-4500 21
(9.0)
198
(85.0)
25
(10.7)
128
(54.9)
41
(17.6)
158
(67.8)
27
(11.6)
166
(71.2)
RM 4501-5000 11
(8.3)
112
(84.8)
8
(6.1)
76
(57.6)
10
(7.6)
91
(68.9)
6
(4.5)
99
(75.0)
> RM 5000 44
(8.9)
395
(80.3)
45
(9.1)
274
(55.7)
95
(19.3)
329
(66.9)
57
(11.6)
339
(68.9)
*Significant at p < 0.05

44
Table 14: Association between labelling satisfaction with demographic characteristics
Demographic
Characteristics
Outcome
Are you satisfied with the
information written on the labels
given by Government hospital or
clinic?
Are you satisfied with the information
written on the labels given by Private
hospital?
Are you satisfied with the
information written on the labels
given by Private clinics?
Are you satisfied with the information
written on the labels given by
Community pharmacy?
Yes No p-value* Yes No p-value* Yes No p-value* Yes No p-value*
Locality
Urban 1921
(84.6)
202
(8.9) 0.372
1152
(50.7)
208
(9.2) <0.001
1430
(63.0)
399
(17.6) <0.001
1397
(61.5)
330
(14.5) <0.001
Rural 743
(91.7)
49
(6.0)
334
(41.2)
61
(7.5)
383
(47.3)
111
(13.7)
410
(50.6)
99
(12.2)
Age
18-27 604
(82.3)
79
(10.8)
0.130
403
(54.9)
82
(11.2)
<0.001
457
(62.3)
147
(20.0)
<0.001
453
(61.7)
130
(17.7)
<0.001
28-37 799
(87.5)
79
(8.7)
522
(57.2)
88
(9.6)
591
(64.7)
172
(18.8)
595
(65.2)
124
(13.6)
38-47 405
(85.8)
33
(7.0)
216
(45.8)
39
(8.3)
279
(59.1)
70
(14.8)
287
(60.8)
54
(11.4)
48-57 427
(88.0)
32
(6.6)
196
(40.4)
39
(8.0)
257
(53.0)
75
(15.5)
259
(53.4)
68
(14.0)
58-67 322
(90.2)
18
(5.0)
115
(32.2)
15
(4.2)
169
(47.3)
36
(10.1)
163
(45.7)
40
(11.2)
68-77 91
(90.1)
8
(7.9)
31
(30.7)
6
(5.9)
46
(45.5)
10
(9.9)
38
(37.6)
12
(11.9)
> 77 16
(84.2)
2
(10.5)
3
(15.8)
0
(0)
14
(73.7)
0
(0)
12
(63.2)
1
(5.3)
Gender
Male 1024
(84.7)
112
(9.3) 0.554
583
(48.2)
116
(9.6) 0.256
699
(57.8)
206
(17.0) 0.943
703
(58.1)
164
(13.6) 0.372
Female 1640
(87.6)
139
(7.4)
903
(48.2)
153
(8.2)
1114
(59.5)
304
(16.2)
1104
(59.0)
265
(14.2)
Ethnicity
Malay 1749
(89.3)
146
(7.5)
<0.001
985
(50.3)
173
(8.8)
<0.001
1214
(62.0)
324
(16.5)
<0.001
1188
(60.6)
279
(14.2)
<0.001
Chinese 419
(75.8)
56
(10.1)
282
(51.0)
46
(8.3)
322
(58.2)
112
(20.3)
329
(59.5)
85
(15.4)
Indian 168
(86.2)
20
(10.3)
84
(43.1)
29
(14.9)
92
(47.2)
50
(25.6)
108
(55.4)
35
(17.9)
Others 328
(87.7)
29
(7.8)
135
(36.1)
21
(5.6)
185
(49.5)
24
(6.4)
182
(48.7)
30
(8.0)

45
Demographic
Characteristics
Outcome
Are you satisfied with the
information written on the labels
given by Government hospital or
clinic?
Are you satisfied with the information
written on the labels given by Private
hospital?
Are you satisfied with the
information written on the labels
given by Private clinics?
Are you satisfied with the information
written on the labels given by
Community pharmacy?
Yes No p-value* Yes No p-value* Yes No p-value* Yes No p-value*
Education Level
Primary School 259
(92.5)
16
(5.7)
0.305
79
(28.2)
13
(4.6)
<0.001
113
(40.4)
24
(8.6)
<0.001
117
(41.8)
24
(8.6)
<0.001
Secondary School 1171
(88.1)
89
(6.7)
579
(43.6)
94
(7.1)
769
(57.9)
178
(13.4)
741
(55.8)
157
(11.8)
College/ University 1165
(83.5)
142
(10.2)
816
(58.5)
156
(11.2)
906
(64.9)
299
(21.4)
925
(66.3)
240
(17.2)
No Formal
Education
69
(89.6)
4
(5.2)
12
(15.6)
6
(7.8)
25
(32.5)
9
(11.7)
24
(31.2)
8
(10.4)
Occupation
Government 1011
(88.8)
97
(8.5)
0.001
611
(53.6)
134
(11.8)
<0.001
687
(60.3)
245
(21.5)
<0.001
725
(63.7)
192
(16.9)
<0.001
Private/Self
Employed
860
(81.6)
94
(8.9)
549
(52.1)
78
(7.4)
657
(62.3)
157
(14.9)
624
(59.2)
138
(13.1)
Retired 190
(92.2)
14
(6.8)
88
(42.7)
13
(6.3)
108
(52.4)
17
(8.3)
103
(50.0)
25
(12.1)
Student 143
(79.4)
22
(12.2)
94
(52.2)
16
(8.9)
110
(61.1)
37
(20.6)
112
(62.2)
27
(15.0)
Unemployed 460
(91.6)
24
(4.8)
144
(28.7)
28
(5.6)
251
(50.0)
54
(10.8)
243
(48.4)
47
(9.4)
Living Status
Alone 396
(84.8)
47
(10.1)
0.375
279
(59.7)
36
(7.7)
<0.001
319
(68.3)
72
(15.4)
0.010
300
(64.2)
66
(14.1)
0.002 With Family 2211
(86.7)
200
(7.8)
1178
(46.2)
228
(8.9)
1451
(56.9)
428
(16.8)
1461
(57.3)
353
(13.8)
With Non-Family 57
(90.5)
4
(6.3)
29
(46.0)
5
(7.9)
43
(68.3)
10
(15.9)
46
(73.0)
10
(15.9)
Monthly Income
≤RM 500 245
(88.4)
21
(7.6)
0.201
103
(37.2)
18
(6.5)
<0.001
134
(48.4)
30
(10.8)
<0.001
140
(50.5)
32
(11.6)
<0.001 RM 501-1000 237
(89.8)
20
(7.68)
74
(28.0)
17
(6.4)
108
(40.9)
25
(9.5)
114
(43.2)
26
(9.8)
RM 1001- 1500 422
(89.2)
31
(6.6)
231
(48.8)
28
(5.9)
285
(60.3)
58
(12.3)
267
(56.4)
51
(10.8)

46
Demographic
Characteristics
Outcome
Are you satisfied with the
information written on the labels
given by Government hospital or
clinic?
Are you satisfied with the information
written on the labels given by Private
hospital?
Are you satisfied with the
information written on the labels
given by Private clinics?
Are you satisfied with the information
written on the labels given by
Community pharmacy?
Yes No p-value* Yes No p-value* Yes No p-value* Yes No p-value*
RM 1501- 2000 207
(93.2)
10
(4.5)
115
(51.8)
15
(6.8)
142
(64.0)
26
(11.7)
128
(57.7)
26
(15.1)
RM 2001- 2500 338
(87.8)
32
(8.3)
198
(51.4)
36
(9.4)
225
(58.4)
74
(19.2)
240
(62.3)
61
(15.8)
RM 2501-3000 146
(84.9)
19
(11.0)
82
(47.7)
17
(9.9)
105
(61.0)
27
(15.7)
95
(55.2)
26
(15.1)
RM 3001-3500 278
(88.5)
22
(7.0)
171
(54.5)
30
(9.6)
196
(62.4)
68
(21.7)
189
(60.2)
63
(20.1)
RM 3501-4000 98
(84.5)
11
(9.5)
55
(47.4)
14
(12.1)
69
(59.5)
28
(24.1)
73
(62.9)
16
(13.8)
RM 4001-4500 186
(79.8)
30
(12.9)
121
(51.9)
30
(12.9)
145
(62.2)
53
(22.7)
148
(63.5)
40
(17.2)
RM 4501-5000 111
(84.1)
11
(8.3)
71
(53.8)
10
(7.6)
86
(65.2)
14
(10.6)
87
(65.9)
17
(12.9)
> RM 5000 395
(80.3)
44
(8.9)
265
(53.9)
54
(11.0)
317
(64.4)
107
(21.7)
325
(66.1)
71
(12.9)
*Significant at p < 0.05

47
4.6 Awareness towards appropriate use of medicines
Only half of the respondents (n=1639, n=53.2%) claimed that they were able to identify
medicines by the trade or generic name. This ability was found to be associated with consumers’
locality, age, gender, education level, occupation, living status and monthly income. Consumers
from urban area (55.4%), falling in the age group of 18-27 years (60.2%), who have received
tertiary education (67.0%), were government employee (70.1%), living alone (59.3%) and of
higher income group were more able to identify medicines by the trade or generic name (Table
15).

48
Table 15: Association between ability to identify medicines by trade/generic name with demographic
characteristics
Demographic Characteristics Ability to identify medicines by trade/ generic name
Yes No p-value*
Total (N) 1639 (53.2) 1442 (46.8) -
Locality
Urban 1257 (55.4) 1014 (44.6) <0.001
Rural 382 (47.2) 428 (52.8)
Age
18-27 442 (60.2) 292 (39.8) <0.001
28-37 554 (60.1) 359 (39.9)
38-47 266 (56.4) 206 (43.6)
48-57 215 (44.3) 270 (55.7)
58-67 139 (38.9) 218 (61.1)
68-77 19 (18.8) 82 (81.2)
> 77 4 (21.0) 15 (79.0)
Gender
Male 566 (46.8) 643 (53.2) <0.001
Female 1073 (57.3) 799 (42.7)
Ethnicity
Malay 1065 (54.3) 894 (45.7) 0.216
Chinese 293 (53.0) 260 (47.0)
Indian 95 (48.8) 100 (51.2)
Others 186 (49.7) 188 (50.3)
Education Level
Primary School 63 (22.5) 217 (77.5) <0.001
Secondary School 630 (47.4) 699 (52.6)
College/ University 936 (67.0) 459 (33.0)
No Formal Education 10 (13.0) 67 (87.0)
Occupation
Government 799 (70.1) 340 (29.9) <0.001
Private/Self Employed 477 (45.2) 577 (54.8)
Retired 87 (42.2) 119 (57.8)
Student 103 (57.2) 77 (42.8)
Unemployed 173 (34.4) 329 (65.5)
Living Status
Alone 277 (59.3) 190 (40.7) 0.014
With Family 1331 (52.2) 1220 (47.8)
With Non-Family 31 (49.2) 32 (50.8)
Monthly Income
≤RM 500 88 (31.7) 189 (68.3) <0.001
RM 501-1,000 77 (29.2) 187 (70.8)
RM 1,001-RM 1,500 219 (46.6) 254 (53.7)
RM 1,501-RM 2,000 107 (48.2) 115 (51.8)
RM 2,001- RM 2,500 210 (54.5) 175 (45.5)
RM 2,501- RM 3,000 96 (55.8) 76 (44.2)
RM 3,001-RM 3500 197 (62.7) 117 (37.3)
RM 3,501-RM 4,000 67 (57.7) 49 (42.3)
RM 4,001-RM 4,500 157 (67.3) 76 (32.7)
RM 4,501-RM 5,000 92 (69.6) 40 (30.4)
> RM 5,000 329 (66.8) 163 (33.2)
Significant at p < 0.05

49
It was found that up to 81.4% of the respondents claimed that they really understood the proper
use of medicine. The consumers’ understanding was significantly associated with their ethnicity,
education level and living status. The study also found that 83.0% of the respondents had good
knowledge on proper medicine storage. This was significantly associated with respondents’
gender, education level, occupation and the consumer’s monthly household income as shown
in Table 16.

50
Table 16: Association between the knowledge on proper use and storage of medicine with demographic characteristics
Demographic Characteristics Understand the Proper Use of Medicine Knowledge on proper medicine storage
Don't
Understand
n (%)
Partially
Understand
n (%)
Understand
n (%)
p-value* No
n (%)
Yes
n (%)
p-value*
Total=N 169 (5.5) 403 (13.1) 2509 (81.4) 524 (17.0) 2557 (83.0)
Locality
Urban 107 (4.7) 279 (12.3) 1885 (83.0) 0.851 389 (17.3) 1882 (82.9) 0.764
Rural 62 (7.7) 124 (15.3) 624 ( 77.0) 135 (16.7) 675 (83.3)
Age
18-27 47 (6.4) 117 (15.9) 570 (77.7) 0.184 124 (16.9) 610 (83.1) 0.144
28-37 56 (6.1) 112 (12.3) 745 (81.6) 133 (14.6) 780 (85.4)
38-47 12 (2.5) 50 (10.6) 410 (86.9) 89 (18.9) 383 (81.1)
48-57 33 (6.8) 57 (11.8) 395 (81.4) 86 (17.7) 399 (82.3)
58-67 11 (3.1) 43 (12.0) 303 (84.9) 66 (18.5) 291 (81.5)
68-77 10 (9.9) 19 (18.8) 72 (71.3) 24 (23.8) 77 (76.2)
> 77 0 (0) 5 (26.3) 14 (73.7) 2 (10.5) 17 (86.5)
Gender
Male 77 (6.4) 172 (14.2) 960 (76.4) 0.719 256 (21.2) 953 (78.8) <0.001
Female 92 (4.9) 231 (12.3) 1549 (82.7) 268 (14.3) 1604 (85.7)
Ethnicity
Malay 126 (6.4) 264 (13.5) 1569 (80.1) 0.017
327 (16.7) 1632 (83.3) 0.606
Chinese 24 (4.3) 92 (16.6) 437 (79.0) 100 (18.1) 453 (81.9)
Indian 9 (4.6) 21 (10.8) 165 (84.6) 38 (19.5) 157 (80.5)
Others 10 (2.7) 26 (7.0) 338 (90.4) 59 (15.8) 315 (84.2)
Education Level
Primary School 19 (6.8) 52 (18.6) 209 (74.6) 0.037 59 (21.1) 221 (78.9) <0.001
Secondary School 70 (5.3) 165 (12.4) 1094 (82.3) 249 (18.7) 1080 (81.3)
College/University 69 (4.9) 178 (12.8) 1148 (82.3) 193 (13.8) 1202 (86.2)
No formal education 11 (14.3) 8 (10.4) 58 (75.3) 23 (29.9) 54 (70.1)
Occupation
Government 49 (4.3) 115 (10.1) 975 (85.6) 0.082 151 (13.3) 988 (86.7) <0.001
Private/ Self Employed 59 (5.6) 163 (15.5) 832 (78.9) 221 (21.0) 833 (79.0)
Retired 13 (6.3) 30 (14.6) 163 (79.1) 35 (17.0) 171 (83.0)
Student 11 (6.1) 31 (17.2) 138 (76.7) 29 (16.1) 151 (83.9)
Unemployed 37 (7.4) 64 (12.7) 401 (79.9) 88 (17.5) 414 (82.5)

51
Demographic Characteristics Understand the Proper Use of Medicine Knowledge on proper medicine storage
Don't
Understand
n (%)
Partially
Understand
n (%)
Understand
n (%)
p-value* No
n (%)
Yes
n (%)
p-value*
Living Status
Alone 26 (5.6) 76 (16.3) 365 (78.2) 0.030 78 (16.7) 389 (83.3) 0.534
With Family 142 (5.6) 315 (12.3) 2094 (82.1) 432 (16.9) 2119 (83.1)
With Non-family 1 (1.6) 12 (19.0) 50 (79.4) 14 (22.2) 49 (77.8)
Monthly Household Income
< RM500 20 (7.2) 40 (14.4) 217 (78.3) 0.829 54 (19.5) 223 (80.5) 0.001
RM501-RM1,000 19 (7.2) 35 (13.3) 210 (79.5) 56 (21.2) 208 (78.8)
RM1,001-RM1,500 30 (6.3) 66 (14.0) 377 (79.7) 98 (20.7) 375 (79.3)
RM1,501-RM2,000 14 (6.3) 31 (14.0) 177 (79.7) 48 (21.6) 174 (78.4)
RM2,001-RM2,500 14 (3.6) 43 (11.2) 328 (85.2) 60 (15.6) 325 (84.4)
RM2,501-RM3,000 7 (4.1) 25 (14.5) 140 (81.4) 33 (19.2) 139 (80.8)
RM3,001-RM3,500 25 (8.0) 40 (12.7) 249 (79.3) 39 (12.4) 275 (87.6)
RM3,501-RM4,000 6 (5.2) 17 (14.7) 93 (80.2) 18 (15.5) 98 (84.5)
RM4,001-RM4,500 10 (4.3) 21 (9.0) 202 (86.7) 44 (18.9) 189 (81.1)
RM4,501-RM5,000 4 (3.0) 20 (15.2) 108 (81.8) 15 (11.4) 117 (88.6)
> RM5,000 20 (4.1) 65 (13.2) 407 (82.7) 59 (12.0) 433 (88.0)
*Significant at p < 0.05

52
70.3% (n=2167) of the respondent were generally aware of the side effects of medicines.
Respondents of age group 28-37 (74.8%), tertiary level of education (75.6%) and >RM 5000
income level (76.2%) were found to have better awareness of medicines side effect (Table 16).
Meanwhile, up to 90.8% (n= 2797) of respondents were aware of medicine’s expiry date. This
was found to be associated with the consumers’ age, level of education, occupation and income
level (Table 17).

53
Table 17: Association between the awareness on the side effects and shelf life of medicines with demographic characteristics
Demographic Characteristics
Aware of medicine's side effect Aware of medicine's expiry date
Yes
n (%)
No
n (%) p-value*
Yes
n (%)
No
n (%) p-value*
Total (N) 2167 (70.3) 914 (29.7) - 2797 (90.8) 284 (9.2) -
Locality Urban 1590 (70.0) 681 (30.0) 0.514
2068 (91.1) 203 (8.9) 0.370
Rural 577 (71.2) 233 (28.8) 729 (90.0) 81 (10.0)
Age 18-27 524 (71.4) 210 (28.6)
<0.001
666 (90.7) 68 (9.3)
<0.001
28-37 683 (74.8) 230 (25.2) 857 (93.9) 56 (6.1)
38-47 346 (73.3) 126 (26.7) 440 (93.2) 32 (6.8)
48-57 324 (66.8) 161 (33.2) 435 (89.7) 50 (10.3)
58-67 232 (65.0) 125 (35.0) 312 (87.4) 45 (12.6)
68-77 50 (49.5) 51 (50.5) 72 (71.3) 29 (28.7)
> 77 8 (42.1) 11 (57.9) 15 (78.9) 4 (21.1)
Gender Male 803 (66.4) 406 (33.6) <0.001
1089 (90.1) 120 (9.9) 0.275
Female 1364 (72.9) 508 (27.1) 1708 (91.2) 164 (8.8)
Ethnicity Malay 1434 (73.2) 525 (26.8)
<0.001
1781 (90.9) 178 (9.1)
0.954 Chinese 345 (62.4) 208 (37.6) 503 (91.0) 50 (9.0)
Indian 125 (64.1) 70 (35.9) 176 (90.3) 19 (9.7)
Others 263 (70.3) 111 (29.7) 337 (90.1) 37 (9.9)
Education Level Primary School 148 (52.9) 132 (47.1)
<0.001
229 (81.8) 51 (18.2)
<0.001 Secondary School 934 (70.3) 395 (29.7) 1211 (91.1) 118 (8.9)
College/ University 1055 (75.6) 340 (24.4) 1310 (93.9) 85 (6.1)
No formal education 30 (39.0) 47 (61.0) 47 (61.0) 30 (39.0)
Occupation Government 910 (79.9) 229 (20.1)
<0.001
1081 (94.9) 58 (5.1)
<0.001
Private/ Self Employed 700 (66.4) 354 (33.6) 941 (89.3) 113 (10.7)
Retired 131 (63.6) 75 (36.4) 180 (87.4) 26 (12.6)
Student 116 (64.4) 64 (35.6) 168 (93.3) 12 (6.7)
Unemployed 310 (61.8) 192 (38.2) 427 (85.1) 75 (14.9)
Living Status Alone 344 (73.7) 123 (26.3)
0.197
429 (91.9) 38 (8.1)
0.681
With Family 1777 (69.7) 774 (30.3) 2311 (90.6) 240 (9.4)
With Non-family 46 (73.0) 17 (27.0) 57 (90.5) 6 (9.5)
Monthly Household
Income
<RM 500 161 (58.1) 116 (41.9)
<0.001
236 (85.2) 41 (14.8)
<0.001
RM 501-1,000 159 (60.2) 105 (39.8) 217 (82.2) 47 (17.8)
RM 1,001-1,500 327 (69.1) 146 (30.9) 419 (88.6) 54 (11.4)
RM 1,501-2,000 153 (68.9) 69 (31.1) 199 (89.6) 23 (10.4)
RM 2,001-2,500 287 (74.5) 98 (25.5) 364 (94.5) 21 (5.5)
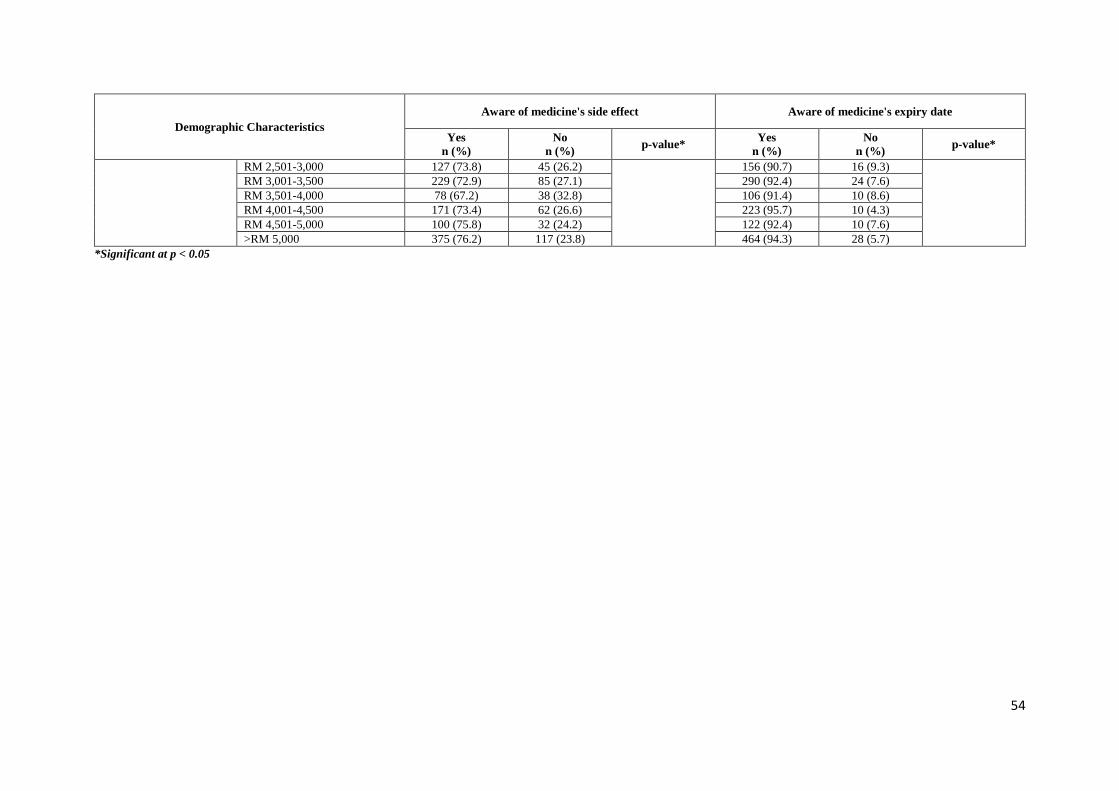
54
Demographic Characteristics
Aware of medicine's side effect Aware of medicine's expiry date
Yes
n (%)
No
n (%) p-value*
Yes
n (%)
No
n (%) p-value*
RM 2,501-3,000 127 (73.8) 45 (26.2)
156 (90.7) 16 (9.3)
RM 3,001-3,500 229 (72.9) 85 (27.1) 290 (92.4) 24 (7.6)
RM 3,501-4,000 78 (67.2) 38 (32.8) 106 (91.4) 10 (8.6)
RM 4,001-4,500 171 (73.4) 62 (26.6) 223 (95.7) 10 (4.3)
RM 4,501-5,000 100 (75.8) 32 (24.2) 122 (92.4) 10 (7.6)
>RM 5,000 375 (76.2) 117 (23.8) 464 (94.3) 28 (5.7)
*Significant at p < 0.05

55
71.8% of the respondents were aware of the potential interaction between foods with medicines.
Females (75.1%), respondents of the age group 18-27 (74.0%), having tertiary educational level
(73.7%), publically employed (76.4%) and having income levels of RM2,001-RM2,500 (77.9%)
were significantly associated with the knowledge on interaction between foods and medicine
(Table 17). Besides that, 68.4% of the respondents were aware of interaction between modern
and traditional medicines. This awareness was significantly associated with respondents’ age,
gender, ethnicity, occupation and living status (p<0.05) as reported in Table 18.

56
Table 18: Factors affecting the awareness on food-medicines and modern-traditional medicines interaction
Demographic Characteristics
Awareness of Interactions between modern medicines and food Awareness of Interactions between modern and traditional medicines
Yes n (%) No n (%) p-value* Yes n (%) No n (%) p-value*
Total (N) 2213 (71.8) 868 (28.2) - 2107 (68.4) 974 (31.6) -
Locality
Urban 1638 (72.1) 633 (27.9) 0.536 1546 (68.1) 725 (31.9) 0.534
Rural 575 (71.0) 235 (29.0) 561 (69.3) 249 (30.7)
Age
18-27 543 (74.0) 191 (26.0) <0.001 469 (63.9) 265 (36.1) 0.002
28-37 675 (73.9) 238 (26.1) 617 (67.6) 296 (32.4)
38-47 349 (73.9) 123 (26.1) 335 (71.0) 137 (29.0)
48-57 327 (67.4) 158 (32.6) 345 (71.1) 140 (28.9)
58-67 251 (70.3) 106 (29.7) 268 (75.1) 89 (24.9)
68-77 55 (54.5) 46 (45.5) 62 (61.4) 39 (38.6)
> 77 13 (68.4) 6 (31.6) 11 (57.9) 8 (42.1)
Gender
Male 807 (66.7) 402 (33.3) <0.001 772 (63.9) 437 (36.1) <0.001
Female 1406 (75.1) 466 (24.9) 1335 (71.3) 537 (28.7)
Ethnicity
Malay 1411 (72.0) 548 (28.0) 0.172 1276 (65.1) 683 (34.9) <0.001
Chinese 387 (70.0) 166 (30.0) 432 (78.1) 121 (21.9)
Indian 152 (77.9) 43 (22.1) 139 (71.3) 56 (28.7)
Others 263 (70.3) 111 (29.7) 260 (69.5) 114 (30.5)
Education Level
Primary School 190 (67.9) 90 (32.1) 0.003 199 (71.1) 81 (28.9) 0.659
Secondary School 952 (71.6) 377 (28.4) 912 (68.6) 417 (31.4)
College/ University 1028 (73.7) 367 (26.3) 946 (67.8) 449 (32.2)
No Formal Education 43 (55.8) 34 (44.2) 50 (64.9) 27 (35.1)
Occupation
Government 870 (76.4) 269 (23.6) 0.001 798 (70.1) 341 (29.9) 0.009
Private/Self Employed 720 (68.3) 334 (31.7) 695 (65.9) 359 (34.1)
Retired 145 (70.4) 61 (29.6) 159 (77.2) 47 (22.8)
Student 129 (71.7) 51 (28.3) 115 (63.9) 65 (36.1)
Unemployed 349 (69.5) 153 (30.5) 340 (67.7) 162 (32.3)

57
Demographic Characteristics
Awareness of Interactions between modern medicines and food Awareness of Interactions between modern and traditional medicines
Yes n (%) No n (%) p-value* Yes n (%) No n (%) p-value*
Living Status
Alone 344 (73.4) 123 (26.3) 0.328 306 (65.5) 161 (34.5) 0.045
With Family 1828 (71.7) 723 (26.3) 1765 (69.2) 786 (30.8)
With Non-Family 41 (65.1) 22 (34.9) 36 (57.1) 27 (42.9)
Monthly Income
≤RM 500 194 (70.0) 83 (30.0) 0.004 195 (70.4) 82 (29.6) 0.802
RM 501-RM1,000 170 (64.4) 94 (35.6) 184 (69.7) 80 (30.3)
RM1,001-RM1,500 349 (73.8) 124 (26.2) 315 (66.6) 158 (33.4)
RM1,501-RM2,000 152 (68.5) 70 (31.5) 146 (65.8) 76 (34.2)
RM2,001-RM2,500 300 (77.9) 85 (22.1) 263 (68.3) 122 (31.7)
RM2,501-RM3,000 131 (76.2) 41 (23.8) 113 (65.7) 59 (34.3)
RM3,001-RM3,500 220 (70.1) 94 (35.3) 220 (70.1) 94 (29.9)
RM3,501-RM4,000 75 (64.7) 41 (35.3) 74 (63.8) 42 (36.2)
RM4,001-RM4,500 164 (70.4) 69 (29.6) 166 (71.2) 67 (28.8)
RM4,501-RM5,000 95 (72.0) 37 (28.0) 90 (68.2) 42 (31.8)
> RM 5,000 362 (73.6) 130 (26.4) 340 (69.1) 152 (30.9)
*Significant at p < 0.05

58
A salient feature of the survey reported that 67.7% (n=2086) of the respondents had no
information about medicine disposal (Table 19). The response was significantly associated with
consumers’ locality, gender, ethnicity, education level, occupation and living status. Male
respondents (70.8%), rural residencies (71.9%), no formal education (81.9%) and privately
employed (74.5%) had poor knowledge towards medicine disposal.

59
Table 19: Factors Affecting medication disposal
Demographic Characteristics
Outcome
Knowledge of Medication Disposal
Yes, n (%) No, n (%) p-value*
Total (N) 995 (32.3) 2086 (67.7) -
Locality
Urban 767 (33.7) 1504 (66.3) 0.003
Rural 228 (28.1) 582 (71.9)
Age
18-27 253 (34.4) 481 (65.6) 0.064
28-37 307 (33.6) 606 (66.4)
38-47 144 (30.5) 328 (69.5)
48-57 143 (29.4) 342 (70.6)
58-67 121 (33.8) 236 (66.2)
68-77 25 (24.7) 76 (75.3)
> 77 2 (10.5) 17 (89.5)
Gender
Male 354 (29.2) 855 (70.8) 0.004
Female 641 (34.2) 1231 (65.8)
Ethnicity
Malay 675 (34.4) 1284 (65.6) 0.001
Chinese 168 (30.3) 385 (69.7)
Indian 63 (32.3) 132 (67.7)
Others 89 (23.7) 285 (76.3)
Education Level
Primary School 75 (26.7) 205 (73.3) <0.001
Secondary School 404 (30.3) 925 (69.7)
College/ University 502 (36.0) 893 (54.0)
No Formal Education 14 (18.1) 63 (81.9)
Occupation
Government 467 (41.0) 672 (59.0) <0.001
Private/Self Employed 269 (25.5) 785 (74.5)
Retired 70 (34.0) 136 (66.0)
Student 60 (33.3) 120 (66.7)
Unemployed 129 (25.6) 373 (74.4)
Living Status
Alone 171 (36.6) 296 (63.4) 0.027
With Family 810 (31.7) 1741 (68.3)
With Non-Family 14 (22.2) 49 (77.8)
Monthly Income
≤RM 500 76 (27.4) 201 (72.6) 0.059
RM 501-1,000 74 (28.0) 190 (72.0)
RM 1,001-RM 1,500 147 (31.0) 326 (69.0)
RM 1,501-RM 2,000 60 (27.0) 162 (73.0)
RM 2,001- RM 2,500 145 (37.6) 240 (62.4)
RM 2,501-RM 3,000 62 (36.0) 110 (64.0)
RM 3,001-RM 3,500 101 (32.1) 213 (67.9)
RM 3,501-RM 4,000 37 (31.8) 79 (68.2)
RM 4,001-RM 4,500 85 (36.4) 148 (63.6)
RM 4,501-RM 5,000 39 (29.5) 93 (70.5)
> RM 5,000 169 (34.3) 323 (55.7)
*Significant at p < 0.05

60
Up to 86.2% of the participants were aware of the requirement for registration with the Ministry
of Health Malaysia for all modern and traditional medicines prior to marketing. Consumers
who were females (88.0%), from the age group of 28 to 37 years (91.8%), belonging to the
Malay ethnic group (89.1%), with tertiary education (91.1%), government employee
(94.7%)and with RM4501-5000 (93.9%) income were more aware of this medicines’
registration requirement (Table 20). Age, gender, ethnicity, education, occupation and monthly
income was reported to have a significant association (p < 0.05) against the knowledge towards
registration of medicines with Ministry of Health, Malaysia.

61
Table 20: Response to “Did you know that all modern and traditional medicines should be registered with
Ministry of Health?” based on demographic characteristics
Demographic Characteristics
Outcome
“Did you know that all modern and traditional medicines should be registered
with Ministry of Health?”
Yes, n(%) No, n(%) p-value*
Total (N) 2657 (86.2) 424 (13.8) -
Locality
Urban 1960 (86.3) 311 (13.7) 0.856
Rural 697 (86.0) 113 (14.0)
Age
18-27 649 (88.4) 85 (11.6) <0.001
28-37 839 (91.8) 74 (8.2)
38-47 414 (87.7) 58 (12.3)
48-57 411 (84.7) 74 (15.3)
58-67 273 (76.4) 84 (23.6)
68-77 59 (58.4) 42 (41.6)
> 77 12 (63.3) 7 (36.8)
Gender
Male 1008 (83.3) 201 (16.7) <0.001
Female 1649 (88.0) 223 (12.0)
Ethnicity
Malay 1747 (89.1) 212 (10.8) <0.001
Chinese 441 (79.7) 112 (20.3)
Indian 162 (83.0) 33 (17.0)
Others 307 (82.0) 67 (18.0)
Education Level
Primary School 192 (68.5) 88 (31.5) <0.001
Secondary School 1158 (87.1) 171 (12.3)
College/ University 1272 (91.1) 123 (8.9)
No Formal Education 35 (45.4) 42 (54.6)
Occupation
Government 1079 (94.7) 60 (5.3) <0.001
Private/Self Employed 892 (84.6) 162 (15.4)
Retired 149 (72.3) 57 (27.7)
Student 151 (83.8) 29 (16.2)
Unemployed 386 (76.9) 116 (23.1)
Living Status
Alone 414 (88.6) 53 (11.4) 0.089
With Family 2185 (85.6) 366 (14.4)
With Non-Family 58 (92.0) 5 (8.0)
Monthly Income
≤RM 500 204 (73.6) 73 (26.4) <0.001
RM 501-1,000 199 (75.3) 65 (24.7)
RM 1,001-RM 1,500 404 (85.4) 69 (14.6)
RM 1,501-RM 2,000 195 (87.8) 27 (12.2)
RM 2,001- RM 2,500 350 (90.9) 35 (9.1)
RM 2,501-RM 3,000 149 (86.6) 23 (13.4)
RM 3,001-RM 3,500 267 (85.0) 47 (15.0)
RM 3,501-RM 4,000 105 (90.5) 11 (9.5)
RM 4,001-RM 4,500 212 (90.9) 21 (9.1)
RM 4,501-RM 5,000 124 (93.9) 8 (6.1)
> RM 5,000 447 (90.8) 45 (9.2)
*Significant at p < 0.05
62
Only 46.4% of the participants were aware of Meditag® availability. This knowledge was
found to be influenced by the participants’ age (p<0.05) and education level (p<0.05).
Participants of age between 28 to 37 years (64.1%) and having tertiary education (62.2%) were
more aware of the Meditag® availability as shown in Table 21.
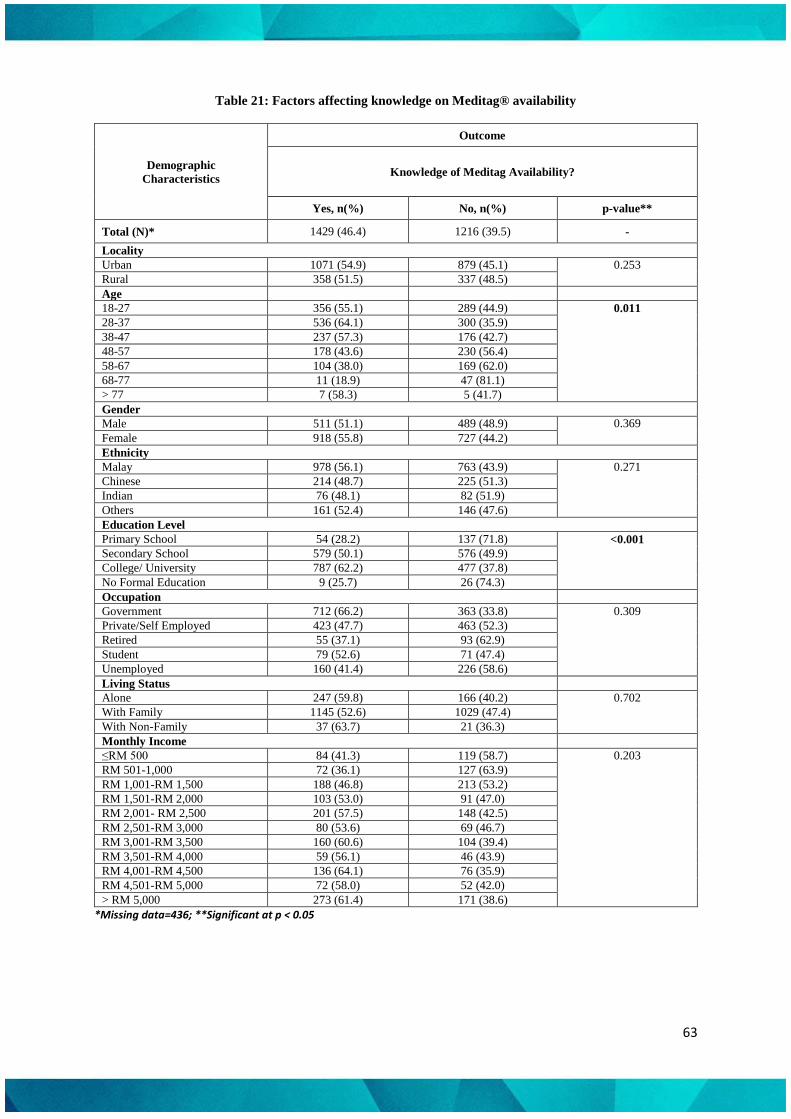
63
Table 21: Factors affecting knowledge on Meditag® availability
Demographic
Characteristics
Outcome
Knowledge of Meditag Availability?
Yes, n(%) No, n(%) p-value**
Total (N)* 1429 (46.4) 1216 (39.5) -
Locality
Urban 1071 (54.9) 879 (45.1) 0.253
Rural 358 (51.5) 337 (48.5)
Age
18-27 356 (55.1) 289 (44.9) 0.011
28-37 536 (64.1) 300 (35.9)
38-47 237 (57.3) 176 (42.7)
48-57 178 (43.6) 230 (56.4)
58-67 104 (38.0) 169 (62.0)
68-77 11 (18.9) 47 (81.1)
> 77 7 (58.3) 5 (41.7)
Gender
Male 511 (51.1) 489 (48.9) 0.369
Female 918 (55.8) 727 (44.2)
Ethnicity
Malay 978 (56.1) 763 (43.9) 0.271
Chinese 214 (48.7) 225 (51.3)
Indian 76 (48.1) 82 (51.9)
Others 161 (52.4) 146 (47.6)
Education Level
Primary School 54 (28.2) 137 (71.8) <0.001
Secondary School 579 (50.1) 576 (49.9)
College/ University 787 (62.2) 477 (37.8)
No Formal Education 9 (25.7) 26 (74.3)
Occupation
Government 712 (66.2) 363 (33.8) 0.309
Private/Self Employed 423 (47.7) 463 (52.3)
Retired 55 (37.1) 93 (62.9)
Student 79 (52.6) 71 (47.4)
Unemployed 160 (41.4) 226 (58.6)
Living Status
Alone 247 (59.8) 166 (40.2) 0.702
With Family 1145 (52.6) 1029 (47.4)
With Non-Family 37 (63.7) 21 (36.3)
Monthly Income
≤RM 500 84 (41.3) 119 (58.7) 0.203
RM 501-1,000 72 (36.1) 127 (63.9)
RM 1,001-RM 1,500 188 (46.8) 213 (53.2)
RM 1,501-RM 2,000 103 (53.0) 91 (47.0)
RM 2,001- RM 2,500 201 (57.5) 148 (42.5)
RM 2,501-RM 3,000 80 (53.6) 69 (46.7)
RM 3,001-RM 3,500 160 (60.6) 104 (39.4)
RM 3,501-RM 4,000 59 (56.1) 46 (43.9)
RM 4,001-RM 4,500 136 (64.1) 76 (35.9)
RM 4,501-RM 5,000 72 (58.0) 52 (42.0)
> RM 5,000 273 (61.4) 171 (38.6)
*Missing data=436; **Significant at p < 0.05

64
4.7 Assessment towards medication compliance
Up to 73.1% (n= 2251) of the respondents admitted forgotten to take their prescribed
medication. This study found that the respondents' age, gender, ethnicity, education level,
occupation, and monthly income were significantly (p<0.05) associated with consumers’
compliance to prescribed medications (Table 22). Furthermore, less than half of the respondents
(n= 1303, 42.3%) admitted to have consciously chosen not to take prescribed medicines.
Respondents who were from the age group of 18-27 years (52.6%), Chinese ethnicity (43.9%),
tertiary education (50.0%) and from higher income group were more likely to choose not to
take prescribed medications (Table 22).
Additionally, sharing of medications was less common among consumers (n=1045, 33.9%).
Other then gender, sharing medications was reported to a have a significant association (p <
0.05) with all demographic variables as shown in Table 22.

65
Table 22: Association between medication adherence and demographic characteristics
Demographic
Characteristics
Outcome
Have you ever forgotten to take prescribed
medicines as indicated?
Have you ever chosen not to take a prescribed
medicine?
Have you ever shared any medicines with
others?
Yes
n (%)
No
n (%) p-value*
Yes
n (%)
No
n (%) p-value*
Yes
n (%)
No
n (%) p-value*
Total (N) 2251 (73.1) 830 (26.9) 1303 (42.3) 1778 (57.7) 1045 (33.9) 2036 (66.1)
Locality
Urban 1661 (73.1) 610 (26.9) 0.869
1010 (44.5) 1261 (55.5) <0.001
805 (35.4) 1466 (64.6) 0.003
Rural 590 (72.8) 220 (27.2) 293(36.2) 517 (63.8) 240 (29.6) 570 (70.4)
Age
18-27 582 (79.3) 152 (20.7)
<0.001
386 (52.6) 348 (47.4)
<0.001
357 (48.6) 377 (51.4)
<0.001
28-37 681 (74.6) 232 (25.4) 424 (46.4) 489 (53.6) 358 (39.2) 555 (60.8)
38-47 342 (72.5) 130 (27.5) 185 (39.2) 287 (60.8) 125 (26.5) 347 (73.5)
48-57 354 (72.5) 131 (27.0) 187 (38.6) 298 (61.4) 124 (25.6) 361 (74.4)
58-67 215 (60.2) 142 (39.8) 85 (23.8) 272 (76.2) 62 (17.4) 295 (82.6)
68-77 62 (61.4) 39 (38.6) 31 (30.7) 70 (69.3) 16 (15.8) 85 (84.2)
> 77 15 (78.9) 4 (21.1) 5 (26.3) 14 (73.7) 3 (15.8) 16 (84.2)
Gender
Male 848 (70.1) 361 (29.9) 0.003
479 (39.6) 730 (60.4) 0.016
403 (33.3) 806 (66.7) 0.582
Female 1403 (74.9) 469 (25.1) 824 (44.0) 1048 (56.0) 642 (34.3) 1230 (65.7)
Ethnicity
Malay 1476 (75.3) 483 (24.7)
0.003
858 (43.8) 1101 (56.2)
0.002
742 (37.9) 1217 (62.1)
<0.001 Chinese 383 (69.3) 170 (30.7) 243 (43.9) 310 (56.1) 166 (30.0) 387 (70.0)
Indian 135 (69.2) 60 (30.8) 77 (39.5) 118 (60.5) 44 (22.6) 151 (77.4)
Others 257 (68.7) 117 (31.3) 125 (33.4) 249 (66.6) 93 (24.9) 281 (75.1)
Education Level
Primary School 169 (60.4) 111 (39.6)
<0.001
84 (30.0) 196 (70.0)
<0.001
63 (22.5) 217 (77.5)
<0.001 Secondary School 937 (70.5) 392 (29.5) 500 (37.6) 829 (62.4) 364 (27.4) 965 (72.6)
College/ University 1100 (78.9) 295 (21.1) 698 (50.0) 697 (50.0) 601 (43.1) 794 (56.9)
No Formal Education 45 (58.4) 32 (41.6) 21 (27.3) 56 (72.7) 17 (22.1) 60 (77.9)
Occupation
Government 881 (77.3) 258 (22.7)
<0.001
511 (44.9) 628 (55.1)
<0.001
413 (36.3) 726 (63.7)
<0.001
Private/Self Employed 775 (73.5) 279 (26.5) 481 (45.6) 573 (54.4) 368 (34.9) 686 (65.1)
Retired 125 (60.7) 81 (39.3) 51 (24.8) 155 (75.2) 36 (17.5) 170 (82.5)
Student 136 (75.6) 44 (24.4) 96 (53.3) 84 (46.7) 102 (56.7) 78 (43.3)
Unemployed 334 (66.5) 168 (33.5) 164 (32.7) 338 (67.3) 126 (25.1) 376 (74.9)

66
Demographic
Characteristics
Outcome
Have you ever forgotten to take prescribed
medicines as indicated?
Have you ever chosen not to take a prescribed
medicine?
Have you ever shared any medicines with
others?
Yes
n (%)
No
n (%) p-value*
Yes
n (%)
No
n (%) p-value*
Yes
n (%)
No
n (%) p-value*
Living status
Alone 354 (75.8) 113 (24.2)
0.069
218 (46.7) 249 (53.3)
0.036
175 (37.5) 292 (62.5)
0.001 With Family 1845 (72.3) 706 (27.7) 1053 (41.3) 1498 (58.7) 837 (32.8) 1714 (67.2)
With Non-Family 52 (82.5) 11 (17.5) 32 (50.8) 31 (49.2) 33 (52.4) 30 (47.6)
Monthly income
<0.001
<0.001
0.003
≤RM 500 182 (65.7) 95 (34.3) 96 (34.7) 181 (65.3) 72 (26.0) 205 (74.0)
RM 501-1000 171 (64.8) 93 (35.2) 105 (39.8) 159 (60.2) 72 (27.3) 192 (72.7)
RM 1001- 1500 346 (73.2) 127 (26.8) 163 (34.5) 310 (65.5) 151 (31.9) 322 (68.1)
RM 1501- 2000 150 (67.6) 72 (32.4) 87 (39.2) 135 (60.8) 73 (32.9) 149 (67.1)
RM 2001- 2500 282 (73.2) 103 (26.8) 163 (42.3) 222 (57.7) 127 (33.0) 258 (67.0)
RM 2501-3000 121 (18.1) 51 (29.7) 68 (39.5) 104 (60.5) 59 (34.3) 113 (65.7)
RM 3001-3500 240 (76.4) 74 (23.6) 140 (44.6) 174 (55.4) 115 (36.6) 199 (63.4)
RM 3501-4000 95 (81.9) 21 (18.1) 53 (45.7) 63 (54.6) 46 (39.7) 70 (60.3)
RM 4001-4500 190 (81.5) 43 (18.5) 121 (51.9) 112 (48.1) 82 (35.2) 151 (64.8)
RM 4501-5000 90 (68.2) 42 (31.8) 58 (43.9) 74 (56.1) 49 (37.1) 83 (62.9)
> RM 5000 383 (77.8) 109 (22.2) 249 (50.6) 243 (49.4) 199 (40.4) 293 (59.6)
*Significant at p < 0.05
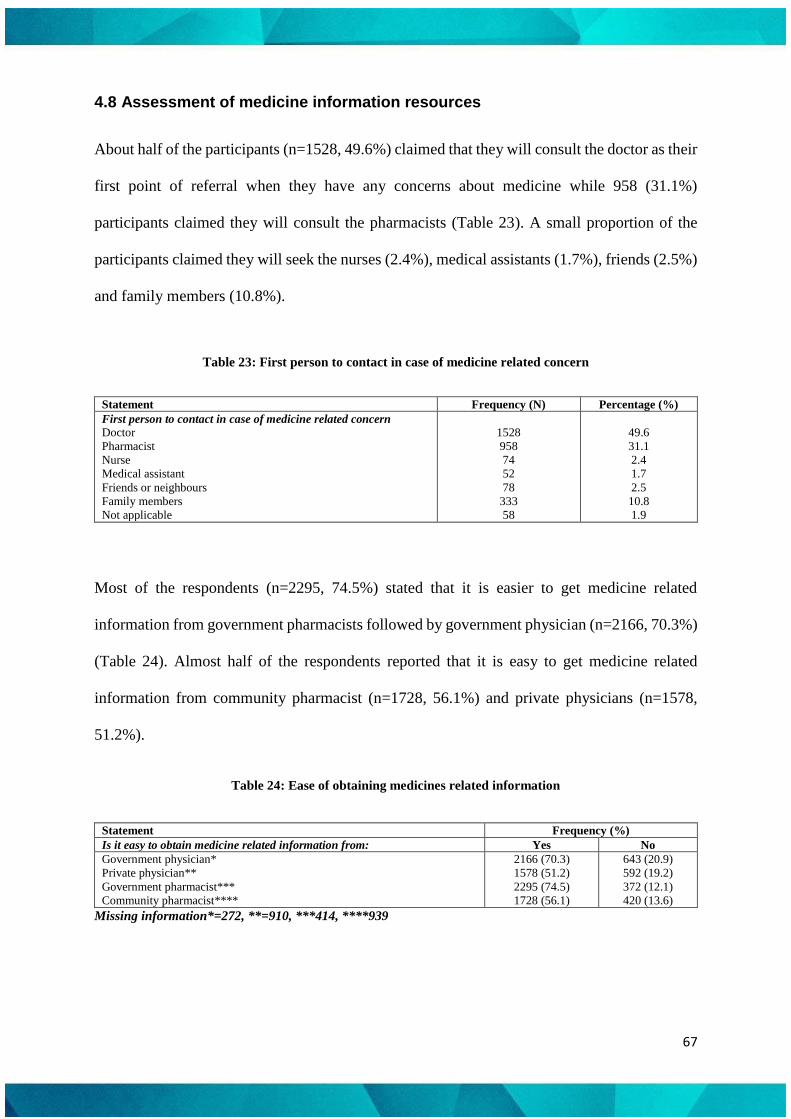
67
4.8 Assessment of medicine information resources
About half of the participants (n=1528, 49.6%) claimed that they will consult the doctor as their
first point of referral when they have any concerns about medicine while 958 (31.1%)
participants claimed they will consult the pharmacists (Table 23). A small proportion of the
participants claimed they will seek the nurses (2.4%), medical assistants (1.7%), friends (2.5%)
and family members (10.8%).
Table 23: First person to contact in case of medicine related concern
Statement Frequency (N) Percentage (%)
First person to contact in case of medicine related concern
Doctor
Pharmacist
Nurse
Medical assistant
Friends or neighbours
Family members
Not applicable
1528
958
74
52
78
333
58
49.6
31.1
2.4
1.7
2.5
10.8
1.9
Most of the respondents (n=2295, 74.5%) stated that it is easier to get medicine related
information from government pharmacists followed by government physician (n=2166, 70.3%)
(Table 24). Almost half of the respondents reported that it is easy to get medicine related
information from community pharmacist (n=1728, 56.1%) and private physicians (n=1578,
51.2%).
Table 24: Ease of obtaining medicines related information
Statement Frequency (%)
Is it easy to obtain medicine related information from: Yes No
Government physician*
Private physician**
Government pharmacist***
Community pharmacist****
2166 (70.3)
1578 (51.2)
2295 (74.5)
1728 (56.1)
643 (20.9)
592 (19.2)
372 (12.1)
420 (13.6)
Missing information*=272, **=910, ***414, ****939

68
More than half of the respondents (n=1821, 59.1%) consulted a healthcare professional for
medicine related inquiries. Internet was rated as the second most favourable source of
information (n=1134, 36.8%) followed by friends, family and neighbours (n=904, 29.3%) and
printed materials (n=666, 21.6%). There are 66.5% (n=2049) of the respondents never obtained
medicine information from traditional & complimentary practitioners as shown in Table 25.
Table 25: Frequency of obtaining medicines information from various information sources among
Malaysian consumers
Information source Frequency n (%)
Printed materials (magazines, newspaper)
Often 666 (21.6)
Seldom 1515 (49.2)
Never 899 (29.2)
Internet Often 1134 (36.8)
Seldom 955 (31.0)
Never 991 (32.2)
Common information and entertainment channels (TV, radio) Often 800 (26.0)
Seldom 1440 (46.7)
Never 840 (27.3)
Modern healthcare professionals (doctors, pharmacists, nurses) Often 1821 (59.1)
Seldom 1003 (32.6)
Never 256 (8.3)
Traditional and complimentary practitioners (shaman, sinseh) Often 155 (5.0)
Seldom 876 (28.4)
Never 2049 (66.5)
Friends, family and neighbours Often 904 (29.3)
Seldom 1414 (45.9)
Never 761 (24.7)
From Table 26 (a) and 26 (b), frequency in obtaining medicine information from printed
materials, internet and common information channels was significantly related with consumers’
locality, age, ethnicity, education level, occupation, living status and monthly household
income. Meanwhile, frequency in obtaining medicine information from friends and family
members and traditional practitioners were significantly related with consumers’ age, education
level, occupation, living status and monthly household income. However, there was no
significant association reported between frequency in obtaining medicine information from
modern healthcare professionals and all demographic variables.

69
Table 26 (a): Response to “How often do you obtain medicines information from printed materials/ internet, common information channels?” based on demographic
characteristics
Demographic
Characteristics
Obtaining Medicines Information from Various Sources
Printed Materials Internet Common information channel
Often
n (%)
Seldom
n (%)
Never
n (%)
p-
value*
Often
n (%)
Seldom
n (%)
Never
n (%)
p-
value*
Often
n (%)
Seldom
n (%)
Never
n (%)
p-
value*
Area
Urban 479
(21.1)
1152
(50.7)
639
(28.1) 0.003
889
(39.1)
707
(31.1)
674
(29.7) 0.004
575
(25.3)
1091
(48.0)
604
(26.6) 0.022
Rural 187
(23.1)
363
(44.8)
260
(32.1)
245
(30.2)
248
(30.6)
317
(39.1)
225
(27.8)
349
(43.1)
236
(29.1)
Age
18-27 161
(21.9)
399
(54.4)
174
(23.7)
<0.001
390
(53.1)
229
(31.2)
115
(15.7)
<0.001
192
(26.2)
371
(50.5)
171
(23.3)
<0.001
28-37 217
(23.8)
477
(52.2)
219
(24.0)
449
(49.2)
310
(34.0)
154
(16.9)
242
(26.5)
447
(49.0)
224
(24.5)
38-47 109
(23.1)
227
(48.1)
135
(28.6)
150
(31.8)
171
(36.2)
150
(31.8)
135
(28.6)
217
(46.0)
119
(25.2)
48-57 94
(19.4)
235
(48.5)
156
(32.2)
99
(20.4)
153
(31.5)
233
(48.0)
127
(26.2)
220
(45.4)
138
(28.5)
58-67 65
(18.2)
146
(40.9)
146
(40.9)
41
(11.5)
72
(20.2)
244
(68.3)
79
(22.1)
148
(41.5)
130
(36.4)
68-77 17
(16.8)
26
(25.7)
58
(57.4)
5
(5.0)
17
(16.8)
79
(78.2)
22
(21.8)
29
(28.7)
50
(49.5)
> 77 3
(15.8)
5
(26.3)
11
(57.9)
0
(0.0)
3
(15.8)
16
(84.2)
3
(15.8)
8
(42.1)
8
(42.1)
Gender
Male 247
(20.4)
587
(48.6)
374
(30.9) 0.286
391
(32.3)
390
(32.3)
427
(35.3) 0.298
311
(25.7)
531
(43.9)
366
(30.3) 0.003
Female 419
(22.4)
928
(49.6)
525
(28.0)
743
(39.7)
565
(30.2)
564
(30.1)
489
(26.1)
909
(48.6)
474
(25.3)
Ethnicity
Malay 446
(22.8)
976
(49.8)
536
(27.4)
<0.001
735
(37.5)
644
(32.9)
579
(29.6)
<0.001
556
(28.4)
942
(48.1)
460
(23.5)
<0.001
Chinese 132
(23.9)
278
(50.3)
143
(25.9)
213
(38.5)
159
(28.8)
181
(32.7)
120
(21.7)
259
(46.8)
174
(31.5)
Indian 28
(14.4)
102
(52.3)
65
(33.3)
66
(33.8)
55
(28.2)
74
(37.9)
32
(16.4)
98
(50.3)
65
(33.3)
Others 60
(16.0)
159
(42.5)
155
(41.4)
120
(32.1)
97
(25.9)
157
(42.0)
92
(24.6)
141
(37.7)
141
(37.7)
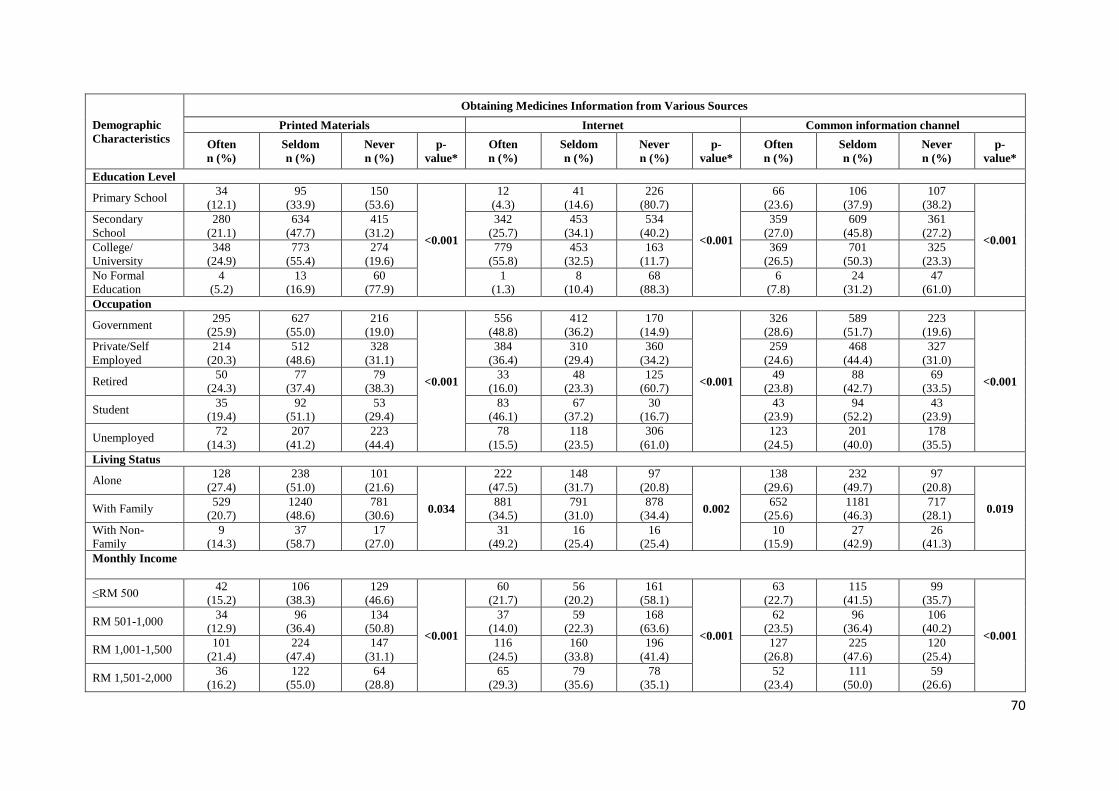
70
Demographic
Characteristics
Obtaining Medicines Information from Various Sources
Printed Materials Internet Common information channel
Often
n (%)
Seldom
n (%)
Never
n (%)
p-
value*
Often
n (%)
Seldom
n (%)
Never
n (%)
p-
value*
Often
n (%)
Seldom
n (%)
Never
n (%)
p-
value*
Education Level
Primary School 34
(12.1)
95
(33.9)
150
(53.6)
<0.001
12
(4.3)
41
(14.6)
226
(80.7)
<0.001
66
(23.6)
106
(37.9)
107
(38.2)
<0.001
Secondary
School
280
(21.1)
634
(47.7)
415
(31.2)
342
(25.7)
453
(34.1)
534
(40.2)
359
(27.0)
609
(45.8)
361
(27.2)
College/
University
348
(24.9)
773
(55.4)
274
(19.6)
779
(55.8)
453
(32.5)
163
(11.7)
369
(26.5)
701
(50.3)
325
(23.3)
No Formal
Education
4
(5.2)
13
(16.9)
60
(77.9)
1
(1.3)
8
(10.4)
68
(88.3)
6
(7.8)
24
(31.2)
47
(61.0)
Occupation
Government 295
(25.9)
627
(55.0)
216
(19.0)
<0.001
556
(48.8)
412
(36.2)
170
(14.9)
<0.001
326
(28.6)
589
(51.7)
223
(19.6)
<0.001
Private/Self
Employed
214
(20.3)
512
(48.6)
328
(31.1)
384
(36.4)
310
(29.4)
360
(34.2)
259
(24.6)
468
(44.4)
327
(31.0)
Retired 50
(24.3)
77
(37.4)
79
(38.3)
33
(16.0)
48
(23.3)
125
(60.7)
49
(23.8)
88
(42.7)
69
(33.5)
Student 35
(19.4)
92
(51.1)
53
(29.4)
83
(46.1)
67
(37.2)
30
(16.7)
43
(23.9)
94
(52.2)
43
(23.9)
Unemployed 72
(14.3)
207
(41.2)
223
(44.4)
78
(15.5)
118
(23.5)
306
(61.0)
123
(24.5)
201
(40.0)
178
(35.5)
Living Status
Alone 128
(27.4)
238
(51.0)
101
(21.6)
0.034
222
(47.5)
148
(31.7)
97
(20.8)
0.002
138
(29.6)
232
(49.7)
97
(20.8)
0.019 With Family 529
(20.7)
1240
(48.6)
781
(30.6)
881
(34.5)
791
(31.0)
878
(34.4)
652
(25.6)
1181
(46.3)
717
(28.1)
With Non-
Family
9
(14.3)
37
(58.7)
17
(27.0)
31
(49.2)
16
(25.4)
16
(25.4)
10
(15.9)
27
(42.9)
26
(41.3)
Monthly Income
≤RM 500 42
(15.2)
106
(38.3)
129
(46.6)
<0.001
60
(21.7)
56
(20.2)
161
(58.1)
<0.001
63
(22.7)
115
(41.5)
99
(35.7)
<0.001
RM 501-1,000 34
(12.9)
96
(36.4)
134
(50.8)
37
(14.0)
59
(22.3)
168
(63.6)
62
(23.5)
96
(36.4)
106
(40.2)
RM 1,001-1,500 101
(21.4)
224
(47.4)
147
(31.1)
116
(24.5)
160
(33.8)
196
(41.4)
127
(26.8)
225
(47.6)
120
(25.4)
RM 1,501-2,000 36
(16.2)
122
(55.0)
64
(28.8)
65
(29.3)
79
(35.6)
78
(35.1)
52
(23.4)
111
(50.0)
59
(26.6)

71
Demographic
Characteristics
Obtaining Medicines Information from Various Sources
Printed Materials Internet Common information channel
Often
n (%)
Seldom
n (%)
Never
n (%)
p-
value*
Often
n (%)
Seldom
n (%)
Never
n (%)
p-
value*
Often
n (%)
Seldom
n (%)
Never
n (%)
p-
value*
RM 2,001-2,500 92
(23.9)
200
(51.9)
93
(24.2)
161
(41.8)
133
(34.5)
91
(23.6)
110
(28.6)
192
(49.9)
83
(21.6)
RM 2,501-3,000 37
(21.5)
77
(44.8)
58
(33.7)
58
(33.7)
58
(33.7)
56
(32.6)
48
(27.9)
69
(40.1)
55
(32.0)
RM 3,001-3,500 87
(27.7)
163
(51.9)
64
(20.4)
128
(40.8)
111
(35.4)
75
(23.9)
95
(30.3)
143
(45.5)
76
(24.2)
RM 3,501-4,000 35
(30.2)
56
(48.3)
25
(21.6)
65
(56.0)
29
(25.0)
22
(19.0)
31
(26.7)
56
(48.3)
29
(25.0)
RM 4,001-4,500 68
(29.2)
121
(51.9)
44
(18.9)
131
(56.2)
68
(29.2)
34
(14.6)
64
(27.5)
121
(51.9)
48
(20.6)
RM 4,501-5,000 31
(23.5)
80
(60.6)
21
(15.9)
73
(55.3)
39
(29.5)
20
(15.2)
40
(30.3)
58
(43.9)
34
(25.8)
> RM 5,000 103
(20.9)
270
(54.9)
119
(24.2)
240
(48.8)
163
(33.1)
89
(18.1)
108
(22.0)
254
(51.6)
130
(26.4)
*Significant at p < 0.05

72
Table 26 (b): Response to “How often do you obtain medicines information from modern healthcare professionals/ traditional & complimentary practitioners/
friends, family or friends?” based on demographic characteristics
Demographic
Characteristics
Obtaining Medicines Information from Various Sources
Modern Healthcare Professionals Traditional practitioners Friends/ Family/ Neighbours
Often n
(%)
Seldom n
(%)
Never n
(%) p-value*
Often n
(%)
Seldom n
(%)
Never n
(%) p-value*
Often n
(%)
Seldom n
(%)
Never n
(%) p-value*
Area
Urban 1340
(59.0)
745
(32.8)
185
(8.1) 0.513
118
(5.2)
662
(29.2)
1490
(65.6) 0.084
674
(29.7)
1082
(47.6)
513
(22.6) <0.001
Rural 481
(59.4)
258
(31.8)
71
(8.8)
37
(4.6)
214
(26.4)
559
(69.0)
230
(28.4)
332
(41.0)
248
(30.6)
Age
18-27 419
(57.1)
254
(34.6)
61
(8.3)
0.563
47
(6.4)
233
(31.7)
454
(61.9)
<0.001
257
(35.0)
363
(49.5)
114
(15.5)
<0.001
28-37 547
(59.9)
290
(31.8)
76
(8.3)
47
(5.1)
292
(32.0)
574
(62.9)
257
(28.1)
440
(48.2)
216
(23.7)
38-47 273
(57.8)
162
(34.3)
36
(7.6)
18
(3.8)
122
(25.8)
331
(70.1)
113
(23.9)
225
(47.7)
133
(28.2)
48-57 279
(57.5)
160
(33.0)
46
(9.5)
18
(3.7)
133
(27.4)
334
(68.9)
130
(26.8)
211
(43.5)
144
(29.7)
58-67 228
(63.9)
100
(28.0)
29
(8.1)
22
(6.2)
68
(19.0)
267
(74.8)
106
(29.7)
136
(38.1)
115
(32.2)
68-77 65
(64.4)
31
(30.7)
5
(8.0)
2
(2.0)
24
(23.8)
75
(74.3)
36
(35.6)
32
(31.7)
32
(31.7)
> 77 10
(52.6)
6
(31.6)
3
(15.8)
1
(5.3)
4
(21.1)
14
(73.7)
5
(26.3)
7
(36.8)
7
(36.8)
Gender
Male 691
(57.2)
404
(33.4)
113
(9.3) 0.892
67
(5.5)
368
(30.4)
773
(63.9) 0.018
351
(26.1)
541
(44.7)
315
(26.1) 0.221
Female 1130
(60.4)
599
(32.0)
143
(7.6)
88
(4.7)
508
(27.1)
1276
(68.2)
553
(29.5)
873
(46.6)
446
(23.8)
Ethnicity
Malay 1158
(59.1)
654
(33.4)
146
(7.5)
0.240
89
(4.5)
570
(29.1)
1299
(66.3)
<0.001
602
(30.7)
887
(45.3)
468
(23.9)
0.015
Chinese 338
(61.1)
169
(30.6)
46
(8.3)
49
(8.9)
187
(33.8)
317
(57.3)
155
(28.0)
279
(50.5)
119
(21.5)
Indian 114
(58.5)
62
(31.8)
19
(9.7)
7
(3.6)
48
(24.6)
140
(71.8)
52
(26.7)
88
(45.1)
55
(28.2)
Others 211
(56.4)
118
(31.6)
45
(12.0)
10
(2.7)
71
(19.0)
293
(78.3)
95
(25.4)
160
(42.8)
119
(31.8)

73
Demographic
Characteristics
Obtaining Medicines Information from Various Sources
Modern Healthcare Professionals Traditional practitioners Friends/ Family/ Neighbours
Often n
(%)
Seldom n
(%)
Never n
(%) p-value*
Often n
(%)
Seldom n
(%)
Never n
(%) p-value*
Often n
(%)
Seldom n
(%)
Never n
(%) p-value*
Education Level
Primary School 168
(60.0)
84
(30.0)
27
(9.6)
0.133
17
(6.1)
54
(19.3)
208
(74.3)
<0.001
71
(25.4)
114
(40.7)
94
(33.6)
<0.001
Secondary School 767
(57.7)
426
(32.1)
136
(10.2)
54
(4.1)
353
(26.6)
922
(69.4)
353
(26.6)
566
(42.6)
409
(30.8)
College/ University 846
(60.6)
466
(33.4)
83
(5.9)
76
(5.4)
459
(32.9)
860
(61.6)
452
(32.4)
714
(51.5)
229
(16.4)
No Formal Education 40
(51.9)
27
(35.1)
10
(13.0)
8
(10.4)
10
(13.0)
59
(76.6)
28
(36.4)
20
(26.0)
29
(37.7)
Occupation
Government 703
(61.7)
362
(31.8)
73
(6.4)
0.191
56
(4.9)
375
(32.9)
707
(62.1)
<0.001
281
(24.7)
606
(53.2)
251
(22.0)
<0.001
Private/Self Employed 578
(54.8)
370
(35.1)
106
(10.1)
57
(5.4)
287
(27.2)
710
(67.4)
304
(28.8)
476
(45.2)
274
(26.0)
Retired 122
(59.2)
70
(34.0)
14
(6.8)
11
(5.3)
51
(24.8)
144
(69.9)
66
(32.0)
79
(38.3)
60
(29.1)
Student 98
(54.4)
63
(35.0)
19
(10.6)
13
(7.2)
52
(28.9)
115
(63.9)
84
(46.7)
76
(42.2)
20
(11.1)
Unemployed 320
(63.7)
138
(27.5)
44
(8.8)
18
(3.6)
111
(22.1)
373
(74.3)
169
(33.7)
177
(35.3)
156
(31.1)
Living Status
Alone 261
(55.9)
173
(37.0)
33
(7.1)
0.068
19
(4.1)
169
(36.2)
279
(59.7)
0.001
132
(28.3)
232
(49.7)
103
(22.1)
0.021 With Family 1522
(59.7)
811
(31.8)
217
(8.5)
134
(5.3)
692
(27.1)
1724
(67.6)
755
(29.6)
1146
(44.9)
648
(25.4)
With Non-Family 38
(60.3)
19
(30.2)
6
(9.5)
2
(3.2)
15
(23.8)
46
(73.0)
17
(27.0)
36
(57.1)
10
(15.9)
Monthly Income
≤RM 500 158
(57.0)
90
(32.5)
29
(10.5) 0.058
14
(5.1)
58
(20.9)
205
(74.0) <0.001
95
(34.3)
96
(34.7)
86
(31.0) <0.001
RM 501-RM 1,000 146
(55.3)
83
(31.4)
35
(13.3)
7
(2.7)
60
(22.7)
197
(74.6)
68
(25.8)
105
(39.38)
90
(34.1)

74
Demographic
Characteristics
Obtaining Medicines Information from Various Sources
Modern Healthcare Professionals Traditional practitioners Friends/ Family/ Neighbours
Often n
(%)
Seldom n
(%)
Never n
(%) p-value*
Often n
(%)
Seldom n
(%)
Never n
(%) p-value*
Often n
(%)
Seldom n
(%)
Never n
(%) p-value*
RM 1001-1500 265
(56.0)
155
(32.8)
52
(11.0)
28
(5.9)
121
(25.6)
323
(68.3)
119
(25.2)
215
(45.5)
138
(29.2)
RM 1,501-RM 2,000 136
(61.3)
68
(30.6)
18
(8.1)
6
(2.7)
70
(31.5)
146
(65.8)
65
(29.3)
97
(43.7)
60
(27.0)
RM 2001-RM 2,500 219
(56.9)
137
(35.6)
29
(7.5)
16
(4.2)
113
(29.4)
256
(66.5)
114
(29.6)
183
(47.5)
88
(22.9)
RM 2,501-RM 3,000 103
(59.9)
49
(28.5)
20
(11.6)
12
(7.0)
41
(23.8)
119
(69.2)
55
(32.0)
62
(36.0)
55
(32.0)
RM 3,001-RM 3,500 173
(55.1)
121
(38.5)
20
(6.4)
20
(6.4)
95
(30.3)
199
(63.4)
91
(29.0)
154
(49.0)
69
(22.0)
RM 3,501-RM 4,000 72
(62.1)
37
(31.9)
7
(6.0)
6
(5.2)
43
(37.1)
67
(57.8)
33
(28.4)
62
(53.4)
21
(18.1)
RM 4,001-RM 4,500 159
(68.2)
61
(26.2)
13
(5.6)
21
(9.0)
73
(31.3)
139
(59.7)
76
(32.6)
114
(48.9)
43
(18.5)
RM 4,501-RM 5,000 90
(68.2)
34
(25.8)
8
(6.1)
7
(5.3)
26
(19.7)
99
(75.0)
39
(29.5)
73
(55.3)
20
(15.2)
> RM 5,000 299
(60.8)
168
(34.1)
25
(5.1)
18
(3.7)
176
(35.8)
298
(60.6)
149
(30.3)
253
(51.4)
90
(18.3)
*Significant at p < 0.05
75
As presented in Table 27, almost three quarter of the respondents (75.1%) felt that they need
written medicine information and this was significantly associated with their age, ethnicity,
education level, occupation, living status and monthly income. The findings suggested that
most respondents from the age of 18-27 years (79.9%), with tertiary education (80.8%),
government sector (81.5%), living with non-family (84.1%) and with income of RM 1001-
1500 (82.0%) required additional written medicines information.

76
Table 27: Consumers’ Response to “Do you need written medicines information?” based on demographic
characteristics
Demographic Characteristics
Need Written Medicine Information?
Yes
n (%)
No
n (%) p-value*
Total (N) 2315 (75.1) 765 (24.8) -
Locality
Urban 1709 (75.2) 562 (24.8) 0.900
Rural 606 (74.8) 203 (25.2)
Age
18-27 587 (79.9) 147 (20.1)
<0.001
28-37 709 (77.6) 204 (22.4)
38-47 347 (73.5) 125 (26.5)
48-57 362 (74.6) 123 (25.4)
58-67 236 (66.1) 120 (33.9)
68-77 63 (62.3) 38 (37.7)
> 77 11 (57.8) 8 (42.2)
Gender
Male 887 (73.3) 321 (26.7) 0.082
Female 1428 (76.2) 444 (23.8)
Ethnicity
Malay 1484 (75.7) 475 (24.3)
<0.001 Chinese 388 (70.1) 165 (29.9)
Indian 139 (71.2) 56 (28.8)
Others 304 (81.2) 69 (18.8)
Education Level
Primary School 190 (67.8) 90 (32.2)
<0.001 Secondary School 952 (71.6) 377 (28.4)
College/ University 1128 (80.8) 266 (19.2)
No Formal Education 45 (58.4) 32 (41.6)
Occupation
Government 929 (81.5) 210 (18.5)
<0.001
Private/Self Employed 764 (72.4) 290 (27.6)
Retired 127 (61.6) 78 (38.4)
Student 144 (80.0) 36 (20.0)
Unemployed 351 (69.9) 151 (30.1)
Living Status
Alone 372 (79.6) 95 (20.4)
0.010 With Family 1890 (74.0) 660 (26.0)
With Non-Family 53 (84.1) 10 (15.9)
Monthly Income
≤RM 500 197 (71.1) 80 (28.9)
0.004
RM 501-RM 1,000 178 (67.4) 86 (32.6)
RM 1,001-RM 1,500 338 (82.0) 135 (18.0)
RM 1,501-RM 2,000 166 (74.7) 56 (25.3)
RM 2,001-RM 2,500 288 (74.8) 97 (25.2)
RM 2501-RM 3,000 134 (77.9) 38 (22.1)
RM 3,001-RM 3,500 247 (78.6) 66 (21.4)
RM 3,501-RM 4,000 91 (78.4) 25 (21.6)
RM 4,001-RM 4,500 179 (76.8) 54 (23.2)
RM 4,501-RM 5,000 105 (79.5) 27 (20.5)
> RM 5000 392 (79.6) 100 (20.4)
*Significant at p < 0.05

77
Up to 70.8% of respondents reported that they require additional counselling from their
pharmacists (Table 28). This need was significantly associated with ethnicity and monthly
income. This study found that the proportion of gender and locality requiring additional
counselling from their pharmacists was almost equal. Consumers from other ethnic groups
(74.5%) were also found to require additional counselling from pharmacists. In addition, 72.1%
of those working in the private sector also claimed that they require additional counselling from
their pharmacists.

78
Table 28: Responses to “Do you require additional counselling from your pharmacists?” based on
demographic characteristics
Demographic Characteristics
Outcome
Require additional counselling from pharmacists?
Yes
n (%)
No
n (%) p-value*
Total (N) 2181 (70.8) 899 (29.2) -
Locality
Urban 1599 (70.4) 671 (29.6) 0.463
Rural 582 (71.8) 228 (28.2)
Age
18-27 520 (70.8) 214 (29.2)
0.308
28-37 661 (72.3) 251 (27.7)
38-47 332 (70.3) 140 (29.7)
48-57 342 (70.5) 143 (29.5)
58-67 246 (68.9) 111 (31.1)
68-77 71 (70.2) 30 (29.8)
> 77 9 (47.3) 10 (52.7)
Gender
Male 857 (70.8) 352 (29.2) 0.968
Female 1324 (70.7) 547 (29.3)
Ethnicity
Malay 1395 (71.2) 564 (28.8)
0.030 Chinese 383 (69.2) 170 (30.3)
Indian 124 (63.5) 71 (36.5)
Others 279 (74.5) 94 (25.5)
Education Level
Primary School 197 (70.3) 83 (29.7)
0.540 Secondary School 934 (70.2) 395 (29.8)
College/ University 1000 (71.6) 394 (28.4)
No Formal Education 50 (64.9) 27 (35.1)
Occupation
Government 811 (71.2) 328 (28.8)
0.404
Private/Self Employed 760 (72.1) 293 (27.9)
Retired 136 (66.0) 70 (34.0)
Student 125 (69.4) 55 (30.6)
Unemployed 349 (69.5) 153 (30.1)
Living Status
Alone 347 (74.3) 119 (25.7)
0.081 With Family 1786 (70.1) 765 (29.9)
With Non-Family 48 (76.1) 15 (23.9)
Monthly Income
≤RM 500 184 (66.4) 93 (33.6)
0.042
RM 501-1,000 181 (68.5) 83 (31.5)
RM 1,001-RM 1,500 335 (70.8) 138 (29.2)
RM 1,501-RM 2,000 165 (74.3) 57 (25.7)
RM 2,001- RM 2,500 276 (71.6) 109 (28.4)
RM 2,501- RM 3,000 107 (62.2) 65 (37.8)
RM 3,001-RM 3,500 232 (73.8) 82 (26.2)
RM 3,501-RM 4,000 85 (73.2) 31 (26.8)
RM 4,001-RM 4,500 154 (66.0) 79 (34.0)
RM 4,501-RM 5,000 95 (71.9) 37 (28.1)
> RM 5,000 366 (74.3) 125 (25.7)
*Significant at p < 0.05

79
4.9 Awareness on ‘Know Your Medicines’ programme
Almost half of the respondents (51.9%, n= 1600) claimed that they were aware of the “Know
Your Medicine” campaign. This awareness was found to be significantly associated with all
demographic variables (Table 29). Respondents from the age group of 28-37 years, with
tertiary education, rural residencies, government sector, living alone and income more than
RM1000 had higher awareness of “Know Your Medicines” campaign.

80
Table 29: Consumers’ Awareness of “Know Your Medicine” Campaign
Demographic Characteristics
Outcome
Aware of Know your Medicine Campaign?
Yes
n (%)
No
n (%) p-value*
Total (N) 1600 (51.9) 1481 (48.1) -
Locality Urban 1150 (50.6) 1121 (49.4) 0.016
Rural 450 (55.5) 360 (44.5)
Age 18-27 409 (55.7) 325 (44.3)
<0.001
28-37 558 (61.1) 355 (38.9)
38-47 249 (52.7) 223 (47.3)
48-57 219 (45.1) 266 (54.9)
58-67 143 (40.0) 214 (60.0)
68-77 17 (16.8) 84 (83.2)
> 77 5 (26.3) 14 (73.7)
Gender Male 555 (45.9) 654 (54.1) <0.001
Female 1045 (55.8) 827 (44.2)
Ethnicity
Malay 1153 (58.8) 806 (41.2)
<0.001 Chinese 176 (31.8) 377 (68.2)
Indian 82 (42.0) 113 (58.0)
Others 189 (50.5) 185 (49.5)
Education Level Primary School 72 (25.7) 208 (74.3)
<0.001 Secondary School 690 (51.9) 639 (48.1)
College/ University 830 (59.4) 565 (40.6)
No Formal Education 8 (10.3) 69 (89.7)
Occupation Government 842 (73.9) 297 (26.1)
<0.001
Private/Self Employed 408 (38.7) 646 (61.3)
Retired 80 (38.8) 126 (61.2)
Student 75 (41.6) 105 (58.4)
Unemployed 195 (38.8) 307 (51.2)
Living Status Alone 281 (60.1) 186 (39.9)
<0.001 With Family 1290 (50.5) 1261(49.5)
With Non-Family 29 (46.0) 34 (54.0)
Monthly Income ≤RM 500 93 (33.5) 184 (66.5)
<0.001
RM 501-1000 104 (39.3) 160 (60.7)
RM 1001- 1500 250 (52.8) 223 (47.2)
RM 1501- 2000 121 (54.5) 101 (45.5)
RM 2001- 2500 215 (55.8) 170 (44.2)
RM 2501-3000 87 (50.5) 85 (49.5)
RM 3001-3500 190 (60.5) 124 (39.5)
RM 3501-4000 68 (58.6) 48 (41.4)
RM 4001-4500 138 (59.2) 95 (40.8)
RM 4501-5000 73 (55.3) 59 (44.7)
> RM 5000 261 (53.0) 231 (47.0)
*Significant at p < 0.05
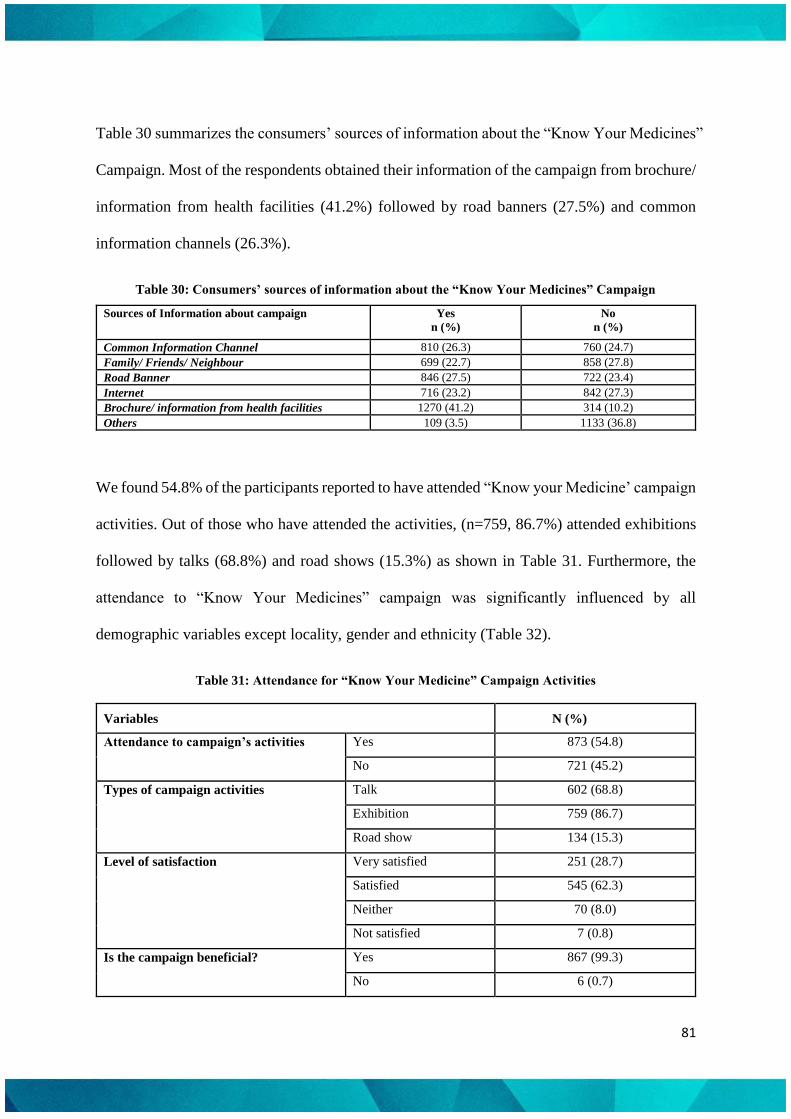
81
Table 30 summarizes the consumers’ sources of information about the “Know Your Medicines”
Campaign. Most of the respondents obtained their information of the campaign from brochure/
information from health facilities (41.2%) followed by road banners (27.5%) and common
information channels (26.3%).
Table 30: Consumers’ sources of information about the “Know Your Medicines” Campaign
Sources of Information about campaign Yes
n (%)
No
n (%)
Common Information Channel 810 (26.3) 760 (24.7)
Family/ Friends/ Neighbour 699 (22.7) 858 (27.8)
Road Banner 846 (27.5) 722 (23.4)
Internet 716 (23.2) 842 (27.3)
Brochure/ information from health facilities 1270 (41.2) 314 (10.2)
Others 109 (3.5) 1133 (36.8)
We found 54.8% of the participants reported to have attended “Know your Medicine’ campaign
activities. Out of those who have attended the activities, (n=759, 86.7%) attended exhibitions
followed by talks (68.8%) and road shows (15.3%) as shown in Table 31. Furthermore, the
attendance to “Know Your Medicines” campaign was significantly influenced by all
demographic variables except locality, gender and ethnicity (Table 32).
Table 31: Attendance for “Know Your Medicine” Campaign Activities
Variables N (%)
Attendance to campaign’s activities Yes 873 (54.8)
No 721 (45.2)
Types of campaign activities Talk 602 (68.8)
Exhibition 759 (86.7)
Road show 134 (15.3)
Level of satisfaction Very satisfied 251 (28.7)
Satisfied 545 (62.3)
Neither 70 (8.0)
Not satisfied 7 (0.8)
Is the campaign beneficial? Yes 867 (99.3)
No 6 (0.7)

82
Table 32: Responses to “Have you attended any of the campaign’s activities?” based on demographic
characteristics
Demographic Characteristics Attended Campaign Activities?
Yes
n (%)
No
n (%)
p-value*
Locality
Urban 622 (54.5) 520 (45.5) 0.07
Rural 251 (55.5) 201 (44.5)
Age
18-27 221 (54.4) 185 (45.6) <0.001
28-37 294 (53.2) 259 (46.8)
38-47 155 (63.3) 90 (36.7)
48-57 122 (55.7) 97 (44.3)
58-67 67 (47.5) 74 (52.5)
68-77 9 (52.9) 8 (47.1)
> 77 1 (20.0) 4 (80.0)
Gender
Male 294 (52.9) 262 (47.1) 0.07
Female 579 (55.8) 459 (44.2)
Ethnicity
Malay 622 (54.1) 528 (45.9) 0.43
Chinese 104 (59.8) 70 (40.2)
Indian 40 (49.4) 41 (50.6)
Others 107 (56.6) 82 (43.4)
Education Level
Primary School 32 (45.1) 39 (54.9) 0.03
Secondary School 401 (57.9) 292 (42.1)
College/ University 436 (53.0) 387(47.0)
No Formal Education 4 (57.1) 3 (42.9)
Occupation
Government 510 (61.2) 324 (38.8) <0.001
Private/Self Employed 195 (48.0) 211 (52.0)
Retired 38 (47.5) 42 (52.5)
Student 42 (51.2) 40 (48.8)
Unemployed 88 (45.8) 104 (54.2)
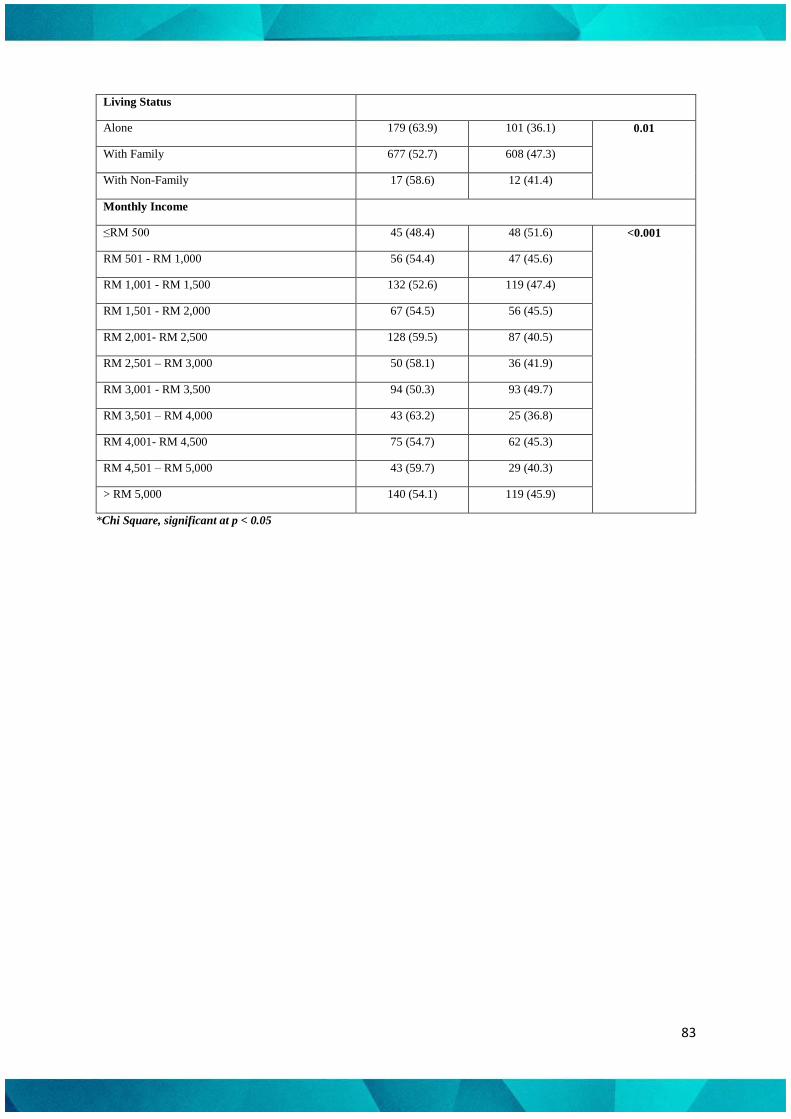
83
Living Status
Alone 179 (63.9) 101 (36.1) 0.01
With Family 677 (52.7) 608 (47.3)
With Non-Family 17 (58.6) 12 (41.4)
Monthly Income
≤RM 500 45 (48.4) 48 (51.6) <0.001
RM 501 - RM 1,000 56 (54.4) 47 (45.6)
RM 1,001 - RM 1,500 132 (52.6) 119 (47.4)
RM 1,501 - RM 2,000 67 (54.5) 56 (45.5)
RM 2,001- RM 2,500 128 (59.5) 87 (40.5)
RM 2,501 – RM 3,000 50 (58.1) 36 (41.9)
RM 3,001 - RM 3,500 94 (50.3) 93 (49.7)
RM 3,501 – RM 4,000 43 (63.2) 25 (36.8)
RM 4,001- RM 4,500 75 (54.7) 62 (45.3)
RM 4,501 – RM 5,000 43 (59.7) 29 (40.3)
> RM 5,000 140 (54.1) 119 (45.9)
*Chi Square, significant at p < 0.05

84
5.0 DISCUSSIONS
Medicines use and expenditure among Malaysian consumers
A great challenge for the rational use of medicines is the cost containment of chronic of
medicines. National Health Morbidity Survey 2015 found an increasing prevalence of chronic
illnesses in Malaysia. Among the non-communicable diseases found across the country,
hypercholesterolemia was reported to be of the highest prevalence followed by hypertension
and diabetes mellitus (20). Such disease patterns found in Malaysia resembled closely to what
is reported from literature around the globe (21, 22). The increase in chronic illnesses has
resulted a rise of healthcare spending in the country has seriously compromised people's
healthy lifestyle choices and practices as predicted by the pattern of chronic diseases in the
country (19).
The use of traditional medicines is surprisingly small which is similar with the findings in
National Survey on the Use of Medicines (NSUM) 2012 (23). The minor group of people use
herbal and supplements not only to maintain their health but also to enhance their vitality and
appearance. There remained some proportion of consumers who sought consultation and
medicines information from traditional and complimentary (TCM) practitioners. Malaysia has
a diverse pool of traditional medicines practices as the country is made up of multi-ethnic
groups that carry with them different cultures, theories, beliefs and experiences. Although the
use of herbal products is not illegitimate, it is essential that the consumers are kept informed of
the policies and legislation governing TCMs to ensure that they access only safe and effective
products and services.
In recent years, public out-of-pocket healthcare expenditure in Malaysia has increased steadily.
Within this context, Ministry of Health, Malaysia is the main provider of health care services
in the country. The public health care system largely funded by the government and financed
mainly from public tax revenue. The private health care sector provides services on a

85
nonsubsidized, fee-for-service basis, and mainly serves for those who can afford to pay. Health
care services by private sectors are funded mainly by private health insurance, consumers’ out-
of-pocket payment, and non-profit institution. Therefore, a universal health financing system
must be established by transforming the role of budget funding from directly subsidizing
provision to subsidizing the purchase of services on behalf of the entire population. The
integration of services between the public and private sector is very much needed, at a cost the
people can afford (24).
Knowledge of medicines use
The extensive pharmaceutical use among the survey respondents and they claimed that
understand the proper use of medicines. However, many were unable to identify their own
medicines by the trade or generic name. This may be due to lower educational and income
level, unemployment and elderly had more problems in identifying brand and generic
medicines name than other groups. Nonetheless, most of the Malaysian consumers were aware
of the side effect, possible food-drug and drug-drug interactions, medicines’ shelf life and
storage condition.
On the other hand, many of the respondents were unaware about disposal of damaged or
expired medicines. The proper well-run disposal system and collection programs are
paramount in ensuring safety of humans and the natural environment. The awareness regarding
impact of improper disposal of pharmaceutical is still a cornered issue and need to be roused.
The current practices of collection and disposal of unwanted pharmaceuticals are not optimal;
it is highlighting the role of pharmacists towards the issue. Policies and programs need to be
established to educate the problem, minimising the risks and to protect environment and the
lives.

86
Self-assessed use of medicines
In the broader context of medicine use, non-compliance to treatment regimen is well reported
in literature (25). Prior reviews have estimated the extent of patient default at 20% to 82% (26,
27). Current results shows many reported that they had ever forgotten to take their medication
at some point in their lives. They also agreed that they had decided not to take a prescribed
medicine during some point of their treatment plan. In general, medication compliance is
affected by a multitude of factors (28) and from this survey, it was found that self-reported
non-compliance is dependent upon a number of variables. However, as the assessment of
compliance in the present survey was based upon self-reporting, the results may not reflect the
actual medication taking behaviour.
The negative implication of sharing medicines is equivalent of using medicines without
prescription. While self-medication is considered beneficial to a certain extent, sharing of
medications without professional supervision exposes patients at an increased risk of harm
arising from medication error (29). In this survey, some of the respondents were found to have
shared their medicines and was more prevalent in respondents living in the urban area, of
younger age group, tertiary education and higher income level.
We introduce price component in NSUM III which was not highlighted in the previous versions.
Where three quarter of the respondents agreed that price is an important component to be
displayed on medication labels, some think price has no effect on their medication taking
behaviour. Many respondents however think that price information of the labels helps them to
make choices when purchasing medicines which is also evident from literature (31, 32). It is
well known that many patients engage in an implicit cost–benefit analysis in which beliefs
about the necessity of their medication are weighed against concerns about the potential

87
adverse effects of taking it and that these beliefs are related to medication compliance and not
to the price (30).
Sources of information
The current survey reported that more than half of the respondents still prefer to consult the
doctors as their reference point on issues concerning medicines and health-related problems.
This could be explained in part by the growth of healthcare profession in Malaysia which is
largely dominated by the heavily subsidized public sector (33). However, when asked about
the ease of obtaining information on medicines, this survey shows consumers felt that it is
easier to obtain information from government pharmacists when compared with government
doctors and private physicians, community pharmacists and private doctors.
Most respondents obtained medicines information from the internet, friends, family and
neighbours, printed materials, and common information channels. This is due to introduction
of information technology and social media, medicine-related information if freely and readily
available. While little can be done to control and constrain the information available in the
World Wide Web and mass media, there is an urgent need to educate consumers about the
credibility and reliability of information obtained from sources other than the mainstream
healthcare providers. To overcome this issue, the Pharmaceutical Services Division developed
an online portal for consumers to submit medicines enquiries and complaints of
pharmaceuticals as part of the national “Know Your Medicines” programme. However, survey
found many still unaware of this service.
More than half of the respondents had attended the campaign activities and almost all of them
were satisfied with the movement. Therefore, a rigorous effort is needed to spread the news
about the campaign so that people can take maximum benefits and know how about rational
medicine use.

88
Most respondents needed additional written medicines information and this was associated
with their age, ethnicity, education, occupation, living status and income level. This is a
positive indication whereby the Malaysian consumers are willing to know more about their
medication use.
70.8% of the respondents reported that they require additional counselling from their
pharmacists. This is a reflective of the expansion of pharmacists’ role in patient care in the
healthcare system in Malaysia. The increase in the number of pharmacists in both public and
private workforce has translated into the provision of more pharmaceutical care services such
as medication management therapy. Malaysian consumers now view pharmacists as an
important player in the healthcare system that is evident from literature (34).
Know your medicines programme
The “Know Your Medicines” programme is a national project jointly organized by the Ministry
of Health (MOH) and the Consumers Association of Malaysia (FOMCA) aiming to improve
quality use of medicines among consumers in the country. Eight years into the programme, up
to half of the consumers participated in this survey were aware of the programme’s existence
and had participated in the programme activities. The findings are similar to what was reported
in NSUM II (23) indicating the continuous advertisement and efforts of the Pharmaceutical
Services Division.
Majority of the respondents who had participated in the programme activities were satisfied
with the programme and felt that it was beneficial for them.
89
6.0 CONCLUSIONS
As a whole, the pattern and practices of medication-related information and medicine usage is
not remarkably different to what was reported in NSUM II. The use of pharmaceuticals is
common among consumers in Malaysia. Majority of consumers felt that medicines labelling is
adequate and did not expressed any difficulty in reading the labels of medicines obtain from
various health facilities in Malaysia. However, the ability of identify medicines by their trade
or generic name is still lacking in Malaysian population. The information seeking behaviour of
consumers in Malaysia has evolved over the years with more consumers consulting the
mainstream healthcare providers such as doctors and pharmacists as well as accessing
information through the use of technologies such as internets. Although generally consumers’
awareness of the national “Know Your Medicines” programme is widespread, participation
uptake is still relatively low. Overall, it can be observed that Malaysian consumers’ medicines
taking and information seeking behaviour has evolved over time as captured by the NSUM II.
This periodic mapping of pharmaceuticals use among consumers in Malaysia is indeed an
important effort to explore issues on quality use of medicines and make plans for future
interventions and policies.
7.0 LIMITATIONS
The evaluation of consumers’ awareness, knowledge and understanding of quality use of
medicines were based on a self-reported assessment and hence actual consumer behaviour
cannot be verified. Public’s out-of-pocket expenditure and medication compliance was an
estimation that was based on consumer recall and hence poses recall bias to the survey findings.

90
REFERENCES
1. Quick JD, Hogerzeil HV, Velásquez G, Rägo L. Twenty-five years of essential
medicines. Bulletin of the World Health Organization. 2002;80(11):913-4.
2. Hogerzeil HV. Promoting rational prescribing: an international perspective. British
Journal of Clinical Pharmacology. 1995;39(1):1-6.
3. World Health Organization. Promoting rational use of medicines: Core components.
2002; Available from: http://archives.who.int/tbs/rational/h3011e.pdf.
4. World Health Organization. The World Medicines Situation 2011-Rational Use of
Medicines. WHO Press. 2011.
5. Pirmohamed M, James S, Meakin S, Green C, Scott AK, Walley TJ, et al. Adverse drug
reactions as cause of admission to hospital: prospective analysis of 18 820 patients. British
Medical Journal. 2004;329(7456):15-9.
6. Lazarou J, Pomeranz BH, Corey PN. Incidence of adverse drug reactions in hospitalized
patients: a meta-analysis of prospective studies. Journal of American Medical Association.
1998;279(15):1200-5.
7. Almarsdóttir AB, Traulsen JM. Rational use of medicines–an important issue in
pharmaceutical policy. Pharmacy World & Science. 2005;27(2):76-80.
8. World Health Organization. How to develop and implement a national drug policy. 2nd
ed. Geneva: World Health Organization; 2001.
9. Del Rio MC, Prada C, Alvarez FJ. The use of medication by the Spanish population.
Pharmacoepidemiology and Drug Safety. 1997;6(1):41-8.
10. Hardon AP. The use of modern pharmaceuticals in a Filipino village: doctors'
prescription and self medication. Social Science & Medicine. 1987;25(3):277-92.
11. Homedes N, Ugalde A. Patients' compliance with medical treatments in the third world.
What do we know? Health Policy and Planning. 1993;8(4):291-314.
91
12. Kirkpatrick CM, Roughead EE, Monteith GR, Tett SE. Consumer involvement in
Quality Use of Medicines (QUM) projects–lessons from Australia. BMC Health Services
Research. 2005;5(1):75.
13. National Prescribing Service. Medication safety in the community: A review of the
literature. 2009; Available from:
www.nps.org.au/data/assets/pdf_file/0008/71675/09060902_Meds_safety_June_2009.pdf.
14. The Royal Australian College of General Practitioners. Quality use of medicines. 2011;
Available from: http://curriculum.racgp.org.au/statements/quality-use-of-medicines/.
15. Bahri. S, Othman NH, Hassali MA, Shafie AA, Izham MIM. A national survey on the
use of medicines (NSUM) by Malaysian consumers. Pharmaceutical Services Division,
Ministry of Health Malaysia: First edition, 2008
16. Pharmaceutical Services Division. National Medicines Policy. Ministry of Health
Malaysia: 2003, pp 1-22.
17. Raosoft Inc. Sample Size Calculator. Available from:
http://www.raosoft.com/samplesize.html.
18. Kish L. Methods for design effects. Journal of Official Statistics. 1995;11(1):55-77.
19. Institute For Public Health (IPH). National Health and Morbidity Survey 2015 (NHMS
2015). Vol I: Methodology and General Findings. 2015.
20. Institute for Public Health (IPH). National Health and Morbidity Survey 2015 (NHMS
2015). Vol. II: Non-Communicable Diseases, Risk Factors & Other Health Problems. 2015.
21. Islam SMS, Purnat TD, Phuong NTA, Mwingira U, Schacht K, Fröschl G. Non-
Communicable Diseases (NCDs) in developing countries: a symposium report. Globalization
and Health. 2014;10(1):1-8.

92
22. Alleyne G, Binagwaho A, Haines A, Jahan S, Nugent R, Rojhani A, et al. Embedding
non-communicable diseases in the post-2015 development agenda. The Lancet.
2013;381(9866):566-74.
23. Pharmaceutical Services Division Ministry of Health Malaysia. A National survey on
the use of medicines (NSUM) by Malaysian consumers. 2012.
24. Verma AK, Hassali MA, Saleem F. Health care financing in Malaysia: A way forward.
Archives of Pharmacy Practice. 2015;6:93-6.
25. Donovan JL, Blake DR. Patient non-compliance: deviance or reasoned decision-
making? Social Science & Medicine. 1992;34(5):507-13.
26. Amod F, Chetty K, Essa A, Hlela L, Maharaj C, Oosthuizen F. A pilot study to
determine public trends in storage and disposal of medicines: PSSA perspectives. SA
Pharmaceutical Journal. 2008;75(7):7-10.
27. Claxton AJ, Cramer J, Pierce C. A systematic review of the associations between dose
regimens and medication compliance. Clinical Therapeutics. 2001;23(8):1296-310.
28. Osterberg L, Blaschke T. Adherence to medication. New England Journal of Medicine.
2005;353(5):487-97.
29. Kohn LT, Corrigan JM, Donaldson MS. To err is human:: building a Safer Health
System: National Academies Press; 2000.
30. Horne R, Weinman J. Patients' beliefs about prescribed medicines and their role in
adherence to treatment in chronic physical illness. Journal of Psychosomatic Research.
1999;47(6):555-67.
31. Sinha I, Batra R. The effect of consumer price consciousness on private label purchase.
International Journal of Research in Marketing. 1999;16(3):237-51.
32. Lyles A. Direct marketing of pharmaceuticals to consumers. Annual Review of Public
Health. 2002;23(1):73-91.

93
33. Chee HL, Barraclough S. Health care in Malaysia: the dynamics of provision, financing
and access: Routledge; 2007.
34. Hassali M, Saleem F, Aljadhey H. Public perceptions towards implementation of
dispensing separation: results from a cross sectional analysis. Pharmaceutical Care & Health
Systems. 2015;2.
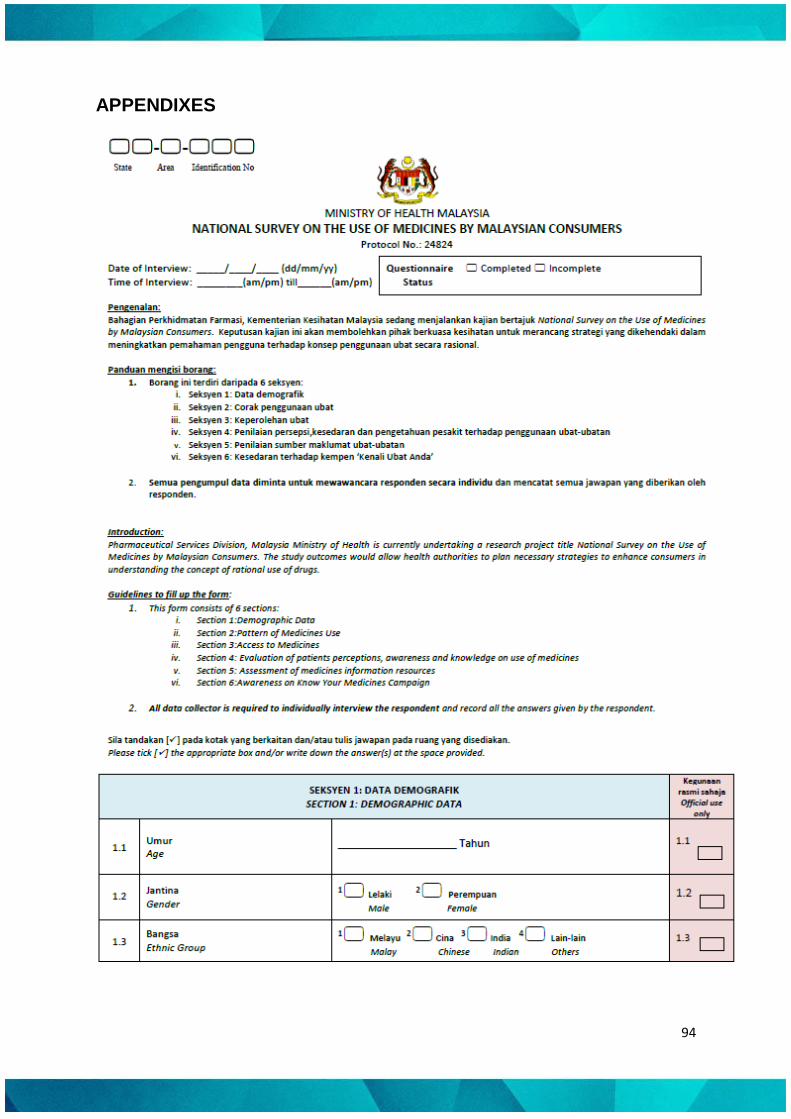
94
APPENDIXES

95

96

97

98

99

100
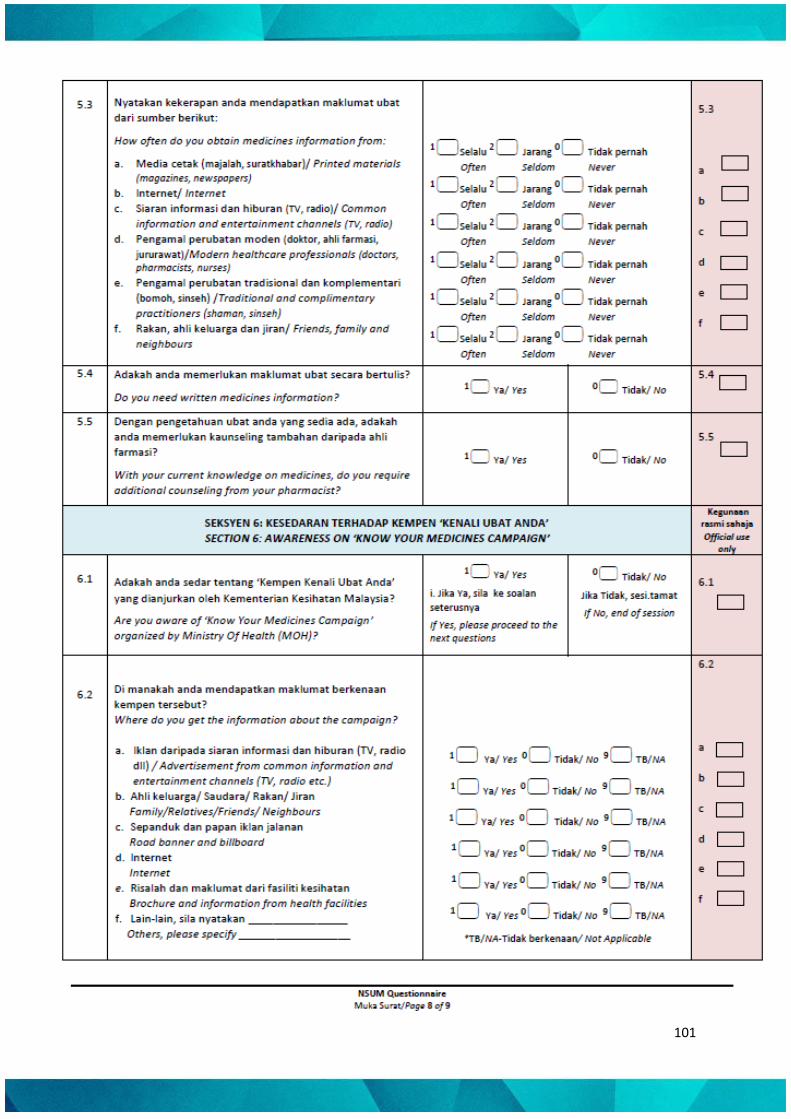
101

102

103