A N N U A L R E P O R T · Partners III, L.P. New York, New York Real Estate Investments Arsenal...
47
City of Philadelphia BOARD OF PENSIONS AND RETIREMENT John F. Street Vincent Jannetti Gwendolyn Bell Mayor Chairperson Executive Director A N N U A L R E P O R T FISCAL YEAR ENDING JUNE 30, 2006
Transcript of A N N U A L R E P O R T · Partners III, L.P. New York, New York Real Estate Investments Arsenal...
City of Philadelphia BOARD OF PENSIONS AND RETIREMENT
John F. Street Vincent Jannetti Gwendolyn Bell Mayor Chairperson Executive Director
A N N U A L R E P O R T
FISCAL YEAR ENDING JUNE 30, 2006
spinks
Stamp
spinks
Stamp

CITY OF PHILADELPHIA
BOARD OF PENSIONS AND RETIREMENT
ANNUAL REPORT
FISCAL YEAR JULY 1, 2005 – JUNE 30, 2006
16TH FLOOR, TWO PENN CENTER PLAZA PHILADELPHIA, PENNSYLVANIA 19102
(215-496-7418)

To the People of the City of Philadelphia:
The Board of Pensions and Retirement hereby submits the Annual
Report of the Retirement System for City of Philadelphia
employees for the fiscal year ending June 30, 2006. The report
consists of three sections: An introductory section which contains
a brief summary of the Fund and identifies the administrators,
investment managers and professional consultants of the
Retirement System, an actuarial section which details the
methods of costing and funding current and future benefits to
members and beneficiaries of the Retirement System, and a
financial section which contains the System’s financial
statements, membership and pension data, and investment
statistics.


TABLE OF CONTENTS
INTRODUCTORY SECTION PAGE The Board, Consultants and Investment Managers 1-6 Mission Statement 7 Membership 7 Funding 8 Income 8-9 Investments 9 Expenses 10 Amendments to Public Employees Retirement Code 10 And Regulations of the Board Professional Services 10 Audit 10 ACTUARIAL SECTION Executive Summary of Findings – July 1, 2006 Mercer Human Resource Consulting 11-18 Cost Derivation 19-21 Minimum Municipal Obligation 22-25 Governmental Accounting Standards Board (GASB) 26-29 FINANCIAL SECTION Statement of Plan Net Assets – June 30, 2006 Exhibit A-1 30 Summary Schedule of Investments – June 30, 2006 Schedule A-1a 31 Statement of Changes in Plan Net Assets Fiscal Years Ended June 30, 2006 and 2005 Exhibit A-2 32 Analysis of Members’ Contributions Fiscal Year Ended June 30, 2006 Exhibit A-3 33-34 Analysis of Fund Balance Fiscal year Ended June 30, 2006 Exhibit A-4 35 Statement of Cash Receipts and Disbursements Fiscal year Ended June 30, 2006 Exhibit A-5 36 Pension Contributions by Division Fiscal Year Ending June 30, 2006 37 STATISTICAL INFORMATION Applications Processed During Period July 2004 Through June 2005 and July 2005 Through June 2006 38 Comparative Statement of Retirement Benefits in Force As of June 30, 2005 and June 30, 2006 39 Analysis of Membership 40 NOTES: If you require more detailed information on the Board’s Investment Portfolio, please write to Gwendolyn Bell, Executive Director, Two Penn Center Plaza – 16th Floor, Philadelphia, PA 19102 or call 215-496-7418 or 1-800-544-1173. For additional copies of this report, write to: Linda Donovan, Pension Program Administrator, or call 215-496-7413 or 1-800-544-1173, or download from www.phila.gov/pensions/.

INTRODUCTORY SECTION CITY OF PHILADELPHIA PUBLIC EMPLOYEES RETIREMENT SYSTEM Gwendolyn Bell Executive Director MEMBERS OF THE BOARD Vincent Jannetti Chairperson, Acting Director of Finance Appointed December 27, 2004. Pedro Ramos, Esquire Managing Director Appointed April 4, 2005. Romulo L. Diaz, Jr., Esquire City Solicitor Appointed April 4, 2005 Linda Orfanelli Personnel Director Appointed January 14, 2002. Alan L. Butkovitz City Controller Elected by voters of Philadelphia.
Serving as Board Member since January 2, 2006.
John A. Reilly Local No. 22, Philadelphia Firefighters
Union. Serving as Employee Elected Representative since November 1976.
William Rubin AFSCME District Council 33. Serving
as Employee Elected Representative since November 2004.
Carol Stukes AFSCME District Council 47. Serving
as Employee Elected Representative since September 29, 1994.
Ronald Stagliano Fraternal Order of Police. Serving as
Employee Elected Representative since November 2004.

CONSULTANTS
ACTUARY
William M. Mercer, Incorporated Washington, D. C.
AUDITOR
City Controller
And Mitchell & Titus, LLP
Philadelphia, Pennsylvania
LEGAL COUNSEL
City Solicitor
GENERAL INVESTMENT CONSULTANT
Fiduciary Investment Solutions, Inc. Philadelphia, Pennsylvania
ALTERNATIVE INVESTMENT CONSULTANTS
CRA RogersCasey Darien, Connecticut
Franklin Park
Bala Cynwid, Pennsylvania
CUSTODIAN BANK
State Street Bank Boston, Massachusetts

INVESTMENT MANAGERS U. S. Equities Ark Asset Management Aronson + Johnson + Ortiz, LLC New York, New York Philadelphia, Pennsylvania Boston Partners Asset Management Chicago Equity Partners Boston, Massachusetts Chicago, Illinois Cooke & Bieler Emerald Advisors Philadelphia, Pennsylvania Lancaster, Pennsylvania Navellier & Associates New York Life Reno, Nevada New York, New York Northern Trust Paradigm Asset Management Chicago, Illinois New York, New York Turner Investment Partners Wellington Management Berwyn, Pennsylvania Company, LLP Boston, Massachusetts Wells Capital Management Minneapolis, Minnesota International Equities Fidelity Investments Mondrian Investment Partners Boston, Massachusetts London, England Northern Trust Philadelphia International Advisors Chicago, Illinois Philadelphia, Pennsylvania Portable Alphas Bridgewater Associates, Inc. First Quadrant Corp. Westport, Connecticut Pasadena, California Global Fixed Income Aberdeen Asset Management Fidelity Investments Philadelphia, Pennsylvania Boston, Massachusetts Northern Trust Western Asset Management Co. Chicago, Illinois Pasadena, California

Relative Return Bond AIG Global Investors Corp. Wilton, Connecticut Convertible Lord Abbett & Company Jersey City, New Jersey Tactical Asset Allocation Mellon Capital Management Corp. San Francisco, California Opportunity Fund Capital Prospects PFM Advisors Stamford, Connecticut Philadelphia, Pennsylvania Hedge Fund Allianz Hedge Fund Partners Arden Asset Management San Francisco, California New York, New York Attalus Multi-Strategy Fund Mesirow Non-Directional Fund Philadelphia, Pennsylvania Chicago, Illinois New Markets Capital Partners Rock Creek Potomac Fund Philadelphia, Pennsylvania Washington, D.C. Cash Management State Street Bank Boston, Massachusetts Alternative Investments Ascend Ventures, L.P. Asian Financial Bank New York, New York Philadelphia, Pennsylvania Bachow Investment Partners, III, L.P. Bay Partners XI, L.P. Bala Cynwyd, Pennsylvania Cupertino, California Behrman Capital III L.P. Blackstone Capital Partners, IV, L.P. New York, New York New York, New York

Columbia Capital Equity Partners European Strategic Partners II & III QP, L.P. I & II, L.P. – Standard Life Alexandria, Virginia of Scotland Edinburgh, Scotland Fairview Capital II & III, L.P. Falcon Mezzanine Partners, L.P. Farmington, Connecticut Needham, Maryland Fenway Partners Capital Fund II, L.P. Green Equity Investors, IV, L.P. New York, New York Los Angeles, California GS Capital, L.P. Keystone Venture IV & V, L.P. Wayne, Pennsylvania Philadelphia, Pennsylvania Kohlberg Investors V, L.P. Thomas H. Lee Equity Fund IV Mt. Kisco, New York & V, L.P. Boston, Massachusetts Lindsay, Goldberg & Bessemer, L.P. Littlejohn Fund III, L.P. New York, New York Greenwich, Connecticut LLR Equity Partners, L.P., I & II Meridian Venture Partners, L.P. Philadelphia, Pennsylvania & MVP Distribution Partners, L.P. Radnor, Pennsylvania Merion Investment Partners, L.P. MGIC Mortgage Marketing Corp. King of Prussia, Pennsylvania Milwaukee, Wisconsin Morgan Stanley Venture Nogales Investors Fund I, L.P. Partners IV & 2002, L.P. Los Angeles, California New York, New York OCM Opportunities Fund III & IV, L.P. PA Early Stage Partners, III, L.P. Los Angeles, California Wayne, Pennsylvania Pharos Capital Partners II, L.P. Platinum Equity Capital Partners, L.P. Houston, Texas Beverly Hills, California Quaker BioVentures, L.P. SCP Private Equity Partners, I & II, L.P. Philadelphia, Pennsylvania Wayne, Pennsylvania State of Israel Jubilee ISS Sterling Capital Partners II, L.P. Israel Bonds Northbrook Illinois TCW/Crescent Mezzanine TGP Partners II & III, L.P. Partners II & III, L.P. Fort Worth, Texas Los Angeles, California

Technology Leaders I, II & V, L.P. The Retail Initiative Wayne, Pennsylvania New York, New York Thomas Weisel Capital United Bank of Philadelphia Partners, LP Philadelphia, Pennsylvania San Francisco, California Veritas Capital Partners III, L.P. Wellspring Capital Partners IV, L.P. New York, New York New York, New York Wicks Communications & Media Partners III, L.P. New York, New York Real Estate Investments Arsenal Real Estate Fund Beacon Capital Morristown, New Jersey Boston, Massachusetts CIGNA Realty Corp. Heitman Capital Management Corp. Hartford, Connecticut Chicago, Illinois
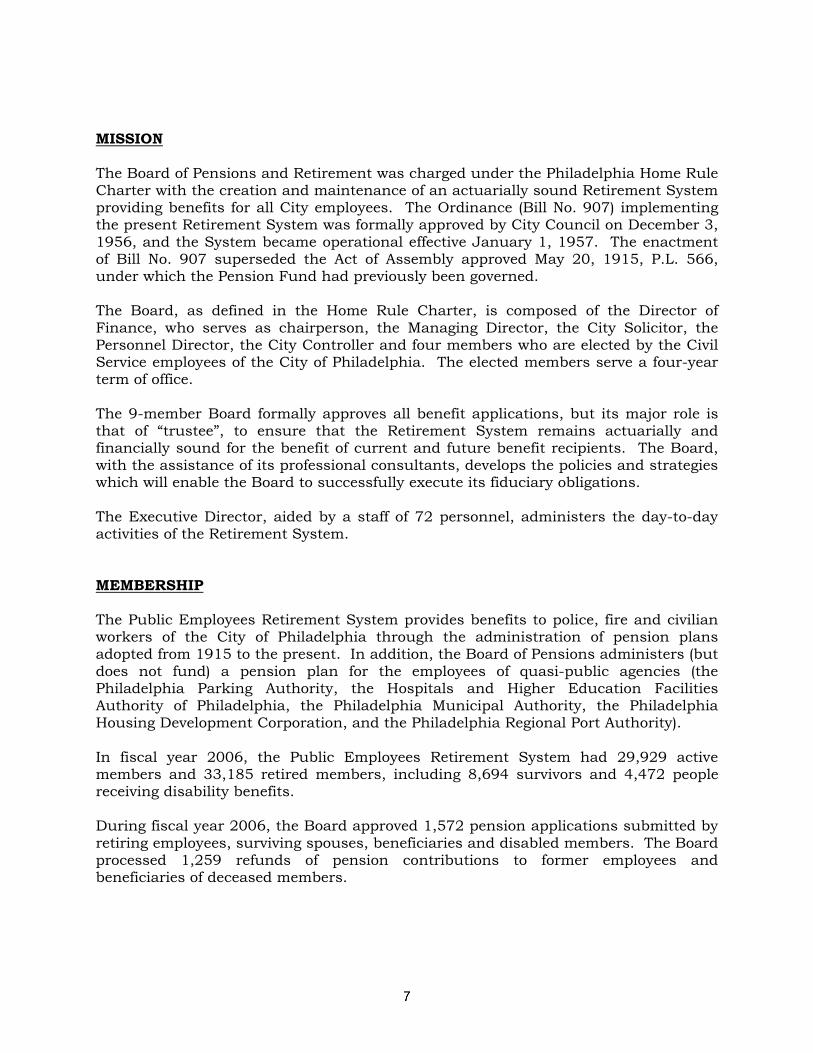
MISSION The Board of Pensions and Retirement was charged under the Philadelphia Home Rule Charter with the creation and maintenance of an actuarially sound Retirement System providing benefits for all City employees. The Ordinance (Bill No. 907) implementing the present Retirement System was formally approved by City Council on December 3, 1956, and the System became operational effective January 1, 1957. The enactment of Bill No. 907 superseded the Act of Assembly approved May 20, 1915, P.L. 566, under which the Pension Fund had previously been governed. The Board, as defined in the Home Rule Charter, is composed of the Director of Finance, who serves as chairperson, the Managing Director, the City Solicitor, the Personnel Director, the City Controller and four members who are elected by the Civil Service employees of the City of Philadelphia. The elected members serve a four-year term of office. The 9-member Board formally approves all benefit applications, but its major role is that of “trustee”, to ensure that the Retirement System remains actuarially and financially sound for the benefit of current and future benefit recipients. The Board, with the assistance of its professional consultants, develops the policies and strategies which will enable the Board to successfully execute its fiduciary obligations. The Executive Director, aided by a staff of 72 personnel, administers the day-to-day activities of the Retirement System. MEMBERSHIP The Public Employees Retirement System provides benefits to police, fire and civilian workers of the City of Philadelphia through the administration of pension plans adopted from 1915 to the present. In addition, the Board of Pensions administers (but does not fund) a pension plan for the employees of quasi-public agencies (the Philadelphia Parking Authority, the Hospitals and Higher Education Facilities Authority of Philadelphia, the Philadelphia Municipal Authority, the Philadelphia Housing Development Corporation, and the Philadelphia Regional Port Authority). In fiscal year 2006, the Public Employees Retirement System had 29,929 active members and 33,185 retired members, including 8,694 survivors and 4,472 people receiving disability benefits. During fiscal year 2006, the Board approved 1,572 pension applications submitted by retiring employees, surviving spouses, beneficiaries and disabled members. The Board processed 1,259 refunds of pension contributions to former employees and beneficiaries of deceased members.

FUNDING The Municipal Pension Plan Funding Standard and Recovery Act of December 1984 (Act 205) mandated funding methods for all municipal pension plans in the Commonwealth of Pennsylvania. Under the provisions of Act 205, the Municipal Retirement System is required to fund the actuarial liability accrued after July 1, 1985 on a level dollar payment method. In effect, the cost of current pension obligations must be satisfied annually. The unfunded actuarial liability which had accrued prior to July 1, 1985 is being amortized over a 40-year period with payments increasing at the rate of 6% per year. This debt portion will be satisfied on June 30, 2019. A class action suit, Dombrowski v. City of Philadelphia, was instituted against the City of Philadelphia asserting that the funding level was insufficient to maintain an actuarially sound system as required by the City Charter. The Philadelphia Court of Common Pleas ordered that the judgment in the Dombrowski case was to be amortized in level dollar payments over 40 years, ending June 30, 2009. Act 205 requires that an actuarial valuation be performed annually and that an experience study, covering a 5-year period, be conducted every 4 years to insure that the pension costs derived by the actuary are accurate and based on valid historical experience. In January 1999, the City issued $1.29 billion of 30-year pension obligation bonds having an overall rate of 6.61% with a goal of reducing the City’s unfunded pension obligation liability. The normal cost to the Public Employees Retirement System for fiscal year 2006 was $75,778,821. The total unfunded accrued liability for fiscal year 2006 was $337,079,230, including $2,024,000 for the Dombrowski annual payment. Under the City’s funding policy, the recommended contribution for the City for the current year amounted to $384,530,843. The City’s actual contribution was $321,346,416. The City’s contribution did meet the Minimum Municipal Obligation (MMO) as required by the Commonwealth of Pennsylvania’s Acts 205 and 189. INCOME The City of Philadelphia is the largest single contributor to the Public Employees Retirement System. The City contributed $321,346,416 or 38.5% of the total additions to the Retirement System’s net assets in fiscal year 2006. Employees contribute a percentage of their pay, and the percentage varies with plan membership. Employee contributions totalled $48,910,052 or 5.9% of additions. Contributions from the quasi-public agencies amounted to $10,419,031 or 1.2% of additions.

A major source of income is the earnings of the System’s investment portfolio. Interest and dividends amounted to $65,100,546 or 7.8% of total additions, while securities lending revenue increased plan net assets by $12,040,928 or 1.4% of additions. Normal investing activity contributed $403,143,791 in capital gains or 48.3% of the additions. Miscellaneous sources provided $2,157,351 or .3% towards the additions. Together the contributions and earnings added $863,118,115 to the plan net assets. Investment expenses of $16,780,609 and securities lending expenses of $11,343,244 resulted in a decrease to the plan net assets of $28,123,853 or 3.4%. After investment expenses, the plan net assets increased by $834,994,263 in fiscal year 2006. INVESTMENTS The 9-member Board of Pensions and Retirement plays an active role in the determination of investment policy and strategy. All major decisions with regard to the portfolio are approved by the Board based upon the recommendations of its investment consultant and managers and the Board’s in-house investment staff. Fiduciary Investment Solutions, Inc., the Board’s Investment Consultant, oversees the management of the portfolio by investment management firms (a listing of these firms is presented on Pages 2-6). The investment policy developed by the Board provides the framework for the investment of funds. However, the manner in which the Board invests its funds is constrained by legal statutes. Investments of the Public Employees Retirement System must be made in compliance with Section 22-1001 of the Public Employees Retirement Code and the regulations for the investment of similar State funds as set forth in the Act of March 1, 1974 (P.L. 125, No. 31), as amended (71 Pa. C.S. Section 5931). As part of its overall investment policy, the Board approved an asset allocation strategy which has as its goal the identification of the mix of broad asset classes that most efficiently balances the need for achieving an 8.75% rate of return with the desire to minimize the possibility of capital loss. This strategy is periodically reviewed by the Board for possible fine-tuning to ensure that it remains dynamic and reflective of market conditions. The current portfolio structure is: 36.25% Domestic Equities; 14.77% International Equities; 17.13% Global Fixed Income; 4.41% Global TIPS; 3.02% Relative Return Bond; 1.23% Convertible Bond; 5.15% Tactical Asset Allocation (TAA) Balanced Portfolio of Stocks and Bond (Target of 60/40); 5.29% Opportunity Fund; 4.29% Hedge Fund – Non Directional; 1.31% Hedge Fund – Directional; 6.86% Alternative Investments; 0.08% Real Estate; and 0.19% Cash. As of the fiscal year ending June 30, 2006, the total market value of Pension Fund investments was $4,349,089,071 (an 8.1% increase over fiscal year 2005) vs. the value at cost of $3,930,455,315 (a 10.8% increase over fiscal year 2005). Accounting principles require the recognition of the assets at fair value and the resultant unrealized gain or loss shown as an addition or deduction to plan net assets.

EXPENSES Pension benefit payments are the Board’s greatest current normal expense. Of the total deduction of $620,196,026 from plan net assets in fiscal 2006, $608,682,198 or 98.1% were pension payments. Other expenses included $4,791,109 for the refund of members’ contributions and $6,722,719 for administrative expenses. AMENDMENTS TO CITY OF PHILADELHPIA PUBLIC EMPLOYEES RETIREMENT CODE Section 22-105 – Definitions – Bill No. 051066 (Enacted by City Council May 25, 2006) Section 22-105(9)(b) was amended to provide that court reporter fees may be included in the calculation of compensation. The burden of proving the amount of the fees is on the employee and subject to requirements provided for in a Regulation of the Board of Pensions and Retirement. Section 22-105 – Definitions – Bill No. 060265 (Enacted by City Council May 25, 2006) Section 22-105(9)(a)(.4) was amended to provide that effective July 1, 2003 the definition of compensation for pension calculation purposes for members of Police Plans B and D shall include 4% stress pay. Section 22-105(9)(a)(.5) was amended to provide that effective July 1, 2003 the definition of compensation for pension calculation purposes for members of Fire Plans A and X shall include a maximum 4% of premium pay. PROFESSIONAL SERVICES Professional consultants are retained by the Board of Pensions and Retirement to provide expertise and support necessary for the administration of the Public Employees Retirement System. A list of those firms rendering professional services to the Board is presented on Pages 2-6. AUDIT The City Controller’s Office, which is independent of the City of Philadelphia Administration, audits all operational transactions of the Board of Pensions and Retirement. For the Fiscal year ending June 30, 2006, the Board elected to have the annual financial audit of the Municipal Pension Fund performed by the accounting firm of Mitchell & Titus, LLP.
spinks
Line


CO
ST D
ERIV
ATI
ON
Mer
cer H
uman
Res
ourc
es C
onsu
lting
C
ity o
f Phi
lade
lphi
a
Mun
icip
al R
etire
men
t Sys
tem
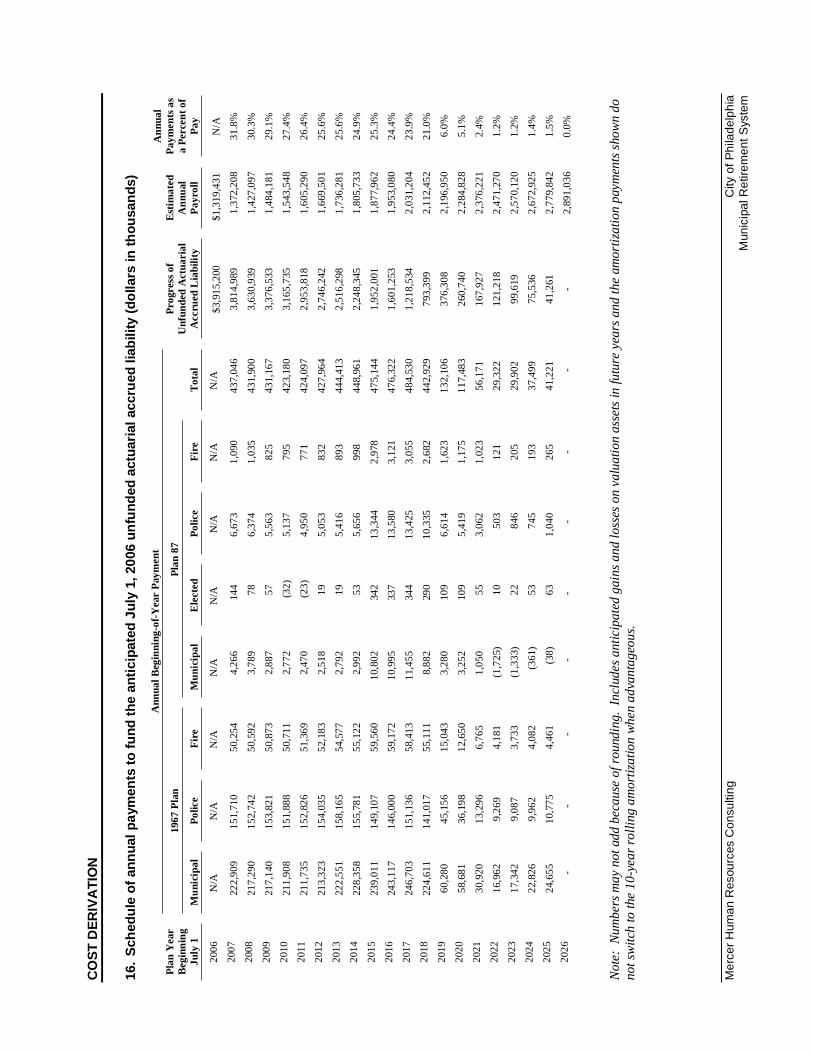
16. S
ched
ule
of a
nnua
l pay
men
ts to
fund
the
antic
ipat
ed J
uly
1, 2
006
unfu
nded
act
uaria
l acc
rued
liab
ility
(dol
lars
in th
ousa
nds)
Ann
ual B
egin
ning
-of-
Yea
r Pa
ymen
t
1967
Pla
n Pl
an 8
7 Pl
an Y
ear
Beg
inni
ngJu
ly 1
M
unic
ipal
Polic
eFi
reM
unic
ipal
Ele
cted
Polic
eFi
reT
otal
Prog
ress
of
Unf
unde
d A
ctua
rial
A
ccru
ed L
iabi
lity
Est
imat
ed
Ann
ual
Payr
oll
Ann
ual
Paym
ents
as
a Pe
rcen
t of
Pay
2006
N
/A
N/A
N
/A
N/A
N
/A
N/A
N
/A
N/A
$3
,915
,200
$
1,31
9,43
1
N/A
20
07
22
2,90
9
1
51,7
10
50,2
54
4,2
66
14
4
6,67
3
1,09
0
43
7,04
6
3,81
4,98
9
1,3
72,2
08
31.8
%
2008
217,
290
152
,742
50
,592
3
,789
78
6,
374
1,
035
431,
900
3,
630,
939
1
,427
,097
30
.3%
20
09
21
7,14
0
1
53,8
21
50,8
73
2,8
87
5
7
5,56
3
825
431,
167
3,
376,
533
1
,484
,181
29
.1%
20
10
21
1,90
8
1
51,8
88
50,7
11
2,7
72
(3
2)
5,13
7
795
423,
180
3,
165,
735
1
,543
,548
27
.4%
20
11
21
1,73
5
1
52,8
26
51,3
69
2,4
70
(2
3)
4,95
0
771
424,
097
2,
953,
818
1
,605
,290
26
.4%
20
12
21
3,32
3
1
54,0
35
52,1
83
2,5
18
1
9
5,05
3
832
427,
964
2,
746,
242
1
,669
,501
25
.6%
20
13
22
2,55
1
1
58,1
65
54,5
77
2,7
92
1
9
5,41
6
893
444,
413
2,
516,
298
1
,736
,281
25
.6%
20
14
22
8,35
8
1
55,7
81
55,1
22
2,9
92
5
3
5,65
6
998
448,
961
2,
248,
345
1
,805
,733
24
.9%
20
15
23
9,01
1
1
49,1
07
59,5
60
10,8
02
34
2
1
3,34
4
2,97
8
47
5,14
4
1,95
2,00
1
1,8
77,9
62
25.3
%
2016
243,
117
146
,000
59
,172
10
,995
337
13,
580
3,
121
476,
322
1,
601,
253
1
,953
,080
24
.4%
20
17
24
6,70
3
1
51,1
36
58,4
13
11,4
55
34
4
1
3,42
5
3,05
5
48
4,53
0
1,21
8,53
4
2,0
31,2
04
23.9
%
2018
224,
611
141
,017
55
,111
8
,882
290
10,
335
2,
682
442,
929
79
3,39
9
2,1
12,4
52
21.0
%
2019
60,
280
45
,156
15
,043
3
,280
109
6,
614
1,
623
132,
106
37
6,30
8
2,1
96,9
50
6.0%
20
20
5
8,68
1
36,1
98
12,6
50
3,2
52
10
9
5,41
9
1,17
5
11
7,48
3
260,
740
2
,284
,828
5.
1%
2021
30,
920
13
,296
6
,765
1
,050
55
3,
062
1,
023
56,
171
16
7,92
7
2,3
76,2
21
2.4%
20
22
1
6,96
2
9,2
69
4,1
81
(1,7
25)
1
0
50
3
121
29,
322
12
1,21
8
2,4
71,2
70
1.2%
20
23
1
7,34
2
9,0
87
3,7
33
(1,3
33)
2
2
84
6
205
29,
902
99
,619
2,5
70,1
20
1.2%
20
24
2
2,82
6
9,9
62
4,0
82
(3
61)
5
3
74
5
193
37,
499
75
,536
2,6
72,9
25
1.4%
20
25
2
4,65
5
10,7
75
4,4
61
(38)
63
1,
040
26
5
4
1,22
1
41,2
61
2
,779
,842
1.
5%
2026
-
-
-
-
-
-
-
-
-
2
,891
,036
0.
0%
Not
e: N
umbe
rs m
ay n
ot a
dd b
ecau
se o
f rou
ndin
g.In
clud
es a
ntic
ipat
ed g
ains
and
loss
es o
n va
luat
ion
asse
ts in
futu
re y
ears
and
the
amor
tizat
ion
paym
ents
show
n do
no
t sw
itch
to th
e 10
-yea
r rol
ling
amor
tizat
ion
when
adv
anta
geou
s.


MIN
IMU
M M
UN
ICIP
AL
OB
LIG
ATI
ON
Mer
cer H
uman
Res
ourc
e C
onsu
lting
C
ity o
f Phi
lade
lphi
a
Mun
icip
al R
etire
men
t Sys
tem
46. U
nfun
ded
liabi
lity
paym
ents
tow
ard
MM
O fo
r fis
cal 2
008
(thou
sand
s) —
Jul
y 1,
200
6 va
luat
ion
repo
rt
M
unic
ipal
Polic
e
Fire
Ju
ly 1
, 200
6 R
emai
ning
B
alan
ceY
ears
Rem
aini
ng
Am
ortiz
atio
n Pa
ymen
t
July
1, 2
006
Rem
aini
ng
Bal
ance
Yea
rsR
emai
ning
A
mor
tizat
ion
Paym
ent
July
1, 2
006
Rem
aini
ng
Bal
ance
Yea
rsR
emai
ning
A
mor
tizat
ion
Paym
ent
Ori
gina
l Jul
y 1,
198
5 un
fund
ed
actu
aria
l acc
rued
liab
ility
$
93
5,86
6
19
$
71,4
67a
$
600,
779
19
$ 45
,878
a $
23
9,58
0
19
$
18,2
95a
Dom
brow
ski
$
1,87
8
2 $
97
8
$
1,20
1
2
$ 62
6
$
478
2
$
249
July
1, 1
986
addi
tiona
l am
ount
s
A
ctiv
e pl
an c
hang
e $
23
5
1 $
23
5
$
20
1
$
20
$
10
1 $
10
Ju
ly 1
, 199
2 ad
ditio
nal a
mou
nts
Act
ive
plan
cha
nge
$
130
2
$
68
$
0
$ 0
$
0
$
0
July
1, 1
993
addi
tiona
l am
ount
s
A
ctiv
e pl
an c
hang
e $
(5
05)
4
$
(143
)
$
(336
)
4
$ (9
5)
$
0
$
0
A
ssum
ptio
n ch
ange
(4,9
72)
4
(1
,404
)
40
4
11
(9
26)
4
(2
61)
Subt
otal
b $
(5
,477
)
$
(1,5
46)
$
(2
96)
$ (8
4)
$
(9
26)
$
(2
61)
July
1, 1
994
addi
tiona
l am
ount
s
(G
ain)
/loss
$
(1
,272
)
1 $
(1
,272
)
$
(195
)
1
$ (1
95)
$
(7
54)
1
$
(754
)
Ju
ly 1
, 199
5 ad
ditio
nal a
mou
nts
Act
ive
plan
cha
nge
$
311
9
$
47
$
0
$
0
$
0
$
0
(G
ain)
/loss
3,29
3
4
930
221
4
62
(1,4
29)
4
(4
03)
Subt
otal
b $
3,
604
$
97
7
$
221
$ 62
$
(1,4
29)
$
(4
03)
July
1, 1
996
addi
tiona
l am
ount
s
(G
ain)
/loss
$
2,
741
5
$
644
$
1,
345
5
$
316
$
(1
,169
)
5 $
(2
75)
July
1, 1
997
addi
tiona
l am
ount
s
A
ssum
ptio
n ch
ange
$
36
,584
11
$
4,88
5
$
4,47
7
11
$
598
$
1,
886
11
$
25
2
(Gai
n)/lo
ss
(3
2,87
6)
6
(6
,689
)
(1
2,61
8)
6
(2,5
67)
(8,4
35)
6
(1
,716
)
Su
btot
alb
$
3,70
9
$
(1,8
04)
$
(8
,141
)
$
(1,9
69)
$
(6
,549
)
$
(1,4
64)
July
1, 1
998
addi
tiona
l am
ount
s
(G
ain)
/loss
$
(1
0,44
6)
7
$
(1,8
93)
$
(8
,527
)
7
$ (1
,545
)
$
(7,6
65)
7
$
(1,3
89)

MIN
IMU
M M
UN
ICIP
AL
OB
LIG
ATI
ON
Mer
cer H
uman
Res
ourc
e C
onsu
lting
C
ity o
f Phi
lade
lphi
a
Mun
icip
al R
etire
men
t Sys
tem
M
unic
ipal
Polic
e
Fire
Ju
ly 1
, 200
6 R
emai
ning
B
alan
ceY
ears
Rem
aini
ng
Am
ortiz
atio
n Pa
ymen
t
July
1, 2
006
Rem
aini
ng
Bal
ance
Yea
rsR
emai
ning
A
mor
tizat
ion
Paym
ent
July
1, 2
006
Rem
aini
ng
Bal
ance
Yea
rsR
emai
ning
A
mor
tizat
ion
Paym
ent
July
1, 1
999
addi
tiona
l am
ount
s
(Gai
n)/lo
ss
$
(93,
959)
8 $
(1
5,46
5)
$
69
1
8
$ 11
4
$
(34,
107)
8 $
(5
,614
)
Act
ive
plan
cha
nge
12
,322
13
1,
493
0
0
0
0
Non
activ
e pl
an c
hang
e
17,2
35
13
6,23
3
7,67
1
3
2,
774
2,
848
3
1,
030
Subt
otal
b $
(6
4,40
1)
3
$
(7,7
39)
$
8,
362
$
2,88
8
$
(31,
260)
$
(4
,584
)
July
1, 2
000
addi
tiona
l am
ount
s
(Gai
n)/lo
ss
$
(19,
924)
9 $
(3
,025
)
$
27,7
13
9
$
4,20
8
$
567
9
$
86
July
1, 2
001
addi
tiona
l am
ount
s
Ass
umpt
ion
chan
ge
$
(3,6
38)
15
$
(4
09)
$
(2
,075
)
15
$
(233
)
$
(4,7
19)
15
$
(5
30)
(G
ain)
/loss
(15,
567)
10
(2
,206
)
(18,
641)
10
(2,6
42)
9,
314
10
1,32
0
Su
btot
alb
$
(19,
205)
$
(2,6
15)
$
(2
0,71
6)
$ (2
,875
)
$
4,59
5
$
790
July
1, 2
002
addi
tiona
l am
ount
s
A
ssum
ptio
n ch
ange
$
14
,380
16
$
1,56
6
$
9,53
5
16
$
1,03
9
$
7,50
6
16
$
818
C
alen
dar y
ear 2
001
inve
stm
ent
lo
ssc
19
,491
27
1,
750
10,3
91
27
93
3
4,
429
27
398
O
ther
(Gai
n)/lo
ss
12
8,52
1
11
17
,162
85
,432
11
11,4
08
23,8
96
11
3,19
1
Su
btot
alb
$
162,
392
$
20
,478
$
105,
359
$ 13
,379
$
35,8
31
$
4,
406
July
1, 2
003
addi
tiona
l am
ount
s
Cal
enda
r yea
r 200
2 in
vest
men
t
loss
c $
33
3,08
3
27
$
29,9
06
$
17
5,76
6
27
$
15,7
81
$
75
,558
27
$
6,78
4
Oth
er (G
ain)
/loss
71,6
33
12
9,08
3
10
,245
12
1,29
9
7,
622
12
966
A
ctiv
e pl
an c
hang
e
0
17
0
22,0
80
17
2,
338
8,83
0
17
93
5
Non
activ
e pl
an c
hang
e
0
7
0
27,4
64
7
4,97
6
8,21
1
7
1,48
8
Su
btot
alb
$
404,
717
$
38
,989
$
235,
554
$ 24
,394
$
100,
221
$
10
,173
July
1, 2
004
addi
tiona
l am
ount
s
(Gai
n)/lo
ss
$
136,
224
13
$
16
,508
$
82,2
91
13
$ 9,
972
$
24
,200
13
$
2,93
3
July
1, 2
005
addi
tiona
l am
ount
s
(Gai
n)/lo
ss
$
217,
995
14
$
25
,384
$
92,9
63
14
$ 10
,825
$
39,7
81
14
$
4,
632
A
ssum
ptio
n ch
ange
237,
109
19
23,9
42
114,
732
19
11
,585
46
,062
19
4,
651
Pl
an c
hang
e
2,07
9
19
21
0
262
19
26
0
0
Subt
otal
b $
45
7,18
3
$
49,5
36
$
20
7,95
7
$
22,4
36
$
85
,843
$
9,28
3
Tot
alb
$1,
987,
953
$
179,
987
$ $
1,23
2,92
8
$ 11
7,51
4 $
441,
574
$
37
,095
a.Le
vel d
olla
r am
ortiz
atio
n pa
ymen
t (19
yea
rs re
mai
ning
). M
unic
ipal
— $
40,9
46
Polic
e —
$27
,474
Fi
re —
$10
,482
. b.
Num
bers
may
not
add
bec
ause
of r
ound
ing.
c.
The
amen
dmen
t to
Act
205
in Ju
ly 2
004
allo
ws f
or a
30-
year
am
ortiz
atio
n of
the
porti
on o
f the
July
1, 2
003
unfu
nded
liab
ility
aff
ecte
d by
the
2001
and
200
2 ca
lend
ar y
ear i
nves
tmen
t ret
urns
.


GO
VER
NM
ENTA
L A
CC
OU
NTI
NG
STA
ND
AR
DS
BO
AR
D (G
ASB
)
Mer
cer H
uman
Res
ourc
e C
onsu
lting
City
of P
hila
delp
hia
Mun
icip
al R
etire
men
t Sys
tem
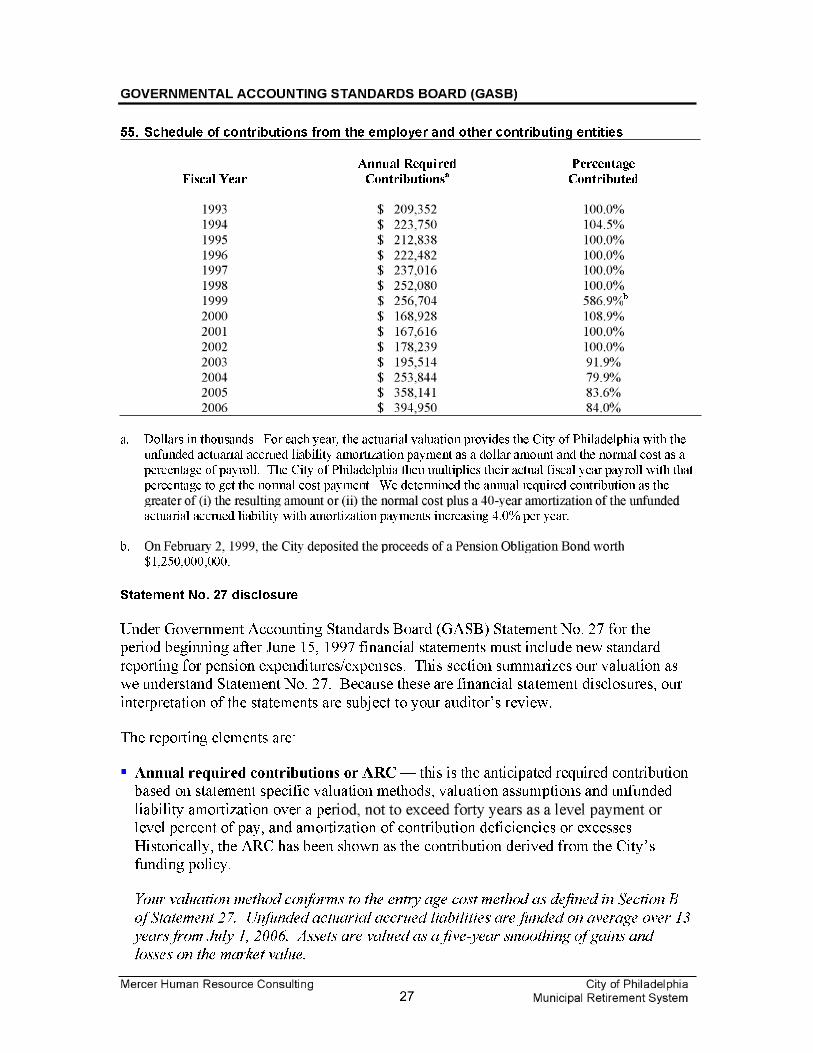
56. C
alcu
latio
n of
ann
ual p
ensi
on c
ost (
dolla
rs in
thou
sand
s)
19
94
1995
19
96
1997
19
98
1999
20
00
2001
20
02
2003
20
04
2005
20
06
AR
C $
223,
750
$ 21
2,83
8 $
222,
482
$ 23
7,01
6 $
252,
080
$ 25
6,70
4 $
168,
928
$ 16
7,61
6 $
178,
239
$ 19
5,51
4 $
253,
844
$ 35
8,14
1 $
394,
950
Inte
rest
on
NPO
—
(9
00)
(8
69)
(8
40)
(8
11)
(7
83)
(1
13,2
57)
(1
10,7
48)
(1
06,9
75)
(1
03,3
30)
(9
8,39
2)
(9
0,44
8)
(8
2,06
8)A
djus
tmen
t to
AR
C
—
1,
241
1,
198
1,
158
1,
118
1,
080
15
6,13
0
152,
672
14
7,47
0
142,
446
13
5,63
8
124,
687
11
3,13
5
Ann
ual p
ensi
on
cost
$ 22
3,75
0 $
213,
179
$ 22
2,81
1 $
237,
334
$ 25
2,38
7 $
257,
001
$ 21
1,80
1 $
209,
540
$ 21
8,73
4 $
234,
630
$ 29
1,09
0 $
392,
380
$ 42
6,01
7 C
ontri
butio
ns
mad
e
233,
750
21
2,83
8
222,
482
23
7,01
6
252,
080
1,
506,
704
18
3,92
8
167,
616
17
8,23
9
179,
757
20
2,82
7
299,
266
33
1,76
5
Incr
ease
in
NPO
(10,
000)
341
32
9
318
30
7
(1,2
49,7
03)
27
,873
41,9
24
40
,495
54,8
73
88
,263
93,1
14
94
,252
N
PO a
t be
ginn
ing
of y
ear
—
(10,
000)
(9,6
59)
(9
,330
)
(9,0
12)
(8
,705
)
(1,2
58,4
08)
(1
,230
,535
)
(1,1
88,6
11)
(1
,148
,116
)
(1,0
93,2
43)
(1
,004
,980
)
(911
,866
)
NPO
at e
nd o
f ye
ar
(1
0,00
0)
(9
,659
)
(9,3
30)
(9
,012
)a
(8,7
05)
(1
,258
,408
)
(1,2
30,5
35)
(1
,188
,611
)
(1,1
48,1
16)
(1
,093
,243
)
(1,0
04,9
80)
(9
11,8
66)
(8
17,6
14)
Inte
rest
rate
9.
00%
9.
00%
9.
00%
9.
00%
9.
00%
9.
00%
9.
00%
9.
00%
9.
00%
9.
00%
9.
00%
9.
00%
9.
00%
15-y
ear
amor
tizat
ion
fact
or (E
OY
) 8.
06
8.06
8.
06
8.06
8.
06
8.06
8.
06
8.06
8.
06
8.06
8.
06
8.06
8.
06
a.$(
9,01
2,00
0) is
the
NPO
at t
rans
ition
dat
e.

EXHIBIT A-1CITY OF PHILADELPHIA
MUNICIPAL PENSION FUNDSTATEMENT OF PLAN NET ASSETS
JUNE 30, 2006
ASSETS
Cash on Deposit and on Hand $ 21,931,505Investments at Fair Value 4,349,089,071Securities Lending 404,307,762Accounts Receivable 4,077,069Due from Brokers 29,625,495Interest and Dividends Receivable 7,377,285Due from Other Governmental Units 3,513,290
Total Assets $ 4,819,921,477
LIABILITIES
Vouchers Payable $ 30,238Accounts Payable 4,290,750Salaries and Wages Payable 109,716Due on Securities Lending 404,307,762Due to Brokers 90,676,821Accrued Expenses 1,165,356Deferred Revenue 2,227,796Other Liabilities 526,792
Total Liabilities 503,335,230
Net Assets Held in Trust for Pension Benefits $ 4,316,586,247
spinks
Underline
spinks
Line
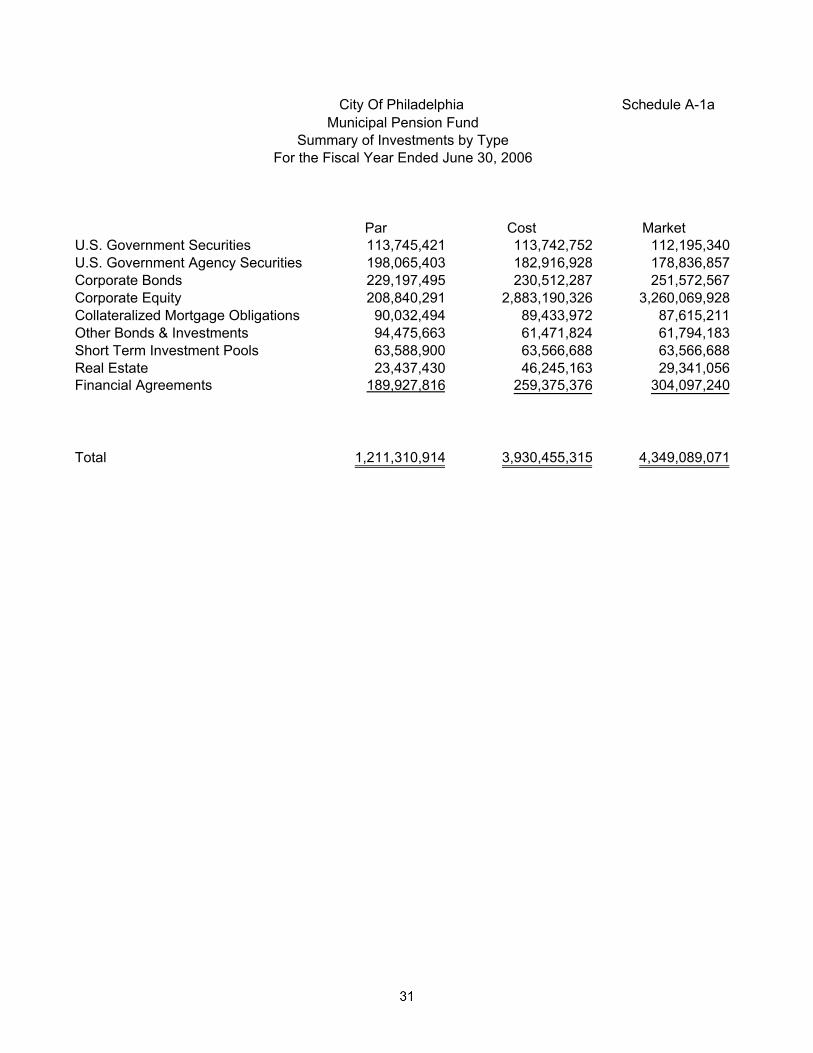
Municipal Pension FundSummary of Investments by Type
For the Fiscal Year Ended June 30, 2006
Par Cost MarketU.S. Government Securities 113,745,421 113,742,752 112,195,340U.S. Government Agency Securities 198,065,403 182,916,928 178,836,857Corporate Bonds 229,197,495 230,512,287 251,572,567Corporate Equity 208,840,291 2,883,190,326 3,260,069,928Collateralized Mortgage Obligations 90,032,494 89,433,972 87,615,211Other Bonds & Investments 94,475,663 61,471,824 61,794,183Short Term Investment Pools 63,588,900 63,566,688 63,566,688Real Estate 23,437,430 46,245,163 29,341,056Financial Agreements 189,927,816 259,375,376 304,097,240
Total 1,211,310,914 3,930,455,315 4,349,089,071
City Of Philadelphia Schedule A-1a

EXHIBIT A-2CITY OF PHILADELPHIA
MUNICIPAL PENSION FUNDSTATEMENT OF CHANGES IN PLAN NET ASSETS
FOR THE FISCAL YEARS ENDED JUNE 30, 2006 AND 2005
June 30, 2006 June 30, 2005
Additions:Contributions:
Employer's Contributions $ 331,765,447 $ 299,239,221Employees' Contributions 48,910,052 49,328,140
Total Contributions 380,675,500 348,567,361
Investment Income:Interest and Dividends 65,100,546 74,571,116Gain (Loss) from Sale of Investments 403,143,791 321,234,088(Less) Investment Expenses (16,780,609) (15,012,132)Securities Lending Revenue 12,040,928 8,499,493(Less) Securities Lending Expenses (11,343,244) (7,564,803)
Net Investment Income 452,161,412 381,727,762
Miscellaneous Operating Revenues 2,157,351 358,422
Total Additions 834,994,263 730,653,545
Deductions:Personal Services 3,383,531 3,320,747Purchase of Services 1,055,663 1,644,744Materials and Supplies 101,766 101,580Employee Benefits 2,034,523 1,507,331Pension Benefits 608,682,198 590,653,605Refunds of Members' Contributions 4,791,109 4,641,536Other Operating Expenses 147,236 202,673
Total Deductions 620,196,026 602,072,216
Net Increase 214,798,237 128,581,329
Net Assets Held in Trust for Pension Benefits - July 1, 2005 4,101,788,010 3,973,206,681
Net Assets Held in Trust for Pension Benefits - June 30, 2006 $ 4,316,586,247 $ 4,101,788,010

CITY OF PHILADELPHIAMUNICIPAL PENSION FUND
ANALYSIS OF MEMBER'S CONTRIBUTIONFOR THE FISCAL YEAR ENDED JUNE 30, 2006
Municipal Division -
Old
Municipal Division -
New
Fire Division -
New
Police Division -
New
Balance July 1, 2005 203,351$ 327,313$ 59,410,621$ 106,234,197$
Additions:Regular Payroll Deductions - 3,308 2,036,048 5,042,919Installment Repurchase Deductions - - 46,484 58,482Payments Through City Treasurer - - 196,728 156,601Retirees' Pension Payments - - 26,575 8,512 Net Change in Liability for Deceased Pensioners - - - (40,830) Net Change in Liability for Pensioners' UnexpectedContribution - - (587,776) 138,854 Adjustments to Members' Contribution Accounts - - - - Unclaimed Withdrawal Checks Deposited - - - -
Total Additions - 3,308 1,718,059 5,364,537
DeductionsWithdrawals - - 52,190 154,862 Retirements - - 4,701,524 8,802,090 Adjustments to Members' Contribution Accounts - - - -
Total Deductions - - 4,753,714 8,956,952
Net Change in Year - 3,308 (3,035,655) (3,592,415)
Balance, June 30, 2006 203,351$ 330,621$ 56,374,966$ 102,641,782$

EXHIBIT A-3
Elected Officials
Municipal Revised Plan 60
Municipal Revised Plan 87
Municipal Revised Plan 93
Fire Division
Old
Police Division
Old Total
2,203,962$ 268,689,667$ 7,186,054$ 59,096,655$ 22,641,328$ 90,870,543$ 616,863,691$
171,789 11,918,691 7,844 10,085,058 3,322,410 12,716,310 45,304,3754,735 135,003 - 432,773 153,356 159,085 989,917
6,443 967,162 36,790 902,903 219,890 50,383 2,536,901- 42,651 1,121 - - - 78,859- 196,661 (34,890) 10,657 - 59,333 (190,931)
104,149 588,428 1775 131371 (9,489) (35,217) 332,095- - - - - - - - - - - - - -
287,116 13,848,596 12,640 11,562,762 3,686,167 12,949,893 49,051,216
109,917 1,456,935 233 1,872,074 232,289 912,610 4,791,109 172,307 19,331,572 19,907 964,115 58,357 406,359 34,456,232
- - - - - - -
282,224 20,788,507 20,140 2,836,189 290,647 1,318,969 39,247,341
4,892 (6,939,911) (7,500) 8,726,573 3,395,520 11,630,924 9,803,875
2,208,854$ 261,749,756$ 7,178,554$ 67,823,228$ 26,036,848$ 102,501,467$ 626,667,566$

MUNICIPAL PENSION FUND Exhibit A-4ANALYSIS OF FUND BALANCE
FOR THE PERIOD ENDED JUNE 30, 2006
Reserve for Payment of PensionsReserve for Member Contributions and All Other Purposes Total Reserves
Balance, July 1, 2005 $616,863,691 $3,484,924,319 $4,101,788,010
Additions: Contributions: Employees 48,910,052 Quasi-Public Agencies - 10,419,032 City Appropriations - 321,346,416
Total Contributions 48,910,052 331,765,447 Interest: Members' Reinstatements - 45,964 Interest on Long-Term Investments - 63,322,582 Interest on Short-Term Investments - 1,732,000
Total Interest - 65,100,546 Members' Contributions Transferred To Reserve for Retirements - 34,456,232 Adjustments for Employees Unexpended Vacation Time - - Adjustments to Members' Unexpended Contributions 332,095 - Adjustments for Accrued Death Benefits - - Net Appreciation Fair Value of Investment Managers - Net Income (Loss) from Investment Managers 403,143,791 Other Additions: Unclaimed Withdrawal Checks Deposited - - Refunds and Cancelled Checks-Prior Years' Pensions - 1,246,094 Miscellaneous Receipts - 1,477,319 Miscellaneous Fund Balance Adjustments - 131,622
Total Other Additions 2,855,035
Total Additions 49,242,147 837,321,052 886,563,199
Deductions: Withdrawals 4,791,109 - Retirements 34,456,232 - Adjustments to Members' Contributions - - Administrative Expenses - 6,292,346 Payments of Pensions and Benefits - 608,682,198 Investment Manager Expenses - 16,780,609 Adjustments for Employees Unexpended - Vacation Time - (5,295) Adjustments to Members' Unexpended - - Contributions - 332,095 Adjustments for Accrued Death Benefits - 244,737 Adjustments for Liability to - Deceased Pensioners 190,931 -
- Miscellaneous Fund Balance Adjustments - -
Total Deductions 39,438,272 632,326,690 671,764,962
Balance , June 30, 2006 $626,667,566 $3,484,924,319 $4,316,586,247
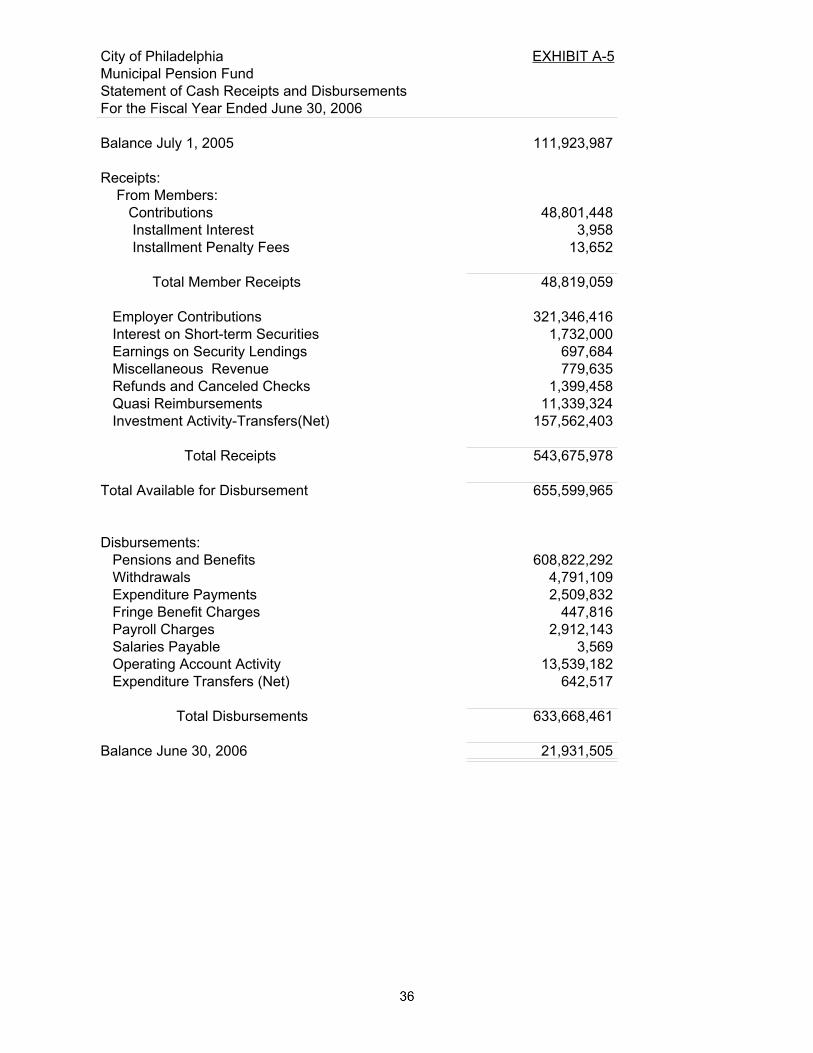
City of Philadelphia EXHIBIT A-5Municipal Pension FundStatement of Cash Receipts and DisbursementsFor the Fiscal Year Ended June 30, 2006
Balance July 1, 2005 111,923,987
Receipts: From Members: Contributions 48,801,448 Installment Interest 3,958 Installment Penalty Fees 13,652
Total Member Receipts 48,819,059
Employer Contributions 321,346,416 Interest on Short-term Securities 1,732,000 Earnings on Security Lendings 697,684 Miscellaneous Revenue 779,635 Refunds and Canceled Checks 1,399,458 Quasi Reimbursements 11,339,324 Investment Activity-Transfers(Net) 157,562,403
Total Receipts 543,675,978
Total Available for Disbursement 655,599,965
Disbursements: Pensions and Benefits 608,822,292 Withdrawals 4,791,109 Expenditure Payments 2,509,832 Fringe Benefit Charges 447,816 Payroll Charges 2,912,143 Salaries Payable 3,569 Operating Account Activity 13,539,182 Expenditure Transfers (Net) 642,517
Total Disbursements 633,668,461
Balance June 30, 2006 21,931,505

05/2
4/20
0703
:40:
44 P
Mpe
nsio
n co
ntrib
utio
n by
div
isio
n.12
3
City
of P
hila
delp
hia
Year
-End
Pen
sion
Con
tribu
tion
Pen
sion
Con
tribu
tions
By
Div
isio
nFi
scal
Yea
r End
ing
June
30,
200
6
Payr
oll U
sed
Plus
Tot
alTo
tal
To D
eter
min
eU
nfun
ded
Less
Qua
siIn
tere
stPe
nsio
nN
orm
al C
ost
Nor
mal
Cos
tsLi
abili
tyC
ontr
ibut
ions
Cha
rges
Con
trib
utio
n
Polic
e - 1
967
Plan
83,6
97,9
73.1
47,
499,
338.
3912
1,90
5,60
0.00
(5,7
58,4
03.6
8)12
3,64
6,53
4.71
Polic
e - 1
987
Plan
253,
809,
183.
0016
,974
,758
.16
1,44
0,98
0.00
(819
,483
.83)
17,5
96,2
54.3
3
Fire
- 19
67 P
lan
34,1
50,0
86.9
52,
997,
694.
6338
,439
,940
.00
(1,8
43,9
37.5
7)39
,593
,697
.06
Fire
- 19
87 P
lan
66,3
01,7
52.7
24,
794,
942.
76(1
11,1
80.0
0)(2
08,4
23.2
4)4,
475,
339.
52
Mun
icip
al -
1967
Pla
n31
7,44
6,30
2.42
16,3
35,7
86.7
217
5,38
5,36
0.00
(8,5
08,9
90.5
0)(8
,152
,776
.61)
175,
059,
379.
61
Mun
icip
al -
1987
Pla
n 49
6,15
3,50
8.72
25,1
59,9
44.4
3(2
00,5
60.0
0)(1
,110
,670
.22)
23,8
48,7
14.2
1
Mun
icip
al E
lect
ed -
1987
Pla
n2,
251,
466.
1810
6,31
4.23
219,
090.
00(1
4,48
0.20
)31
0,92
4.04
Qua
si-G
over
nmen
tal A
genc
ies
37,1
17,0
09.0
41,
910,
041.
29(1
,910
,041
.29)
0.00
1,29
0,92
7,28
2.18
75,7
78,8
20.6
133
7,07
9,23
0.00
(10,
419,
031.
79)
(17,
908,
175.
34)
384,
530,
843.
48
37

CIT
Y O
F PH
ILA
DE
LPH
IA
M
UN
ICIP
AL
RE
TIR
EM
EN
T S
YST
EM
APP
LIC
AT
ION
S PR
OC
ESS
ED
DU
RIN
G J
UL
Y 2
004
TH
RO
UG
H J
UN
E 2
005
D
IVIS
ION
W
ITH
DR
AW
AL
APP
LIC
AT
ION
S
PEN
SIO
N A
PPL
ICA
TIO
NS
Su
rviv
ors o
f
GR
AN
D T
OT
AL
M
embe
rs
Dea
ths
T
otal
R
egul
ar
Dis
able
d E
mpl
oyee
s Pe
nsio
ners
Tot
al
APP
LIC
AT
ION
S M
UN
ICIP
AL
1,
105
40
1,14
5
809
76
43
220
1,
148
2,2
93
FIR
E
16
2
1
8
125
2
13
38
178
1
96
PO
LIC
E
8
5
1
86
1
91
10
6
100
307
3
93
GR
AN
D T
OT
AL
1,20
6
43
1,
249
1,1
25
88
6
2
3
58
1,63
3
2
,882
APP
LIC
AT
ION
S PR
OC
ESS
ED
DU
RIN
G J
UL
Y 2
005
TH
RO
UG
H J
UN
E 2
006
DIV
ISIO
N
WIT
HD
RA
WA
L A
PPL
ICA
TIO
NS
PE
NSI
ON
APP
LIC
AT
ION
S
Su
rviv
ors o
f
GR
AN
D T
OT
AL
M
embe
rs
Dea
ths
T
otal
R
egul
ar
Dis
able
d E
mpl
oyee
s Pe
nsio
ners
Tot
al
APP
LIC
AT
ION
S M
UN
ICIP
AL
1,
122
43
1,16
5
770
8
8
3
4
2
22
1,11
4
2,2
79
FIR
E
23
0
2
3
91
1
4
40
13
6
1
59
POL
ICE
70
1
7
1
191
1
9
1
0
1
02
32
2
3
93
GR
AN
D T
OT
AL
1,21
5
44
1,
259
1,0
52
108
48
364
1,
572
2
,831
38

CIT
Y O
F PH
ILA
DE
LPH
IA
M
UN
ICIP
AL
RE
TIR
EM
EN
T S
YST
EM
CO
MPA
RA
TIV
E S
TA
TE
ME
NT
OF
RE
TIR
EM
EN
T B
EN
EFI
TS
IN F
OR
CE
AS
OF
JUN
E 3
0, 2
005
AN
D J
UN
E 3
0, 2
006
N
UM
BE
R R
EC
EIV
ING
BE
NE
FIT
S
M
ON
TH
LY
RA
TE
OF
PEN
SIO
N B
EN
EFI
TS
IN F
OR
CE
R
etir
ed M
embe
rs
R
etir
ed M
embe
rs
R
egul
ar
Dis
able
d Su
rviv
ors
TO
TA
L
R
egul
ar
D
isab
led
Su
rviv
ors
T
OT
AL
JU
NE
30,
200
5 M
UN
ICIP
AL
DIV
ISIO
N
12,2
13
2,
018
5,
532
19
,763
$1
7,38
9,02
0
$2,4
71,2
93
$2
,788
,534
$22,
648,
847
F
IRE
DIV
ISIO
N
1
,895
47
6
94
2
3,3
13
4
,004
,798
7
37,5
47
585
,284
5,3
27,6
29
PO
LIC
E D
IVIS
ION
5,5
71
2,
044
2,
198
9
,813
1
0,45
4,61
9
2,8
66,2
41
1
,361
,072
14,
681,
932
GR
AN
D T
OT
AL
19,6
79
4,
538
8,
672
32
,889
$3
1,84
8,43
7
$6,0
75,0
81
$4
,734
,890
$42,
658,
408
R
etir
ed M
embe
rs
R
etir
ed M
embe
rs
R
egul
ar
Dis
able
d Su
rviv
ors
TO
TA
L
R
egul
ar
D
isab
led
Su
rviv
ors
T
OT
AL
JUN
E 3
0, 2
006
MU
NIC
IPA
L D
IVIS
ION
12
,440
2,01
1
5,54
0
19,9
91
$18,
350,
612
$2
,542
,704
$2,8
76,4
52
$2
3,76
9,76
8 F
IRE
DIV
ISIO
N
1
,941
46
0
93
5
3,3
36
4
,202
,181
720
,909
5
99,6
50
5,5
22,7
40
P
OL
ICE
DIV
ISIO
N
5
,638
2,00
1
2,21
9
9,8
58
10,
752,
140
2
,854
,909
1,4
03,3
54
1
5,01
0,40
3 G
RA
ND
TO
TA
L
20
,019
4,47
2
8,69
4
33,1
85
$33,
304,
933
$6
,118
,522
$4,8
79,4
56
$4
4,30
2,91
1
39

CITY OF PHILADELPHIA
PUBLIC EMPLOYEES RETIREMENT SYSTEM
ANALYSIS OF MEMBERSHIP
ACTIVE MEMBERS
DIVISION 6/30/05 6/30/06 MUNICIPAL 21,190 21,027 FIRE 2,214 2,240 POLICE 6,702 6,662 TOTAL 30,106 29,929


Cover photo provided by courtesy of the Office of the City Representative, City of Philadelphia