A Myc–microRNA network promotes exit from quiescence by
16
A Myc–microRNA network promotes exit from quiescence by suppressing the interferon response and cell-cycle arrest genes Damon Polioudakis, Akshay A. Bhinge, Patrick J. Killion, Bum-Kyu Lee, Nathan S. Abell and Vishwanath R. Iyer* Institute for Cellular and Molecular Biology, Center for Systems and Synthetic Biology, and Section of Molecular Genetics and Microbiology, University of Texas at Austin, 1 University Station A4800, Austin, Texas 78712-0159, USA Received June 1, 2012; Revised December 7, 2012; Accepted December 13, 2012 ABSTRACT The transition of mammalian cells from quiescence to proliferation is accompanied by the differential ex- pression of several microRNAs (miRNAs) and tran- scription factors. However, the interplay between transcription factors and miRNAs in modulating gene regulatory networks involved in human cell pro- liferation is largely unknown. Here we show that the miRNA miR-22 promotes proliferation in primary human cells, and through a combination of Argonaute-2 immunoprecipitation and reporter assays, we identified multiple novel targets of miR-22, including several cell-cycle arrest genes that mediate the effects of the tumor-suppressor p53. In addition, we found that miR-22 suppresses interferon gene expression by directly targeting high mobility group box-1 and interferon regulatory factor (IRF)-5, preventing activation of IRF3 and NF-iB, which are activators of interferon genes. The expression of inter- feron genes is elevated in quiescent cells and their expression is inhibitory for cell proliferation. In addition, we find that miR-22 is activated by the tran- scription factor Myc when quiescent cells enter pro- liferation and that miR-22 inhibits the Myc transcriptional repressor MXD4, mediating a feed-forward loop to elevate Myc expression levels. Our results implicate miR-22 in downregulating the anti-proliferative p53 and interferon pathways and reveal a new transcription factor–miRNA network that regulates the transition of primary human cells from quiescence to proliferation. INTRODUCTION Most cells in eukaryotic organisms are quiescent, that is, they exist in the G 0 stage of the cell cycle and are not actively dividing. On appropriate physiological or patho- logical stimuli, many types of somatic cells may leave the quiescent state, re-enter the cell cycle and begin to prolif- erate. The ability of cells to remain viable while quiescent, exit quiescence and re-enter into the cell cycle is essential for tissue homeostasis and is the basis for varied physio- logical processes such as wound healing, lymphocyte acti- vation and hepatocyte regeneration, but it is also a hallmark of cancer (1–5). During wound healing, an intra- cellular signaling cascade drives global changes in gene expression that result in dermal fibroblasts and epidermal stem cells proliferating rapidly until tissue repair is accom- plished and then the cells exit the cell cycle and re-enter quiescence (6). Primary human dermal fibroblasts are an excellent model for studying the global gene expression programs regulating the transition from quiescence to proliferation. In response to serum containing growth factors, an im- portant mitogenic signal in wound healing and tissue homeostasis, fibroblasts may be induced to proliferate or enter quiescence. Serum activation of fibroblasts induces a transcriptional program activating many aspects of wound healing, and the wound response program is recapitulated in many human cancers (7). Many key cell-cycle regula- tory genes that are differentially expressed in primary *To whom correspondence should be addressed. Tel: +1 512 232 7833; Fax:+1 512 232 3472; Email: [email protected] The authors wish it to be known that, in their opinion, the first two authors should be regarded as joint First Authors. Present addresses: Akshay A. Bhinge, Genome Institute of Singapore, 60 Biopolis Street, Singapore 138672. Patrick J. Killion, Delaware Valley College, Doylestown, PA 18901, USA. Published online 8 January 2013 Nucleic Acids Research, 2013, Vol. 41, No. 4 2239–2254 doi:10.1093/nar/gks1452 ß The Author(s) 2013. Published by Oxford University Press. This is an Open Access article distributed under the terms of the Creative Commons Attribution Non-Commercial License (http://creativecommons.org/licenses/ by-nc/3.0/), which permits unrestricted non-commercial use, distribution, and reproduction in any medium, provided the original work is properly cited. Downloaded from https://academic.oup.com/nar/article/41/4/2239/2414973 by guest on 19 February 2022
Transcript of A Myc–microRNA network promotes exit from quiescence by

A Myc–microRNA network promotes exit fromquiescence by suppressing the interferonresponse and cell-cycle arrest genesDamon Polioudakis, Akshay A. Bhinge, Patrick J. Killion, Bum-Kyu Lee, Nathan S. Abell
and Vishwanath R. Iyer*
Institute for Cellular and Molecular Biology, Center for Systems and Synthetic Biology, and Section ofMolecular Genetics and Microbiology, University of Texas at Austin, 1 University Station A4800, Austin,Texas 78712-0159, USA
Received June 1, 2012; Revised December 7, 2012; Accepted December 13, 2012
ABSTRACT
The transition of mammalian cells from quiescence toproliferation is accompanied by the differential ex-pression of several microRNAs (miRNAs) and tran-scription factors. However, the interplay betweentranscription factors and miRNAs in modulatinggene regulatory networks involved in human cell pro-liferation is largely unknown. Here we show that themiRNA miR-22 promotes proliferation in primaryhuman cells, and through a combination ofArgonaute-2 immunoprecipitation and reporterassays, we identified multiple novel targets ofmiR-22, including several cell-cycle arrest genes thatmediate the effects of the tumor-suppressor p53. Inaddition, we found that miR-22 suppresses interferongene expression by directly targeting high mobilitygroup box-1 and interferon regulatory factor (IRF)-5,preventing activation of IRF3 and NF-iB, which areactivators of interferon genes. The expression of inter-feron genes is elevated in quiescent cells and theirexpression is inhibitory for cell proliferation. Inaddition, we find that miR-22 is activated by the tran-scription factor Myc when quiescent cells enter pro-liferation and that miR-22 inhibits the Myctranscriptional repressor MXD4, mediating afeed-forward loop to elevate Myc expression levels.Our results implicate miR-22 in downregulating theanti-proliferative p53 and interferon pathways andreveal a new transcription factor–miRNA network
that regulates the transition of primary human cellsfrom quiescence to proliferation.
INTRODUCTION
Most cells in eukaryotic organisms are quiescent, that is,they exist in the G0 stage of the cell cycle and are notactively dividing. On appropriate physiological or patho-logical stimuli, many types of somatic cells may leave thequiescent state, re-enter the cell cycle and begin to prolif-erate. The ability of cells to remain viable while quiescent,exit quiescence and re-enter into the cell cycle is essentialfor tissue homeostasis and is the basis for varied physio-logical processes such as wound healing, lymphocyte acti-vation and hepatocyte regeneration, but it is also ahallmark of cancer (1–5). During wound healing, an intra-cellular signaling cascade drives global changes in geneexpression that result in dermal fibroblasts and epidermalstem cells proliferating rapidly until tissue repair is accom-plished and then the cells exit the cell cycle and re-enterquiescence (6).Primary human dermal fibroblasts are an excellent
model for studying the global gene expression programsregulating the transition from quiescence to proliferation.In response to serum containing growth factors, an im-portant mitogenic signal in wound healing and tissuehomeostasis, fibroblasts may be induced to proliferate orenter quiescence. Serum activation of fibroblasts induces atranscriptional program activating many aspects of woundhealing, and the wound response program is recapitulatedin many human cancers (7). Many key cell-cycle regula-tory genes that are differentially expressed in primary
*To whom correspondence should be addressed. Tel: +1 512 232 7833; Fax: +1 512 232 3472; Email: [email protected]
The authors wish it to be known that, in their opinion, the first two authors should be regarded as joint First Authors.
Present addresses:Akshay A. Bhinge, Genome Institute of Singapore, 60 Biopolis Street, Singapore 138672.Patrick J. Killion, Delaware Valley College, Doylestown, PA 18901, USA.
Published online 8 January 2013 Nucleic Acids Research, 2013, Vol. 41, No. 4 2239–2254doi:10.1093/nar/gks1452
� The Author(s) 2013. Published by Oxford University Press.This is an Open Access article distributed under the terms of the Creative Commons Attribution Non-Commercial License (http://creativecommons.org/licenses/by-nc/3.0/), which permits unrestricted non-commercial use, distribution, and reproduction in any medium, provided the original work is properly cited.
Dow
nloaded from https://academ
ic.oup.com/nar/article/41/4/2239/2414973 by guest on 19 February 2022
human fibroblasts exiting quiescence are also deregulatedin cancer (6,8). In addition, expression profiles of proli-ferating fibroblasts are good predictors of cancer progres-sion (7).Of the many genes activated in fibroblasts during the
exit from quiescence, several microRNAs (miRNAs) havebeen identified (9). miRNAs are endogenous, non-codingsmall RNAs that repress gene expression post-transcriptionally (10). miRNAs play important regulatoryroles in many diverse biological processes, such as devel-opment, differentiation, proliferation, apoptosis, the stressresponse and cancer (11–16). Roughly 50% of all humanprotein coding genes are predicted to be directly regulatedby miRNAs (17,18). miRNAs have emerged as importantregulators of cell proliferation driving tumorigenesis, andseveral studies have functionally linked miRNAs and tran-scription factors in regulatory networks that govern cellproliferation and cancer (19,20).The miRNA miR-22 has been reported to act as both a
proto-oncogene in various cancer cell lines and a tumorsuppressor in other cancer cell lines, as well as beinginvolved in panic disorder, hypoxia signaling, differenti-ation and cardiomyocyte hypertrophy (21–24). miR-22was shown to promote cell proliferation, invasion andsurvival in multiple cancer cell types by regulatingPTEN (21,24–26). However, miR-22 has also beendemonstrated to repress proliferation by inhibiting thebinding partners, MAX and MYCBP, of the oncogeneMyc (27–29). In addition, miR-22 was shown to inhibitcancer progression by inducing cellular senescence (30),and to repress cell migration and invasion in ovariancancer (23). miR-22 has also been linked to the p53 regu-latory network, is a direct target of the tumor-suppressorp53 and mediates p53-induced cell-cycle arrest and apop-tosis in colon cancer (28). Despite the broad involvementof miR-22 in tumorigenesis in various cancers, the activityof miR-22 in primary cells has not been explored.In this study, we investigate the regulation of cell pro-
liferation in primary cells by miR-22 and identify a newregulatory network mediating the transition of primarycells from quiescence to proliferation. This networkinvolves the activation by the oncogene Myc of miR-22,which in turn suppresses the interferon and cell-cyclearrest pathways active in quiescent cells, thus facilitatingtheir re-entry into the cell cycle. Our data reveal novelcross-talk between the p53 and Myc regulatory networksthat is mediated by miR-22.
MATERIALS AND METHODS
Normal cell culture conditions
HeLa cells and human foreskin fibroblasts (ATCC CRL#2091) were maintained in Dulbecco’s Modified Eagle’sMedium (DMEM) supplemented with 10% fetal bovineserum (FBS) at 37�C under 5% CO2. Fibroblasts weremade quiescent by first growing them under normal con-ditions until 40% confluent, then replacing the mediumwith DMEM supplemented with 0.1% FBS and growingthem for a further 48 h.
Fibroblast serum stimulation
Fibroblast cell cultures were grown under normal cellculture conditions until 40% confluent. The medium wasremoved and cell cultures were washed three times withphosphate buffered saline (PBS). Replacement mediumwas DMEM supplemented with 0.1% FBS and 100units penicillin–streptomycin. Cell cultures were grownat 37�C for 48 h. Cell cultures were washed once withPBS. Reference cell cultures were harvested followingtotal RNA isolation. Replacement medium was DMEMsupplemented with 10% FBS and 100 units penicillin–streptomycin. Separate cell cultures were allowed to pro-liferate under serum-rich conditions for time points of 5,10, 20, 30, 60 and 180 min. At the end of each of these timepoints, cell cultures were harvested for total RNA isola-tion using the Trizol reagent (Invitrogen) according to themanufacturer’s protocol.
Myc overexpression
HeLa cell cultures were grown under normal cell cultureconditions. Six-well plates were seeded with 1.5� 105 cells/well. Cell cultures were allowed to grow for 24 h. Cellcultures were lipotransfected with InvitrogenLipofectamine 2000 according to the manufacturer’sprotocol (for DNA plasmid transfection). Myc over-expression plasmid was purchased from OpenBiosystems [MHS1010-57504, Human MGC Verified FLcomplementary DNA (cDNA), CloneID=298544]. GFPco-transfection plasmid was purchased from Clontech(Vector=pEGFP-N1, Accession=U55762). Cell cultureswere grown under normal cell culture conditions for 48 hand then harvested for total RNA.
Myc knockdown
Myc-specific small interfering RNA (siRNA) and negativecontrol siRNA were purchased from Dharmacon. HeLacell cultures were grown under normal cell culture condi-tions. Six-well plates were seeded with 1.5� 105 cells/well.Cell cultures were allowed to grow for 24 h. Cell cultureswere lipotransfected with Invitrogen Lipofectamine 2000according to the manufacturer’s protocol (for siRNAtransfection). Cell cultures were grown under normal cellculture conditions for 48 h and then harvested for totalRNA. For serum stimulation experiments under condi-tions of Myc knockdown, fibroblasts were transfectedwith siRNAs against Myc or negative control siRNAand cells were starved into quiescence. Quiescent fibro-blasts were then serum-stimulated for the indicated timepoints and miR-22 expression was assayed by quantitativereverse transcriptase–polymerase chain reaction(qRT-PCR).
miRNA enrichment, labeling and microarrays
Ambion FlashPAGE Fractionator System, Pre-cast Gels,Buffer Kit and Clean-Up Kit were used according to themanufacturer’s protocol. Invitrogen ULYSIS 546 NucleicAcid Labeling Kit was used for the typical Cy3 sample.Invitrogen ULYSIS 647 Nucleic Acid Labeling Kit wasused for the typical Cy5 sample. The kits were used
2240 Nucleic Acids Research, 2013, Vol. 41, No. 4
Dow
nloaded from https://academ
ic.oup.com/nar/article/41/4/2239/2414973 by guest on 19 February 2022
according to the manufacturer’s protocol. AmbionFlashPAGE Clean-Up Kits were used for removal of un-incorporated dye according to the manufacturer’sprotocol. Labeled small RNAs were hybridized to dualchannel miRNA microarrays, quantitated and nor-malized. The microarrays were printed in house with thev1 Ambion array probe set that includes 281 humanmiRNAs registered in miRBase.
Real-time miRNA PCR
Quantitative real-time PCR was performed for miR-22using Applied Biosystems TaqMan miRNA Assaysaccording to the manufacturer’s protocol.
Quantitative RT-PCR for interferon-stimulated genes
RNA from quiescent and proliferating fibroblasts was ex-tracted with the Trizol reagent (Invitrogen) and reversetranscribed using random hexamers and the SuperscriptII system from Invitrogen. PCR was performed using theSYBR GREEN PCR Master Mix from AppliedBiosystems. The target-gene messenger RNA (mRNA) ex-pression was normalized to the expression of GAPDH,and relative mRNA fold changes were calculated by the��Ct method. The primer sequences are shown inSupplementary Table S1.
Myc-binding site detection and motif analysis
Chromatin immunoprecipitation (ChIP) for Myc was per-formed as previously described (31). ChIP-enriched DNAwas sequenced by Illumina sequencing technology. Shortreads from the ends of DNA fragments were mapped backto the genome using Maq. Conservation was quantifiedaccording to the mammalian conservation track fromUCSC, specifically, the 17-species conservation and align-ment track (phastCons17way). Conservation wasevaluated for each locus through local installation of aportion of UCSC’s Genome Browser and command-lineexecution of UCSC toolsets (hgWiggle) that retrieved con-servation metrics for a specified genomic range. The meanconservation of conserved motifs was 90% (standard de-viation is 6.7%), whereas the mean conservation of thenon-conserved motifs was 0.6% (standard deviation is0.3%). The presence of proximal CpG islands wasevaluated using the CpG enrichment track(cpgIslandExt). Conserved binding motif coordinates forMyc across the genome were obtained from UCSC’scatalog of conserved binding sites for all mammalian tran-scription factors (TFBS conserved). Motif search was per-formed within 20 kb upstream of the miRNA start sites.For the ChIP-PCR assay, fibroblasts were starved intoquiescence and then serum-stimulated to proliferate.Cells were harvested 3 h after stimulation and ChIP wasperformed as described above. Myc binding was con-firmed using quantitative PCR performed using theSYBR GREEN PCR Master Mix from AppliedBiosystems. Fold enrichment was calculated with respectto the negative control by the ��Ct method. Primer se-quences used for ChIP-qPCR are shown in SupplementaryTable S1.
RNA oligos, transfections and microarray analysis
miR-22 guide and anti-guide mature sequences wereobtained from miRBase (http://microRNA.sanger.ac.uk/sequences/), while sequences for siRNA against GFP(control siRNA) were obtained from (32). The corres-ponding RNA oligos were ordered from Invitrogen orIDT and annealed in RNA annealing buffer (20mMHEPES, pH 7.3, 50mM KCl, 2mM MgCl2). Both themiR-22 and control siRNA oligos contain the samechemical modifications of 50-phosphate and 30-OH. TheRNA duplexes were transfected at a final concentrationof 100 nM using Lipofectamine 2000 according to themanufacturer’s instructions. The miR-22 inhibitor andcontrol were a miRCURY Locked Nucleic Acid (LNA)miRNA Inhibitor and Negative Control Inhibitorobtained from Exiqon and transfected at a final concen-tration of 10 nM using Lipofectamine 2000. Poly I:C wasobtained from Sigma Aldrich and co-transfected at a finalconcentration of 200 ng/ml with miR-22 or control siRNAduplexes as described above. RNA from transfected cellswas extracted using the Trizol reagent (Invitrogen),amplified and hybridized to in-house cDNA expressionmicroarrays as previously described (9). The primarymicroarray data are available at NCBI’s GEO(Accession GSE42788). Functional analysis for repressedgenes was performed using the freely available onlinesoftware DAVID (33).
Flow cytometry
Fibroblasts were seeded at 50 000 cells per well in six-wellplates. Cells were cultured in DMEM supplemented with10% FBS. Cells were allowed to grow 24 h, and then themedium was replaced with low-serum DMEM 0.1% FBS.Eight h after replacement with DMEM 0.1% FBS, cellswere transiently transfected with miR-22 or controlsiRNA duplexes (100 nM final concentration). Twenty-eight hours after transfection, cells were trypsinized,washed with PBS and fixed for 24 h in 70% ethanol at�20�C. After ethanol fixation, cells were washed withStain Buffer (BD Pharmingen), incubated 30 min withfluorescein isothiocyanate Mouse Anti-Human Ki67antibody (BD Pharmingen), washed and resuspended in500 ml Stain Buffer with Propidium Iodide StainingSolution (5 mg/ml) (BD Pharmingen). Flow cytometryanalysis for Ki67 was done using a FACsCalibur flowcytometer and 10 000 events above threshold levels werecounted for each sample (BD Biosciences). Data analysiswas done using FlowJo.
Luciferase assays
Entire 30untranslated regions (UTRs), if possible, or atleast 0.8–1.2 kb around the predicted miR-22 site in a30UTR was cloned into a Renilla vector under acytomegalovirus (CMV) promoter. For CARF, weincluded the last exon in addition to the 30UTR for theluciferase assays. miRNA seed site mutants were made bymutating 3 bp in the 6-mer seed sequence using Agilent’sQuikChange MultiSite-Directed Mutagenesis Kit.Another vector containing the Firefly luciferase under a
Nucleic Acids Research, 2013, Vol. 41, No. 4 2241
Dow
nloaded from https://academ
ic.oup.com/nar/article/41/4/2239/2414973 by guest on 19 February 2022

CMV promoter was used as a normalization control.HEK293 cells were plated in 24-well plates at 105 cells/well and Renilla and Firefly vectors were co-transfected at25 ng each along with 100 nM final concentration ofmiR-22. Control siRNA was used as a negative control.Cells were harvested 24 h post-transfection, and luciferaseactivity was measured using the Promega Dual Luciferasekit according to manufacturer’s instructions. Fold sup-pression was calculated as the ratio of Renilla to Fireflyvalues for miR-22 normalized by the mean of the Renillato Firefly ratios for the control siRNA. For the NF-kBreporter assays, HEK293 cells were plated in 24-wellplates at 1� 106 cells/well. Twenty-four hours afterplating, cells were transfected with 100 ng/well of NF-kBreporter plasmid (SABiosciences) and co-transfected withpoly I:C and miR-22 or the control siRNA. Cells wereharvested 16 h post-transfection, and luciferase activitywas measured as described above. For Figure 5E and F,we performed luciferase assays using a pGL3 promoterplasmid (Promega) as previously described (34). Around550 bp of PCR-amplified insert from each of four putativeMyc-binding sites was cloned into the vector. All primersused for cloning are listed in Supplementary Table S1.
Western blots
For western blots of phosphorylated and native interferonregulatory factor (IRF)-3, HeLa cells were seeded in six-well plates at 8� 104 cells/well and co-transfected with200 ng/ml poly I:C and miR-22 or the control siRNA.Twelve hours after transfection, cells were harvested forprotein analysis. Cell lysates were separated on 10%sodium dodecyl sulphate–polyacrylamide gel electrophor-esis (SDS-PAGE) gels and proteins were transferred ontopolyvinylidene fluoride (PVDF) membranes. Membraneswere blocked with 5% milk in Tris-buffered saline andTween 20 (TBST) (25mM Tris pH 8.0, 150mM NaCl,0.05% Tween-20) and probed with correspondingprimary antibodies against specific proteins (phos-phorylated and native IRF3; Cell Signaling Technology).horseradish peroxidase (HRP)-conjugated secondaryantibodies (Santa Cruz Biotechnology) were used todetect primary antibodies, and proteins were visualizedby chemiluminescence.For western blots of putative miR-22 targets, primary
human fibroblasts were seeded in six-well plates at 2� 104
cells/well in DMEM supplemented with 10% FBS.Twenty-four hours after plating, the medium wasreplaced with low-serum DMEM 0.1% FBS. Themedium for proliferating samples was replaced withmore DMEM 10% FBS. Forty-eight hours after serumstarvation, miR-22 or control siRNA was transfected ata 100 nM concentration, and proliferating and quiescentsamples were lysed. Transfected cells were lysed at 12, 24,48 or 72 h post-transfection. Cell lysates were separated on4–20% gradient SDS-PAGE gels (Biorad) and proteinswere transferred onto PVDF membranes. Membraneswere blocked with 5% milk in TBST and probed withcorresponding primary antibodies against specificproteins [high mobility group box-1 (HMGB1): CellSignaling Technology, IRF5: Abcam ab33478, REDD1:
Abcam ab106356, TP53INP1: Abcam ab9755, p21:Abcam ab7960, CARF: ab88322, MXD4: Santa CruzBiotechnology sc-771, MYC: Santa Cruz Biotechnologysc-764X]. Actin was used as a loading control (Actin:Santa Cruz Biotechnology sc-10731). HRP-conjugatedsecondary antibodies (Santa Cruz Biotechnology sc-2004and sc-2005) were used to detect primary antibodies, andproteins were visualized by chemiluminescence. Westernblots shown are for the time point that showed thestrongest repression.
Argonaute-2 immunoprecipitation
We adapted the protocol developed by Hendrickson et al.(35) for immunoprecipitating Argonaute-2 (Ago2)–mRNA complexes. Briefly, HeLa cells were grown in 10cm2 tissue culture plates and transfected with eithermiR-22 mature duplexes at a final concentration of100 nM or mock transfected. After 24 h, 0.5ml of lysisbuffer was added drop-wise onto the cell monolayerfollowed by incubation at 4�C for 30 min. Cell lysatewas collected by scrapping and cleared by centrifugationat 14 000 rpm at 4�C. Cleared lysate was then incubatedwith 50 ml of protein-G beads (Roche) for 3 h at 4�C(pre-clearing). Before pre-clearing, 50 ml of the clearedlysate was removed for total RNA estimation.Pre-cleared lysate was incubated with 15 mg of Ago2antibody (ab57113; Abcam) and incubated at 4�C over-night. The next day, 50 ml of protein-G beads were addedto the lysate and incubated for 4 h at 4�C. Beads werewashed eight times with lysis buffer and Ago2–RNAcomplexes were extracted by adding 1ml Trizol reagent(Invitrogen) directly to the beads. RNA extraction wascarried out as per the manufacturer’s instructions.
Cell counting assays
For miRNA overexpression experiments, fibroblasts wereseeded at 20 000 cells per well in six-well plates. Cells werecultured in DMEM supplemented with 10% FBS. Cellswere allowed to grow 24 h, and then the medium wasreplaced with low-serum DMEM 0.1% FBS. Twenty-four hours after replacement with DMEM 0.1% FBS,cells were transiently transfected with miR-22 or siGFPduplexes (100 nM final concentration); 0, 24, 48, 72 and96 h after transfection, cells were trypsinized and countedin a hemacytometer. Five fields were averaged for eachbiological replicate. For miRNA inhibition experiments,fibroblasts were seeded at 20 000 cells per well in six-wellplates. Cells were cultured in DMEM supplemented with10% FBS. Cells were allowed to grow 24 h and then tran-siently transfected with miR-22 miRCURY LNA miRNAInhibitor and Negative Control Inhibitor obtained fromExiqon (10 nM final concentration); 0, 24, 48, 72 and 96 hafter transfection, cells were trypsinized and counted in ahemacytometer. Five fields were averaged for each biolo-gical replicate.
Statistical analysis
Statistical significance was estimated using a one-sidedStudent’s t-test.
2242 Nucleic Acids Research, 2013, Vol. 41, No. 4
Dow
nloaded from https://academ
ic.oup.com/nar/article/41/4/2239/2414973 by guest on 19 February 2022
RESULTS
miR-22 is induced during the transition from quiescence toproliferation and promotes proliferation
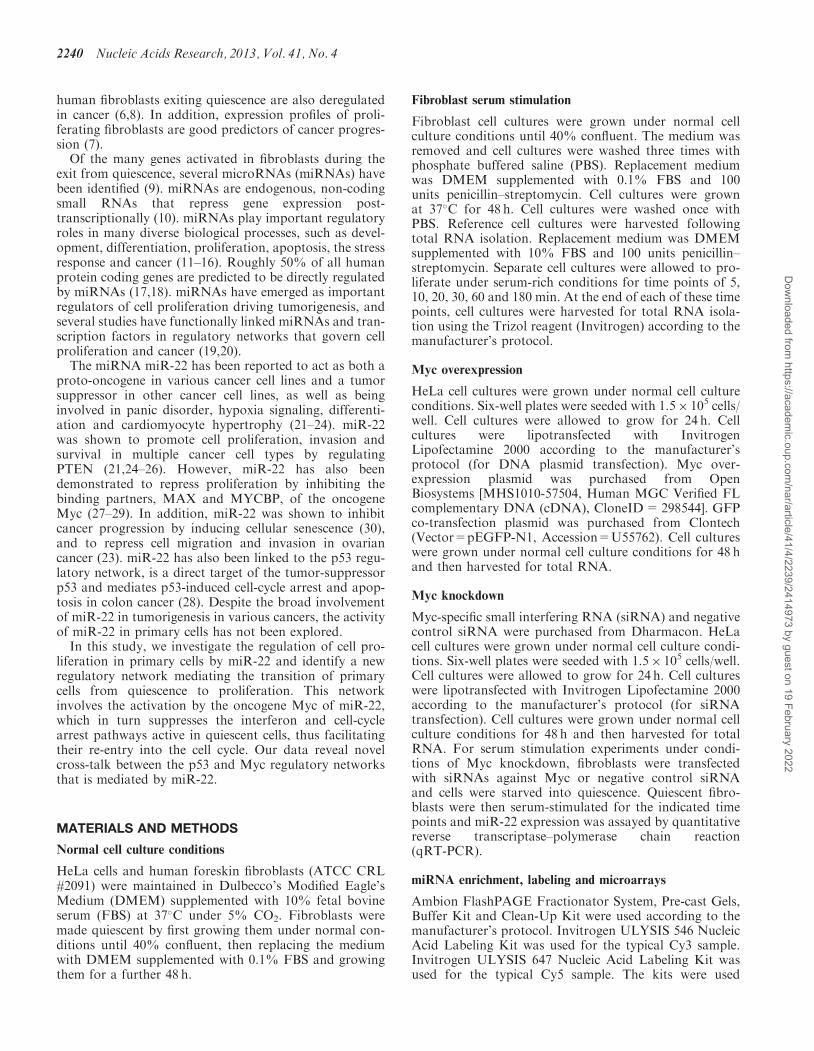
Microarray expression profiling identified multiplemiRNAs that are differentially expressed in primaryhuman fibroblasts induced to transition from quiescenceto proliferation by serum stimulation (Figure 1A andSupplementary Table S2). We focused on miR-22because it was one of the miRNAs most strongly and con-sistently induced by serum stimulation, and bioinformaticanalysis suggested that it could be transcriptionallyregulated by immediate-early transcription factors (notshown). qRT-PCR for miR-22 expression after serumstimulation of fibroblasts in an independent biologicalreplicate experiment confirmed its induction (Figure 1B).
Because miR-22 was activated during the transition ofprimary human cells from quiescence to proliferation, wehypothesized that miR-22 regulates proliferation inprimary human cells. To test this hypothesis, we transi-ently overexpressed miR-22 by transfecting the matureform of the miR-22 duplex RNA into quiescent fibroblastsand assayed cell growth. Compared with the control, miR-22-transfected cells showed increased growth by cellcounting assay (Figure 1C). Conversely, proliferatingcells in which we introduced a stable antisense inhibitorof miR-22 showed decreased cell growth (Figure 1D). Tofurther explore the effect of miR-22 on cell growth, weassayed the expression of the proliferation marker Ki67(26,36). We transfected miR-22 into quiescent fibroblastsand counted cells expressing Ki67 protein using flowcytometry. miR-22 transfection significantly increasedthe percentage of Ki67-positive cells compared withcontrol, indicating that miR-22 activates proliferation(Figure 1E). We confirmed this result by performing abiologically independent experiment where we transfectedmiR-22 into both quiescent fibroblasts and proliferatingfibroblasts and measured Ki67 expression by qRT-PCR.Compared with the control, miR-22-transfected cellsshowed elevated levels of Ki67 in both quiescent fibro-blasts and proliferating fibroblasts (Figure 1F andSupplementary Figure S1). In addition, inhibition ofmiR-22 decreased levels of Ki67 compared with thecontrol in cells exiting quiescence (Figure 1G).
Identifying miR-22 targets by microarrays
To identify the downstream targets of miR-22 inproliferating fibroblasts, we overexpressed miR-22 bytransfecting miR-22 duplexes and then analyzed gene ex-pression using microarrays, relying on the fact thatmiRNAs frequently cause downregulation of theirmRNA targets (13,37). To investigate whether thisapproach was able to identify miR-22 targets, we analyzedthe 30UTRs of genes that were downregulated followingmiR-22 transfection for enrichment of the miR-22 seedmatch sequence. We also performed the same experimentand analysis in HeLa cells. In both cell lines, 6-mermatches to nucleotides 2–7, the miR-22 seed region,were significantly enriched in genes repressed whenmiR-22 was overexpressed (P< 10�8 assuming a
binomial model, Supplementary Figure S2A and B).Thus, genes whose mRNAs were downregulated inresponse to high levels of miR-22 contained a significantproportion of direct targets of miR-22.In addition to conducting gene expression profiling fol-
lowing miR-22 overexpression in proliferating cells, wealso transfected miR-22 duplexes into fibroblasts thatwere rendered quiescent by serum deprivation andanalysed the resulting gene expression changes and corres-ponding seed enrichment as described above. Althoughthere was a significant enrichment of seed matches to the50-end of miR-22 in the 30UTRs of the repressed genes(P< 10�4 assuming a binomial model, SupplementaryFigure S2C), the magnitude of this enrichment wasmuch lower than that observed for genes that were re-pressed by miR-22 during proliferation, suggesting thatmany mRNAs downregulated by miR-22 in quiescentcells may be indirect targets.
miR-22 inhibits genes involved in cell-cycle arrest
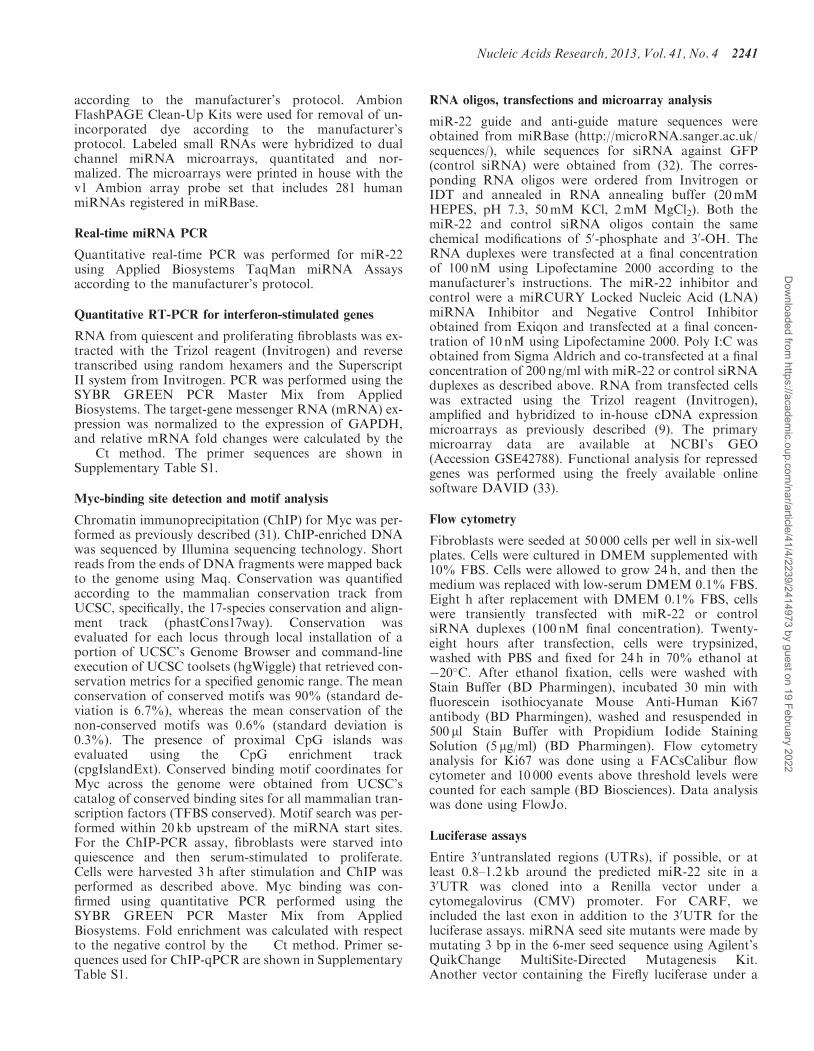
Overexpression of miR-22 repressed severalcell-cycle-related genes, suggesting miR-22 may regulateproliferation through repression of cell-cycle arrest genes.From the miR-22 overexpression and gene expressionprofiling experiments, we selected genes for furtheranalysis that were cell-cycle related, repressed by miR-22overexpression and contained miR-22 target sites. Of thesegenes, TP53INP1, REDD1 (also known as DDIT4) and p21(also known as CDKN1A) are transcriptionally activatedby the tumor-suppressor p53 (38–40), while CARF (alsoknown as CDKN2AIP) enhances p53 function andinduces premature senescence in primary fibroblasts (41).TP53INP1, p21 and CARF have a functional role ininducing cell-cycle arrest (40–42), while REDD1 is aDNA-damage-inducible protein involved in apoptosis (39).TargetScan and RNA22 predicted REDD1, TP53INP1 andp21 as miR-22 targets. Interestingly, CARF did not showmiR-22 seed sequences in its 30UTR but showed multipleseed matches in its last exon.To determine whether these genes were direct targets of
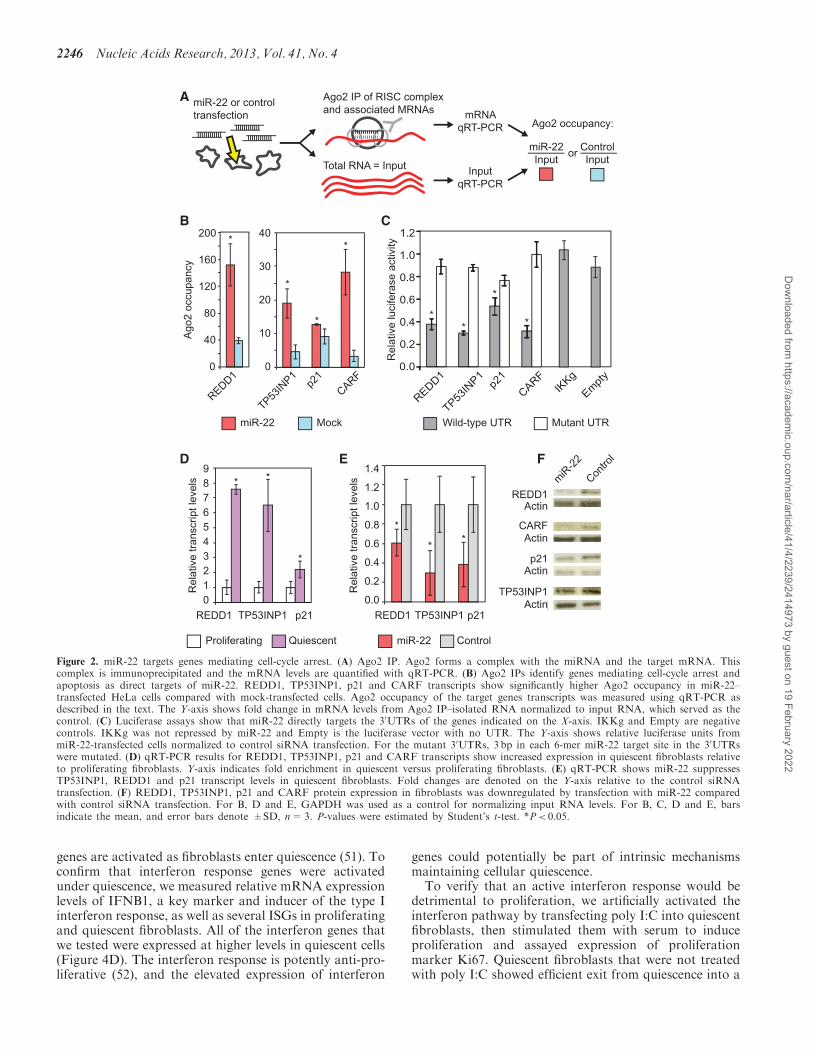
miR-22, we used a strategy based on Ago2 IPs (Figure 2A)(35,43). Ago2 is an essential component of the RNA-induced silencing complex that is directed to targetmRNAs by the miRNA guide strand (10). Hence,changes in Ago2 occupancy on a mRNA that occur in amiR-22-dependent manner can serve to identify directtargets. We measured Ago2 occupancy of candidatetarget mRNAs by immunoprecipitating Ago2–mRNAcomplexes and quantifying enrichment of the purifiedtranscripts by qRT-PCR. We performed parallel Ago2IPs in HeLa cells that were transfected with miR-22mature duplexes as well as in mock-transfected cells.HeLa cells were used for the Ago2 IPs owing to theirgreater RNA content and smaller size than human fibro-blasts, resulting in much higher mRNA yield per Ago2 IP.Transcripts that showed an increase in Ago2 occupancy inthe miR-22-transfected samples as compared with mocktransfections were expected to be direct miR-22 targets.We measured Ago2 occupancy by qRT-PCR usingGAPDH as a control. Transcript abundance in the IPs
Nucleic Acids Research, 2013, Vol. 41, No. 4 2243
Dow
nloaded from https://academ
ic.oup.com/nar/article/41/4/2239/2414973 by guest on 19 February 2022
was normalized to that in an aliquot of the total RNAbefore Ago2 IP.Ago2 IP confirmed REDD1, TP53INP1, p21 and
CARF as direct targets of miR-22, as all four genes spe-cifically showed increased Ago2 occupancy in a miR-22-dependent manner (Figure 2B), whereas other cell-cycle
regulatory genes did not (Supplementary Figure S3A).We confirmed that all four genes were directlydownregulated by miR-22 using a 30UTR luciferasereporter assay and that miR-22 mediated repression ofthe 30UTRs in the assay was dependent on the predictedmiR-22 target sites in the 30UTRs (Figure 2C).
Rel
ativ
e K
i67
expr
essi
on
EA
G
0 15 30 1h 2h 3hSerum activation
0
0.5
1.0
1.5
2.0
B
1.0
1.5
2.0
2.5
2.5
1.5
2.0
Activated Repressed
C F
miR-130amiR-23amiR-145miR-24miR-199amiR-26amiR-125amiR-22miR-125bmiR-143miR-16miR-23bmiR-27amiR-100miR-92miR-222miR-221miR-193amiR-103miR-127miR-107miR-197miR-181alet-7bmiR-99amiR-181bmiR-30dmiR-34amiR-152miR-17-5pmiR-328miR-198miR-183miR-374miR-373-5p
25
15
20
10
5
0miR-22 Control
miR-22 inhibitor Control
Per
cent
of c
ells
exp
ress
ing
Ki6
7
Rel
ativ
e K
i67
expr
essi
on
Rel
ativ
e ex
pres
sion
miR-22 expression post serum activation
10
14
12
0
2
4
6
82
3
2.5
0
0.5
1
1.5
Qui 18 hrs 24 hrsPro
Cells re-entering the cell cycle
30
25
15
10
20
5
0
Num
ber
of c
ells
x10
5
0 hr 24 hr 48 hr
D
96 hr72 hr
miR-22 Control
00 hr 24 hr 48 hr
miR-22 overexpression: cell growth
Num
ber
of c
ells
x10
5
2
4
6
8
10
72 hr 96 hr 12hr 24hr 36hr
4
0
1
2
3
miR-22 inhibition: cell growth35
*
**
*
* *
*
*
Figure 1. miR-22 is induced during the transition from quiescence to proliferation and activates proliferation. (A) Heat map showing the response ofmiRNAs to serum stimulation of quiescent primary human fibroblasts measured using microarrays. Ratios displayed represent the average activationacross all measured time points after serum stimulation (5, 10, 20, 30, 60 and 180min). miRNAs shown were activated or repressed >1.5-fold onaverage in serum-stimulated compared with serum-starved cells. (B) Independent qRT-PCR verification of miR-22 expression during the transitionfrom quiescence to proliferation. The Y-axis indicates expression of miR-22 after serum stimulation relative to quiescence, at each of the indicatedtime points on the X-axis. Data shown are for a representative experiment measured in quadruplicate (mean±SD). (C) Cell growth assay followingmiR-22 overexpression. Average cell number following miR-22 or control siRNA transfection is shown for each time point indicated. Error barsdenote±SD, n=3. (D) Cell growth assay following miR-22 inhibition. Average cell number following transfection of a LNA targeting miR-22 or aLNA negative control is shown for each time point indicated. Error bars denote ±SD, n=3. (E) Flow cytometry analysis for proliferation markerKi67 of miR-22-transfected quiescent fibroblasts. miR-22-transfected fibroblasts showed a larger population of cells expressing Ki67 compared withcontrol siRNA-transfected fibroblasts. The Y-axis shows the percentage of cells expressing Ki67. Bars are the mean percentage of cells expressingKi67, and error bars denote the mean±SD, n=4. (F) qRT-PCR data for Ki67 expression in quiescent fibroblasts transfected with miR-22 duplexescompared with control siRNA. miR-22-transfected fibroblasts show elevated levels of Ki67 expression as compared with control at the indicated timepoints. Ki67 expression was normalized using GAPDH mRNA levels, and fold changes were normalized with respect to the control transfection.(G) Inhibition of miR-22 decreases proliferation as measured by Ki67 expression. Quiescent fibroblasts were transfected with a LNA miR-22inhibitor or LNA control. Twenty-four hours post-transfection, cells were serum-stimulated to proliferate for 18 or 24 h before harvesting forqRT-PCR. Y-axis indicates relative Ki67 expression levels compared with quiescent cells. Bars indicate the normalized mean expression, anderror bars denote ±SD, n=3. Control panel depicts Ki67 expression in normally proliferating fibroblasts and serum-starved quiescent fibroblasts.GAPDH was used as a control for normalizing input RNA levels. For C, D, E and G, P-values were estimated by Student’s t-test. *P< 0.05.
2244 Nucleic Acids Research, 2013, Vol. 41, No. 4
Dow
nloaded from https://academ
ic.oup.com/nar/article/41/4/2239/2414973 by guest on 19 February 2022

The transcripts of three of these four genes (TP53INP1,p21 and REDD1) were upregulated as fibroblasts enteredquiescence (Figure 2D). We therefore assayed whetherectopic miR-22 could inhibit these genes in quiescentcells. We transfected miR-22 into quiescent fibroblastsand assayed the changes of these three genes transcriptlevels by qRT-PCR and changes in protein expressionby western blot. miR-22 suppressed the transcript andprotein expression of the three genes in quiescent cells(Figure 2E and F). Protein levels of CARF were alsodownregulated in quiescent cells transfected with miR-22compared with control (Figure 2F).
miR-22 targets genes that regulate the interferon response
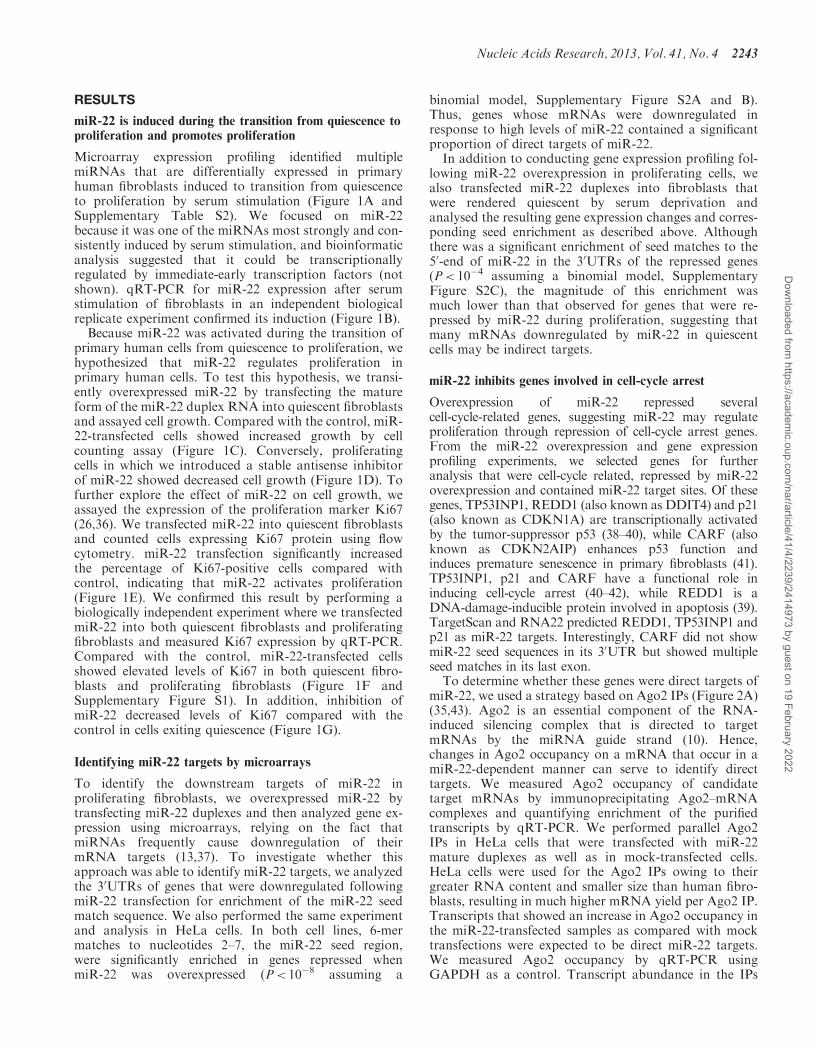
Remarkably, 25 out of the top 50 genes identified by micro-array to be downregulated by miR-22 in quiescent fibro-blasts were interferon-inducible genes (Figure 3A andSupplementary Table S3). However, most of the interferonresponse genes that were repressed by miR-22 under quies-cence did not show matches to the miR-22 seed sequence intheir 30UTRs (Figure 3A), suggesting that the downregula-tion of the majority of these genes in response to miR-22was occurring through an indirect mechanism. Indeed, theseed match enrichment improved if we excluded the inter-feron pathway genes before analyzing the seed enrichment(Supplementary Figure S4A).
To identify the direct targets of miR-22 that mediatesuppression of interferon genes, we used Ago2 IPs. Wescreened several candidate target genes that had establishedroles in activating the interferon pathway and were poten-tial miR-22 targets based on the presence of the miR-22seed sequence in their 30UTRs. From this screen, weidentified two target genes, HMGB1 and IRF5, whichshowed increased occupancy by Ago2 in miR-22-trans-fected cells compared with control and had establishedroles in activating the interferon pathway (Figure 3A andB). Both HMGB1 and IRF5 have multiple miR-22 seedmatch sequences in their 30UTRs, and HMGB1 was pre-dicted to be a miR-22 target by RNA22 (44), while IRF5was predicted to be a target of miR-22 by TargetScan (18).Other candidate genes in the interferon response pathway,which also contained miR-22 seed matches in their 30UTRs,did not show increased Ago2 occupancy, indicating thatthis assay identified specific targets (SupplementaryFigure S3B). To verify that these targets identified byAgo2 IPs could be repressed by miR-22, we cloned the30UTRs of HMGB1 and IRF5 into luciferase reporters toassay repression by miR-22. The 30UTRs of both geneswere indeed repressed by miR-22, and introducing muta-tions into the predicted miR-22 target sites relieved repres-sion, confirming that miR-22 directly targets HMGB1 andIRF5 (Figure 3C). Additionally, the transcript levels ofboth of these genes were suppressed by miR-22overexpression in HeLa cells, and protein expression wasrepressed by miR-22 overexpression in quiescent primaryhuman fibroblasts (Figure 3D and Supplementary FigureS4B). Evidence for these targets is summarized inSupplementary Table S4. Surprisingly, neither IRF5 norHMGB1 were among the many interferon genes thatshowed strongly decreased expression in HeLa cells
transfected with miR-22 as determined by microarrayprofiling (Figure 3A and Supplementary Table S3). Weassayed transcript and protein levels for both HMGB1and IRF5 in proliferating compared with quiescentprimary human fibroblasts by qRT-PCR and westernblot. Only IRF5 was significantly repressed at both thetranscript and protein level in proliferating comparedwith quiescent cells (Figure 3E and F).
miR-22 suppresses the interferon response
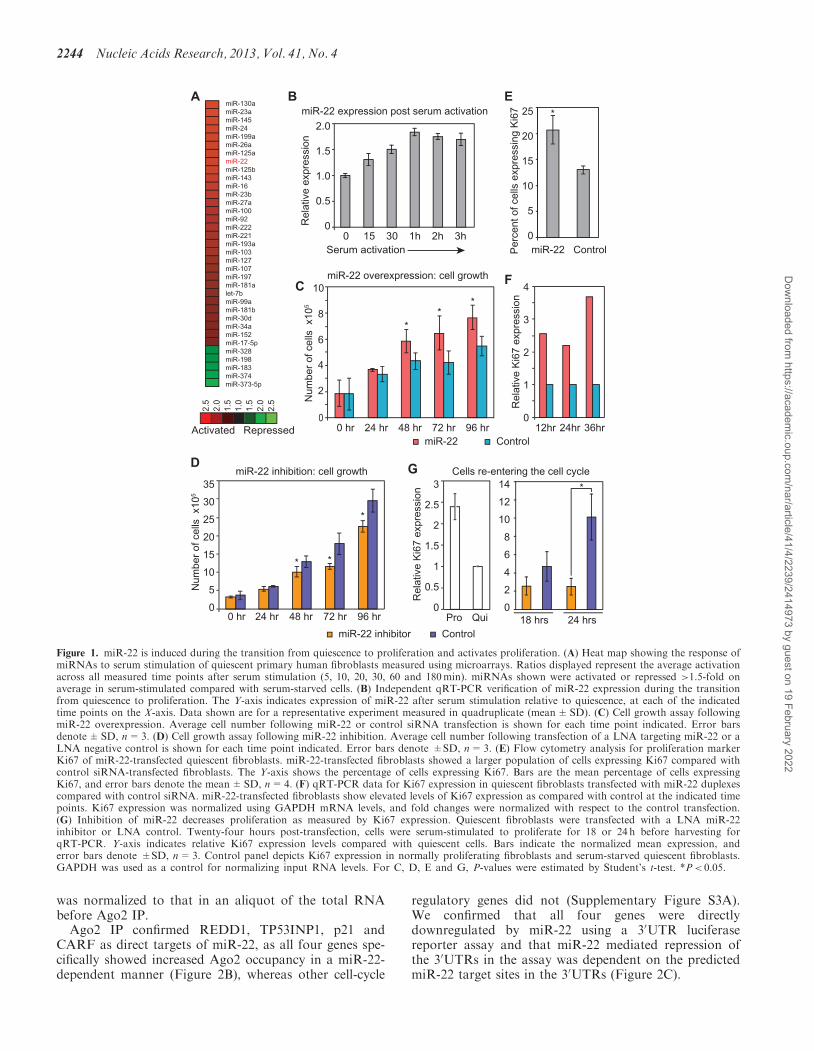
Both IRF5 and HMGB1 mediate interferon signalingpathways. IRF5 is involved in the induction ofproinflammatory cytokines in response to several differentToll-like receptor (TLR) ligands and mediates signalingdownstream of the TLR7 and TLR8 pathways to activatethe interferon-beta promoter (45,46). HMGB proteins arehighly represented in the nucleus and are responsible forregulating transcription and chromatin structure (47).However, HMGB1 was recently shown to act as a universalsensor for double-stranded RNA as well as DNA and stimu-late the interferon pathway by activating the transcriptionfactors IRF3 and NF-kB, which are essential components ofthe interferon-beta promoter ‘enhanceosome’. Additionally,HMGB1-deficient fibroblasts (Hmgb1�/�) show signifi-cantly impaired type I interferon induction (48).To establish whether miR-22 was able to functionally
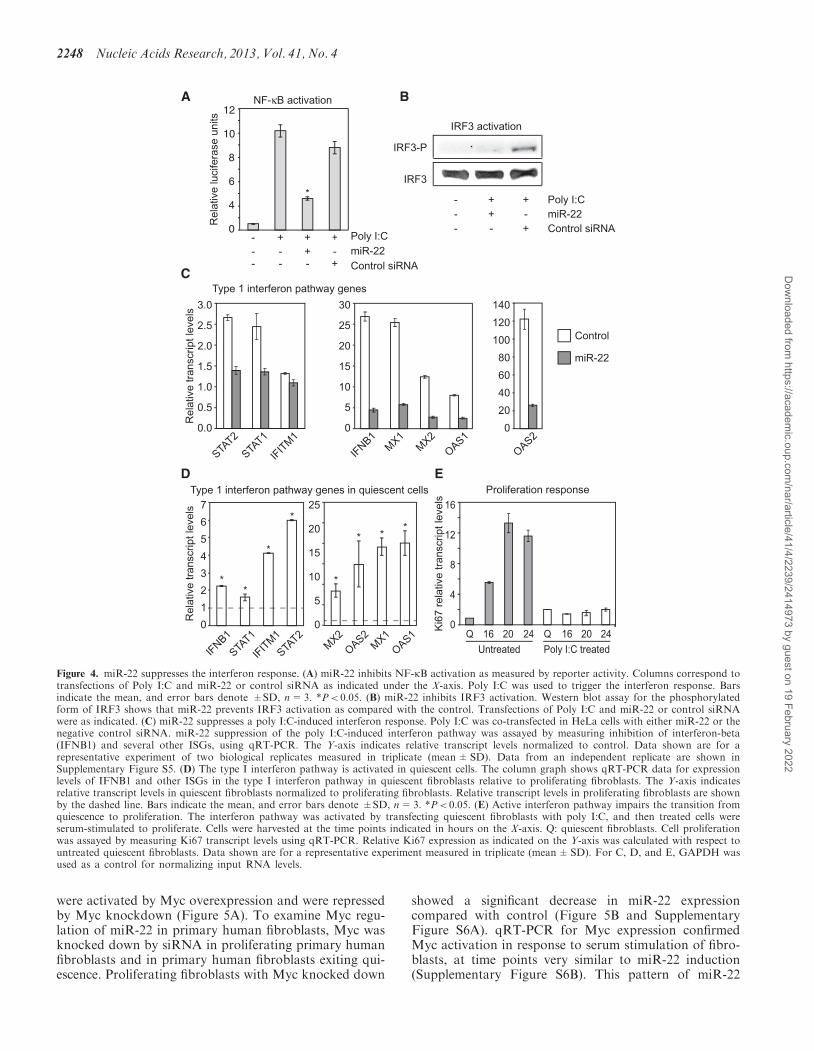
suppress HMGB1- and IRF5-activated interferon-signaling pathways, we examined the response of NF-kBand IRF3 to miR-22 after we artificially activated theinterferon pathway using poly I:C. Poly I:C is adouble-stranded RNA polymer that mimics a viral infec-tion and induces a strong type I interferon response (49).HMGB1 and IRF5 have been shown to mediate the acti-vation of the transcription factors NF-kB and IRF3, bothof which are key regulators of the interferon response(48,50). Using a reporter of NF-kB activation, we con-firmed that miR-22 inhibits NF-kB activation inresponse to a trigger of interferon activation (Figure4A). miR-22 also suppressed IRF3 phosphorylation, ahallmark of IRF3 activation, in response to activation ofthe interferon response (Figure 4B). To further character-ize miR-22-mediated suppression of interferon pathwaygenes, we asked whether miR-22 could suppress aninduced interferon response. We co-transfected miR-22duplexes and poly I:C into HeLa cells and harvestedcells 12 h later. Induction of the type I interferonresponse was measured by assaying interferon beta-1(IFNB1) and several other interferon-stimulated gene(ISG) mRNA levels by qRT-PCR. Co-transfection ofmiR-22 severely impaired normal IFNB1 and subsequentISG induction by poly I:C (Figure 4C and SupplementaryFigure S5). These results strongly indicated that miR-22was able to suppress the type I interferon response.These results combined with the observed downregula-
tion of many interferon response genes with miR-22overexpression in quiescent cells suggested that interferonresponse genes were active in quiescent cells and thatmiR-22 was capable of repressing the interferonresponse pathway. Previous cDNA profiling studies inquiescent fibroblasts have noted that interferon response
Nucleic Acids Research, 2013, Vol. 41, No. 4 2245
Dow
nloaded from https://academ
ic.oup.com/nar/article/41/4/2239/2414973 by guest on 19 February 2022
genes are activated as fibroblasts enter quiescence (51). Toconfirm that interferon response genes were activatedunder quiescence, we measured relative mRNA expressionlevels of IFNB1, a key marker and inducer of the type Iinterferon response, as well as several ISGs in proliferatingand quiescent fibroblasts. All of the interferon genes thatwe tested were expressed at higher levels in quiescent cells(Figure 4D). The interferon response is potently anti-pro-liferative (52), and the elevated expression of interferon
genes could potentially be part of intrinsic mechanismsmaintaining cellular quiescence.
To verify that an active interferon response would bedetrimental to proliferation, we artificially activated theinterferon pathway by transfecting poly I:C into quiescentfibroblasts, then stimulated them with serum to induceproliferation and assayed expression of proliferationmarker Ki67. Quiescent fibroblasts that were not treatedwith poly I:C showed efficient exit from quiescence into a
Control
Rel
ativ
e tr
ansc
ript l
evel
s
A
D
B
E
miR-22 or control transfection
Ago2 IP of RISC complex and associated MRNAs
Total RNA = Input
miR-22Input
ControlInput
mRNA qRT-PCR
or
InputqRT-PCR
Ago2 occupancy:
C
0.0
0.2
0.4
0.6
0.8
1.0
1.2
REDD1
TP53IN
P1p2
1
CARFIK
Kg
Empt
y
REDD1
TP53IN
P1p2
1
CARF
200
160
120
80
40
0
40
30
20
10
0
Ago
2 oc
cupa
ncy
Mutant UTRWild-type UTRmiR-22 Mock
miR-22
REDD1Actin
miR
-22
Contro
l
CARF
p21
TP53INP1
Actin
Actin
Actin
F
REDD1 TP53INP1 p21
0123456789
QuiescentProliferating
REDD1 TP53INP1 p21
0.0
0.2
0.4
0.6
0.8
1.0
1.2
1.4
Rel
ativ
e tr
ansc
ript l
evel
s
Rel
ativ
e lu
cife
rase
act
ivity*
*
*
*
**
*
*
* *
*
*
**
Figure 2. miR-22 targets genes mediating cell-cycle arrest. (A) Ago2 IP. Ago2 forms a complex with the miRNA and the target mRNA. Thiscomplex is immunoprecipitated and the mRNA levels are quantified with qRT-PCR. (B) Ago2 IPs identify genes mediating cell-cycle arrest andapoptosis as direct targets of miR-22. REDD1, TP53INP1, p21 and CARF transcripts show significantly higher Ago2 occupancy in miR-22–transfected HeLa cells compared with mock-transfected cells. Ago2 occupancy of the target genes transcripts was measured using qRT-PCR asdescribed in the text. The Y-axis shows fold change in mRNA levels from Ago2 IP–isolated RNA normalized to input RNA, which served as thecontrol. (C) Luciferase assays show that miR-22 directly targets the 30UTRs of the genes indicated on the X-axis. IKKg and Empty are negativecontrols. IKKg was not repressed by miR-22 and Empty is the luciferase vector with no UTR. The Y-axis shows relative luciferase units frommiR-22-transfected cells normalized to control siRNA transfection. For the mutant 30UTRs, 3 bp in each 6-mer miR-22 target site in the 30UTRswere mutated. (D) qRT-PCR results for REDD1, TP53INP1, p21 and CARF transcripts show increased expression in quiescent fibroblasts relativeto proliferating fibroblasts. Y-axis indicates fold enrichment in quiescent versus proliferating fibroblasts. (E) qRT-PCR shows miR-22 suppressesTP53INP1, REDD1 and p21 transcript levels in quiescent fibroblasts. Fold changes are denoted on the Y-axis relative to the control siRNAtransfection. (F) REDD1, TP53INP1, p21 and CARF protein expression in fibroblasts was downregulated by transfection with miR-22 comparedwith control siRNA transfection. For B, D and E, GAPDH was used as a control for normalizing input RNA levels. For B, C, D and E, barsindicate the mean, and error bars denote ±SD, n=3. P-values were estimated by Student’s t-test. *P< 0.05.
2246 Nucleic Acids Research, 2013, Vol. 41, No. 4
Dow
nloaded from https://academ
ic.oup.com/nar/article/41/4/2239/2414973 by guest on 19 February 2022

proliferative state as measured by Ki67 expression levels(Figure 4E). However, poly I:C-treated quiescent fibro-blasts showed no change in Ki67 expression levels,indicating that a heightened interferon response inhibitedtransition into a proliferative state (Figure 4E).
Myc activates miR-22 during the transition fromquiescence to proliferation
Interestingly, miRNA expression profiling of serum-stimulated primary human fibroblasts also showed
miRNAs from the miR-17-92 cluster were induced alongwith miR-22 during the serum-stimulated transition fromquiescence to proliferation (Figure 5A). The miR-17-92cluster has been shown to be directly activated by thetranscription factor Myc (53). To investigate whethermiR-22 and other serum-stimulated miRNAs were alsoregulated by Myc, we first overexpressed or knockeddown Myc in HeLa cells and assayed the resultingchanges in miRNA levels using microarrays. miR-22,and the known targets of Myc, miR-17 and miR-92,
miR-22
Mock
A
CB
D
RIG1
TRIM25
MAVS
MDA-5
IRF3 IRF7
IRF3 IRF7
TRAF6 IRAK1
TRAF6 TAK1
p50 IkB
p65p50
p65
TRIF RIP1
TLR3
TBK1 IKKe
IFNB1
IKKg
IKKa IKKB
TLR7/8/9
MYD88
TRAF6 IRKA1 IRAK4
IRF5IRF7
IRF5 IRF7
IRF5 IRF7 IRF5 IRF7
IFNA
IFNAR
JAK1 TYK
STAT1 STAT2
IRF9
STAT2STAT1
IRF9
IFIT2
IFIT1
IFITM1
IFITM3 IFITM2
MX1
OAS1
OAS2OAS3
IFI6 IFI16
IFI27 IFI35ISG15
ISG20
P P
P
P P P P
P P
P P
P
HMGB1
0.0
0.4
0.8
1.2
1.6
HMGB1 IRF5 IKKg Empty
3.0
2.0
1.0
0.0
8
4
0HMGB1 IRF5
Ago
2 oc
cupa
ncy
Wild-type UTR
Mutant UTR
Rel
ativ
e lu
cife
rase
act
ivity
miR
-22
Contro
l
HMGB1Actin
IRF5Actin
Qui
esce
nt
F
E
0.0
0.4
0.8
1.2
1.6
IRF5
Rel
ativ
e tr
ansc
ript l
evel
s
Quiescent
Proliferating
Repressed + no target Site
Repressed + Target Site
Target site + not repressed
No target site or repression
12
16
Prolife
ratin
g
* *
**
*
IRF5Actin
miR
-22
Contro
l
Figure 3. miR-22 target genes mediating interferon suppression. (A) The interferon response pathway. Green indicates genes in the pathway thatwere repressed by miR-22 in quiescent fibroblasts but have no predicted miR-22 target sites; orange indicates genes repressed by miR-22 in quiescentfibroblasts and have predicted miR-22 target sites; blue indicates genes that have predicted target sites but were not repressed by miR-22 in quiescentfibroblasts. Genes in gray do not meet any of these criteria. (B) Ago2 IPs identify HMGB1 and IRF5 as direct miR-22 targets. HMGB1 and IRF5transcripts show significantly higher Ago2 occupancy in miR-22-transfected HeLa cells compared with mock-transfected cells. Ago2 occupancy of thetarget genes transcripts was measured using qRT-PCR as described in the text. The Y-axis shows fold change in mRNA levels from Ago2 IP–isolatedRNA normalized to input RNA. (C) Luciferase assays show that miR-22 directly targets the 30UTRs of HMGB1 and IRF5. The Y-axis indicatesrelative luciferase units normalized to the control siRNA transfection. IKKg and Empty are negative controls. IKKg was not repressed by miR-22and Empty is the luciferase vector with no UTR. For the mutant 30UTRs, 3 bp in each 6-mer miR-22 target site in the 30UTRs were mutated.(D) IRF5 protein expression in fibroblasts was downregulated by transfection with miR-22 compared with control siRNA transfection. (E) Increasedexpression of IRF5 in quiescent fibroblasts relative to proliferating fibroblasts assayed by qRT-PCR. Y-axis indicates fold enrichment in quiescentversus proliferating fibroblasts. (F) IRF5 protein expression was increased in quiescent compared with proliferating fibroblasts. For B and E,GAPDH was used as a control for normalizing input RNA levels. For B, C and E, bars are the mean, and error bars denote ±SD, n=3. ForB, C, and E, P-values were estimated by Student’s t-test. *P< 0.05.
Nucleic Acids Research, 2013, Vol. 41, No. 4 2247
Dow
nloaded from https://academ
ic.oup.com/nar/article/41/4/2239/2414973 by guest on 19 February 2022
were activated by Myc overexpression and were repressedby Myc knockdown (Figure 5A). To examine Myc regu-lation of miR-22 in primary human fibroblasts, Myc wasknocked down by siRNA in proliferating primary humanfibroblasts and in primary human fibroblasts exiting qui-escence. Proliferating fibroblasts with Myc knocked down
showed a significant decrease in miR-22 expressioncompared with control (Figure 5B and SupplementaryFigure S6A). qRT-PCR for Myc expression confirmedMyc activation in response to serum stimulation of fibro-blasts, at time points very similar to miR-22 induction(Supplementary Figure S6B). This pattern of miR-22
0
4
8
12
16
Q 16 20 24 Q 16 20 24
Untreated Poly I:C treated
Ki6
7 re
lativ
e tr
ansc
ript l
evel
s
IFNB1
MX1
MX2
OAS1
STAT2
STAT1
IFIT
M1
OAS20
20
40
60
80
100
120
140
0
5
10
15
20
25
30
0.0
0.5
1.0
1.5
2.0
2.5
3.0
Rel
ativ
e tr
ansc
ript l
evel
s
Control
miR-22
BA
C
IRF3-P
IRF3
Poly I:CmiR-22Control siRNA
---
++-
+-+
Rel
ativ
e lu
cife
rase
uni
ts
Poly I:CmiR-22Control siRNA
- + + +--
-- -
++-
D
NF-κB activation
IRF3 activation
Proliferation response
Type 1 interferon pathway genes
Type 1 interferon pathway genes in quiescent cells
IFNB1
STAT1
IFIT
M1
STAT2
MX2
OAS2M
X1
OAS10
5
10
15
20
25
Rel
ativ
e tr
ansc
ript l
evel
s
0
1
2
3
4
5
6
7
E
0
4
6
8
10
12
*
**
*
*
*
* **
Figure 4. miR-22 suppresses the interferon response. (A) miR-22 inhibits NF-kB activation as measured by reporter activity. Columns correspond totransfections of Poly I:C and miR-22 or control siRNA as indicated under the X-axis. Poly I:C was used to trigger the interferon response. Barsindicate the mean, and error bars denote ±SD, n=3. *P< 0.05. (B) miR-22 inhibits IRF3 activation. Western blot assay for the phosphorylatedform of IRF3 shows that miR-22 prevents IRF3 activation as compared with the control. Transfections of Poly I:C and miR-22 or control siRNAwere as indicated. (C) miR-22 suppresses a poly I:C-induced interferon response. Poly I:C was co-transfected in HeLa cells with either miR-22 or thenegative control siRNA. miR-22 suppression of the poly I:C-induced interferon pathway was assayed by measuring inhibition of interferon-beta(IFNB1) and several other ISGs, using qRT-PCR. The Y-axis indicates relative transcript levels normalized to control. Data shown are for arepresentative experiment of two biological replicates measured in triplicate (mean±SD). Data from an independent replicate are shown inSupplementary Figure S5. (D) The type I interferon pathway is activated in quiescent cells. The column graph shows qRT-PCR data for expressionlevels of IFNB1 and other ISGs in the type I interferon pathway in quiescent fibroblasts relative to proliferating fibroblasts. The Y-axis indicatesrelative transcript levels in quiescent fibroblasts normalized to proliferating fibroblasts. Relative transcript levels in proliferating fibroblasts are shownby the dashed line. Bars indicate the mean, and error bars denote ±SD, n=3. *P< 0.05. (E) Active interferon pathway impairs the transition fromquiescence to proliferation. The interferon pathway was activated by transfecting quiescent fibroblasts with poly I:C, and then treated cells wereserum-stimulated to proliferate. Cells were harvested at the time points indicated in hours on the X-axis. Q: quiescent fibroblasts. Cell proliferationwas assayed by measuring Ki67 transcript levels using qRT-PCR. Relative Ki67 expression as indicated on the Y-axis was calculated with respect tountreated quiescent fibroblasts. Data shown are for a representative experiment measured in triplicate (mean±SD). For C, D, and E, GAPDH wasused as a control for normalizing input RNA levels.
2248 Nucleic Acids Research, 2013, Vol. 41, No. 4
Dow
nloaded from https://academ
ic.oup.com/nar/article/41/4/2239/2414973 by guest on 19 February 2022

expression in response to serum stimulation and modula-tion of Myc activity suggested that miR-22 may beactivated by Myc.
To investigate whether Myc directly activates miR-22 bybinding to upstream cis-regulatory sequences, we examined
genome-wide Myc ChIP-sequencing (ChIP-seq) datagenerated in our lab from serum-stimulated fibroblasts aswell as HeLaS3 and MCF7 cells (54). In all cell types, par-ticularly in the rapidly proliferating HeLaS3 and MCF7cells, we observed Myc binding at several sites around the
0
1
2
3
4
5
6
7A
F
Control siRNAMyc siRNA
C
miR
NA
s
miR-17-3p
miR-17-5p
miR-22
miR-92
OE KD SS
Myc
1.0
1.5
2.0
2.5
2.5
1.5
2.0
Activated Repressed
Chr17:
WDR81mir-22
Fibroblast
E-box
MIR22HG
Hela S3
1563000 1569000 15750003L1L 4L2L
PCR locations (F1 and F2)
CpG island
MCF7
D
E
0
1
2
3
0
1
2
3
L3 M1 M2 M1+M2 PL1 L2 L3 L4 P
Rel
ativ
e lu
cife
rase
act
ivity
com
pare
d to
neg
ativ
e co
ntro
l
Putative Myc binding sites Mutating Myc L3 binding site
Rel
ativ
e lu
cife
rase
act
ivity
com
pare
d to
neg
ativ
e co
ntro
l
*
* *
*
F1 F2
ChI
P-q
PC
R fo
ld e
nric
hmen
tre
lativ
e to
bac
kgro
und
Endogenous Myc expression Myc overexpression
B
Rel
ativ
e ex
pres
sion
for
miR
-22
0.0
1.2
1.0
0.8
0.6
0.4
0.2
1.4
Proliferating cells
*
*
*
Figure 5. Myc activates miR-22 during the transition from quiescence to proliferation. (A) Heat map showing the response of miRNAs to Mycoverexpression (OE), and Myc knockdown (KO) in HeLa cells, and to serum stimulation of quiescent fibroblasts (SS) measured using microarrays.Ratios displayed under the SS column represent the maximum activation across all measured time points (5, 10, 20, 30, 60 and 180min) after serumstimulation. miR-17 and miR-92 are previously known downstream targets of Myc. (B) miR-22 expression is inhibited by Myc knockdown inproliferating fibroblasts. miR-22 expression was assayed by qRT-PCR in fibroblasts transfected with an siRNA against Myc or a control siRNA.Relative expression values were normalized to those obtained using the control siRNA (Y-axis). (C) ChIP-seq data for Myc in HeLaS3, MCF7 andserum-stimulated fibroblasts show Myc binding upstream of miR-22. The profiles of overlapping extended ChIP-seq reads are indicated in green.Chromosome coordinates are indicated on top and genes are shown at bottom. MIR22HG refers to the primary miR-22 transcript as annotated inRefSeq, and the mature miR-22 sequence is indicated by a red symbol. Regions (L1–L4) subsequently tested for promoter activity in luciferase assaysare shown by black rectangles, phylogenetically conserved E-boxes by vertical blue lines and CpG islands and qPCR primer loci by vertical blacklines. (D) ChIP-qPCR verification of Myc binding upstream of miR-22. An independent ChIP for Myc was performed in serum-stimulated fibro-blasts. Primers were designed to amplify two loci (F1 and F2) indicated as binding sites by ChIP-seq. Fold enrichment, indicative of Myc binding,was calculated relative to input DNA, normalized to a negative control region (Y-axis). The threshold for ChIP enrichment relative to the control isindicated by the red dashed line. (E) Promoter assays for 4 Myc putative promoter regions upstream of miR-22. L1–L4 on the X-axis indicate clonedcandidate promoter regions. P is a positive control. The Y-axis shows expression fold change of a luciferase promoter reporter normalized to anegative control vector. The L3 region shows a significant increase in reporter activity when Myc is overexpressed. (F) Mutation of putativeMyc-binding sites M1 and M2 in the L3 promoter region. M1+M2 indicates both sites were mutated. For E and F, gray bars indicate Mycoverexpression and white bars indicate endogenous levels of Myc (Myc was not overexpressed). For B, D, E and F, bars indicate the mean, and errorbars denote ±SD, n=3. For B, E and F, *P< 0.05.
Nucleic Acids Research, 2013, Vol. 41, No. 4 2249
Dow
nloaded from https://academ
ic.oup.com/nar/article/41/4/2239/2414973 by guest on 19 February 2022

predicted transcription start site of miR-22 (55) (Figure5C). Myc is known to bind its chromosomal target sitesin mammalian cells, including human fibroblasts, througha DNA motif known as the E-box (31). Motif analysis ofthe region upstream of miR-22 revealed phylogeneticallyconserved E-box elements within the Myc-binding sitesthat we identified by ChIP-seq, many of which occurredwithin CpG islands (Figure 5C). Phylogenetic conservationof putative regulatory elements is frequently an indicationof functional significance, and the genomic binding of Mycis known to be associated with the proximal presence ofCpG islands (56). As an example, we verified Myc bindingto one of the sites detected by ChIP-seq in an independentexperiment by carrying out ChIP-qPCR in fibroblasts thatwere induced to proliferate (Figure 5D). In addition,luciferase promoter reporter assays using Myc-bindingregions upstream of miR-22 showed that Myc could func-tionally activate gene expression through one of theseupstream promoter regions (L3) (Figure 5E). The L3promoter region site contains two putative Myc-bindingsite motifs (M1 and M2), but mutation of the putativeMyc-binding site motifs did not impair activation by Mycin the reporter assay in a consistent manner (Figure 5F).These results nevertheless show that miR-22 expression isresponsive to Myc and that Myc binds to the promoter ofmiR-22 and activates its transcription in a manner that isconsistent with direct activation, both in HeLa cells as wellas fibroblasts during their exit from quiescence.
miR-22 inhibits the Myc repressor MXD4
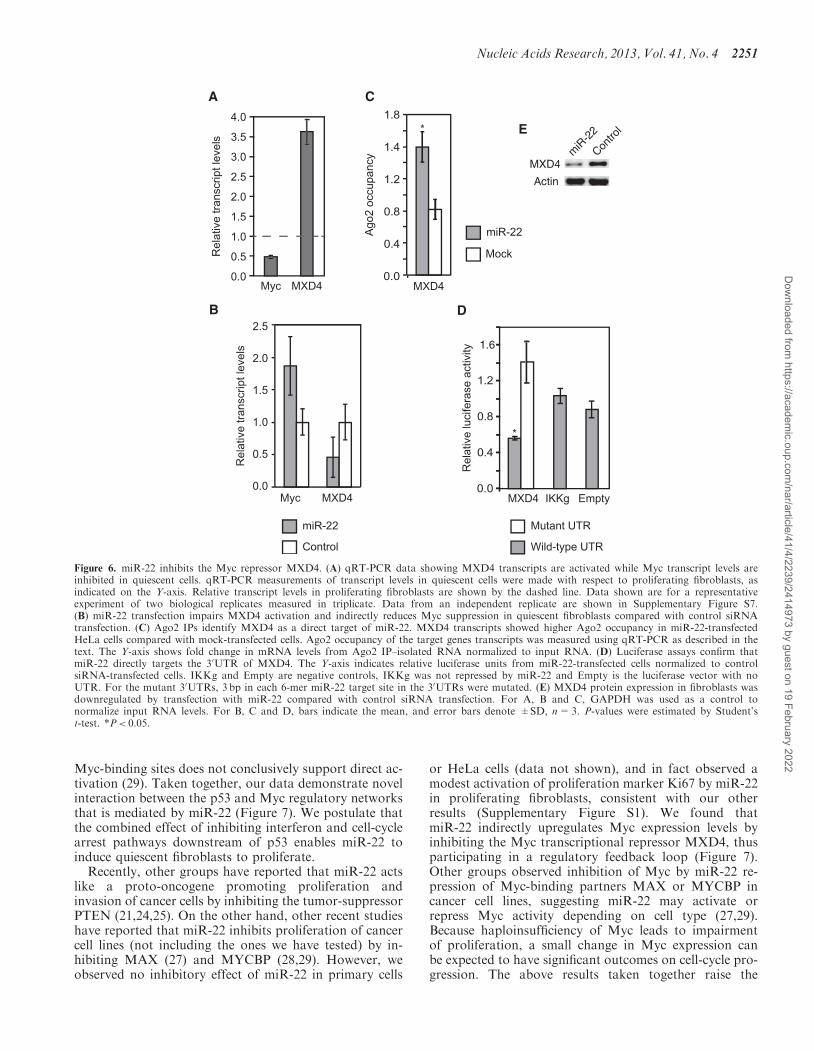
Another target of miR-22 that we identified was MXD4, atranscriptional repressor of Myc, which in turn isrepressed by Myc (57,58). We found that MXD4 tran-script levels were activated and Myc levels were sup-pressed when cells entered quiescence (Figure 6A andSupplementary Figure S7). miR-22 transfection impairedMXD4 activation and Myc suppression under quiescence(Figure 6B). We verified using Ago2 IP and 30UTRluciferase reporter assays that MXD4 was indeed adirect target of miR-22 (Figure 6C and D). Western blotconfirmed miR-22 downregulated MXD4 expression atthe protein level in primary human fibroblasts (6E).These results suggest the existence of a feedback loop inwhich Myc activates miR-22 to suppress MXD4, whichcauses the upregulation of Myc expression.
DISCUSSION
Our results show a TF–miRNA network that is activatedas primary fibroblasts exit quiescence and re-enter the cellcycle. The oncogenic transcription factor Myc bindsupstream of miR-22 and activates miR-22 expressionwhen quiescent fibroblasts are stimulated to proliferate.In addition, we show that miR-22 promotes proliferationin primary human fibroblasts, and we identified targets ofmiR-22 that include several cell-cycle arrest genes,REDD1, TP53INP1, p21 and CARF, as well as MXD4,which represses Myc. Although the effect of miR-22 onthe protein levels of cell-cycle arrest genes was modest,moderate regulation of multiple cell-cycle arrest genes
may have large phenotypic effects in concert. We alsofound that miR-22 targets genes that mediate the inter-feron response, HMGB1 and IRF5, and that miR-22 re-pressed the interferon response.
The early activation of miR-22 we observed as cells exitquiescence and re-enter the cell cycle may be rationalizedin terms of its effect on the interferon response and cell-cycle arrest genes. Although the interferon response isknown to be antagonistic to cell proliferation, the exactrole of the interferon response genes during quiescence isunclear (52). It has been suggested that signaling pathwaysactively maintain cells in a viable, reversibly arrested stage(59). It is possible that high levels of interferon responsegenes are required for maintaining or inducing a state ofcell-cycle arrest in quiescent cells. Indeed, upregulation ofinterferon response genes in cells entering quiescence hasbeen observed, and interferon has long been known torepress proliferation in fibroblasts (51,60). Consequently,to exit quiescence and begin to proliferate, cells mustovercome this inhibitory influence on proliferation.When we artificially upregulated the interferon pathwayunder quiescence, entry into proliferation in response toserum-stimulation was severely impaired. One of themeans by which cells may overcome this inhibitory effectis to use an immediate-early transcription factor like Mycto activate a suppressor of the interferon pathway,namely, the miRNA miR-22 (Figure 7). We found thatmiR-22 functionally inhibits NF-kB and IRF3 activationby directly targeting and downregulating HMGB1 andIRF5, which are known activators of the interferon acti-vation pathway, thus identifying the molecular basis ofhow miR-22 mediates interferon suppression. Inaddition, HMGB1 has recently been shown to regulateproliferation, and it influences both wound healing andcancer progression (58,59). Surprisingly, HMGB1 wasnot downregulated in quiescent primary human fibro-blasts. However, IRF5 was downregulated in quiescentprimary human fibroblasts, indicating that the inter-feron-mediated maintenance of quiescence may only beregulated by IRF5 in primary human fibroblasts.
We also present evidence that reveals novel cross-talkbetween the p53 and Myc regulatory networks that ismediated by miR-22. We show that miR-22 targetscell-cycle arrest pathways that are mediated by thetumor-suppressor p53. IRF5 is known to be a directtarget of p53 and promotes cell-cycle arrest and celldeath (61,62). IRF5 also induces senescence whenoverexpressed in immortalized Li–Fraumeni fibroblasts(63). Additionally, we find that miR-22 directly inhibitsother pro-apoptotic and cell-cycle arrest genes such asREDD1, TP53INP1, p21 and CARF that are also directtargets of or regulate p53 (Figure 7). Interestingly, miR-22itself is known to be a direct target of p53, and miR-22determines p53-dependent cellular fate through directregulation of p21 (28). In addition, previous studies haveshown a p53-dependent suppression of Myc at the tran-scriptional and post-transcriptional level (64,65).Furthermore, our data show upstream binding and acti-vation of miR-22 by Myc. A group previously observedsimilar results and concluded that this indicated direct ac-tivation of miR-22 by Myc, but our further analysis of
2250 Nucleic Acids Research, 2013, Vol. 41, No. 4
Dow
nloaded from https://academ
ic.oup.com/nar/article/41/4/2239/2414973 by guest on 19 February 2022
Myc-binding sites does not conclusively support direct ac-tivation (29). Taken together, our data demonstrate novelinteraction between the p53 and Myc regulatory networksthat is mediated by miR-22 (Figure 7). We postulate thatthe combined effect of inhibiting interferon and cell-cyclearrest pathways downstream of p53 enables miR-22 toinduce quiescent fibroblasts to proliferate.
Recently, other groups have reported that miR-22 actslike a proto-oncogene promoting proliferation andinvasion of cancer cells by inhibiting the tumor-suppressorPTEN (21,24,25). On the other hand, other recent studieshave reported that miR-22 inhibits proliferation of cancercell lines (not including the ones we have tested) by in-hibiting MAX (27) and MYCBP (28,29). However, weobserved no inhibitory effect of miR-22 in primary cells
or HeLa cells (data not shown), and in fact observed amodest activation of proliferation marker Ki67 by miR-22in proliferating fibroblasts, consistent with our otherresults (Supplementary Figure S1). We found thatmiR-22 indirectly upregulates Myc expression levels byinhibiting the Myc transcriptional repressor MXD4, thusparticipating in a regulatory feedback loop (Figure 7).Other groups observed inhibition of Myc by miR-22 re-pression of Myc-binding partners MAX or MYCBP incancer cell lines, suggesting miR-22 may activate orrepress Myc activity depending on cell type (27,29).Because haploinsufficiency of Myc leads to impairmentof proliferation, a small change in Myc expression canbe expected to have significant outcomes on cell-cycle pro-gression. The above results taken together raise the
MockRel
ativ
e tr
ansc
ript l
evel
s
0.0
0.5
1.0
1.5
2.0
2.5
3.0
3.5
4.0
MXD4Myc
A C
D
0.0
0.4
0.8
1.2
0.0
0.4
0.8
1.2
1.4
1.8
MXD4
MXD4
1.6
Ago
2 oc
cupa
ncy
*
miR-22
Wild-type UTR
Mutant UTR
IKKg Empty
Rel
ativ
e lu
cife
rase
act
ivity
*
miR-22
Control
0.0
0.5
1.0
1.5
2.0
2.5
MXD4Myc
Rel
ativ
e tr
ansc
ript l
evel
s
miR
-22
Contro
l
MXD4
Actin
B
E
Figure 6. miR-22 inhibits the Myc repressor MXD4. (A) qRT-PCR data showing MXD4 transcripts are activated while Myc transcript levels areinhibited in quiescent cells. qRT-PCR measurements of transcript levels in quiescent cells were made with respect to proliferating fibroblasts, asindicated on the Y-axis. Relative transcript levels in proliferating fibroblasts are shown by the dashed line. Data shown are for a representativeexperiment of two biological replicates measured in triplicate. Data from an independent replicate are shown in Supplementary Figure S7.(B) miR-22 transfection impairs MXD4 activation and indirectly reduces Myc suppression in quiescent fibroblasts compared with control siRNAtransfection. (C) Ago2 IPs identify MXD4 as a direct target of miR-22. MXD4 transcripts showed higher Ago2 occupancy in miR-22-transfectedHeLa cells compared with mock-transfected cells. Ago2 occupancy of the target genes transcripts was measured using qRT-PCR as described in thetext. The Y-axis shows fold change in mRNA levels from Ago2 IP–isolated RNA normalized to input RNA. (D) Luciferase assays confirm thatmiR-22 directly targets the 30UTR of MXD4. The Y-axis indicates relative luciferase units from miR-22-transfected cells normalized to controlsiRNA-transfected cells. IKKg and Empty are negative controls, IKKg was not repressed by miR-22 and Empty is the luciferase vector with noUTR. For the mutant 30UTRs, 3 bp in each 6-mer miR-22 target site in the 30UTRs were mutated. (E) MXD4 protein expression in fibroblasts wasdownregulated by transfection with miR-22 compared with control siRNA transfection. For A, B and C, GAPDH was used as a control tonormalize input RNA levels. For B, C and D, bars indicate the mean, and error bars denote ±SD, n=3. P-values were estimated by Student’st-test. *P< 0.05.
Nucleic Acids Research, 2013, Vol. 41, No. 4 2251
Dow
nloaded from https://academ
ic.oup.com/nar/article/41/4/2239/2414973 by guest on 19 February 2022

intriguing possibility that miR-22 may act as a switchinducing or inhibiting cellular proliferation in a context-dependent manner. This study provides evidence thatmiRNAs upregulated during the transition of quiescentcells into a proliferative state have a defined functionalrole in reprogramming gene expression to enable the tran-sition of G0 arrested cells into the cycling G1 stage.Furthermore, our results provide evidence of thecomplex interplay between transcription factors andmiRNAs to transduce extracellular signals into physio-logical responses.
SUPPLEMENTARY DATA
Supplementary Data are available at NAR Online:Supplementary Tables 1–4 and Supplementary Figures1–7.
ACKNOWLEDGEMENTS
We thank Chris Sullivan for the Luciferase reporters andfor discussion, Klause Linse for help with the Luciferaseassay, Anna Battenhouse for help with the ChIP-Seqanalysis and Richard Salinas for help with flow cytometry.
FUNDING
National Institutes of Health (NIH) [CA130075]; CancerPrevention and Research Institute of Texas [RP120194to V.R.I.]. Funding for open access charge: NIH[CA130075], Cancer Prevention and Research Instituteof Texas [RP120194].
Conflict of interest statement. None declared.
REFERENCES
1. Yusuf,I. and Fruman,D.A. (2003) Regulation of quiescence inlymphocytes. Trends Immunol., 24, 380–386.
2. White,P., Brestelli,J.E., Kaestner,K.H. and Greenbaum,L.E.(2005) Identification of transcriptional networks during liverregeneration. J. Biol. Chem., 280, 3715–3722.
3. Tzachanis,D., Lafuente,E.M., Li,L. and Boussiotis,V.A. (2004)Intrinsic and extrinsic regulation of T lymphocyte quiescence.Leuk. Lymphoma, 45, 1959–1967.
4. Martin,P. (1997) Wound healing–aiming for perfect skinregeneration. Science, 276, 75–81.
5. Malumbres,M. and Barbacid,M. (2001) To cycle or notto cycle: a critical decision in cancer. Nat. Rev. Cancer, 1,222–231.
6. Chang,H.Y., Sneddon,J.B., Alizadeh,A.A., Sood,R., West,R.B.,Montgomery,K., Chi,J.T., van de Rijn,M., Botstein,D. andBrown,P.O. (2004) Gene expression signature of fibroblast serumresponse predicts human cancer progression: similarities betweentumors and wounds. PLoS Biol., 2, E7.
7. Chang,H.Y., Nuyten,D.S.A., Sneddon,J.B., Hastie,T.,Tibshirani,R., Sørlie,T., Dai,H., He,Y.D., Van’t Veer,L.J.,Bartelink,H. et al. (2005) Robustness, scalability, and integrationof a wound-response gene expression signature in predictingbreast cancer survival. Proc. Natl Acad. Sci. USA, 102,3738–3743.
8. Iyer,V.R., Eisen,M.B., Ross,D.T., Schuler,G., Moore,T., Lee,J.C.,Trent,J.M., Staudt,L.M., Hudson,J. Jr, Boguski,M.S. et al. (1999)The transcriptional program in the response of human fibroblaststo serum. Science, 283, 83–87.
9. Gu,J. and Iyer,V.R. (2006) PI3K signaling and miRNAexpression during the response of quiescent human fibroblasts todistinct proliferative stimuli. Genome Biol., 7, R42.
10. Bartel,D.P. (2009) MicroRNAs: target recognition and regulatoryfunctions. Cell, 136, 215–233.
11. Chen,J.F., Mandel,E.M., Thomson,J.M., Wu,Q., Callis,T.E.,Hammond,S.M., Conlon,F.L. and Wang,D.Z. (2006) The role ofmicroRNA-1 and microRNA-133 in skeletal muscle proliferationand differentiation. Nat. Genet., 38, 228–233.
12. Croce,C.M. and Calin,G.A. (2005) miRNAs, cancer, and stemcell division. Cell, 122, 6–7.
13. Lim,L.P., Lau,N.C., Garrett-Engele,P., Grimson,A., Schelter,J.M.,Castle,J., Bartel,D.P., Linsley,P.S. and Johnson,J.M. (2005)
Mitogenic stimuliQuiescence
Interferon
p53
Myc
MXD4
Cell cycle arrest
Proliferation
miR-22
G0
REDD1
TP53INP1
p21
CARF
HMGB1IRF5
?
Figure 7. The anti-quiescence network mediated by the Myc-miR-22 pathway.
2252 Nucleic Acids Research, 2013, Vol. 41, No. 4
Dow
nloaded from https://academ
ic.oup.com/nar/article/41/4/2239/2414973 by guest on 19 February 2022
Microarray analysis shows that some microRNAs downregulatelarge numbers of target mRNAs. Nature, 433, 769–773.
14. Wang,Y., Stricker,H.M., Gou,D. and Liu,L. (2007) MicroRNA:past and present. Front Biosci., 12, 2316–2329.
15. Yekta,S., Shih,I.-H. and Bartel,D.P. (2004) MicroRNA-directedcleavage of HOXB8 mRNA. Science, 304, 594–596.
16. Zhang,B., Wang,Q. and Pan,X. (2007) MicroRNAs and theirregulatory roles in animals and plants. J. Cell. Physiol., 210,279–289.
17. Friedman,R.C., Farh,K.K., Burge,C.B. and Bartel,D.P. (2009)Most mammalian mRNAs are conserved targets of microRNAs.Genome Res., 19, 92–105.
18. Grimson,A., Farh,K.K., Johnston,W.K., Garrett-Engele,P.,Lim,L.P. and Bartel,D.P. (2007) MicroRNA targeting specificityin mammals: determinants beyond seed pairing. Mol. Cell, 27,91–105.
19. Deng,S., Calin,G.A., Croce,C.M., Coukos,G. and Zhang,L. (2008)Mechanisms of microRNA deregulation in human cancer. CellCycle, 7, 2643–2646.
20. Kumar,M.S., Lu,J., Mercer,K.L., Golub,T.R. and Jacks,T. (2007)Impaired microRNA processing enhances cellular transformationand tumorigenesis. Nat. Genet., 39, 673–677.
21. Bar,N. and Dikstein,R. (2010) miR-22 forms a regulatory loop inPTEN/AKT pathway and modulates signaling kinetics. PLoSOne, 5, e10859.
22. Huang,S., Wang,S., Bian,C., Yang,Z., Zhou,H., Zeng,Y., Li,H.,Han,Q. and Zhao,R.C. (2012) Up-regulation of miR-22 promotesosteogenic differentiation and inhibits adipogenic differentiationof human adipose tissue-derived mesenchymal stem cells byrepressing HDAC6 Protein Expression. Stem Cells Dev., 21,2531–2540.
23. Li,J., Liang,S., Yu,H., Zhang,J., Ma,D. and Lu,X. (2010) Aninhibitory effect of miR-22 on cell migration and invasion inovarian cancer. Gynecol. Oncol., 119, 543–548.
24. Liu,L., Jiang,Y., Zhang,H., Greenlee,A.R., Yu,R. and Yang,Q.(2010) miR-22 functions as a micro-oncogene in transformedhuman bronchial epithelial cells induced by anti-benzo[a]pyrene-7,8-diol-9,10-epoxide. Toxicol. In Vitro, 24, 1168–1175.
25. Poliseno,L., Salmena,L., Riccardi,L., Fornari,A., Song,M.S.,Hobbs,R.M., Sportoletti,P., Varmeh,S., Egia,A., Fedele,G. et al.(2010) Identification of the miR-106b�25 microRNA cluster as aproto-oncogenic PTEN-targeting intron that cooperates with itshost gene MCM7 in transformation. Sci. Signal., 3, ra29.
26. Tan,P.-H., Bay,B.-H., Yip,G., Selvarajan,S., Tan,P., Wu,J.,Lee,C.-H. and Li,K.-B. (2005) Immunohistochemical detection ofKi67 in breast cancer correlates with transcriptional regulation ofgenes related to apoptosis and cell death. Mod. Pathol., 18,374–381.
27. Ting,Y., Medina,D.J., Strair,R.K. and Schaar,D.G. (2010)Differentiation-associated miR-22 represses Max expression andinhibits cell cycle progression. Biochem. Biophys. Res. Commun.,394, 606–611.
28. Tsuchiya,N., Izumiya,M., Ogata-Kawata,H., Okamoto,K.,Fujiwara,Y., Nakai,M., Okabe,A., Schetter,A.J., Bowman,E.D.,Midorikawa,Y. et al. (2011) Tumor suppressor miR-22 determinesp53-dependent cellular fate through post-transcriptional regulationof p21. Cancer Res., 71, 4628–4639.
29. Xiong,J., Du,Q. and Liang,Z. (2010) Tumor-suppressivemicroRNA-22 inhibits the transcription of E-box-containingc-Myc target genes by silencing c-Myc binding protein. Oncogene,29, 4980–4988.
30. Xu,D., Takeshita,F., Hino,Y., Fukunaga,S., Kudo,Y., Tamaki,A.,Matsunaga,J., Takahashi,R.-U., Takata,T., Shimamoto,A. et al.(2011) miR-22 represses cancer progression by inducing cellularsenescence. J. Cell Biol., 193, 409–424.
31. Kim,J., Lee,J.H. and Iyer,V.R. (2008) Global identification ofMyc target genes reveals its direct role in mitochondrialbiogenesis and its E-box usage in vivo. PLoS One, 3, e1798.
32. Katome,T., Obata,T., Matsushima,R., Masuyama,N.,Cantley,L.C., Gotoh,Y., Kishi,K., Shiota,H. and Ebina,Y. (2003)Use of RNA interference-mediated gene silencing and adenoviraloverexpression to elucidate the roles of AKT/protein kinase Bisoforms in insulin actions. J. Biol. Chem., 278, 28312–28323.
33. Dennis,G. Jr, Sherman,B.T., Hosack,D.A., Yang,J., Gao,W.,Lane,H.C. and Lempicki,R.A. (2003) DAVID: Database forAnnotation, Visualization, and Integrated Discovery. GenomeBiol., 4, P3.
34. Lee,B.-K., Bhinge,A.A. and Iyer,V.R. (2011) Wide-rangingfunctions of E2F4 in transcriptional activation and repressionrevealed by genome-wide analysis. Nucleic Acids Res., 39,3558–3573.
35. Hendrickson,D.G., Hogan,D.J., McCullough,H.L., Myers,J.W.,Herschlag,D., Ferrell,J.E. and Brown,P.O. (2009) Concordantregulation of translation and mRNA abundance for hundreds oftargets of a human microRNA. PLoS Biol., 7, e1000238.
36. Brizova,H., Kalinova,M., Krskova,L., Mrhalova,M. and Kodet,R.(2010) A novel quantitative PCR of proliferation markers (Ki-67,topoisomerase IIalpha, and TPX2): an immunohistochemicalcorrelation, testing, and optimizing for mantle cell lymphoma.Virchows Arch., 456, 671–679.
37. Baek,D., Villen,J., Shin,C., Camargo,F.D., Gygi,S.P. andBartel,D.P. (2008) The impact of microRNAs on protein output.Nature, 455, 64–71.
38. el-Deiry,W.S., Tokino,T., Velculescu,V.E., Levy,D.B., Parsons,R.,Trent,J.M., Lin,D., Mercer,W.E., Kinzler,K.W. and Vogelstein,B.(1993) WAF1, a potential mediator of p53 tumor suppression.Cell, 75, 817–825.
39. Ellisen,L.W., Ramsayer,K.D., Johannessen,C.M., Yang,A.,Beppu,H., Minda,K., Oliner,J.D., McKeon,F. and Haber,D.A.(2002) REDD1, a developmentally regulated transcriptional targetof p63 and p53, links p63 to regulation of reactive oxygenspecies. Mol. Cell, 10, 995–1005.
40. Okamura,S., Arakawa,H., Tanaka,T., Nakanishi,H., Ng,C.C.,Taya,Y., Monden,M. and Nakamura,Y. (2001) p53DINP1, ap53-inducible gene, regulates p53-dependent apoptosis. Mol. Cell,8, 85–94.
41. Hasan,K., Cheung,C., Kaul,Z., Shah,N., Sakaushi,S.,Sugimoto,K., Oka,S., Kaul,S.C. and Wadhwa,R. (2009) CARF Isa vital dual regulator of cellular senescence and apoptosis.J. Biol. Chem., 284, 1664–1672.
42. Abbas,T. and Dutta,A. (2009) p21 in cancer: intricate networksand multiple activities. Nat. Rev. Cancer, 9, 400–414.
43. Karginov,F.V., Conaco,C., Xuan,Z., Schmidt,B.H., Parker,J.S.,Mandel,G. and Hannon,G.J. (2007) A biochemical approach toidentifying microRNA targets. Proc. Natl Acad. Sci. USA, 104,19291–19296.
44. Miranda,K.C., Huynh,T., Tay,Y., Ang,Y.S., Tam,W.L.,Thomson,A.M., Lim,B. and Rigoutsos,I. (2006) A pattern-basedmethod for the identification of MicroRNA binding sites andtheir corresponding heteroduplexes. Cell, 126, 1203–1217.
45. Schoenemeyer,A., Barnes,B.J., Mancl,M.E., Latz,E., Goutagny,N.,Pitha,P.M., Fitzgerald,K.A. and Golenbock,D.T. (2005) Theinterferon regulatory factor, IRF5, is a central mediator oftoll-like receptor 7 signaling. J. Biol. Chem., 280, 17005–17012.
46. Takaoka,A., Yanai,H., Kondo,S., Duncan,G., Negishi,H.,Mizutani,T., Kano,S., Honda,K., Ohba,Y., Mak,T.W. et al.(2005) Integral role of IRF-5 in the gene induction programmeactivated by Toll-like receptors. Nature, 434, 243–249.
47. Bianchi,M.E. and Manfredi,A.A. (2007) High-mobility group box1 (HMGB1) protein at the crossroads between innate andadaptive immunity. Immunol. Rev., 220, 35–46.
48. Yanai,H., Ban,T., Wang,Z., Choi,M.K., Kawamura,T.,Negishi,H., Nakasato,M., Lu,Y., Hangai,S., Koshiba,R. et al.(2009) HMGB proteins function as universal sentinels fornucleic-acid-mediated innate immune responses. Nature, 462,99–103.
49. Yoneyama,M., Kikuchi,M., Natsukawa,T., Shinobu,N.,Imaizumi,T., Miyagishi,M., Taira,K., Akira,S. and Fujita,T.(2004) The RNA helicase RIG-I has an essential function indouble-stranded RNA-induced innate antiviral responses. Nat.Immunol., 5, 730–737.
50. Pandey,A.K., Yang,Y., Jiang,Z., Fortune,S.M., Coulombe,F.,Behr,M.A., Fitzgerald,K.A., Sassetti,C.M. and Kelliher,M.A.(2009) NOD2, RIP2 and IRF5 play a critical role in the type Iinterferon response to Mycobacterium tuberculosis. PLoS Pathog.,5, e1000500.
Nucleic Acids Research, 2013, Vol. 41, No. 4 2253
Dow
nloaded from https://academ
ic.oup.com/nar/article/41/4/2239/2414973 by guest on 19 February 2022

51. Liu,H., Adler,A.S., Segal,E. and Chang,H.Y. (2007) Atranscriptional program mediating entry into cellular quiescence.PLoS Genet., 3, e91.
52. Fensterl,V. and Sen,G.C. (2009) Interferons and viral infections.Biofactors, 35, 14–20.
53. O’Donnell,K.A., Wentzel,E.A., Zeller,K.I., Dang,C.V. andMendell,J.T. (2005) c-Myc-regulated microRNAs modulate E2F1expression. Nature, 435, 839–843.
54. Lee,B.-K., Bhinge,A.A., Battenhouse,A., McDaniell,R.M., Liu,Z.,Song,L., Ni,Y., Birney,E., Lieb,J.D., Furey,T.S. et al. (2012)Cell-type specific and combinatorial usage of diverse transcriptionfactors revealed by genome-wide binding studies in multiplehuman cells. Genome Res., 22, 9–24.
55. Marson,A., Levine,S.S., Cole,M.F., Frampton,G.M.,Brambrink,T., Johnstone,S., Guenther,M.G., Johnston,W.K.,Wernig,M., Newman,J. et al. (2008) Connecting microRNA genesto the core transcriptional regulatory circuitry of embryonic stemcells. Cell, 134, 521–533.
56. Mao,D.Y., Watson,J.D., Yan,P.S., Barsyte-Lovejoy,D.,Khosravi,F., Wong,W.W., Farnham,P.J., Huang,T.H. andPenn,L.Z. (2003) Analysis of Myc bound loci identified by CpGisland arrays shows that Max is essential for Myc-dependentrepression. Curr. Biol., 13, 882–886.
57. Kime,L. and Wright,S.C. (2003) Mad4 is regulated by atranscriptional repressor complex that contains Miz-1 and c-Myc.Biochem. J., 370, 291–298.
58. Marcotte,R., Chen,J.M., Huard,S. and Wang,E. (2005) c-Myccreates an activation loop by transcriptionally repressing its own
functional inhibitor, hMad4, in young fibroblasts, a loop lost inreplicatively senescent fibroblasts. J. Cell. Biochem., 96,1071–1085.
59. Coller,H.A., Sang,L. and Roberts,J.M. (2006) A new descriptionof cellular quiescence. PLoS Biol., 4, e83.
60. Taylor-Papadimitriou,J., Balkwill,F., Ebsworth,N. andRozengurt,E. (1985) Antiviral and antiproliferative effects ofinterferons in quiescent fibroblasts are dissociable. Virology, 147,405–412.
61. Barnes,B.J., Kellum,M.J., Pinder,K.E., Frisancho,J.A. andPitha,P.M. (2003) Interferon regulatory factor 5, a novel mediatorof cell cycle arrest and cell death. Cancer Res., 63, 6424–6431.
62. Mori,T., Anazawa,Y., Iiizumi,M., Fukuda,S., Nakamura,Y. andArakawa,H. (2002) Identification of the interferon regulatoryfactor 5 gene (IRF-5) as a direct target for p53. Oncogene, 21,2914–2918.
63. Li,Q., Tang,L., Roberts,P.C., Kraniak,J.M., Fridman,A.L.,Kulaeva,O.I., Tehrani,O.S. and Tainsky,M.A. (2008) Interferonregulatory factors IRF5 and IRF7 inhibit growth and inducesenescence in immortal Li-Fraumeni fibroblasts. Mol. Cancer Res.,6, 770–784.
64. Ho,A. and Dowdy,S.F. (2002) Regulation of G(1) cell-cycleprogression by oncogenes and tumor suppressor genes. Curr.Opin. Genet. Dev., 12, 47–52.
65. Sachdeva,M., Zhu,S., Wu,F., Wu,H., Walia,V., Kumar,S.,Elble,R., Watabe,K. and Mo,Y.Y. (2009) p53 represses c-Mycthrough induction of the tumor suppressor miR-145. Proc. NatlAcad. Sci. USA, 106, 3207–3212.
2254 Nucleic Acids Research, 2013, Vol. 41, No. 4
Dow
nloaded from https://academ
ic.oup.com/nar/article/41/4/2239/2414973 by guest on 19 February 2022