A Multidimensional QoE Monitoring System for Audiovisual ... · A Multidimensional QoE Monitoring...
7
A Multidimensional QoE Monitoring System for Audiovisual and Haptic Interactive IP Communications Eiichi Isomura * , Shuji Tasaka † , and Toshiro Nunome * * Graduate School of Engineering, Nagoya Institute of Technology, Nagoya 466–8555, Japan † Interdisciplinary Engineering Laboratory, Nagoya Institute of Technology, Nagoya 466–8555, Japan Abstract—This paper deals with audiovisual and haptic inter- active IP communications and designs a multidimensional QoE monitoring system with the QoE estimation in real time. For the estimation, we carry out regression analysis between QoE and application-level QoS and obtain equations for the estimation. We measured the application-level QoS and made a subjective experiment by assessing QoE multidimensionally with the SD method. To monitor QoE, we derive estimates for three QoE metrics. We apply linear and non-linear regression analysis to the experimental results. As a result, we find that the obtained equations can estimate QoE with high accuracy. By using the equations, we have built the QoE monitoring system. Index Terms—interactive IP communications, audiovisual and haptic, QoE, real time estimation, QoE monitoring I. I NTRODUCTION Haptic devices attract people’s attention as new human inter- face devices, which are expected to spread through consumer environments [1], [2]. Combinations of haptic devices and audiovisual ones can enhance users’ experience, in particular the one of the telepresence, which is one of the most promising applications in the near future multimedia IP consumer com- munications. Audiovisual and haptic interactive IP communications in the real space can provide the users with high realistic sensation and high quality of interactivity; this enables the users to immerse into the work easily. For enhancement of physical intimacies in remote interaction, a haptic audiovisual telecon- ferencing system with a haptic jacket is presented in [3]. In [4], a haptic media is used for training and mastering skills of expert engineers with high efficiency. In any haptic system, users’ perception is the most important. It should be noted here that IP networks offer best-effort services, which do not guarantee QoS (Quality of Service). In other words, packet loss, network delay or delay jitter cannot be controlled; thus, the output quality of the media can seriously degrade. In the context of networking, QoS 1 is defined for each layer [5]. The quality of end-user experience (i.e., QoE: Quality of Experience), which is on the top of the QoS hierarchy, is the most important [6], [7]. Since QoS is not guaranteed in IP networks, it is important to monitor users’ QoE in real time. Subjective quality assessment is the most fundamental method of evaluating QoE. However, subjective experiment is 1 In IP networks, six kinds of QoS are identified along the protocol stack: physical-level, node(link)-level, network-level, end-to-end(transport)- level, application-level, and user-level(QoE). time-consuming and expensive. For monitoring QoE, it is prac- tically impossible that the user continuously assesses his/her perceptual quality while using the service. Therefore, some method for estimating the subjective quality from objective quality parameters is necessary. We can find many methods to estimate the service quality for audio-video transmission. As for estimating voice quality for VoIP, ITU–T has standardized the E–model as Recom- mendation G.107 [8]. It is convenient for network planning purposes because it formulates the relationships among sub- jective quality, network and/or application parameters. ITU– T Recommendation G.1070 [9] has extended the E–model to interactive videophone applications over best-effort IP networks as a QoE/QoS planning tool. To the best of the authors’ knowledge, there is no publication and tool which monitor the QoE of the haptic (and collaborating haptic and audio-video) transmission in real time. Real-time QoE monitoring is based on QoE estimation in real time. We can find several researches on QoE estimation of haptic media in the literature, e.g., [10] and [11], although they are not real-time estimation. Hamam et al. present a taxonomy for evaluating the QoE of a haptic virtual environment and proposes a fuzzy logic system to model the taxonomy [10]. The Fuzzy Inference System (the Mamdani system) is used to simulate and examine the proposed model. The Mamdani system has five inputs (i.e., media synchronization, fatigue, haptic rendering, degree of immersion, and user satisfaction) and an output (the overall QoE). Furthermore, a subjective experiment has been conducted, and the overall QoE measured has been compared with the output of the fuzzy logic system; it has given a satisfactory result. However, they do not consider the haptic communication in real space. Moreover, real-time QoE estimation is not studied. In [11], Iwata et al. investigate the effect of playout buffering control on QoE in a haptic application with sound and video transmission for beating the tambourine. In addition, they carried out QoS mapping [5] for multiple metrics of QoE (i.e., operability of haptic media, video output quality, sound output quality, synchronization quality and comprehensive quality) and obtained equations of estimated QoE with high accuracy. In their experimental system, however, the transmission of video and audio has been made in only one direction. Therefore, the system’s operation does not suppose an equal interaction between the two users with video and audio, which is important in some haptic applications such as in [3]. Also, in the subjective experiment in [11], the video quality assessed is only the temporal quality since the video decoder performs skipping of damaged video
Transcript of A Multidimensional QoE Monitoring System for Audiovisual ... · A Multidimensional QoE Monitoring...

A Multidimensional QoE Monitoring System for
Audiovisual and Haptic Interactive IP
Communications
Eiichi Isomura∗, Shuji Tasaka†, and Toshiro Nunome∗
∗Graduate School of Engineering, Nagoya Institute of Technology, Nagoya 466–8555, Japan† Interdisciplinary Engineering Laboratory, Nagoya Institute of Technology, Nagoya 466–8555, Japan
Abstract—This paper deals with audiovisual and haptic inter-active IP communications and designs a multidimensional QoEmonitoring system with the QoE estimation in real time. For theestimation, we carry out regression analysis between QoE andapplication-level QoS and obtain equations for the estimation.We measured the application-level QoS and made a subjectiveexperiment by assessing QoE multidimensionally with the SDmethod. To monitor QoE, we derive estimates for three QoEmetrics. We apply linear and non-linear regression analysis tothe experimental results. As a result, we find that the obtainedequations can estimate QoE with high accuracy. By using theequations, we have built the QoE monitoring system.
Index Terms—interactive IP communications, audiovisual andhaptic, QoE, real time estimation, QoE monitoring
I. INTRODUCTION
Haptic devices attract people’s attention as new human inter-face devices, which are expected to spread through consumerenvironments [1], [2]. Combinations of haptic devices andaudiovisual ones can enhance users’ experience, in particularthe one of the telepresence, which is one of the most promisingapplications in the near future multimedia IP consumer com-munications.
Audiovisual and haptic interactive IP communications in thereal space can provide the users with high realistic sensationand high quality of interactivity; this enables the users toimmerse into the work easily. For enhancement of physicalintimacies in remote interaction, a haptic audiovisual telecon-ferencing system with a haptic jacket is presented in [3]. In [4],a haptic media is used for training and mastering skills of expertengineers with high efficiency. In any haptic system, users’perception is the most important.
It should be noted here that IP networks offer best-effortservices, which do not guarantee QoS (Quality of Service). Inother words, packet loss, network delay or delay jitter cannot becontrolled; thus, the output quality of the media can seriouslydegrade.
In the context of networking, QoS1 is defined for eachlayer [5]. The quality of end-user experience (i.e., QoE: Qualityof Experience), which is on the top of the QoS hierarchy, isthe most important [6], [7]. Since QoS is not guaranteed in IPnetworks, it is important to monitor users’ QoE in real time.
Subjective quality assessment is the most fundamentalmethod of evaluating QoE. However, subjective experiment is
1In IP networks, six kinds of QoS are identified along the protocolstack: physical-level, node(link)-level, network-level, end-to-end(transport)-
level, application-level, and user-level(QoE).
time-consuming and expensive. For monitoring QoE, it is prac-tically impossible that the user continuously assesses his/herperceptual quality while using the service. Therefore, somemethod for estimating the subjective quality from objectivequality parameters is necessary.
We can find many methods to estimate the service qualityfor audio-video transmission. As for estimating voice qualityfor VoIP, ITU–T has standardized the E–model as Recom-mendation G.107 [8]. It is convenient for network planningpurposes because it formulates the relationships among sub-jective quality, network and/or application parameters. ITU–T Recommendation G.1070 [9] has extended the E–model tointeractive videophone applications over best-effort IP networksas a QoE/QoS planning tool.
To the best of the authors’ knowledge, there is no publicationand tool which monitor the QoE of the haptic (and collaboratinghaptic and audio-video) transmission in real time. Real-timeQoE monitoring is based on QoE estimation in real time.
We can find several researches on QoE estimation of hapticmedia in the literature, e.g., [10] and [11], although they arenot real-time estimation. Hamam et al. present a taxonomyfor evaluating the QoE of a haptic virtual environment andproposes a fuzzy logic system to model the taxonomy [10].The Fuzzy Inference System (the Mamdani system) is usedto simulate and examine the proposed model. The Mamdanisystem has five inputs (i.e., media synchronization, fatigue,haptic rendering, degree of immersion, and user satisfaction)and an output (the overall QoE). Furthermore, a subjectiveexperiment has been conducted, and the overall QoE measuredhas been compared with the output of the fuzzy logic system; ithas given a satisfactory result. However, they do not considerthe haptic communication in real space. Moreover, real-timeQoE estimation is not studied. In [11], Iwata et al. investigatethe effect of playout buffering control on QoE in a hapticapplication with sound and video transmission for beating thetambourine. In addition, they carried out QoS mapping [5]for multiple metrics of QoE (i.e., operability of haptic media,video output quality, sound output quality, synchronizationquality and comprehensive quality) and obtained equationsof estimated QoE with high accuracy. In their experimentalsystem, however, the transmission of video and audio has beenmade in only one direction. Therefore, the system’s operationdoes not suppose an equal interaction between the two userswith video and audio, which is important in some hapticapplications such as in [3]. Also, in the subjective experimentin [11], the video quality assessed is only the temporal qualitysince the video decoder performs skipping of damaged video
frames; the video spatial quality is not taken into consideration.Furthermore, no real-time QoE monitoring has been consideredin [11].
Building a real-time QoE monitoring system in audiovisualand haptic interactive IP communications with an equal in-teraction is the goal of this paper. In the authors’ previouswork [12], they conducted QoE assessment to evaluate howmedia degradations affect QoE for a task of object movement.By using the assessment results, the current paper estimatesQoE by means of QoS mapping between QoE (user-level QoS)and application-level QoS. We perform the QoS mapping withmultiple regression analysis. In the QoE monitoring, it shouldbe noted that video, audio and haptic media have differentproperties in the allowable delay, the tolerance to packet lossand others. Therefore, user perception of quality deteriorationdepends on the media type. For this reason, we design a QoEmonitoring system which can display three QoE metrics: videospatial quality, haptic operability and overall satisfaction; weadopt no metric of audio since the audio is used only for thedirections for the task of object movement.
The remainder of this paper is structured as follows. Anoutline of the audiovisual and haptic interactive communica-tion system is represented in Section II. A QoE monitoringmodel are described in Section III. Measurement methods ofQoE and application-level QoS are explained in Section IV.QoE estimation methods and obtained equations are shown inSection V. Section VI illustrates the QoE monitoring systemthus built. Finally, we conclude this paper and state future workin Section VII.
II. AUDIOVISUAL AND HAPTIC INTERACTIVE
COMMUNICATION SYSTEM
In this paper, we suppose that video, audio and haptic mediaare transmitted bidirectionally between two media terminalsover a best-effort IP network. Fig. 1 illustrates functionalcomponents of the two media terminals. A haptic interface(PHANToM Omni), a video camera, an LCD monitor and aheadset are connected to each media terminal. The mediaterminal has the ability to input and output the three media.Although the components of only media terminal 1 are shownin Fig. 1, media terminal 2 has the same configuration.
We refer to the transmission unit at the application layer asa media unit (MU); in this paper, we define a video frame asa video MU, a constant number of audio samples as an audioMU and positional information at the corresponding time as ahaptic MU.
The haptic MU, which has coordinate data obtained fromPHANToM, is transmitted bidirectionally between the twomedia terminals. This allows the user to manipulate PHANToMof the other side.
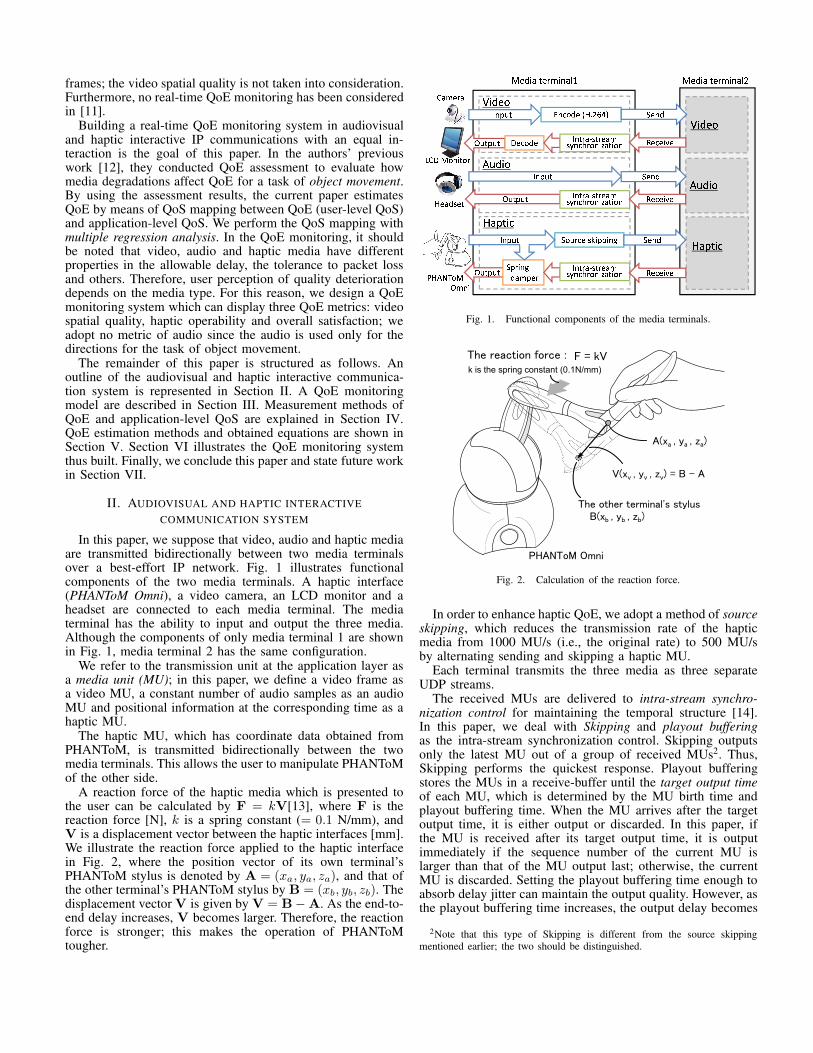
A reaction force of the haptic media which is presented tothe user can be calculated by F = kV[13], where F is thereaction force [N], k is a spring constant (= 0.1 N/mm), andV is a displacement vector between the haptic interfaces [mm].We illustrate the reaction force applied to the haptic interfacein Fig. 2, where the position vector of its own terminal’sPHANToM stylus is denoted by A = (xa, ya, za), and that ofthe other terminal’s PHANToM stylus by B = (xb, yb, zb). Thedisplacement vector V is given by V = B−A. As the end-to-end delay increases, V becomes larger. Therefore, the reactionforce is stronger; this makes the operation of PHANToMtougher.
�����
�����
����
� ��� � �������
������
��� �� !"��
#$%&'��
$��()�"
* +,"
* +,"
-,"+," ��.�(�
/�,�.� )0!++! 1
-,"+,"
-,"+,"/+�! 12
(��+��
3 .�(� 4$56789
* "��2)"����): .;�� !<�"!�
�����
�����
����
/� (
/� (
/� (
=�.�!>�
� ��� � ������?
* "��2)"����): .;�� !<�"!� =�.�!>�
* +,"
* "��2)"����): .;�� !<�"!� =�.�!>�
-� !
Fig. 1. Functional components of the media terminals.
PHANToM Omni
A(xa , ya , za)
B(xb , yb , zb)
V(xv , yv , zv) = B - A
The reaction force : F = kV k is the spring constant (0.1N/mm)
The other terminal's stylus
Fig. 2. Calculation of the reaction force.
In order to enhance haptic QoE, we adopt a method of sourceskipping, which reduces the transmission rate of the hapticmedia from 1000 MU/s (i.e., the original rate) to 500 MU/sby alternating sending and skipping a haptic MU.
Each terminal transmits the three media as three separateUDP streams.
The received MUs are delivered to intra-stream synchro-nization control for maintaining the temporal structure [14].In this paper, we deal with Skipping and playout bufferingas the intra-stream synchronization control. Skipping outputsonly the latest MU out of a group of received MUs2. Thus,Skipping performs the quickest response. Playout bufferingstores the MUs in a receive-buffer until the target output timeof each MU, which is determined by the MU birth time andplayout buffering time. When the MU arrives after the targetoutput time, it is either output or discarded. In this paper, ifthe MU is received after its target output time, it is outputimmediately if the sequence number of the current MU islarger than that of the MU output last; otherwise, the currentMU is discarded. Setting the playout buffering time enough toabsorb delay jitter can maintain the output quality. However, asthe playout buffering time increases, the output delay becomes
2Note that this type of Skipping is different from the source skippingmentioned earlier; the two should be distinguished.
Output MUs
Sequence numberTime stamp... etc.
Application-level QoSmeasurement module
QoE estimation module
Estimation module for
Video output quality
Estimation module for
Haptic operability
Estimation module for
Overall quality
QoE monitoring module
Output estimated QoE
with bar & line graphs
Fig. 3. QoE monitoring model.
Load Sender 1
Load Receiver 2
Load Receiver 1
Load Sender 2
UDP poisson traffic
Media Terminal 1 Media Terminal 2
Router1
Router2
Haptic interface (PHANToM Omni)
Haptic interface (PHANToM Omni)
Video Audio Haptic
Video Audio Haptic
100Mb/s10Mb/s
CameraCamera
HeadsetHeadset
WebWeb
UDP poisson traffic
Fig. 4. Experimental system configuration.
longer. Thus, there is a trade-off relation between the outputquality and responsiveness.
III. QOE MONITORING MODEL
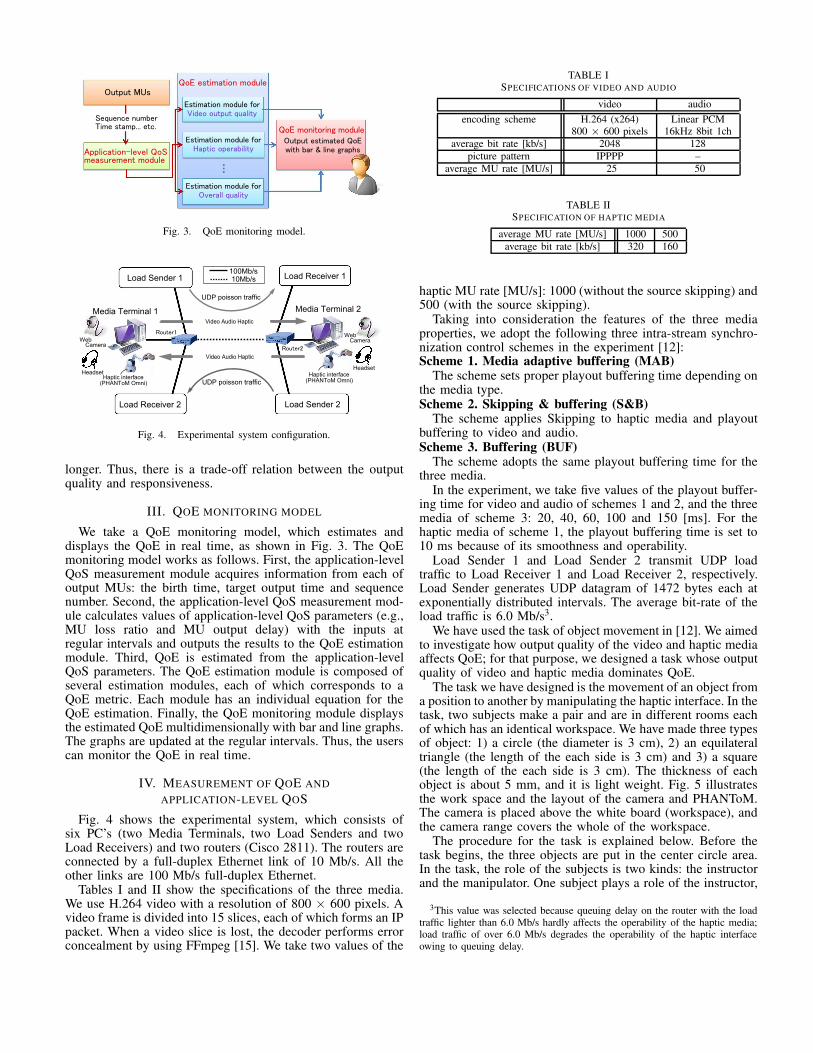
We take a QoE monitoring model, which estimates anddisplays the QoE in real time, as shown in Fig. 3. The QoEmonitoring model works as follows. First, the application-levelQoS measurement module acquires information from each ofoutput MUs: the birth time, target output time and sequencenumber. Second, the application-level QoS measurement mod-ule calculates values of application-level QoS parameters (e.g.,MU loss ratio and MU output delay) with the inputs atregular intervals and outputs the results to the QoE estimationmodule. Third, QoE is estimated from the application-levelQoS parameters. The QoE estimation module is composed ofseveral estimation modules, each of which corresponds to aQoE metric. Each module has an individual equation for theQoE estimation. Finally, the QoE monitoring module displaysthe estimated QoE multidimensionally with bar and line graphs.The graphs are updated at the regular intervals. Thus, the userscan monitor the QoE in real time.
IV. MEASUREMENT OF QOE AND
APPLICATION-LEVEL QOS
Fig. 4 shows the experimental system, which consists ofsix PC’s (two Media Terminals, two Load Senders and twoLoad Receivers) and two routers (Cisco 2811). The routers areconnected by a full-duplex Ethernet link of 10 Mb/s. All theother links are 100 Mb/s full-duplex Ethernet.
Tables I and II show the specifications of the three media.We use H.264 video with a resolution of 800 × 600 pixels. Avideo frame is divided into 15 slices, each of which forms an IPpacket. When a video slice is lost, the decoder performs errorconcealment by using FFmpeg [15]. We take two values of the
TABLE ISPECIFICATIONS OF VIDEO AND AUDIO
video audio
encoding scheme H.264 (x264) Linear PCM800 × 600 pixels 16kHz 8bit 1ch
average bit rate [kb/s] 2048 128
picture pattern IPPPP –
average MU rate [MU/s] 25 50
TABLE IISPECIFICATION OF HAPTIC MEDIA
average MU rate [MU/s] 1000 500
average bit rate [kb/s] 320 160
haptic MU rate [MU/s]: 1000 (without the source skipping) and500 (with the source skipping).
Taking into consideration the features of the three mediaproperties, we adopt the following three intra-stream synchro-nization control schemes in the experiment [12]:Scheme 1. Media adaptive buffering (MAB)
The scheme sets proper playout buffering time depending onthe media type.Scheme 2. Skipping & buffering (S&B)
The scheme applies Skipping to haptic media and playoutbuffering to video and audio.Scheme 3. Buffering (BUF)
The scheme adopts the same playout buffering time for thethree media.
In the experiment, we take five values of the playout buffer-ing time for video and audio of schemes 1 and 2, and the threemedia of scheme 3: 20, 40, 60, 100 and 150 [ms]. For thehaptic media of scheme 1, the playout buffering time is set to10 ms because of its smoothness and operability.
Load Sender 1 and Load Sender 2 transmit UDP loadtraffic to Load Receiver 1 and Load Receiver 2, respectively.Load Sender generates UDP datagram of 1472 bytes each atexponentially distributed intervals. The average bit-rate of theload traffic is 6.0 Mb/s3.
We have used the task of object movement in [12]. We aimedto investigate how output quality of the video and haptic mediaaffects QoE; for that purpose, we designed a task whose outputquality of video and haptic media dominates QoE.
The task we have designed is the movement of an object froma position to another by manipulating the haptic interface. In thetask, two subjects make a pair and are in different rooms eachof which has an identical workspace. We have made three typesof object: 1) a circle (the diameter is 3 cm), 2) an equilateraltriangle (the length of the each side is 3 cm) and 3) a square(the length of the each side is 3 cm). The thickness of eachobject is about 5 mm, and it is light weight. Fig. 5 illustratesthe work space and the layout of the camera and PHANToM.The camera is placed above the white board (workspace), andthe camera range covers the whole of the workspace.
The procedure for the task is explained below. Before thetask begins, the three objects are put in the center circle area.In the task, the role of the subjects is two kinds: the instructorand the manipulator. One subject plays a role of the instructor,
3This value was selected because queuing delay on the router with the loadtraffic lighter than 6.0 Mb/s hardly affects the operability of the haptic media;load traffic of over 6.0 Mb/s degrades the operability of the haptic interfaceowing to queuing delay.

Near
Far
Left Center circle
Square(Destination)
Triangle (Destination)
4cm
4cm 10cm
12cm
PHANToM Omni
4cm(initial position)
Workspace
Object
Right
Stylus
12cm
(Destination)
12cm
CameraWeb
Fig. 5. Workspace and layout at each terminal.
TABLE IIIPAIRS OF POLAR TERMS
class item polar terms
Video:v1 Spatial quality Video is corrupt–clearVideo:v2 Temporal quality Video is jerky–smoothVideo:v3 Usefulness Image is hard to grasp–easy
Haptic:h1 Operability Manipulation is heavy–lightHaptic:h2 Smoothness Movement is awkward–smoothHaptic:h3 Stability Manipulation is unstable–stable
Audio:a1 Naturalness Artificial–Natural
Inter-stream Video and haptic Out of sync–In syncsync:s1
Interactive:i1 Response Response is slow–rapidInteractive:i2 Communicability Hard to communicate–EasyInteractive:i3 System comfort Uncomfortable–ComfortableInteractive:i4 Work difficulty Difficult to work–Easy
Overall Overall satisfaction Unsatisfied–Satisfied
and the other is the manipulator. First, the instructor selectsan object in the center circle and its destination on his/herown side; then he/she tells the instruction to the manipulatorusing the headset microphone. The manipulator replies tothe instruction and then manipulates PHANToM to move thespecified object to the destination on the instructor’s side, whilewatching the video and grasping the positional relation betweenPHANToM and the object on the instructor’s side. Fig. 6 showsthe situation in which the circle object on the instructor’s sideis moved to the square destination on the same side by themanipulator’s remote operation. When the object reaches thedestination, the two subjects alternate the role. This work isrepeated during a predetermined interval (i.e., 30 seconds).When the manipulator manipulates PHANToM, the instructoronly holds his/her PHANToM stylus and surrenders him/herselfto the manipulator’s movement.
For multidimensional QoE assessment, we use the SD (Se-matic Differential) method [16]. Table III shows the polarterms for the experiment; these terms can be classified intosix classes: video, haptic media, audio, inter-stream synchro-nization, interaction and overall satisfaction.
For each pair of polar terms, the subject gives a score to thestimulus (i.e., the totality of the three media output, operationand responsiveness, etc.) by the rating scale method [17] withfive grades. The best grade (score 5) represents the positiveadjective (the right-hand side one in each pair in Table III),
Network
Instructor’s side Manipulator’s side
Apply force
Calculated reaction force
Calculated reaction force
(a) The manipulator operates his/her own PHANToM stylus while watchingthe video. The instructor only holds his/her PHANToM stylus and surrendershim/herself to the manipulator’s movement.
Network
Instructor’s side Manipulator’s side
The stylus moves owing to the reaction force caused
by the manipulator
(b) The stylus of the instructor’s PHANToM moves owing to the reactionforce caused by the manipulator. The circle object of the instructor’s side ispushed by the stylus.
Fig. 6. The procedure for the task of object movement.
while the worst grade (score 1) means the negative adjective.The meanings of score 4 and score 2 are the meanings modifiedby “slightly” of score 5 and score 1, respectively. The middlegrade (score 3) means neutral.
In this paper, we express QoE multidimensionally in termsof the scores given by the subjects for each pair of polar terms;the scores are converted into the interval scale4 by the methodof successive categories. Moreover, we confirm the goodnessof fit for the obtained scale by using Mosteller’s test [18]. Oncethe goodness of fit has been confirmed, we use the interval scaleas the QoE metric, which is called the psychological scale [19].
The subjects in the experiment were male and female stu-dents in their teens or twenties; the number of the subjects is56 (28 males and 28 females).
Each pair of the subjects assessed 30 stimuli because of threekinds of intra-stream synchronization controls, five values ofthe playout buffering time, and two values of the haptic MUrate. These stimuli were presented in random order. It took
4A simple arithmetic average of the scores gives MOS (Mean Opinion Score).We do not use MOS because of higher accuracy of the interval scale [19].
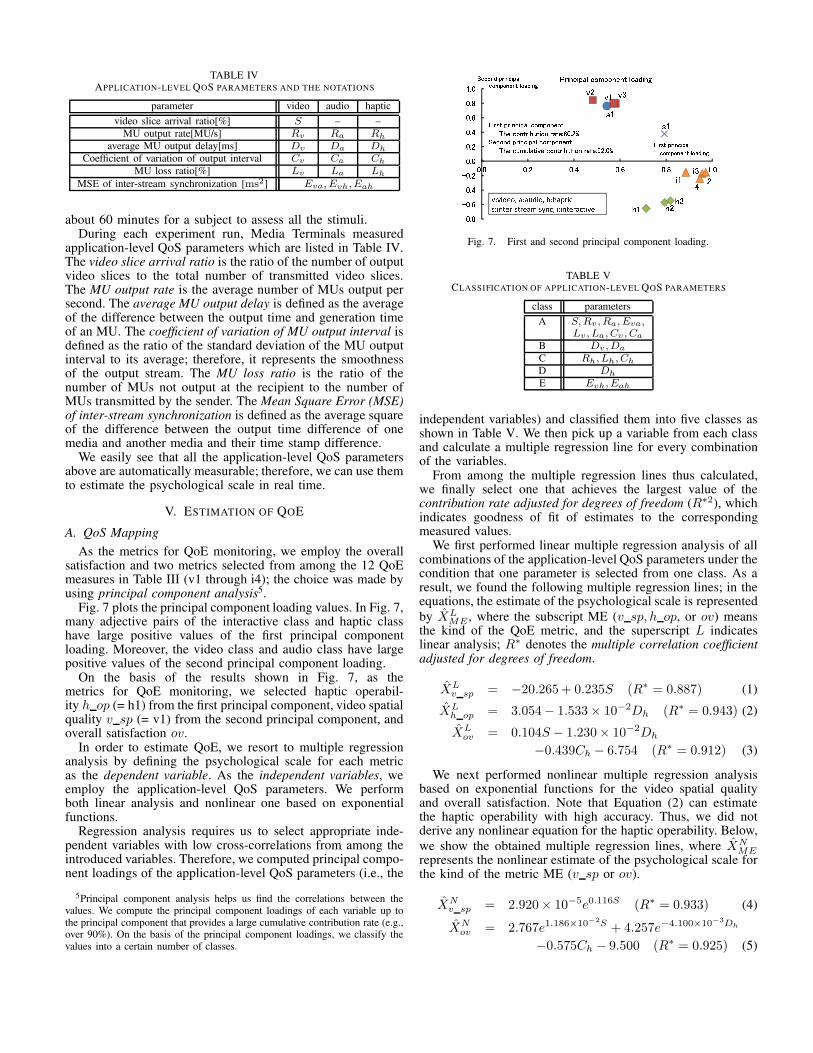
TABLE IVAPPLICATION-LEVEL QOS PARAMETERS AND THE NOTATIONS
parameter video audio haptic
video slice arrival ratio[%] S – –
MU output rate[MU/s] Rv Ra Rh
average MU output delay[ms] Dv Da Dh
Coefficient of variation of output interval Cv Ca Ch
MU loss ratio[%] Lv La Lh
MSE of inter-stream synchronization [ms2] Eva, Evh, Eah
about 60 minutes for a subject to assess all the stimuli.During each experiment run, Media Terminals measured
application-level QoS parameters which are listed in Table IV.The video slice arrival ratio is the ratio of the number of outputvideo slices to the total number of transmitted video slices.The MU output rate is the average number of MUs output persecond. The average MU output delay is defined as the averageof the difference between the output time and generation timeof an MU. The coefficient of variation of MU output interval isdefined as the ratio of the standard deviation of the MU outputinterval to its average; therefore, it represents the smoothnessof the output stream. The MU loss ratio is the ratio of thenumber of MUs not output at the recipient to the number ofMUs transmitted by the sender. The Mean Square Error (MSE)of inter-stream synchronization is defined as the average squareof the difference between the output time difference of onemedia and another media and their time stamp difference.
We easily see that all the application-level QoS parametersabove are automatically measurable; therefore, we can use themto estimate the psychological scale in real time.
V. ESTIMATION OF QOE
A. QoS Mapping
As the metrics for QoE monitoring, we employ the overallsatisfaction and two metrics selected from among the 12 QoEmeasures in Table III (v1 through i4); the choice was made byusing principal component analysis5.
Fig. 7 plots the principal component loading values. In Fig. 7,many adjective pairs of the interactive class and haptic classhave large positive values of the first principal componentloading. Moreover, the video class and audio class have largepositive values of the second principal component loading.
On the basis of the results shown in Fig. 7, as themetrics for QoE monitoring, we selected haptic operabil-ity h op (= h1) from the first principal component, video spatialquality v sp (= v1) from the second principal component, andoverall satisfaction ov.
In order to estimate QoE, we resort to multiple regressionanalysis by defining the psychological scale for each metricas the dependent variable. As the independent variables, weemploy the application-level QoS parameters. We performboth linear analysis and nonlinear one based on exponentialfunctions.
Regression analysis requires us to select appropriate inde-pendent variables with low cross-correlations from among theintroduced variables. Therefore, we computed principal compo-nent loadings of the application-level QoS parameters (i.e., the
5Principal component analysis helps us find the correlations between thevalues. We compute the principal component loadings of each variable up tothe principal component that provides a large cumulative contribution rate (e.g.,over 90%). On the basis of the principal component loadings, we classify thevalues into a certain number of classes.
@A@B @C
DA DBDC
EA
FA
GA GB
GC
GH
IJKL
IJKM
IJKN
IJKO
JKJ
JKO
JKN
JKM
JKL
PKJ
JKJ JKO JKN JKM JKL PKJ
QRSTUSVWX UYZVYT[T\ XYW]ST^_`abcd efgcagehiabjebc`ck ibhdgcl
mgfnk efgcagehiabjebc`ck ibhdgcl
opqrs tqpuvptwx vyztyu{us|}{ vyusqp~�spyu qws{������
�{vyu� tqpuvptwx vyztyu{us|}{ v�z�xwsp�{ vyusqp~�spyu qws{������
�������� �������� ���������������������� ����� �������������
Fig. 7. First and second principal component loading.
TABLE VCLASSIFICATION OF APPLICATION-LEVEL QOS PARAMETERS
class parameters
A S,Rv, Ra, Eva,
Lv, La, Cv , Ca
B Dv,Da
C Rh, Lh, Ch
D Dh
E Evh, Eah
independent variables) and classified them into five classes asshown in Table V. We then pick up a variable from each classand calculate a multiple regression line for every combinationof the variables.
From among the multiple regression lines thus calculated,we finally select one that achieves the largest value of thecontribution rate adjusted for degrees of freedom (R∗2), whichindicates goodness of fit of estimates to the correspondingmeasured values.
We first performed linear multiple regression analysis of allcombinations of the application-level QoS parameters under thecondition that one parameter is selected from one class. As aresult, we found the following multiple regression lines; in theequations, the estimate of the psychological scale is represented
by X̂LME , where the subscript ME (v sp, h op, or ov) means
the kind of the QoE metric, and the superscript L indicateslinear analysis; R∗ denotes the multiple correlation coefficientadjusted for degrees of freedom.
X̂Lv sp = −20.265+ 0.235S (R∗ = 0.887) (1)
X̂Lh op = 3.054− 1.533× 10⁻²Dh (R∗ = 0.943) (2)
X̂Lov = 0.104S − 1.230× 10⁻²Dh
−0.439Ch − 6.754 (R∗ = 0.912) (3)
We next performed nonlinear multiple regression analysisbased on exponential functions for the video spatial qualityand overall satisfaction. Note that Equation (2) can estimatethe haptic operability with high accuracy. Thus, we did notderive any nonlinear equation for the haptic operability. Below,
we show the obtained multiple regression lines, where X̂NME
represents the nonlinear estimate of the psychological scale forthe kind of the metric ME (v sp or ov).
X̂Nv sp = 2.920× 10⁻⁵e0.116S (R∗ = 0.933) (4)
X̂Nov = 2.767e1.186×10
−2S + 4.257e−4.100×10⁻³Dh
−0.575Ch − 9.500 (R∗ = 0.925) (5)

Comparing the linear and nonlinear equations thus obtainedfor the video spatial quality and overall satisfaction, we seethat the nonlinear equations provide larger values of R∗ thanthe linear ones. In the following discussion, we utilize Equa-tions (2), (4) and (5).
B. Accuracy of estimation
We now examine the accuracy of the estimate with the mul-tiple regression lines by comparing them to the correspondingmeasured values. Because of space limitations, we show theresults only for limited experimental conditions.
Fig. 8 plots estimated values of the video spatial qualityalong with the measured ones in the case where the haptic MUrate is 1000 MU/s as a function of playout buffering time whichis set for video, audio, and haptic media of BUF (scheme 3). InFig. 8, we see that Equation (4) can estimate the video spatialquality with good accuracy.
Fig. 9 presents the results of the haptic operability in thecase where the haptic MU rate is 500 MU/s. In Fig. 9, wefind that the estimated values of the haptic operability canapproximate the measured ones with high accuracy. In BUF,the end-to-end delay of the haptic media increases as theplayout buffering time becomes longer; therefore, the hapticmanipulation becomes tougher.
Fig. 10 displays the result of the overall satisfaction in thecase where the haptic MU rate is 500 MU/s. The estimatedvalues are close to the measured ones. When the playoutbuffering time is 20 ms, the estimated and measured QoE aredegraded because of video slice loss. In BUF, the result issimilar to that of the haptic operability because of the hapticend-to-end delay.
In addition, we conducted another experiment with 16 sub-jects who are not included by the 56 subjects. For the exper-iment, the task is the object movement. By using the results,we confirmed that the equations can estimate QoE with highaccuracy. Due to limitations of space, the results are not shownin this paper.
VI. QOE MONITORING SYSTEM
We implemented a QoE monitoring system in the exper-imental system with the derived QoE estimation equations.Fig. 11 shows a snapshot of the implemented QoE monitoring.In Fig. 11, the system depicts graphs of estimated valuesof the three QoE metrics as a function of time: the videospatial quality, haptic operability and overall satisfaction. Forestimation of the video spatial quality, Equation (4) is used.Similarly, Equation (2) is used for the haptic operability, andEquation (5) for the overall satisfaction. The application-levelQoS and estimated QoE are calculated and updated at intervalsof a second in the system.
In the QoE monitoring system, the current estimated QoE isrepresented with a bar graph on the left hand side; below thebar graph, the system shows the quality category (Categories1 through 5), to which the estimated value belongs. There arefive kinds of category notation: Excellent, Good, Fair, Poorand Bad. For example, in the case of the haptic operability ofFig. 11, Excellent means that the operation of the PHANToMis light, while Bad means the heavy operation. In addition, themeaning of Fair is neutral, Good and Poor express Categories 4and 2, respectively.
The right-hand side of the system displays the estimatedQoE history with the line graph; the right edge of the graph
�
�
�
¡
� �� ¡� ¢� £� ��� ��� �¡� �¢�
¤¥¦§̈©ª©«¬§ª¥§ª®
¯°±²³´µ ¶´··¸¹º»¼ µº½¸ ¾½¿À
ÁºÂ¸³ ¿Ã±µº±° Ä´±°ºµ²Å±ÃµºÆ ÇÈ ¹±µ¸ É ����ÇÈÊ¿
ËÌÍ ÎÏÐÑÒÓÔÐÕ ÖÑ×ÓÐØÙ ÚÛÛÛËÜÝÒ ËÌÍ ÎÐÒÞßÏÑÞÐÕ ÖÑ×ÓÐØÙ ÚÛÛÛËÜÝÒàáÍ ÎÏÐÑÒÓÔÐÕ ÖÑ×ÓÐØÙ ÚÛÛÛËÜÝÒ àáÍ ÎÐÒÞßÏÑÞÐÕ ÖÑ×ÓÐØÙ ÚÛÛÛËÜÝÒÍÜâ ÎÏÐÑÒÓÔÐÕ ÖÑ×ÓÐØÙ ÚÛÛÛËÜÝÒ ÍÜâ ÎÐÒÞßÏÑÞÐÕ ÖÑ×ÓÐØÙ ÚÛÛÛËÜÝÒ
ÁºÂ¸³ º¿ Æ°¸±¹
ÁºÂ¸³ º¿ Ƴ¹¹´Ãµ
ãäååå
æäåçè
æäéåå
çäèæå
ê°º¼ëµ°² Æ°¸±¹
챺¹
ê°º¼ëµ°² Ƴ¹¹´Ãµí îïð ñòóôõö ÷øùõòúûüý þÿ÷� ï� ��ò�ï�ô ����øðõ����ü ý ��õóóõ��
Fig. 8. Video spatial quality (haptic MU rate = 1000 MU/s).
�
�
� � � � �
������������������
�� !"#$ %#&&'()*+ $),' -,./
0 1$)2 "1'( %)�)$!
0 1$)2 34 ( $' 5 6347.
89: ;<=>?@A=B C>D@=EF GHH8IJ? 89: ;=?KL<>K=B C>D@=EF GHH8IJ?MN: ;<=>?@A=B C>D@=EF GHH8IJ? MN: ;=?KL<>K=B C>D@=EF GHH8IJ?:IO ;<=>?@A=B C>D@=EF GHH8IJ? :IO ;=?KL<>K=B C>D@=EF GHH8IJ?
3 *)1#� $)"* ). �)+P$
3 *)1#� $)"* ). P' Q!
RSTTT
USTVW
USXWY
ZSYZW
[�)+P$�! �)+P$
[�)+P$�! P' Q!
\ )(
] ^_` abcdef ghieb
jklm nogp _q rsbt_ud vuqqh`ewx
yzl m y{eccewx
Fig. 9. Haptic operability (haptic MU rate = 500 MU/s).
|
}
~
�
�
| ~| �| �| �| }|| }~| }�| }�|
������������������
������� ��������� ���� ����
¡����� �������¢����
£�¤��¢ ¥¦ ���� § ¨||¥¦©�
ª«¬ ®¯°±²³¯´ µ°¶²¯·¸ ¹ººª»¼± ª«¬ ¯±½¾®°½¯´ µ°¶²¯·¸ ¹ººª»¼±¿À¬ ®¯°±²³¯´ µ°¶²¯·¸ ¹ººª»¼± ¿À¬ ¯±½¾®°½¯´ µ°¶²¯·¸ ¹ººª»¼±¬»Á ®¯°±²³¯´ µ°¶²¯·¸ ¹ººª»¼± ¬»Á ¯±½¾®°½¯´ µ°¶²¯·¸ ¹ººª»¼±
Â�������Ã
¦���������Ã
ÄÅÆÆÆ
Â���Ç��� ��������Ã
Â���Ç��� ����������Ã
���
ÄÅÆÆÆ
ÉÅÆÄÉ
ÉÅÊÆË
ÌÅÊÉÊ
Í ÎÏÐ ÑÒÓÔÕÖ ×ØÙÕÒ
ÚÛÜÝ Þß×à Ïá âãÒäÏåÔ æåááØÐÕçè
éêÜ Ý éëÕÓÓÕçè
Fig. 10. Overall satisfaction (haptic MU rate = 500 MU/s).
corresponds to the current estimated value. Horizontal dashedlines in the graph represent the category boundaries, and thenotations on the left edge of the graph (i.e., Cate.1 throughCate.5) means the category number. The system can render theestimated QoE history for two minutes with the line graph.
The monitoring system shows more than one QoE metricssimultaneously; this implies monitoring of multidimensionalQoE. Moreover, the value of application-level QoS parameters,which are measured in real time, can be displayed (see thebottom of Fig. 11).
In the QoE monitoring of this paper, the most important QoEmetric is the overall satisfaction. However, dominant factorsaffecting the overall satisfaction can depend on individual users.In order to achieve the highest QoE for the individual users, weneed some method of customization [20]. The customizationallows users to select favorite values of important parameters(e.g., video encoding bit rate and playout buffering time). Weare planning to implement this type of customization into ouraudiovisual and haptic interactive communication system inorder to accommodate the individual users’ preferences.
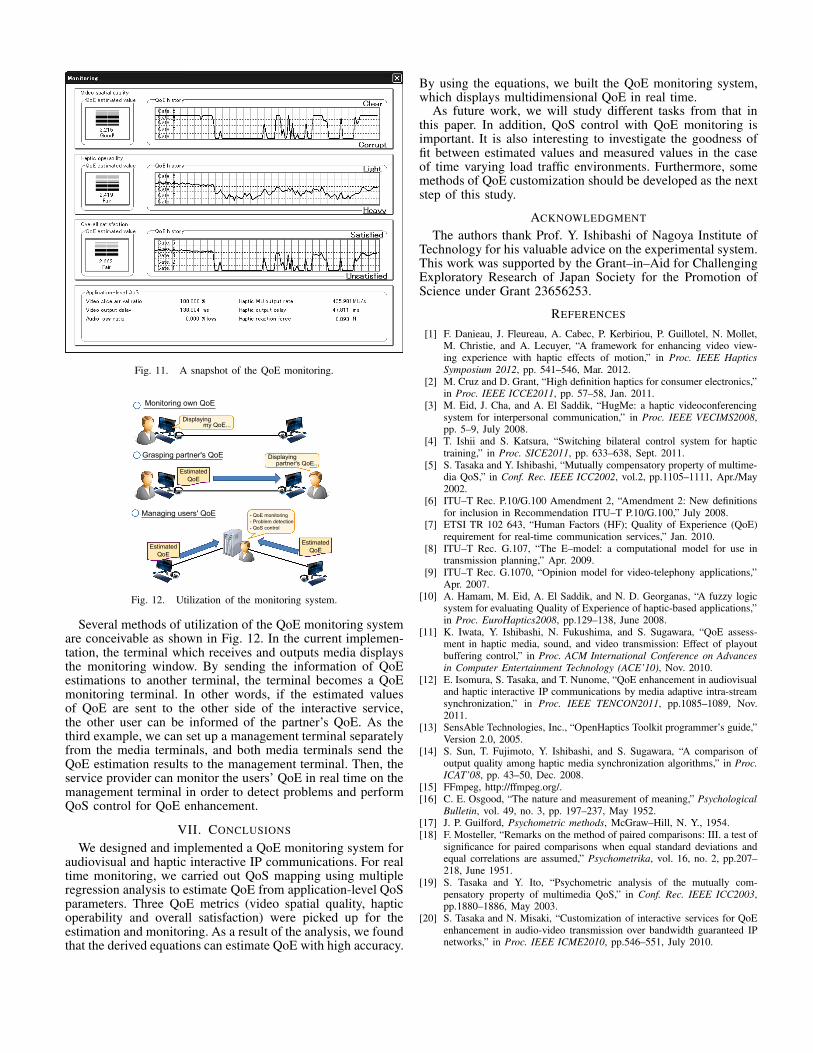
Fig. 11. A snapshot of the QoE monitoring.
Estimated
QoE
Estimated
QoE
Estimated
QoE
- QoE monitoring
- Problem detection
- QoS control
Monitoring own QoE
Grasping partner's QoE
Managing users' QoE
Displayingmy QoE...
Displayingpartner's QoE...
Fig. 12. Utilization of the monitoring system.
Several methods of utilization of the QoE monitoring systemare conceivable as shown in Fig. 12. In the current implemen-tation, the terminal which receives and outputs media displaysthe monitoring window. By sending the information of QoEestimations to another terminal, the terminal becomes a QoEmonitoring terminal. In other words, if the estimated valuesof QoE are sent to the other side of the interactive service,the other user can be informed of the partner’s QoE. As thethird example, we can set up a management terminal separatelyfrom the media terminals, and both media terminals send theQoE estimation results to the management terminal. Then, theservice provider can monitor the users’ QoE in real time on themanagement terminal in order to detect problems and performQoS control for QoE enhancement.
VII. CONCLUSIONS
We designed and implemented a QoE monitoring system foraudiovisual and haptic interactive IP communications. For realtime monitoring, we carried out QoS mapping using multipleregression analysis to estimate QoE from application-level QoSparameters. Three QoE metrics (video spatial quality, hapticoperability and overall satisfaction) were picked up for theestimation and monitoring. As a result of the analysis, we foundthat the derived equations can estimate QoE with high accuracy.
By using the equations, we built the QoE monitoring system,which displays multidimensional QoE in real time.
As future work, we will study different tasks from that inthis paper. In addition, QoS control with QoE monitoring isimportant. It is also interesting to investigate the goodness offit between estimated values and measured values in the caseof time varying load traffic environments. Furthermore, somemethods of QoE customization should be developed as the nextstep of this study.
ACKNOWLEDGMENT
The authors thank Prof. Y. Ishibashi of Nagoya Institute ofTechnology for his valuable advice on the experimental system.This work was supported by the Grant–in–Aid for ChallengingExploratory Research of Japan Society for the Promotion ofScience under Grant 23656253.
REFERENCES
[1] F. Danieau, J. Fleureau, A. Cabec, P. Kerbiriou, P. Guillotel, N. Mollet,M. Christie, and A. Lecuyer, “A framework for enhancing video view-ing experience with haptic effects of motion,” in Proc. IEEE Haptics
Symposium 2012, pp. 541–546, Mar. 2012.[2] M. Cruz and D. Grant, “High definition haptics for consumer electronics,”
in Proc. IEEE ICCE2011, pp. 57–58, Jan. 2011.[3] M. Eid, J. Cha, and A. El Saddik, “HugMe: a haptic videoconferencing
system for interpersonal communication,” in Proc. IEEE VECIMS2008,pp. 5–9, July 2008.
[4] T. Ishii and S. Katsura, “Switching bilateral control system for haptictraining,” in Proc. SICE2011, pp. 633–638, Sept. 2011.
[5] S. Tasaka and Y. Ishibashi, “Mutually compensatory property of multime-dia QoS,” in Conf. Rec. IEEE ICC2002, vol.2, pp.1105–1111, Apr./May2002.
[6] ITU–T Rec. P.10/G.100 Amendment 2, “Amendment 2: New definitionsfor inclusion in Recommendation ITU–T P.10/G.100,” July 2008.
[7] ETSI TR 102 643, “Human Factors (HF); Quality of Experience (QoE)requirement for real-time communication services,” Jan. 2010.
[8] ITU–T Rec. G.107, “The E–model: a computational model for use intransmission planning,” Apr. 2009.
[9] ITU–T Rec. G.1070, “Opinion model for video-telephony applications,”Apr. 2007.
[10] A. Hamam, M. Eid, A. El Saddik, and N. D. Georganas, “A fuzzy logicsystem for evaluating Quality of Experience of haptic-based applications,”in Proc. EuroHaptics2008, pp.129–138, June 2008.
[11] K. Iwata, Y. Ishibashi, N. Fukushima, and S. Sugawara, “QoE assess-ment in haptic media, sound, and video transmission: Effect of playoutbuffering control,” in Proc. ACM International Conference on Advances
in Computer Entertainment Technology (ACE’10), Nov. 2010.[12] E. Isomura, S. Tasaka, and T. Nunome, “QoE enhancement in audiovisual
and haptic interactive IP communications by media adaptive intra-streamsynchronization,” in Proc. IEEE TENCON2011, pp.1085–1089, Nov.2011.
[13] SensAble Technologies, Inc., “OpenHaptics Toolkit programmer’s guide,”Version 2.0, 2005.
[14] S. Sun, T. Fujimoto, Y. Ishibashi, and S. Sugawara, “A comparison ofoutput quality among haptic media synchronization algorithms,” in Proc.ICAT’08, pp. 43–50, Dec. 2008.
[15] FFmpeg, http://ffmpeg.org/.[16] C. E. Osgood, “The nature and measurement of meaning,” Psychological
Bulletin, vol. 49, no. 3, pp. 197–237, May 1952.[17] J. P. Guilford, Psychometric methods, McGraw–Hill, N. Y., 1954.[18] F. Mosteller, “Remarks on the method of paired comparisons: III. a test of
significance for paired comparisons when equal standard deviations andequal correlations are assumed,” Psychometrika, vol. 16, no. 2, pp.207–218, June 1951.
[19] S. Tasaka and Y. Ito, “Psychometric analysis of the mutually com-pensatory property of multimedia QoS,” in Conf. Rec. IEEE ICC2003,pp.1880–1886, May 2003.
[20] S. Tasaka and N. Misaki, “Customization of interactive services for QoEenhancement in audio-video transmission over bandwidth guaranteed IPnetworks,” in Proc. IEEE ICME2010, pp.546–551, July 2010.
![[MS-QoE]: Quality of Experience Monitoring Server ProtocolMS-QoE]-180828.pdf · 1 / 176 [MS-QoE] - v20180828 Quality of Experience Monitoring Server Protocol Copyright © 2018 Microsoft](https://static.fdocuments.net/doc/165x107/5e79f5bbeb0b920b1f313c68/ms-qoe-quality-of-experience-monitoring-server-protocol-ms-qoe-180828pdf.jpg)