
A multi-species population assessment model for the Gulf of Alaska Kray F. Van Kirk, SFOS, UAF,...
27
A A multi-species multi-species population assessment population assessment model for the Gulf of model for the Gulf of Alaska Alaska Kray F. Van Kirk, SFOS, UAF, Juneau Terrance J. Quinn II, SFOS, UAF, Juneau Jeremy S. Collie, GSO, URI, Narragansett ftkv@uaf.edu
-
Upload
edith-shauna-jacobs -
Category
Documents
-
view
222 -
download
0
Transcript of A multi-species population assessment model for the Gulf of Alaska Kray F. Van Kirk, SFOS, UAF,...
A A multi-species population multi-species population
assessment model for the Gulf assessment model for the Gulf of Alaskaof Alaska
Kray F. Van Kirk, SFOS, UAF, Juneau Terrance J. Quinn II, SFOS, UAF, Juneau Jeremy S. Collie, GSO, URI, Narragansett

Jointly funded by AK and RI Sea Jointly funded by AK and RI Sea GrantGrant
Also collaboration with North Sea Also collaboration with North Sea colleagues: Lewy, Vinther (Denmark)colleagues: Lewy, Vinther (Denmark)
Project started February, 2004Project started February, 2004 Species groupsSpecies groups
Gulf of AlaskaGulf of Alaska Georges BankGeorges Bank North SeaNorth Sea
Sea GrantSea Grant
JustificationJustification
Crisis in Fisheries ManagementCrisis in Fisheries Management Single species analysis does not Single species analysis does not
answer questions of multi-species answer questions of multi-species interactionsinteractions
Ecosystem approaches desiredEcosystem approaches desired Natural mortality is not constant!Natural mortality is not constant! Harvest strategies cannot evolve Harvest strategies cannot evolve
until models dountil models do

Previous MSVPA ModelsPrevious MSVPA Models Predation mortality estimated from Predation mortality estimated from
gut studiesgut studies Single predation coefficientSingle predation coefficient Works backwards from oldest agesWorks backwards from oldest ages Catch-at-age is measured without Catch-at-age is measured without
errorerror Applied to North, Baltic and Bering Applied to North, Baltic and Bering
Seas, Georges Bank, and a few Seas, Georges Bank, and a few tropical areastropical areas

Model OverviewModel Overview Catch-age Catch-age
measured with measured with errorerror
Forward time Forward time progression from progression from age 1 recruitmentage 1 recruitment
Cohort abundance Cohort abundance subject to fishing,subject to fishing,flexible predation,flexible predation,and residual and residual naturalnaturalmortalitymortality
taiZtaitai eNN ,,
,,1,1,
)(,1,1
,tiSBtiti eSBN

Age-structured AnalysisAge-structured Analysis
Age
3 4 5 6 7 8 ... Total
1989
1990
1991
1992
1993
1994
Year 1995
1996
1997
1998
1999
2000
Recruitment
Natural MortalityFishing MortalityGrowthMovement
Progression of aYear-class or Cohort
Spawner-RecruitRelationship

Modeling Predation MortalityModeling Predation MortalityAnnual Ingestion of Predator Age (grams)Annual Ingestion of Predator Age (grams)
= consumption of modeled prey of interest= consumption of modeled prey of interest
+ consumption of non-modeled ‘other food’.+ consumption of non-modeled ‘other food’.
Where annual ingestion rate is given by:Where annual ingestion rate is given by:
bj
bjbj GE
GII
,
,, 5.0*1
11.0
inf,
,,
j
bjbj W
wGE
Growth Increment
Growth Efficiency Hall et al. in press

Components of Modeled Prey (1)Components of Modeled Prey (1)
Predator Predator j j of size of size bb preference for prey of preference for prey of size size aa.. (from Ursin 1971, where size-preference is (from Ursin 1971, where size-preference is
a function of predator-prey weight-at-age a function of predator-prey weight-at-age ratio)ratio)
Predator Predator jj preference for prey of species preference for prey of species ii.. (from AFSC data, as a ratio of prey (from AFSC data, as a ratio of prey ii
consumed relative to total prey consumed; consumed relative to total prey consumed; changes over time)changes over time)
g~
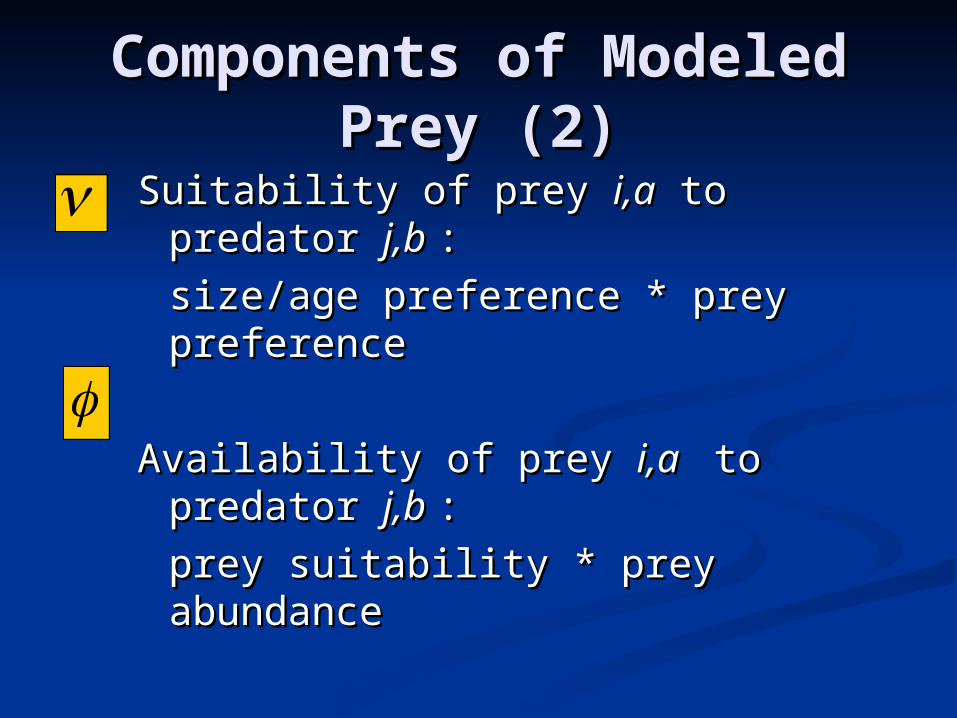
Components of Modeled Prey (2)Components of Modeled Prey (2)
Suitability of prey Suitability of prey i,ai,a to predator to predator j,b j,b ::
size/age preference * prey size/age preference * prey preferencepreference
Availability of prey Availability of prey i,a i,a to predator to predator j,b j,b ::
prey suitability * prey abundanceprey suitability * prey abundance

Total Annual ConsumptionTotal Annual ConsumptionConsumption of prey Consumption of prey i,ai,a by predator by predator j,bj,b
tbj
tbjaitbjbj NI
,,
,,,,,,,
Prey Availability
Predator Abundance
PredatorIngestion
Total Available Food(Modeled Prey And Other Food)
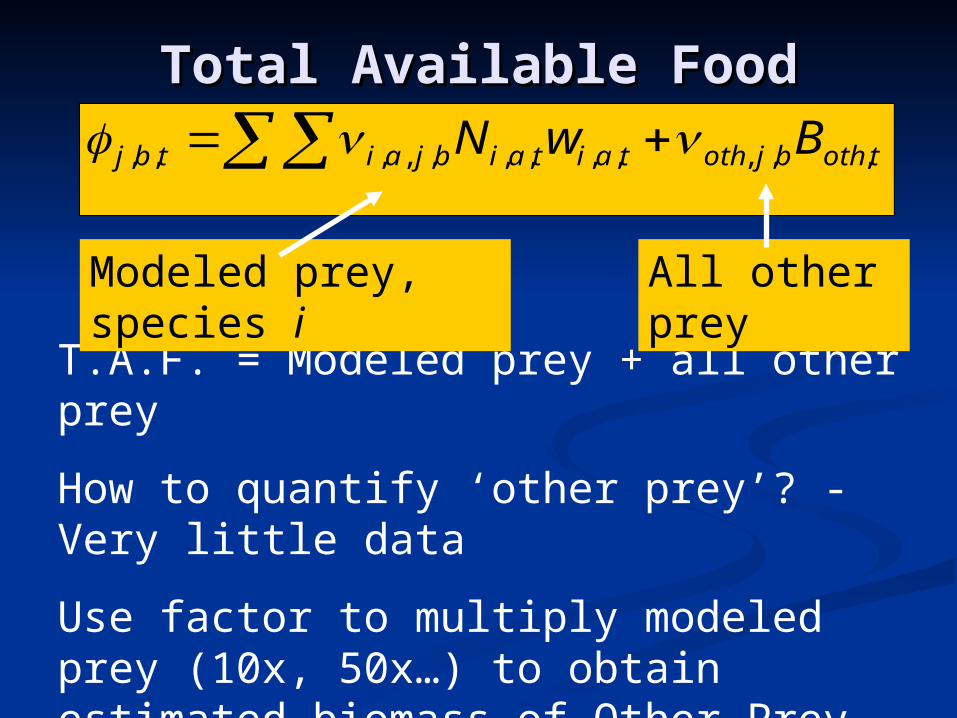
Total Available FoodTotal Available Food
T.A.F. = Modeled prey + all other prey
How to quantify ‘other prey’? - Very little data
Use factor to multiply modeled prey (10x, 50x…) to obtain estimated biomass of Other Prey
Set multiplier as parameter to be estimated
Modeled prey, species i
tothbjothtaitaibjaitbj BwN ,,,,,,,,,,,,
All other prey
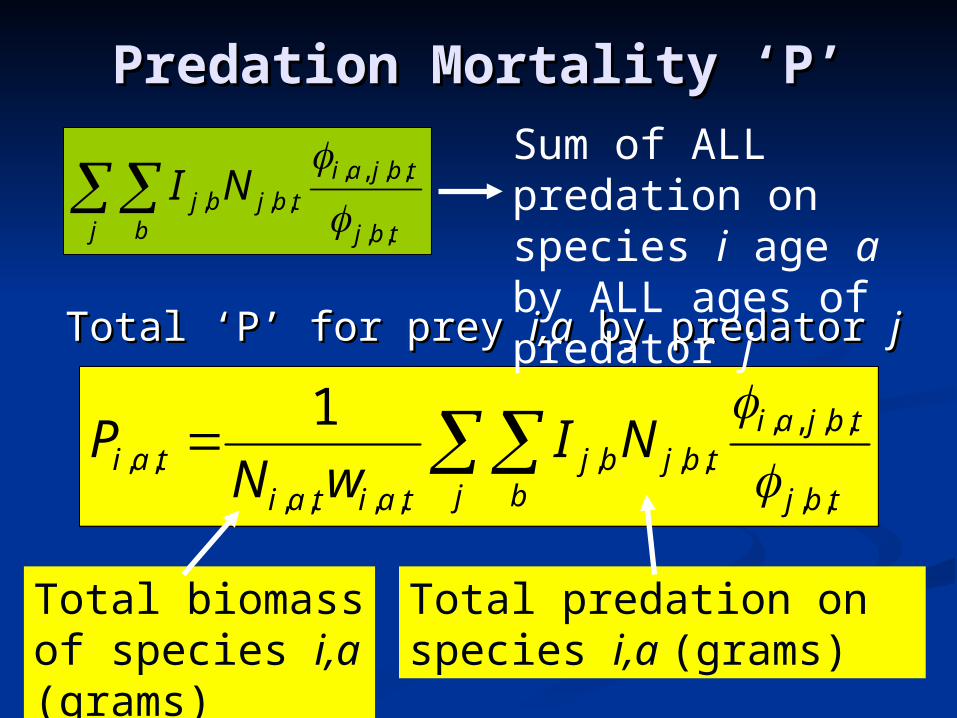
Total ‘P’ for prey Total ‘P’ for prey i,ai,a by predator by predator jj
Predation Mortality ‘P’Predation Mortality ‘P’
j b tbj
tbjaitbjbj
taitaitai NI
wNP
,,
,,,,,,,
,,,,,,
1
j tbj
tbjai
btbjbj NI
,,
,,,,,,, Sum of ALL predation
on species i age a by ALL ages of predator j
Total predation on species i,a (grams)
Total biomass of species i,a (grams)

Cohort AbundanceCohort Abundance
)....(,,1,1,
21 nPPPFRtaitai eNN
Residual Natural Mortality
Fishing Mortality
Predation Mortality
nPPPRM ...21
Traditional Natural Mortality ‘M’

Initial Model Set-upInitial Model Set-up
Pacific Cod (Pacific Cod (Gadus Gadus macrocephalus)macrocephalus)
Arrowtooth Flounder Arrowtooth Flounder (Atheresthes stomias)(Atheresthes stomias)
Walleye Pollock Walleye Pollock (Theragra chalcogramma)(Theragra chalcogramma)

Initialization ParametersInitialization Parameters
Abundance at age for year 1(SAFE)Abundance at age for year 1(SAFE) Fixed overall F (Mean 1981 – 2001)Fixed overall F (Mean 1981 – 2001) Fixed R (0.1)Fixed R (0.1) Spawner-Recruit alpha and betaSpawner-Recruit alpha and beta Prey Preference (Mean 1981 – 2001)Prey Preference (Mean 1981 – 2001)

Changes in Prey PreferenceChanges in Prey PreferenceProportion of Walleye Pollock in
Pacific Cod diet by Decade
0.185
0.146
0.0620.000
0.050
0.100
0.150
0.200
0.250
1980 1990 2000
Proportion of Walleye Pollock inArrowtooth Flounder diet
0.3970.391
0.285
0.000
0.100
0.200
0.300
0.400
0.500
1980 1990 2000
Proportion of Walleye Pollock inWalleye Pollock diet by Decade
0.1540.169
0.070
0.000
0.050
0.100
0.150
0.200
0.250
1980 1990 2000

LN Biomass estimates from triennial surveys
12
12.5
13
13.5
14
14.5
15
1982 1984 1986 1988 1990 1992 1994 1996 1998 2000 2002
Year
Population Trends (SAFE)Population Trends (SAFE)
Arrowtooth Flounder
Walleye Pollock
Pacific Cod

Initial Results Initial Results
Fishing pressure on pollock too great
Insufficient food available to pollock
LN Biomass
0
3
6
9
12
15
18
1980 1985 1990 1995 2000 2005
Arrowtooth Flounder
Pacific Cod Walleye Pollock

LN Biomass
14
14.5
15
1980 1985 1990 1995 2000
Increase ‘Other Food’ factor Increase ‘Other Food’ factor from 10x to 50xfrom 10x to 50x
Walleye Pollock
Arrowtooth Flounder Pacific Cod
BASE CASE SCENARIO

Predation Mortality from Base CasePredation Mortality from Base Case
Predation on ATF 1981 - 2001
0
0.001
0.002
0.003
0.004
0.005
0.006
0.007
0.008
1980 1985 1990 1995 2000
Predation on Pollock 1981 - 2001
0
0.05
0.1
0.15
0.2
1980 1985 1990 1995 2000
Predation on Cod 1981 - 2001
0
0.0002
0.0004
0.0006
0.0008
0.001
1980 1985 1990 1995 2000
Pollock
Pollock
Cod
Cod
ATF
ATF
ATF

LN biomass
0
24
68
10
1214
16
1980 1985 1990 1995 2000
Full Recruitment ‘F’ for pollock at 1Full Recruitment ‘F’ for pollock at 1
Predation on ATF 1981 - 2001
0
0.001
0.002
0.003
0.004
0.005
0.006
0.007
0.008
1980 1985 1990 1995 2000
Pollock
Cod ATF
ATF
Cod
Predation on ATF 1981 - 2001
0
0.1
0.2
0.3
0.4
0.5
0.6
0.7
0.8
1980 1985 1990 1995 2000 2005
Cod
Predation on ATF 1981 – 2001 Base Case Predation on ATF 1981 – 2001 F = 1

Full Recruitment ‘F’ for pollock at 1Full Recruitment ‘F’ for pollock at 1
LN Biomass
02468
10121416
1980 1985 1990 1995 2000
Predation on ATF 1981 - 2001
0
0.1
0.2
0.3
0.4
0.5
0.6
0.7
0.8
1980 1985 1990 1995 2000 2005
LN biomass
0
24
68
10
1214
16
1980 1985 1990 1995 2000
Predation on ATF 1981 - 2001
0
0.1
0.2
0.3
0.4
0.5
0.6
0.7
0.8
1980 1985 1990 1995 2000
Other Food factor = 50x Other Food factor = 100x

Predation on Pollock 1981 - 2001
0
0.05
0.1
0.15
0.2
1980 1985 1990 1995 2000
Predation on Pollock 1981 - 2001
0
0.05
0.1
0.15
0.2
1980 1985 1990 1995 2000
Full Recruitment ‘F’ for pollock at 0Full Recruitment ‘F’ for pollock at 0LN Biomass
14
15
16
17
18
19
1980 1985 1990 1995 2000
Pollock
Cod
ATF
Pollock
ATF
ATFCod
Cod
Predation on Pollock 1981-2001: Base Case Predation on Pollock 1981-2001: F = 0
Pollock

Full Recruitment ‘F’ for pollock at 0Full Recruitment ‘F’ for pollock at 0
Predation on ATF 1981 - 2001
0
0.002
0.004
0.006
0.008
0.01
0.012
1980 1985 1990 1995 2000
Predation on ATF 1981-2001: F = 0Predation on ATF 1981 - 2001
0
0.001
0.002
0.003
0.004
0.005
0.006
0.007
0.008
1980 1985 1990 1995 2000
Predation on ATF 1981 – 2001 Base Case
LN Biomass
14
15
16
17
18
19
1980 1985 1990 1995 2000
Pollock
Cod
Cod
Cod
ATF
ATF ATF

Model SensitivitiesModel Sensitivities
Prey AbundancePrey Abundance Predator AbundancePredator Abundance Prey preference and ‘Other Prey preference and ‘Other
Food’ factorFood’ factor Fishing PressureFishing Pressure
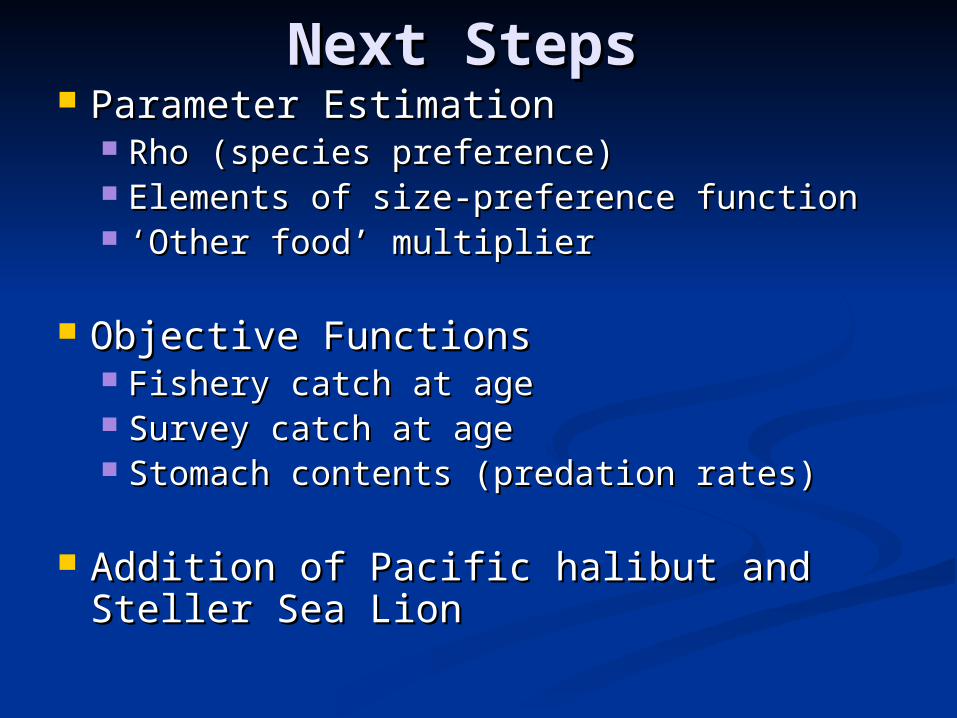
Next StepsNext Steps Parameter EstimationParameter Estimation
Rho (species preference)Rho (species preference) Elements of size-preference functionElements of size-preference function ‘‘Other food’ multiplierOther food’ multiplier
Objective FunctionsObjective Functions Fishery catch at ageFishery catch at age Survey catch at ageSurvey catch at age Stomach contents (predation rates)Stomach contents (predation rates)
Addition of Pacific halibut and Steller Addition of Pacific halibut and Steller Sea LionSea Lion

Areas for ExplorationAreas for Exploration Predation between age classes Predation between age classes
and connection with fishing and connection with fishing pressurepressure
Complexity of multi-species Complexity of multi-species model vs. robustness of single model vs. robustness of single species modelsspecies models
Estimation of recruitment Estimation of recruitment parameters once other parameters once other parameters are setparameters are set