A multi-level representation paradigm for handwriting ...
22
A multi-level representation paradigm for handwriting stroke generation Re ´jean Plamondon * , Moussa Djioua De ´partement de Ge ´nie E ´ lectrique, Laboratoire Scribens, E ´ cole Polytechnique de Montre ´al, P.O. Box 6079, Station Centre-Ville, Montre ´al, Canada H3C 3A7 Available online 4 October 2006 Abstract The study of rapid strokes is a direct or indirect prerequisite in many fundamental research pro- jects, as well as in the design of many practical applications dealing with handwriting. This paper outlines a family of models, derived from the Kinematic Theory of Human Movements. It explains how the nested models in this family can be used coherently, in the context of a multi-level represen- tation paradigm, to analyze both the trajectory and the velocity of strokes with a progressive amount of detail. In the context of a comprehensive survey of previously published work, this paper high- lights many new features of stroke production, when the vectorial version of the theory is fully exploited. In this perspective, the Kinematic Theory is depicted as a potential tool to facilitate com- munications among researchers working in the multi-disciplinary field of Graphonomics. Ó 2006 Elsevier B.V. All rights reserved. PsycINFO classification: 2330; 2221; 4140; 2540; 2560 Keywords: Kinematic Theory; Handwriting strokes; Delta–lognormal; Sigma–lognormal; Neuromuscular systems; Rapid-aimed movements 1. Introduction Handwriting strokes constitute a specific class of rapid human movements, similar to pointing and reaching movements in two dimensions. From the point of view of a 0167-9457/$ - see front matter Ó 2006 Elsevier B.V. All rights reserved. doi:10.1016/j.humov.2006.07.004 * Corresponding author. Tel.: +1 514 340 4711x4539; fax: +1 514 340 5122. E-mail addresses: [email protected] (R. Plamondon), [email protected] (M. Djioua). Human Movement Science 25 (2006) 586–607 www.elsevier.com/locate/humov
Transcript of A multi-level representation paradigm for handwriting ...
Human Movement Science 25 (2006) 586–607
www.elsevier.com/locate/humov
A multi-level representation paradigmfor handwriting stroke generation
Rejean Plamondon *, Moussa Djioua
Departement de Genie Electrique, Laboratoire Scribens, Ecole Polytechnique de Montreal,
P.O. Box 6079, Station Centre-Ville, Montreal, Canada H3C 3A7
Available online 4 October 2006
Abstract
The study of rapid strokes is a direct or indirect prerequisite in many fundamental research pro-jects, as well as in the design of many practical applications dealing with handwriting. This paperoutlines a family of models, derived from the Kinematic Theory of Human Movements. It explainshow the nested models in this family can be used coherently, in the context of a multi-level represen-tation paradigm, to analyze both the trajectory and the velocity of strokes with a progressive amountof detail. In the context of a comprehensive survey of previously published work, this paper high-lights many new features of stroke production, when the vectorial version of the theory is fullyexploited. In this perspective, the Kinematic Theory is depicted as a potential tool to facilitate com-munications among researchers working in the multi-disciplinary field of Graphonomics.� 2006 Elsevier B.V. All rights reserved.
PsycINFO classification: 2330; 2221; 4140; 2540; 2560
Keywords: Kinematic Theory; Handwriting strokes; Delta–lognormal; Sigma–lognormal; Neuromuscularsystems; Rapid-aimed movements
1. Introduction
Handwriting strokes constitute a specific class of rapid human movements, similarto pointing and reaching movements in two dimensions. From the point of view of a
0167-9457/$ - see front matter � 2006 Elsevier B.V. All rights reserved.
doi:10.1016/j.humov.2006.07.004
* Corresponding author. Tel.: +1 514 340 4711x4539; fax: +1 514 340 5122.E-mail addresses: [email protected] (R. Plamondon), [email protected] (M. Djioua).

R. Plamondon, M. Djioua / Human Movement Science 25 (2006) 586–607 587
discontinuous representation scheme, they are often considered as basic movement units,the primitives that are used by a writer to produce more complex patterns like a graph, aletter, a word, a signature, etc. They can, in a sense, be considered as a quantum ofmovements.
Handwriting strokes have been used and studied in many fields of research, and formany reasons. In pattern recognition, for example, numerous algorithms have beendesigned to recognize handwriting based on the properties of the elementary strokes orprimitives that have been used to generate a character or a letter (Plamondon & Srihari,2000; Plamondon, Lopresti, Schomaker, & Srihari, 1999). In the forensic sciences, adetailed study of individual stroke patterns, focusing on tiny variations, often constitutesthe grounds for a decision about the authenticity of a signature (Hilton, 1993; Simner &Girouard, 2000). In education, many teaching methods rely on the production of neatstrokes and their concatenation to generate letters and words (Simner, Leedham, & Thom-assen, 1996; Wann, Wing, & Søvik, 1991). In motor control, the production of strokes isstudied from various points of view (speed-accuracy tradeoffs, optimization principles, finemotor control strategies, developmental coordination, etc.) to gain a better understandingof the underlying cognitive and neuromuscular processes involved in their production(Meulenbroek & Van Gemmert, 2003; Van Galen & Morasso, 1998; Van Gemmert &Teuling, 2004). In the neurosciences, strokes are analyzed to characterize neurodegenerativeprocesses like Parkinson’s and Alzheimer’s disease (Schroter et al., 2003; Teuling &Stelmach, 1991). They are also used as key patterns to evaluate the recovery processes inthe rehabilitation of patients from cerebrovascular accidents (Rohrer et al., 2002). Inanthropomorphic robotics, handwriting strokes are used to explore the biomechanical prin-ciples employed by humans to produce movements and to apply these concepts to control arobot arm (Potkonjac, 2005). Writing robots are also used to study ink-trace depositionsunder controlled conditions for forensic signature analysis (Franke & Schomaker, 2004).
Teams focus on various aspects of handwriting strokes, depending on their researchgoals. Some groups are more interested in their global properties (number, length, curva-ture, duration, etc.), while others analyze local details like glitches, velocity or accelerationpeaks, for example. Still others are more concerned with the residual handwritten trajec-tory left on a piece of paper, a digitizer or a tablet computer, or with the kinematics orkinetic properties of the strokes.
Many of these studies rely, directly or indirectly, on a stroke generation model. Such amodel is used as a cornerstone, a framework on which a research paradigm is built. Manyof these models assume that complex patterns like words are made up of simple strokesthat are concatenated or superimposed to generate a specific pentip trajectory. In this per-spective, a simple stroke is seen as reflecting some fundamental properties of the neuro-muscular system of a participant, as well as some basic features of the control strategiesthat are used to produce a simple movement. The study of individual strokes becomes aspecific research theme in and of itself.
Many stroke generation models have been proposed over the years in the context of thevarious applications previously mentioned (see, for example, Bullock, Grossberg, &Mannes, 1993; Edelman & Flash, 1987; Plamondon & Guerfali, 1998; Plamondon &Maarse, 1989; Wada, Koike, Vatikiotis-Bateson, & Kawato, 2005). In this paper, we pres-ent a paradigm to analyze single strokes at various levels of representation, depending onthe research goals pursued. Using the Kinematic Theory of Rapid Human Movements(Plamondon, 1995a, 1995b, 1998), we characterize the impulse response of neuromuscular
588 R. Plamondon, M. Djioua / Human Movement Science 25 (2006) 586–607
networks with lognormal functions, and use a combination of these functions, as well asvarious levels of parametric description, to study both the stroke kinematics and its result-ing trajectory, either as a function of time or as a spatial 2D image only.
In the next section, we present typical digitizer data to illustrate the great variability dis-played by healthy human participants, even in the production of simple strokes. Then, wesummarize the main observations that a movement generator has to reproduce in order tomimic these conscious or unconscious behaviors. In Section 3, we provide a brief overviewof the Kinematic Theory, and explain how these phenomena can be simulated using log-normal impulse responses to describe the synergetic action of neuromuscular networks. Inthe following section, we present various simulation results to illustrate our computationalapproach. In Section 5, the results are discussed in the context of movement control andstroke variability, as well as in the setting of various potential applications. This papersummarizes previously published work under a single framework and, in doing so, high-lights several new aspects of the Kinematic Theory, particularly those dealing with the vec-torial representation of the input commands and its impact on trajectory direction andcurvature computation. Throughout the paper, we add practical comments dealing withthe tradeoffs between representation levels, reproduction quality and specific study goals.
2. Stroke variability: Typical experimental results
When a healthy human participant produces a rapid stroke with his dominant handfrom a restful posture on a digitizer, the pentip trajectory is characterized by several prop-erties similar to those normally encountered in the production of rapid movements (e.g.,Gielen, Van den Oosten, & Van den Pullter, 1985; Latash, 1998; Morasso, 1981; Plamon-don, 2003; Zatsiorsky, 1998):
1. The trajectory is nearly straight.2. There might be up to two reversals in the direction of motion at the end of the trajec-
tory (or one at the beginning and one at the end).3. The velocity profile might have up to three peaks, the dominant one being slightly
asymmetric.4. The asymmetry of the main velocity peak might be reversed at very high speed.5. The acceleration profile might have up to four peaks.
If the participant is required to produce a curved stroke, the trajectory is fairly bent butstill encompasses the last four of the above properties. Moreover, when a participantrepeats the same rapid movement many times, some variability is observed, dependingon the participant, but each individual trajectory possesses the aforementioned properties,as long as the movements are fast and there is no trembling or hesitation.
In the next figure, we illustrate some of these basic properties. The examples we give aretypical of the numerous data sets collected over the years in our laboratory, using variousexperimental protocols derived from the following scenario.
A healthy young participant is sitting in a comfortable position, and is required to pro-duce rapid strokes (straight or curved) on a digitizer from a given starting position, withhis dominant hand. Some experimental protocols specify conditions like stroke length,required accuracy, minimization of movement time, etc. (see, e.g., Alimi & Plamondon,1994; Plamondon, Stelmach, & Teasdale, 1990). In some cases, the participant is in a reac-

R. Plamondon, M. Djioua / Human Movement Science 25 (2006) 586–607 589
tion-time experiment, and in others he is given the freedom to produce the required strokewhen he is ready to do so. He may be required to voluntarily produce some directionreversals at the beginning or at the end of a single stroke. Sometimes these glitches willjust appear in the trajectory on a random basis. In all these experiments, the straight orcurved strokes produced by the participants reflect the previously listed properties. Therelative frequency of appearance of a specific feature might change from one protocolto another, but what is of interest for the present analysis is the variety of cases observed,since it is these patterns that we want to simulate and analyze here.
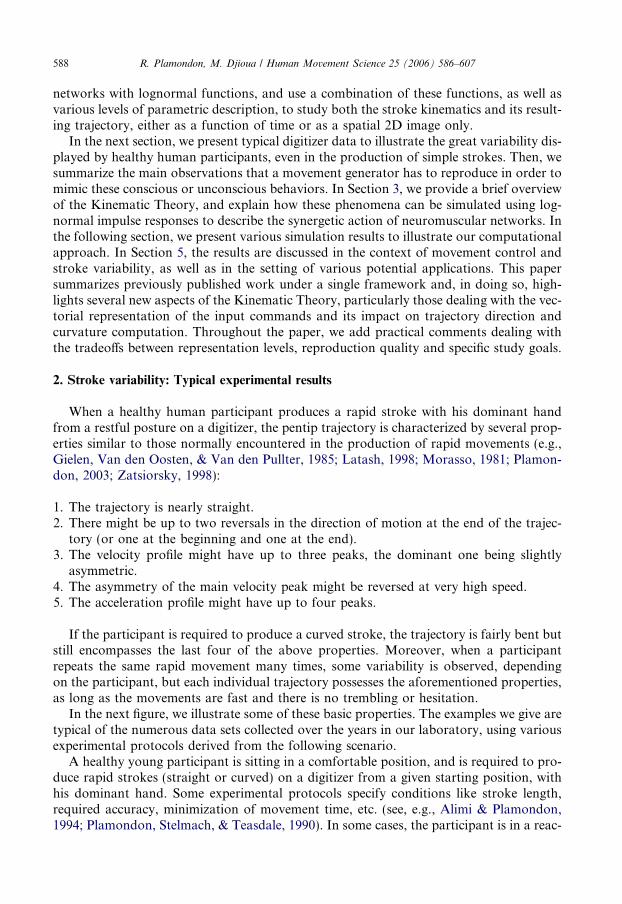
Fig. 1 shows typical examples of strokes produced by a human participant when askedto perform a rapid movement. Figs. 1a and 1b show straight strokes, while Figs. 1c and 1ddepict curved ones. Under each trajectory, we have plotted the corresponding magnitudeof the velocity profiles as computed from digitizer data using time-derivative filters. Unlikethe authors of previous papers (e.g., Woch & Plamondon, 2003, 2004), we have notinverted the velocity profiles to illustrate the direction reversals, since we consider thiseffect from a more general viewpoint here, by taking into account the direction of thevelocity vector. We do not present the acceleration profiles either, since they can bedirectly obtained by time-derivation of the velocity profiles, and, as such, they automati-cally encompass the properties described in point 5. For example, a two peak smooth
6 8 10 12 14 16 18 20 22 245
10
15
20
x [cm]
y [c
m]
8 10 12 14 16 18 20 22 242
4
6
8
10
12
14
16
x [cm]
y [c
m]
0.1 0.2 0.3 0.4 0.5 0.6 0.7 0.8 0.9 10
20
40
60
80
100
120
Time [s] Time [s]
Vel
oci
ty [
cm/s
]
Vel
oci
ty [
cm/s
]
0 0.1 0.2 0.3 0.4 0.5 0.6 0.7 0.8 0.9 1
0
50
100
150
200
250
Fig. 1a and 1b. Typical examples of strokes produced by a human participant when performing a rapidmovement. Upper graph: straight trajectories; lower graph: velocity profiles.
6 8 10 12 14 16 18 20 22 242
4
6
8
10
12
14
16
18
x [cm]
y [c
m]
6 8 10 12 14 16 18 20 22 244
6
8
10
12
14
16
18
20
x [cm]
y [c
m]
0.1 0.2 0.3 0.4 0.5 0.6 0.7 0.80
50
100
150
200
250
300
Time [s]
Vel
oci
ty [
cm/s
]
0.1 0.2 0.3 0.4 0.5 0.6 0.7 0.80
50
100
150
200
Time [s]
Vel
oci
ty [
cm/s
]
Fig. 1c and 1d. Typical examples of curved strokes produced by a human participant when performing a rapidmovement. Upper graph: curved trajectories; lower graph: velocity profiles.
590 R. Plamondon, M. Djioua / Human Movement Science 25 (2006) 586–607
velocity profile leads to a three peak acceleration profile (Plamondon, 1998). The readermust notice that these dynamic features might not be as easily observed when one dealswith elderly or motor disabled participants. In these cases, movements are often slow.The velocity profiles are not smooth and this results in acceleration profiles that often havea larger number of peaks.
As one can see, some of the basic features reported in the introduction are clearlyillustrated in these typical examples. The trajectory is not perfectly straight (Figs. 1aand 1b) or circular (Figs. 1c and 1d). Some glitches can be observed, and these glitchesare not exactly in the opposite direction of the main displacement. Fig. 1a presents adirect trajectory with no glitches and a smooth velocity profile. Fig. 1b depicts an almoststraight trajectory with a large glitch at the beginning, its velocity profile being smoothand having two peaks. Figs. 1c and 1d exhibit trajectories with two glitches: a slightlycurved trajectory with one glitch at the beginning and one at the end (Fig. 1c), and acurved stroke with two small glitches at the end (Fig. 1d). Both velocity profiles havethree peaks in these cases.
In previous papers (Plamondon, 1998, 2003; Woch & Plamondon, 2001, 2003, 2004), wehave briefly explained the possible origin of velocity and acceleration variability on per-fectly straight strokes using the Kinematic Theory and its delta–lognormal equation.
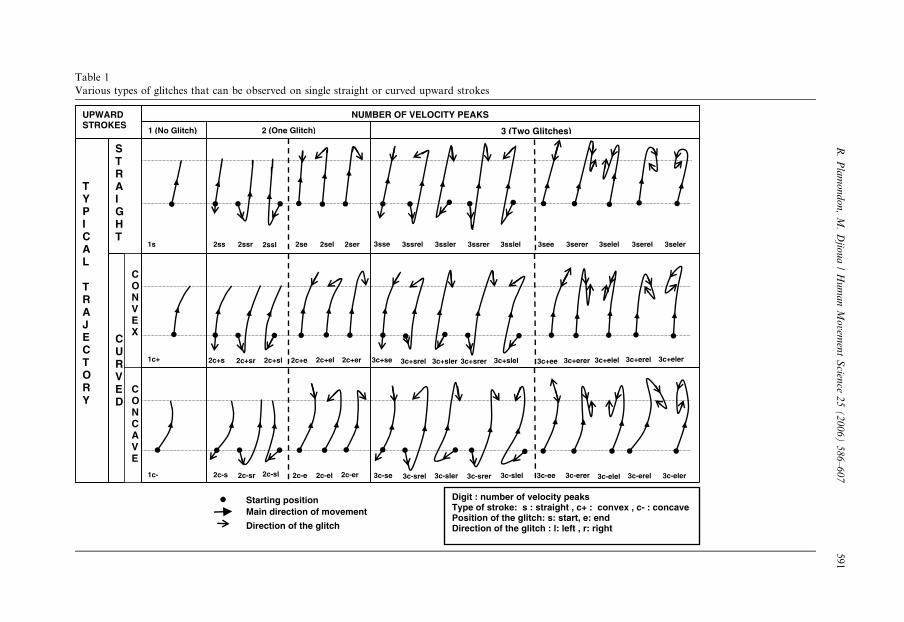
Table 1Various types of glitches that can be observed on single straight or curved upward strokes
NUMBER OF VELOCITY PEAKSUPWARDSTROKES
1 (No Glitch) 2 (One Glitch) 3 (Two Glitches)
STRAIGHT
CURVED
TYPICAL
TRAJECTORY
Starting positionMain direction of movement
Direction of the glitch
1s
1c+
1c-
2ss 2ssr 2ssl
2c+s 2c+sr 2c+sl
2c-s 2c-sr 2c-sl
2se 2sel 2ser
2c+e 2c+el 2c+er
2c-e 2c-el 2c-er
3sse 3ssrel 3ssler 3ssrer 3sslel
3c+se 3c+srel 3c+sler 3c+srer 3c+slel
3c-se 3c-srel 3c-sler 3c-srer 3c-slel
3see 3serer 3selel 3serel 3seler
3c+ee 3c+erer 3c+elel 3c+erel 3c+eler
3c-ee 3c-erer 3c-elel 3c-erel 3c-eler
CONVEX
CONCAVE
Digit : number of velocity peaks Type of stroke: s : straight , c+ : convex , c- : concavePosition of the glitch: s: start, e: endDirection of the glitch : l: left , r: right
R.
Pla
mo
nd
on
,M
.D
jiou
a/
Hu
ma
nM
ovem
ent
Scien
ce2
5(
20
06
)5
86
–6
07
591

592 R. Plamondon, M. Djioua / Human Movement Science 25 (2006) 586–607
We have shown, among other things, that properties 3–5 can be explained by the variabil-ity associated with the seven parameters of the delta–lognormal equation.
Since this equation describes the magnitude of the velocity vector, it does not providemany cues for the analysis of the variability of the trajectory itself, except for the directionreversals at the beginning or the end of the trajectory (property 2). To analyze directionaleffects and their variability in more detail, the Kinematic Theory must be used in full, thatis, in its vectorial version (Plamondon & Djioua, 2005; Plamondon & Guerfali, 1998).
In the next sections, we use such an approach to depict the various predictions of theKinematic Theory with respect to stroke trajectory variability. We focus mainly on direc-tion variability, and provide, among other things, some explanations for several phenom-ena like the departure from straight lines and the presence of glitches, as well as thepossibility of generating curved paths.
In Table 1 we have schematically summarized the various types of glitches that can beobserved on single straight or curved upward strokes, depending on the number of peaksin their velocity profiles. The starting position is indicated by a black dot and the maindirection of movement by a full arrow. An open arrow highlights the direction of a specificglitch. A similar set of patterns would be observed for downward strokes. Moreover, anyof these patterns can emerge unintentionally, or can be voluntarily generated by a partic-ipant producing a single rapid movement.
The comprehensive reproduction of these patterns is a challenge for any theory ormodel aimed at describing basic movement primitives in an economical way. How canwe explain such trajectory variability and such consistency in the observed variability?These are the fundamental questions that we address in the remainder of this paper.
3. Kinematic Theory
The fundamental idea that constitutes the cornerstone of the Kinematic Theory(Plamondon, 1995a, 1995b, 1998; Plamondon, Feng, & Woch, 2003) is that a neuromus-cular system involved in the production of a rapid movement can be considered locally asa linear system made up of a large number of coupled subsystems controlling the velocityof the end effector. The impulse response of such a system converges toward a lognormalfunction when the number of subsystems is very large and when the coupling between sub-systems can be described globally with a proportionality relationship between the cumu-lative time delays of adjacent subsystems.
In this context, the output of a specific neuromuscular system i is a velocity vectordescribed by
~viðt � t0iÞ ¼ ~DiKiðt; t0i; li; r2i Þ; ð1Þ
where
Kiðt; t0i; li; r2i Þ ¼
1
ri
ffiffiffiffiffiffi2ppðt � t0iÞ
exp � 1
2r2i½lnðt � t0iÞ � li�
2
� �; ð2Þ
~Di: vector describing the amplitude and the direction of the input command i; t0i: timeoccurrence of the input command i; li: logtime delay; the time delay of neuromuscular sys-tem i on a logarithmic time scale; ri: logresponse time; the response time of neuromuscularsystem i on a logarithmic time scale.

R. Plamondon, M. Djioua / Human Movement Science 25 (2006) 586–607 593
3.1. Delta–lognormal model (DK)
According to the delta–lognormal (DK) paradigm, the production of a rapid strokerequires the synergetic activation of two neuromuscular systems, one agonist and the otherantagonist to the direction of the movement. These two systems are simultaneously acti-vated by two input commands ~D1 (agonist) and ~D2 (antagonist) at a time t0. These syn-chronous commands propagate in parallel across the two neuromuscular systems, eachof which is described by a lognormal impulse response and has its own timing properties.
In this context, the two neuromuscular systems are assumed to react in opposite direc-tions, and the Kinematic Theory predicts that the magnitude of the velocity profilej~vðt � t0Þj will be described by a delta–lognormal equation (Plamondon, 1995a; Plamon-don et al., 2003):
j~vðt � t0Þj ¼ j~D1jK1ðt; t0; l1; r21Þ � j~D2jK2ðt; t0; l2; r
22Þ: ð3Þ
This model produces rectilinear strokes and predicts all the velocity patterns that can beobserved in a set of strokes (Plamondon, 1995a, 1995b). Taking the time derivative ofEq. (3) also leads to acceleration patterns that encompass all the basic features of rapidstrokes (Plamondon, 1998).
3.2. Sigma–lognormal model ð~RKÞ
The sigma–lognormal ð~RKÞ paradigm does not assume that the two neuromuscular sys-tems are working in precisely opposite directions. The output velocity is thus described bya vectorial summation of the contribution of each neuromuscular system involved in theproduction of a stroke (Plamondon & Guerfali, 1998):
~vðtÞ ¼~v1ðt � t0Þ þ~v2ðt � t0Þ;~vðtÞ ¼ ~D1K1ðt; t0; l1; r
21Þ þ ~D2K2ðt; t0; l2; r
22Þ;
ð4Þ
hereafter called a ~RK function (Plamondon & Djioua, 2005). This vectorial model is verygeneral, and is not limited to a single stroke description. It can be used to study complex2D patterns like handwriting (Plamondon & Guerfali, 1998), as well as 3D movements(Leduc & Plamondon, 2001). In this latter case, the summation is generally made overmore than two ~DiKi functions.
There are two versions of the ~RK model, the choice depending on the type of the inputcommand used, a straight vector or a curved vector.
3.2.1. Straight input vector
In this simpler version, the input commands ~Di are considered as standard linear vec-tors. In other words, the direction of motion is now taken into account by ~D1 and ~D2,the two vectorial input commands, both having an amplitude D1 or D2 and a directionh1 and h2 defined with respect to an arbitrary reference axis.
According to this vectorial paradigm, the magnitude of the velocity profile of a rapidaimed movement is given by
j~vðtÞj ¼ffiffiffiffiffiffiffiffiffiffiffiffiffiffiffiffiffiffiffiffiffiffiffiffiffiffiffiffiffiffiffiffiffiffiffiffiffiffiffiffiffiffiffiffiffiffiffiffiffiffiffiffiffiffiffiffiffiffiffiffiffiffiffiffiffiffiffiffiffiffiffiffiffiffiffiffiffiffiffiffiffiffiD2
1K21 þ D2
2K22 þ 2D1D2K1K2 cosðh2 � h1Þ
q; ð5Þ

594 R. Plamondon, M. Djioua / Human Movement Science 25 (2006) 586–607
where we have used Ki ¼ Kiðt; t0; li; r2i Þ for simplicity. Moreover, the direction of the
velocity as a function of time u(t) is given by
uðtÞ ¼ arctgD1K1 sin h1 þ D2K2 sin h2
D1K1 cos h1 þ D2K2 cos h2
� �: ð6Þ
It is common practice to analyze a movement with respect to its agonist (required) direc-tion, that is, to define h1 = 0. In this context, it can be seen that the ~RK function is a gen-eralization of the DK equation. Indeed, the latter can be directly obtained for the specificcase of two opposite input commands, that is, h2 � h1 = p. In fact, in this condition wehave:
j~vðtÞj ¼ffiffiffiffiffiffiffiffiffiffiffiffiffiffiffiffiffiffiffiffiffiffiffiffiffiffiffiffiffiffiffiffiffiffiffiffiffiffiffiffiffiffiffiffiffiffiffiffiffiffiffiffiffiffiffiffiffiffiffiD2
1K21 þ D2
2K22 � 2D1D2K1;K2
qð7Þ
¼ D1K1 � D2K2 ð8Þ¼ DK equation
with u(t) = 0, a constant in the direction h1 = 0 of the agonist movement, D1, D2 theamplitudes of the two vectorial commands.
The DK model predicts a horizontal straight line trajectory under these specific condi-tions, while the straight ~RK model expands these predictions. It can generate quasi-lineartrajectories, that is, strokes that are not perfectly linear, as well as some types of curvedstrokes (Plamondon & Djioua, 2005).
3.2.2. Curved ~RK model
A more complex and more precise version of the ~RK model can be obtained if it isassumed that the input command vectors are not straight, but curved. Their magnitudeis still described by Di ¼ j~Dij, but the vectors are described by circular arcs of constant cur-vature. The direction of these vectors evolves over time. This evolution can be taken intoaccount in two equivalent ways: either by working in terms of the vector curvature or interms of the starting and ending directions of the circular arc vector.
In the first case, Eq. (6) can be expressed by (Plamondon & Guerfali, 1998)
uiðtÞ ¼ hi þ Ci
Z t
t0
vðsÞds; ð9Þ
where hi is the initial direction of the ith input command and Ci describes the curvature ofthe ith circular arc. Using the relationship
Ci ¼hie � his
Di; ð10Þ
where his is the starting direction of the curved input command and hie the ending directionof the curved input command, then ui(t) can be expressed by (Djioua, 2006)
uiðtÞ ¼ his þhie � his
Di
Z t
t0i
viðsÞds: ð11Þ
These two paradigms describe a more general control of the individual stroke curvature byincorporating it directly into the vectorial model. Such a model can generate the largestvariety of strokes (Djioua, 2006; O’Reilly, Djioua, & Plamondon, 2005).

R. Plamondon, M. Djioua / Human Movement Science 25 (2006) 586–607 595
4. Stroke generation
All the previous models derived from the lognormal paradigm of the Kinematic Theorycan be seen as simplified versions of the curved ~RK model. Indeed, the straight ~RK modelcan be obtained if the following constraints are put on the curved model:
h1s ¼ h1e ¼ h1 ¼ constant;
h2s ¼ h2e ¼ h2 ¼ constantð12Þ
and, as we have seen, the DK model can be derived from the straight ~RK model, if
h2 � h1 ¼ p:
Using the curved ~RK model, the Kinematic Theory can be used to generate any singlestroke with almost any required precision, depending on the number of parameters thatare used in the computer simulations.
In the examples below, we have used the following relationship to reduce the number ofparameters:
h2s ¼ h1e þ p� Dh;
h2e ¼ h1s þ p� Dhð13Þ
that is, we have assumed that the starting antagonist direction h2s is in opposition (+p) tothe ending agonist direction h1e, plus or minus some variability factor (±Dh). Similarly, theending antagonist direction h2e was considered to be in opposition (+p) to the startingagonist direction h1s, plus or minus the same variability factor (±Dh).
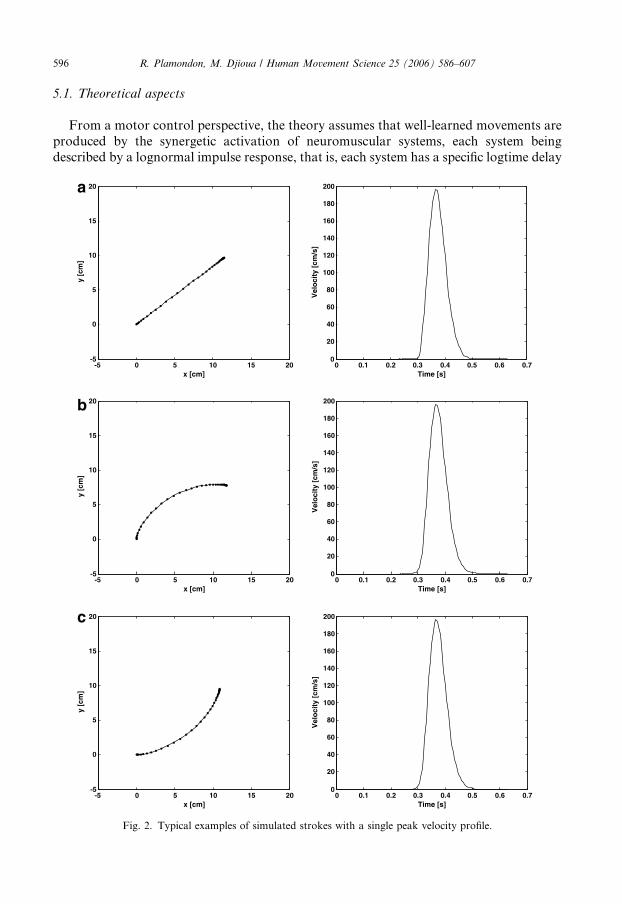
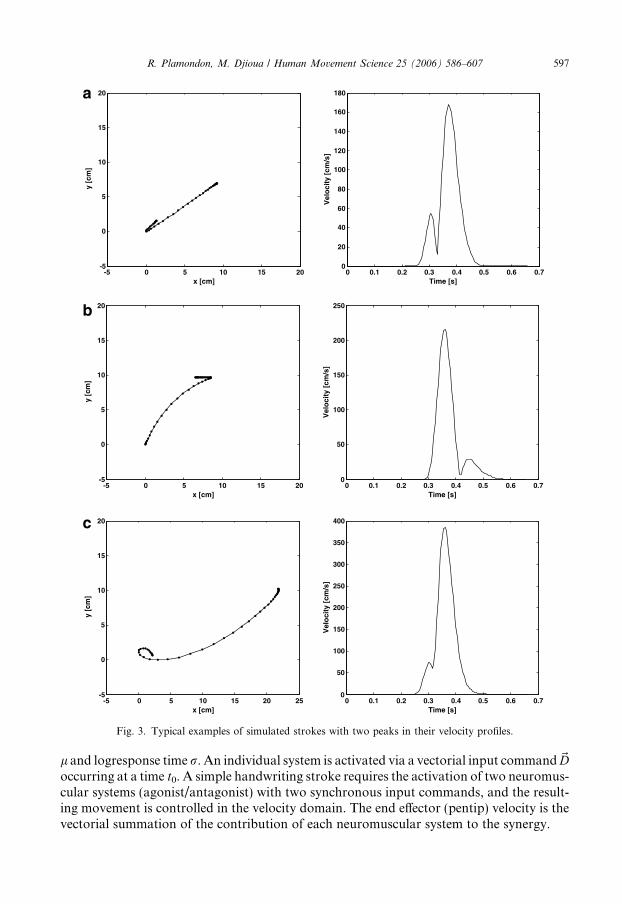
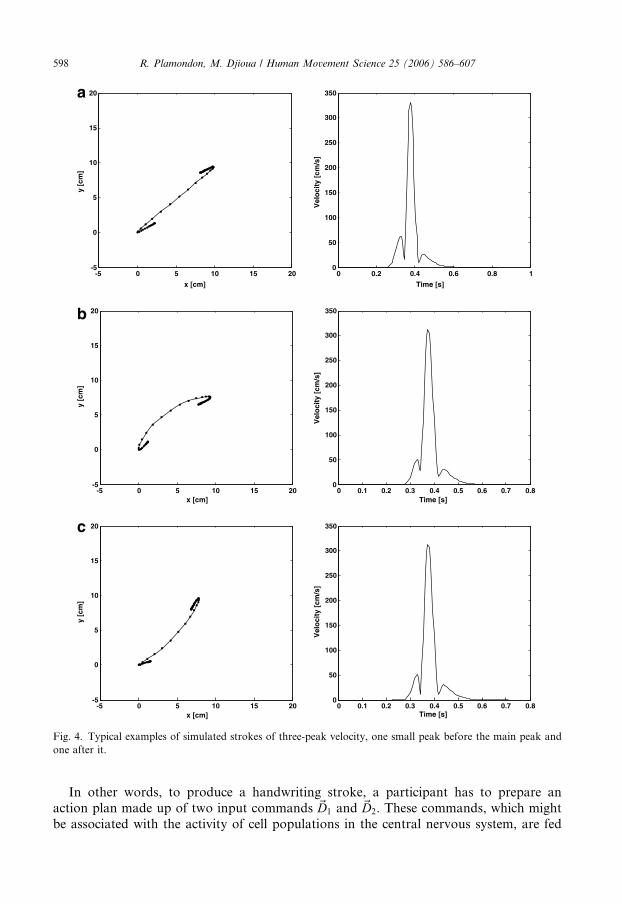
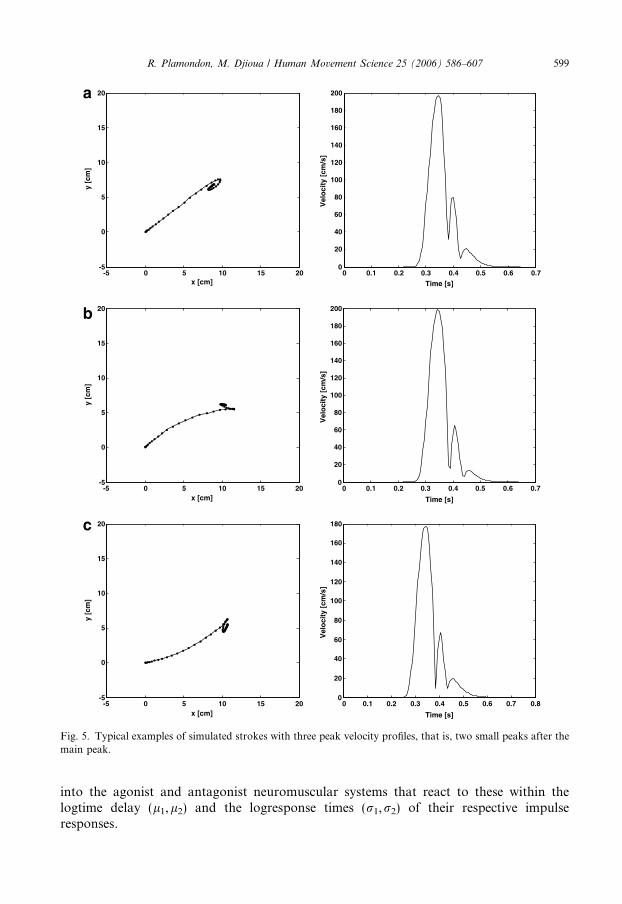
Fig. 2 depicts strokes with a single velocity peak: Fig. 2a straight (1s), Fig. 2b curved(convex: 1c+) and Fig. 2c curved (concave: 1c�) strokes. Fig. 3 presents the examplesof strokes with two velocity peaks, one from each group of the list schematized in Table1 (Fig. 3a straight: 1ssl, Fig. 3b convex: 1c + el and Fig. 3c concave: 1c � sl). Figs. 4 and 5deal with strokes having three peaks. Figs. 4a–c present specimens with one small peak atthe beginning and at the end of the stroke, while Figs. 5a–c depict strokes with two smallpeaks after the main peak. Here again, Figs. 4a and 5a show straight strokes (3sslel,3serel), while the examples in Figs. 4b, 5b and 4c, 5c show convex (3c + sler, 3c + eler)and concave (3c � slel, 3c � erer) strokes respectively, following the nomenclature ofTable 1. Table 3, presented in the appendix, gives the list of specific parameters that havebeen used for each simulation.
Extrapolating from these examples, the Kinematic Theory can take into account all thebasics patterns that can be observed on a single stroke, and, as such, can be used to gen-erate human-like strokes (cf. Fig. 1), both in the kinematics and the static representationspace. In the next section, we discuss this point theoretically, in terms of motor control,and, practically, in terms of the trade-off between the representation power of the theoryversus the number of parameters involved.
5. Discussion
The interest in using the Kinematic Theory to study handwriting strokes is that thesame paradigm can be used whatever the detail level needed for a specific application.It provides a unified point of view in terms of movement description and understanding.
596 R. Plamondon, M. Djioua / Human Movement Science 25 (2006) 586–607
5.1. Theoretical aspects
From a motor control perspective, the theory assumes that well-learned movements areproduced by the synergetic activation of neuromuscular systems, each system beingdescribed by a lognormal impulse response, that is, each system has a specific logtime delay
-5 0 5 10 15 20-5
0
5
10
15
20
x [cm]
y [c
m]
0 0.1 0.2 0.3 0.4 0.5 0.6 0.70
20
40
60
80
100
120
140
160
180
200
Time [s]
Vel
oci
ty [
cm/s
]
-5 0 5 10 15 20-5
0
5
10
15
20
x [cm]
y [c
m]
0 0.1 0.2 0.3 0.4 0.5 0.6 0.70
20
40
60
80
100
120
140
160
180
200
Time [s]
Vel
oci
ty [
cm/s
]
-5 0 5 10 15 20-5
0
5
10
15
20
x [cm]
y [c
m]
0 0.1 0.2 0.3 0.4 0.5 0.6 0.70
20
40
60
80
100
120
140
160
180
200
Time [s]
Vel
oci
ty [
cm/s
]
Fig. 2. Typical examples of simulated strokes with a single peak velocity profile.
-5 0 5 10 15 20-5
0
5
10
15
20
x [cm]
y [c
m]
0 0.1 0.2 0.3 0.4 0.5 0.6 0.70
20
40
60
80
100
120
140
160
180
Time [s]
Vel
oci
ty [
cm/s
]
-5 0 5 10 15 20-5
0
5
10
15
20
x [cm]
y [c
m]
0 0.1 0.2 0.3 0.4 0.5 0.6 0.70
50
100
150
200
250
Time [s]
Vel
oci
ty [
cm/s
]
-5 0 5 10 15 20 25-5
0
5
10
15
20
x [cm]
y [c
m]
0 0.1 0.2 0.3 0.4 0.5 0.6 0.70
50
100
150
200
250
300
350
400
Time [s]
Vel
oci
ty [
cm/s
]
Fig. 3. Typical examples of simulated strokes with two peaks in their velocity profiles.
R. Plamondon, M. Djioua / Human Movement Science 25 (2006) 586–607 597
l and logresponse time r. An individual system is activated via a vectorial input command~Doccurring at a time t0. A simple handwriting stroke requires the activation of two neuromus-cular systems (agonist/antagonist) with two synchronous input commands, and the result-ing movement is controlled in the velocity domain. The end effector (pentip) velocity is thevectorial summation of the contribution of each neuromuscular system to the synergy.
-5 0 5 10 15 20-5
0
5
10
15
20
0 0.2 0.4 0.6 0.8 10
50
100
150
200
250
300
350
-5 0 5 10 15 20-5
0
5
10
15
20
0 0.1 0.2 0.3 0.4 0.5 0.6 0.7 0.80
50
100
150
200
250
300
350
-5 0 5 10 15 20-5
0
5
10
15
20
0 0.1 0.2 0.3 0.4 0.5 0.6 0.7 0.80
50
100
150
200
250
300
350
x [cm]
y [c
m]
x [cm]
y [c
m]
x [cm]
y [c
m]
Time [s]
Vel
oci
ty [
cm/s
]
Time [s]
Vel
oci
ty [
cm/s
]
Time [s]
Vel
oci
ty [
cm/s
]
Fig. 4. Typical examples of simulated strokes of three-peak velocity, one small peak before the main peak andone after it.
598 R. Plamondon, M. Djioua / Human Movement Science 25 (2006) 586–607
In other words, to produce a handwriting stroke, a participant has to prepare anaction plan made up of two input commands ~D1 and ~D2. These commands, which mightbe associated with the activity of cell populations in the central nervous system, are fed
-5 0 5 10 15 20-5
0
5
10
15
20
0 0.1 0.2 0.3 0.4 0.5 0.6 0.70
20
40
60
80
100
120
140
160
180
200
-5 0 5 10 15 20-5
0
5
10
15
20
0 0.1 0.2 0.3 0.4 0.5 0.6 0.70
20
40
60
80
100
120
140
160
180
200
-5 0 5 10 15 20-5
0
5
10
15
20
0 0.1 0.2 0.3 0.4 0.5 0.6 0.7 0.80
20
40
60
80
100
120
140
160
180
x [cm]
y [c
m]
Time [s]
Vel
oci
ty [
cm/s
]
x [cm]
y [c
m]
Time [s]
Vel
oci
ty [
cm/s
]
x [cm]
y [c
m]
Time [s]
Vel
oci
ty [
cm/s
]
Fig. 5. Typical examples of simulated strokes with three peak velocity profiles, that is, two small peaks after themain peak.
R. Plamondon, M. Djioua / Human Movement Science 25 (2006) 586–607 599
into the agonist and antagonist neuromuscular systems that react to these within thelogtime delay (l1,l2) and the logresponse times (r1,r2) of their respective impulseresponses.

Table 2The various representation levels of a single stroke, as described by the Kinematic Theory
Model Parameters Number ofparameters
Comments
1. Curved sigma–lognormal
Command: D1, h1s, h1e,D2, h2s, h2e, t0
11 The most general curved strokegeneration model
System: l1, l2, r1, r2
2. Curved sigma–lognormal withdirection constraint
Command: D1, h1s, h1e,D2, Dh, t0
10 Antagonist direction linked tothe agonist direction
h2s ¼ h1e þ p� Dh;
h2e ¼ h1s þ p� Dh
System: l1, l2, r1, r2
3. Curved sigma–lognormal withcurvature constraint
Command: D1, h1s, D2,C0, t0
9 Link between curvature and direction
C0 ¼ ðhie � hisÞ=DiSystem: l1, l2, r1, r2
4. Linear sigma–lognormal
Command: D1, h1s, D2,h2s, t0
9 The most general linear strokegeneration model
System: l1, l2, r1, r2
5. Minimal sigma–lognormal
Command: D1, h1s, D2,h2s, t0
5 The simplest ~RK model: the systemparameters (l1,l2,r1,r2) are fixed tosome realistic values
6. Delta–lognormal
Command: D1, D2, t0 7 Perfect agonist/antagonist opposition
h2s � h1s ¼ p; h2e ¼ h2s; h1e ¼ h1sSystem: l1, l2, r1, r2
7. Minimal delta–lognormal
Command: D1, D2, t0 3 The simplest DK model: the systemparameters (l1,l2,r1,r2) are fixedto some realistic values
600 R. Plamondon, M. Djioua / Human Movement Science 25 (2006) 586–607
The complexity of the model is directly linked to the number of parameters used todescribe the input commands. We have summarized in Table 2 the various representa-tion levels that are available, in descending order of complexity. The most generalmodel, the curved ~RK, requires 11 parameters: four system parameters, six commandparameters, and t0, the time occurrence of the synchronous activation of the commands.According to this paradigm, the action plan is made up of curved vector commandsthat are specified by their magnitude (D) and their curvature as expressed in terms ofthe starting (hs) and the ending (he) directions of the vectors. Before making a stroke,a participant has had to estimate the stroke length as well as its curvature. This modelcan reproduce all the stroke patterns of Table 1. The other two versions of this model(rows 2 and 3) are computational tricks for reducing the number of parameters of thesystem by integrating some constraints between the agonist/antagonist directions (row2) or between the curvature and the direction (row 3). The third model is almost aspowerful as the first two, except that the glitches at the beginning and the end of astroke are always located on the same side (start-right and end-left, or start-left andend-right).
Such a model can be used to describe a single, joint movement, while the first two aremore appropriate to the study of multi-joint movements.
The linear ~RK model (row 4) works with rectilinear input commands. Only the initialdirection of the command is necessary to produce a realistic quasi-linear stroke with var-ious glitches as well as curved strokes, but, in this latter case, trajectories do not have
R. Plamondon, M. Djioua / Human Movement Science 25 (2006) 586–607 601
glitches. A simplified version of this model (row 5) assumes that the li, ri are fixed for agiven type of movement made by a stable synergy. These two models are appropriate, forexample, to study the variability of rectilinear strokes.
The Delta–lognormal model (row 6) is a linear ~RK with perfect agonist/antagonistopposition. The model produces straight strokes which can encompass glitches that arein the reverse direction of the movement. A simplified version of this model (row 7),assumes that the li, ri are fixed to some realistic values. These latter two models are gen-erally sufficient to study the velocity patterns associated with a single stroke. The straighterthe trajectory, the better the description.
5.2. Variability
As one can see, the variability observed in the production of a set of similar strokes bya participant can come from many sources, those being the various parameters used in agiven model. At the command level, fluctuations in the magnitude of the input com-mands will affect stroke length (D1 � D2) and stroke duration (linked to D1/D2) (Plamon-don, 1995b). They will also influence the relative importance of the agonist andantagonist contribution to a stroke, and they can produce directional change at bothends of a stroke. These glitches will not occur in the main orientation of the movement,if there are fluctuations in direction hi of the orientation of the input commands. How-ever, the changes that they generate, combined with fluctuations in the parameters li andri, will result in variations in the velocity profiles, as well as in departures from perfectlystraight or circular strokes. It must be noted, however, that a variation in t0 will notaffect either the kinematics or the static aspects of a trace, but will introduce a time trans-lation with respect to some time stamp, as defined, for example, in a reaction timeparadigm.
Moreover, these glitches can be produced voluntarily (sometimes with a little bit ofpractice) or unintentionally, depending on the fluency of the handwriting. In neither caseare the glitches considered as distinct strokes, however, since they are generated from a
0 20 40 60 80 100 120 140 160 180 200 2200
2
4
6
8
10
12
14
16
18
20
22
x [cm]
y [c
m]
0.5 0.55 0.6 0.65 0.7 0.75 0.8 0.85 0.9 0.95
50
100
150
200
250
300
350
400
450
500
550
Time [s]
Vel
oci
ty [
cm/s
]
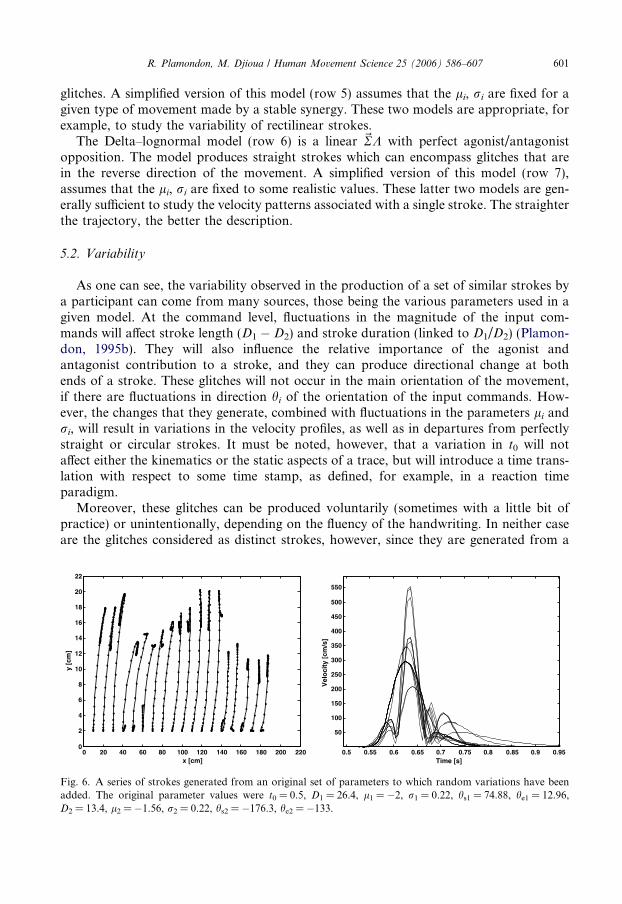
Fig. 6. A series of strokes generated from an original set of parameters to which random variations have beenadded. The original parameter values were t0 = 0.5, D1 = 26.4, l1 = �2, r1 = 0.22, hs1 = 74.88, he1 = 12.96,D2 = 13.4, l2 = �1.56, r2 = 0.22, hs2 = �176.3, he2 = �133.

602 R. Plamondon, M. Djioua / Human Movement Science 25 (2006) 586–607
single pair of synchronous input commands ~D1 and ~D2 occurring at t0, and activating asynergy made up of an agonist and an antagonist lognormal neuromuscular system. Theyare thus different from what is often referred to as secondary strokes. In this latter case,at least a second set of input commands is necessary to generate these distinct submove-ments. In other words, the Kinematic Theory provides an efficient criterion for parsingindividual strokes, each of which might incorporate up to two glitches, from a series ofconcatenated strokes. A single stroke is defined as any movement that results from the syn-chronous activation of two competing lognormal neuromuscular systems.
We have illustrated some of these phenomena in Fig. 6. All the strokes and velocityprofiles depicted here were simulated from a single set of parameters to which randomvariations were added. In other words, every parameter of every curve was assumed tobe normally distributed around a mean value, and each curve was generated using arandom set of values. The trajectories have been slightly translated horizontally to high-light the small differences, while the velocity profiles have been superimposed on thesame graph to highlight the similarities. This mimics, for example, how a participant,being asked to produce a specific set of identical strokes, would react to the instructionsgiven.
5.3. Practical issues
As expected, the quality of the kinematic and static description of a stroke is directlylinked to the number of parameters used in a given model. As mentioned in the introduc-tion, depending on the application, a specific level of representation will be sufficient. Niceletter models can be generated with three parameters per stroke, and, in this case, theminimal Delta–lognormal model is often sufficient (Djeziri, Guerfali, Plamondon, &Robert, 2002). Studies which focus on velocity patterns only can be run with thefull DK model if the strokes are straight and only the direction reversals have to be takeninto account (Guerfali & Plamondon, 1998). If there is also interest in analyzing depar-tures from straight strokes, the linear ~RK model will be the best choice (Plamondon &Djioua, 2005). A full study of either straight or curved strokes requires the curved ~RKmodel.
In this context, the use of an increasing number of parameters to obtain a moredetailed description of a given stroke should not be seen as an overfitting process. Theglitches, the variations in directions and the departure from a perfectly straight or curvedpath all reflect specific fluctuations at the command or execution level of a stroke. Someof these phenomena might be a specific feature to observe in forensic document analysisor a burdensome noise to filter out in handwriting recognition, or, in other studies, sim-ilar variations might characterize specific developmental or neurodegenerative processes.What we have highlighted in this paper is that any of these various points of view can betaken into account using the same theory and a family of movement generation modelsthat allows various levels of movement representation within a unified neuromuscularparadigm.
This approach can be easily used, qualitatively, by conducting a visual inspection of thevarious strokes produced under a given set of experimental conditions to group togethervarious sets of strokes for subsequent analysis. For example, strokes that have more thantwo glitches or more than three peak velocity profiles cannot be considered as a singlestroke. According to the Kinematic Theory, they are not single basic movements resulting
R. Plamondon, M. Djioua / Human Movement Science 25 (2006) 586–607 603
from the synchronous activation of two neuromuscular systems with two synchronousvectorial commands. A similar qualitative approach can also serve as a method to rapidly
10 11 12 13 14 15 16 17 18 19 207
8
9
10
11
12
13
14
15
16trajectory of human handwriting
0.5 1 1.5 2 2.50
5
10
15
20
25
30
Velocity profile of human handwriting
10 11 12 13 14 15 16 17 18 19 207
8
9
10
11
12
13
14
15
16Human-like reproduction of complex pattern
0 0.5 1 1.5 2 2.5 30
5
10
15
20
25
30
35Velocity profile of human-like handwriting
10 11 12 13 14 15 16 17 18 19 207
8
9
10
11
12
13
14
15
16
Real dataSigma-lognormal reproduction
0.5 1 1.5 2 2.5
5
10
15
20
25
30
Real dataSigma-lognormal reproduction
x [cm]
y [c
m]
Time [s]
Vel
oci
ty [
cm/s
]
x [cm]
y [c
m]
Time [s]
Vel
oci
ty [
cm/s
]
x [cm]
y [c
m]
Time [s]
Vel
oci
ty [
cm/s
]
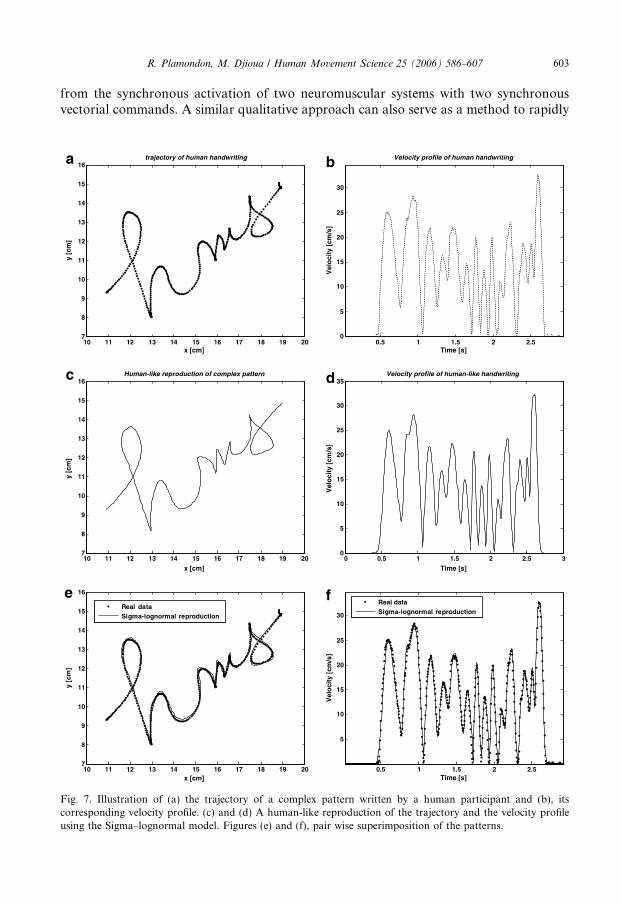
Fig. 7. Illustration of (a) the trajectory of a complex pattern written by a human participant and (b), itscorresponding velocity profile. (c) and (d) A human-like reproduction of the trajectory and the velocity profileusing the Sigma–lognormal model. Figures (e) and (f), pair wise superimposition of the patterns.

604 R. Plamondon, M. Djioua / Human Movement Science 25 (2006) 586–607
check whether or not a participant meets the task requirements, as well as a way toimprove an experimental protocol using more specific instructions for the production ofspecific strokes.
From a movement synthesis perspective, the theory offers a full mathematical descrip-tion of strokes that can be used directly in many applications. For example, it has beenused recently (Varga, Kilchhofer, & Bunke, 2005) to generate a large database of wordsand sentences to train handwriting recognition algorithms. The design of such algorithmsis very complex, and the larger the database to train and test a system, the better the resultsand the more robust the system designed. The use of realistic, humanlike patterns auto-matically generated from the Kinematic Theory using randomly generated sets of param-eters can save time and money.
In Fig. 7, we have illustrated the capacity of the ~RK model to generate humanlike hand-writing. Figs. 7a and b depict a complex pattern, a sequence of letters (hms), written by ahuman participant (Fig. 7a, trajectory; Fig. 7b, velocity profile), while Figs. 7c and d pres-ent a typical reproduction of the same sequence as created with an interactive softwaretool based on the model (Djioua, O’Reilly, & Plamondon, 2006). In Figs. 7e and f, we havesuperimposed the real and reconstructed patterns to clearly highlight what is meant bymimicking human writers. The whole pattern was reconstructed with a trajectory MSEof 0.0066 cm2 and a velocity MSE of 1.1396 cm2/s2. The parameter values used for thisexample are given in the Appendix (Table 4).
Finally, the full benefit of this methodology requires the quantitative analysis of indi-vidual strokes, using, for example, nonlinear regression algorithms. The design of suchalgorithms is very tricky. We have already proposed some efficient methods to processDK profiles (Djioua, Plamondon, Della Cioppa, & Marcelli, 2005; Guerfali & Plamondon,1995) and the analysis of ~RK patterns is under development (Djioua, 2006).
6. Conclusion
We have explained in this paper how the Kinematic Theory of Rapid Human Move-ments can be used to generate a family of handwriting stroke generation models. Eachof these models takes advantage of the global description of the impulse responses of neu-romuscular systems using lognormal functions. Depending on the relatively detailedrepresentation of the input commands, various levels of description can be obtained fora single stroke. In this context, the Kinematic Theory can be used qualitatively or quan-titatively to study the production of rapid movements in a variety of fundamental studiesand practical applications using a coherent and unified paradigm. It is expected that sucha framework will serve to, among other things, facilitate communication and understand-ing between various research teams directly or indirectly involved in the study of rapidhuman movements in general, since the overall approach is not limited to handwritingstudies.
Acknowledgment
This work was supported by NSERC grant RGPIN-915 to Rejean Plamondon.
R. Plamondon, M. Djioua / Human Movement Science 25 (2006) 586–607 605
Appendix A
Tables 3 and 4.
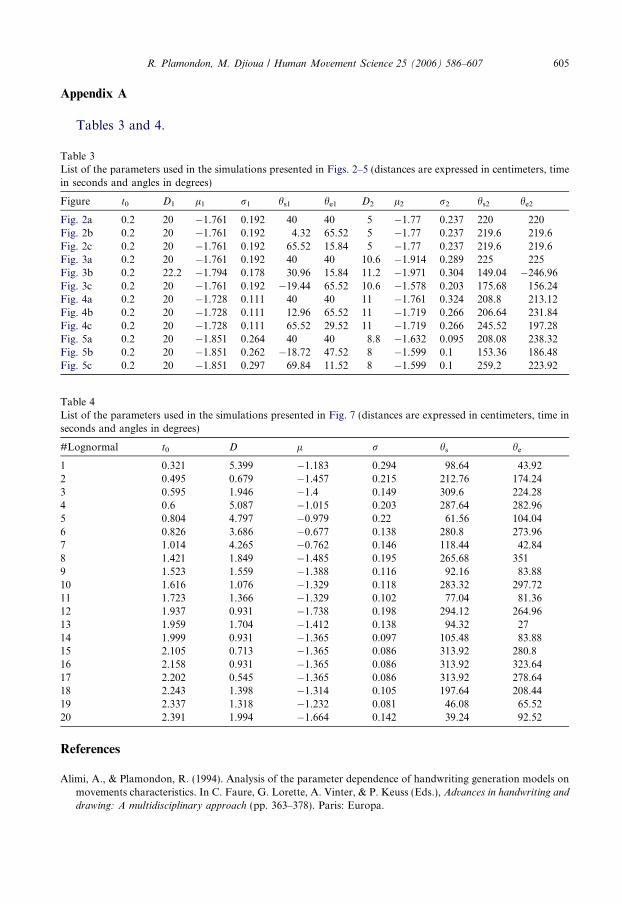
Table 3List of the parameters used in the simulations presented in Figs. 2–5 (distances are expressed in centimeters, timein seconds and angles in degrees)
Figure t0 D1 l1 r1 hs1 he1 D2 l2 r2 hs2 he2
Fig. 2a 0.2 20 �1.761 0.192 40 40 5 �1.77 0.237 220 220Fig. 2b 0.2 20 �1.761 0.192 4.32 65.52 5 �1.77 0.237 219.6 219.6Fig. 2c 0.2 20 �1.761 0.192 65.52 15.84 5 �1.77 0.237 219.6 219.6Fig. 3a 0.2 20 �1.761 0.192 40 40 10.6 �1.914 0.289 225 225Fig. 3b 0.2 22.2 �1.794 0.178 30.96 15.84 11.2 �1.971 0.304 149.04 �246.96Fig. 3c 0.2 20 �1.761 0.192 �19.44 65.52 10.6 �1.578 0.203 175.68 156.24Fig. 4a 0.2 20 �1.728 0.111 40 40 11 �1.761 0.324 208.8 213.12Fig. 4b 0.2 20 �1.728 0.111 12.96 65.52 11 �1.719 0.266 206.64 231.84Fig. 4c 0.2 20 �1.728 0.111 65.52 29.52 11 �1.719 0.266 245.52 197.28Fig. 5a 0.2 20 �1.851 0.264 40 40 8.8 �1.632 0.095 208.08 238.32Fig. 5b 0.2 20 �1.851 0.262 �18.72 47.52 8 �1.599 0.1 153.36 186.48Fig. 5c 0.2 20 �1.851 0.297 69.84 11.52 8 �1.599 0.1 259.2 223.92
Table 4List of the parameters used in the simulations presented in Fig. 7 (distances are expressed in centimeters, time inseconds and angles in degrees)
#Lognormal t0 D l r hs he
1 0.321 5.399 �1.183 0.294 98.64 43.922 0.495 0.679 �1.457 0.215 212.76 174.243 0.595 1.946 �1.4 0.149 309.6 224.284 0.6 5.087 �1.015 0.203 287.64 282.965 0.804 4.797 �0.979 0.22 61.56 104.046 0.826 3.686 �0.677 0.138 280.8 273.967 1.014 4.265 �0.762 0.146 118.44 42.848 1.421 1.849 �1.485 0.195 265.68 3519 1.523 1.559 �1.388 0.116 92.16 83.8810 1.616 1.076 �1.329 0.118 283.32 297.7211 1.723 1.366 �1.329 0.102 77.04 81.3612 1.937 0.931 �1.738 0.198 294.12 264.9613 1.959 1.704 �1.412 0.138 94.32 2714 1.999 0.931 �1.365 0.097 105.48 83.8815 2.105 0.713 �1.365 0.086 313.92 280.816 2.158 0.931 �1.365 0.086 313.92 323.6417 2.202 0.545 �1.365 0.086 313.92 278.6418 2.243 1.398 �1.314 0.105 197.64 208.4419 2.337 1.318 �1.232 0.081 46.08 65.5220 2.391 1.994 �1.664 0.142 39.24 92.52
References
Alimi, A., & Plamondon, R. (1994). Analysis of the parameter dependence of handwriting generation models onmovements characteristics. In C. Faure, G. Lorette, A. Vinter, & P. Keuss (Eds.), Advances in handwriting and
drawing: A multidisciplinary approach (pp. 363–378). Paris: Europa.

606 R. Plamondon, M. Djioua / Human Movement Science 25 (2006) 586–607
Bullock, D., Grossberg, S., & Mannes, C. (1993). A neural network model for cursive script production.Biological Cybernetics, 70, 15–28.
Djeziri, S., Guerfali, W., Plamondon, R., & Robert, J. M. (2002). Learning handwriting with a pen-based system:Computational issues. Pattern Recognition, Special Issue of Handwriting Processing and Applications, 35,1049–1057.
Djioua, M., Plamondon, R., Della Cioppa, A., & Marcelli, A. (2005). Delta–lognormal parameter estimation bynon-linear regression and evolutionary algorithm: A comparative study. In Proceedings of the 12th
international conference on graphonomics society (pp. 44–48). University of Salerno, Italy.Djioua, M., O’Reilly, C., & Plamondon, R. (2006). An interactive trajectory synthesizer to study outlier patterns
in handwriting recognition and signature verification. In Proceedings of the 18th conference on pattern
recognition, Hong Kong, in press.Djioua, M. (2006). Analyse et synthese des mouvements humains par l’utilisation du modele sigma–lognormal.
PhD thesis, Ecole Polytechnique de Montreal.Edelman, S., & Flash, T. (1987). A model of handwriting. Biological Cybernetics, 57, 25–36.Franke, K., & Schomaker, L. R. B. (2004). Robotic writing trace synthesis and its application in the study of
signature line quality. Journal of Forensic Document Examination, 16, 119–146.Gielen, C. C. A. M., Van den Oosten, K., & Van den Pullter, G. F. (1985). Relation between EMG activation
patterns and kinematic properties of aimed arm movement. Journal of Motor Behaviour, 17, 421–442.Guerfali, W., & Plamondon, R. (1995). Signal processing for the parameter extraction of the delta–lognormal
model (DK). In C. Archibald & P. Kwok (Eds.), Research in computer and robot vision (pp. 217–232).Singapore: World Scientific.
Guerfali, W., & Plamondon, R. (1998). New method for the analysis of simple and complex planar rapidmovements. Journal of Neuroscience Methods, 82, 35–45.
Hilton, O. (1993). Scientific examination of questioned documents. In CRC series in forensic and police science.CRC Press, Boca Raton, London, revised edition.
Latash, M. L. (1998). Neurophysiological basis of movement. Champaign, IL: Human Kinetics.Leduc, N., & Plamondon, R. (2001). A new approach to study human movements: The three dimensional delta–
lognormal model. In Proceedings of the 10th biennial conference of the international graphonomics society (pp.98–102), University of Nijmegen, The Netherlands.
Meulenbroek, R. G. J., & Van Gemmert, A. W. A. (Eds.) (2003). Advances in the study of drawing andhandwriting [Special issue]. Human Movement Science, 22, 131–220.
Morasso, P. (1981). Spatial control of arm movements. Experimental Brain Research, 42, 223–227.O’Reilly, C., Djioua, M., & Plamondon, R. (2005). Systeme de synthese de l’ecriture manuscrite par l’utilisation
du modele sigma–lognormal. Technical Report EPM-/RT-2-5-07, Ecole Polytechnique de Montreal.Plamondon, R. (1995a). A kinematic theory of rapid human movements. Part I: Movement representation and
generation. Biological Cybernetics, 72, 295–307.Plamondon, R. (1995b). A kinematic theory of rapid human movements. Part II: Movement time and control.
Biological Cybernetics, 72, 309–320.Plamondon, R. (1998). A kinematic theory of rapid human movements. Part III: Kinetic outcomes. Biological
Cybernetics, 78, 133–145.Plamondon, R. (2003). A unified framework to study human movements under isotonic and isometric conditions.
Neuroscience, New Orleans, USA.Plamondon, R., & Djioua, M. (2005). Handwriting stroke trajectory variability in the context of the kinematic
theory. In Proceedings of the international graphonomics society (pp. 250–254), University of Salerno, Italy.Plamondon, R., Feng, C., & Woch, A. (2003). A kinematic theory of rapid human movement. Part IV: A formal
mathematical proof and new insights. Biological Cybernetics, 89, 126–138.Plamondon, R., & Guerfali, W. (1998). The generation of handwriting with delta–lognormal synergies. Biological
Cybernetics, 78, 119–132.Plamondon, R., Lopresti, D., Schomaker, L. R. B., & Srihari, R. (1999). On-line handwriting recognition. In J.
G. Webster (Ed.). Wiley encyclopedia of electrical and electronics engineering (15, pp. 123–146). NY: JohnWiley & Sons.
Plamondon, R., & Maarse, F. J. (1989). An evaluation of motor models of handwriting. IEEE Transactions on
System, Man and Cybernetics, 19, 1060–1079.Plamondon, R., & Srihari, S. (2000). On-line and off-line handwriting recognition: A comprehensive survey, 20th
Anniversary Special Issue. IEEE Transactions on Pattern Analysis and Machine Intelligence, 22, 63–84.

R. Plamondon, M. Djioua / Human Movement Science 25 (2006) 586–607 607
Plamondon, R., Stelmach, G. E., & Teasdale, N. (1990). Motor program coding representation from handwritinggenerator model: The production of lines responses. Biological Cybernetics, 63, 443–451.
Potkonjac, V. (2005). Robotic handwriting. International Journal of Humanoid Robotics, 2, 105–124.Rohrer, B., Fasoli, S., Krebs, H. I., Hughes, R., Volpe, B., & Frontera, W. R. (2002). Movement smoothness
changes during stroke recovery. The Journal of Neuroscience, 22, 8297–8304.Schroter, A., Mergl, R., Burger, K., Hampel, H., Moller, H.-J., & Hegerl, U. (2003). Kinematic analysis of
handwriting movements in patients with Alzheimer’s disease, mild cognitive impairment, depression andhealthy subjects. Dementia and Geriatric Cognitive Disorders, 15, 132–142.
Simner, M. L., & Girouard, P. L. (Eds.) (2000). Advance in forensic document examination [Special issue].Journal of Forensic Document Examination, 13, 1–14.
Simner, M. L., Leedham, C. G., & Thomassen, A. J. W. M. (Eds.) (1996). Handwriting and drawing research:
Basic and applied issues. Amsterdam: IOS Press.Teuling, H. L. T., & Stelmach, G. E. (1991). Control of stroke size, peak acceleration and stroke duration in
Parkinsonian handwriting. Human Movement Science, 10, 315–333.Van Galen & Morasso, P. (Eds.) (1998). Neuromotor control in handwriting and drawing [Special issue]. Acta
Psychological, 100, 1–227.Van Gemmert, A. W. A., & Teuling, H. L. T. (Eds.) (2004). Connecting sciences using graphonomics research
[Special issue]. Motor Control, 18, 367–566.Varga, T., Kilchhofer, D., & Bunke, H. (2005). Template-based synthetic handwriting generation for the training
of recognition systems. In Proceedings of the 12th international conference on graphonomics society (pp. 206–211), University of Salerno, Italy.
Wada, Y., Koike, Y., Vatikiotis-Bateson, M., & Kawato, A. (2005). Computational model for cursivehandwriting based on the minimization principle. In J. D. Cowan, G. Tesauro, & J. Alspector (Eds.), Advances
in neuronal information processing systems 6 (NIPS6) (pp. 727–737). San Francisco, CA: Morgan KaufmannPublishers.
Wann, J., Wing, A. M., & Søvik, N. (1991). Development of graphic skills: Research, perspectives and education
implications. London: Academic Press.Woch, A., & Plamondon, R. (2001). Rapid movement analysis with the delta–lognormal model: Towards a better
understanding of movement generation. In Proceedings of the 10th biennial conference of the international
graphonomics society (pp. 165–169), University of Nijmegen. The Netherlands.Woch, A., & Plamondon, R. (2003). The problem of movement primitives in the context of the kinematic theory.
In Proceedings of the 11th international conference on graphonomics society (pp. 67–71), Scottsdale, Arizona.Woch, A., & Plamondon, R. (2004). Using the framework of the kinematic theory for the definition of a
movement primitive [Special issue]. Motor Control, pp. 547–557.Zatsiorsky, V. M. (1998). Kinematics of human motion. Champaign, IL: Human Kinetics.