
Multi Criteria Decision Making With PROMETHEE method and software
HAL Id: hal-02883122https://hal.archives-ouvertes.fr/hal-02883122
Submitted on 2 Jul 2020
HAL is a multi-disciplinary open accessarchive for the deposit and dissemination of sci-entific research documents, whether they are pub-lished or not. The documents may come fromteaching and research institutions in France orabroad, or from public or private research centers.
L’archive ouverte pluridisciplinaire HAL, estdestinée au dépôt et à la diffusion de documentsscientifiques de niveau recherche, publiés ou non,émanant des établissements d’enseignement et derecherche français ou étrangers, des laboratoirespublics ou privés.
A Multi-Criteria Evaluation Method of Product-LevelCircularity Strategies
Yohannes A. Alamerew, Marianna Lena Kambanou, Tomohiko Sakao, DanielBrissaud
To cite this version:Yohannes A. Alamerew, Marianna Lena Kambanou, Tomohiko Sakao, Daniel Brissaud. A Multi-Criteria Evaluation Method of Product-Level Circularity Strategies. Sustainability, MDPI, 2020, 12(12), pp.5129. �10.3390/su12125129�. �hal-02883122�

sustainability
Article
A Multi-Criteria Evaluation Method of Product-LevelCircularity Strategies
Yohannes A. Alamerew 1,* , Marianna Lena Kambanou 2 , Tomohiko Sakao 2 andDaniel Brissaud 1
1 Univ. Grenoble Alpes, CNRS, G-SCOP, 38000 Grenoble, France; [email protected] Division of Environmental Technology and Management, Department of Management and Engineering,
Linköping University, 581 83 Linköping, Sweden; [email protected] (M.L.K.);[email protected] (T.S.)
* Correspondence: [email protected]; Tel.: +33-067-130-1936
Received: 10 April 2020; Accepted: 18 June 2020; Published: 23 June 2020�����������������
Abstract: The circular economy (CE) can drive sustainability. For companies to select and implementcircularity strategies, they need to evaluate and compare the performance of these strategies both interms of progress towards CE but also based on their feasibility and business outcomes. However,evaluation methods for circularity strategies at the product level are lacking. Therefore, this researchproposes a multi-criteria evaluation method of circularity strategies at the product level which canbe used by business decision-makers to evaluate and compare the initial business of the company,transformative and future circularity strategies. This multi-criteria evaluation method aims to assistbusiness decision-makers to identify a preferred strategy by linking together a wide variety of criteria,i.e., environmental, economic, social, legislative, technical, and business, as well as by proposingrelevant indicators that take into consideration, where possible, the life cycle perspective. It alsoallows for flexibility so that criteria, sub-criteria, and weighing factors can be altered by the businessdecision-makers to fit the needs of their specific case or product. Two illustrative examples based oncase companies are presented to verify and illustrate the proposed method.
Keywords: circularity strategies; multi-criteria assessment; multi-criteria decision analysis; end-of-lifestrategies; circular economy; remanufacturing; resource efficiency; circularity indicators; sustainability;refurbish; repair
1. Introduction
In the last decade, the circular economy (CE) concept has become an issue of heightened interestfor researchers, practitioners, policymakers, companies, and industries [1–3]. CE moves away fromthe conventional linear approach which utilizes a “make-use-dispose” economic model to one thatis “regenerative by design” [4,5]. It aims to eradicate waste through careful design; reduce negativeimpacts; rebuild environmental, economic, and social capital; and maintain the value of products,components, and materials [6,7]. The value can be maintained through the implementation of variouscircularity strategies [8].
Currently, some companies are taking steps to implement circularity strategies and, therefore,more circular products and services are reaching the market [9,10]. However, widespread adoptionof circularity strategies still has not taken place [11] and companies are struggling to implementand operationalize CE. This means that CE research is focusing on understanding the barriers andchallenges that companies face (e.g., [11,12]) as well as developing decision-making support in theform of tools, metrics, and methods for companies to implement circularity strategies [13].
Sustainability 2020, 12, 5129; doi:10.3390/su12125129 www.mdpi.com/journal/sustainability
Sustainability 2020, 12, 5129 2 of 19
Research focused on the evaluation of circularity strategies for products and services comparedto each other or to their business-as-usual counterparts or other products in the same product groupwhich are just starting to take off [14]. More generally, there is a lack of evaluation methodsof CE strategies of products and services at the micro level, i.e., product, company or singleconsumer-level [9,15–17] and there are few studies that have conducted and presented evaluations ofsuch circularity strategies [9,18,19]. These kinds of evaluation methods can serve different purposes,e.g., strategy selection or identification of hotspots.
One specific area where business decision-makers need indicators or methods to help themevaluate circularity strategies is to select the best strategy when a product reaches the end-of-life(EoL) stage. There is a lack of such evaluation methods of product-level circularity strategies, asindicated by Sassanelli et al. [20] in a literature review on CE assessment methods and tools, and bySaidani et al. [10], who created a taxonomy of CE indicators including more than 55 sets of indicators.Elia et al. [9] supported this argument in the recent work on critical analysis of CE assessment andindicators at micro level.
The objective of this article is, therefore, to address the following research question (RQ):
RQ: How to evaluate circularity strategies for a product and/or service using a decisionmethod to help a company select a suitable strategy at EoL stage?
Evaluating a circularity strategy cannot be done based on a single indicator or criterion, becauseapart from the contributing to waste reduction and negative impact mitigation, a strategy also needs tobe feasible and financially viable and may require considerable investments [21,22] (see Section 2.2 for amore in-depth discussion). Therefore, the main research question is further broken down into twosub-questions:
1. What are the relevant criteria and sub-criteria/indicators to be used to evaluatecircularity strategies?
2. How to evaluate circularity strategies using a decision-making method that incorporates thecriteria and sub-criteria/indicators?
The overarching aim is to propose a decision-making method to evaluate circularity strategiesof products and added services. The method evaluates potential alternative circularity strategiesincluding (but not limited to) the initial or business-as-usual strategy of the company which could betraditional product sales or includes some form of product-level circular strategy, e.g., remanufacturing(reman), compared with various forms of more advanced or transformative strategies and futurecircularity strategies. Transformative strategies could be advanced remanufacturing, multiple or mixedreuse strategies and added service offerings (also known as product-service systems). The method aimsto help business decision-makers to select the best feasible circularity strategy. It can be implementedat EoL phase by the company providing the initial product and third-party recovery/remanufacturingcompanies. Apart from introducing the method, this work gives two examples of its application andsubsequent verification.
The organization of this article is as follows: Section 2 presents a literature review about CE,circularity strategies, decision-making factors, and CE assessment methods. Section 3 exposes theresearch methodology employed in this study to build the circularity strategies decision-makingmethod. The results of this paper, i.e., the multi-criteria evaluation method of product-level circularitystrategies, is presented in Section 4. Verification of the proposed method through cases is presented inSection 5. Section 6 discusses and summarizes the main findings of the study and points out futureresearch opportunities.

Sustainability 2020, 12, 5129 3 of 19
2. Literature Review
2.1. The Circular Economy and Product Circularity Strategies
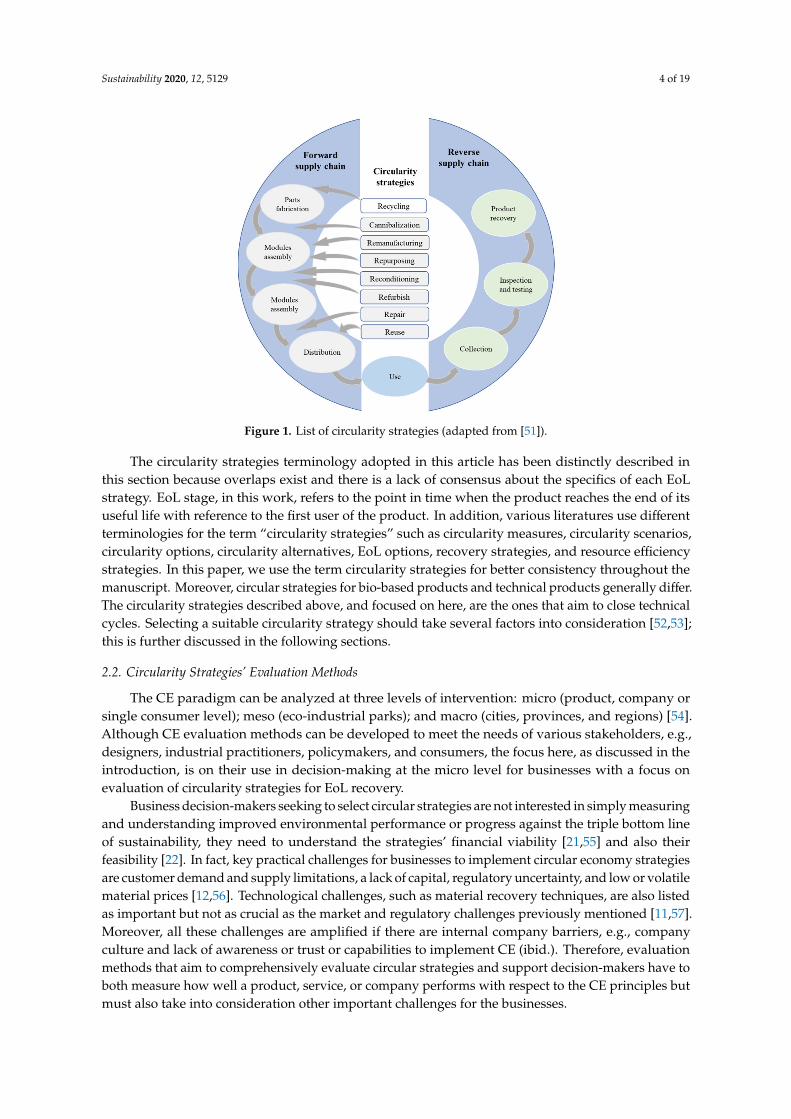
The concept of circular economy has gained traction among scholars and practitioners, especiallyin Europe and China [23,24]. CE is an economic system in which the consumption of resources andemission of waste is minimized by keeping materials in the loop as long as possible [2,7]. Adopting CEcould have considerable benefits in reducing waste volume and raw material inputs while supportingeconomic growth [4,25]. CE aims to retain the value of products, components, materials, and resourcesin the economy through the application of various circularity strategies [8,26]. Circularity strategiesthat extend product life and/or close resource loops include reuse, repair, refurbish, recondition,remanufacture, repurpose, cannibalization, and recycle [8,27]. Different circularity strategies areneeded for different product characteristics, legislation, technology, and market dynamics [28].The successful implementation of circularity strategies in businesses depends on combined leverage ofvarious building blocks of CE, amongst others, product and service design, business models, reversesupply chain, product and service use patterns, EoL recovery, and supporting policies [29–32]. Reverselogistics facilitate a number of circularity strategies such as reuse, refurbish, and remanufacturingand, therefore, are one of the building blocks of CE, and an enabler for sustainable production andconsumption [33,34]. The implementation of CE principles and strategies can facilitate meeting someof the United Nations’ Sustainable Development Goals [10,35] by helping transform production andconsumption behavior [36,37]. Figure 1 depicts a list of circularity strategies, which include:
• reuse/resell involves re-using a product if it meets sufficient quality levels [38–40];• repair aims to recover a used product to “working order” by fixing/replacing specified faults using
service and spare parts [41];• refurbish involves returning products to a specific quality level, usually less than that of a new
product [42];• recondition involves returning the quality of a product to a satisfactory level (typically less than a
virgin standard or new product) giving the resultant product a warranty less than that of a newlymanufactured equivalent [41,43]. Reconditioned products have gone through more extensivetesting and repair than refurbished products [42];
• remanufacture is a circularity strategy whereby EoL products are restored to the originalequipment manufacturers’ standard, and receive a warranty at least equal to a newly manufacturedproduct [44–46];
• repurpose involves using post-used products for a different purpose and application compared tothe original product [32,47,48];
• cannibalization is an activity of recovering parts from returned products. Recovered parts areused in repair, refurbishing, reconditioning, and remanufacturing of other products [49]; and
• recycle aims to collect and process discarded materials that are then used for the production ofnew products [40,50].
Sustainability 2020, 12, 5129 4 of 19
Figure 1. List of circularity strategies (adapted from [51]).
The circularity strategies terminology adopted in this article has been distinctly described inthis section because overlaps exist and there is a lack of consensus about the specifics of each EoLstrategy. EoL stage, in this work, refers to the point in time when the product reaches the end of itsuseful life with reference to the first user of the product. In addition, various literatures use differentterminologies for the term “circularity strategies” such as circularity measures, circularity scenarios,circularity options, circularity alternatives, EoL options, recovery strategies, and resource efficiencystrategies. In this paper, we use the term circularity strategies for better consistency throughout themanuscript. Moreover, circular strategies for bio-based products and technical products generally differ.The circularity strategies described above, and focused on here, are the ones that aim to close technicalcycles. Selecting a suitable circularity strategy should take several factors into consideration [52,53];this is further discussed in the following sections.
2.2. Circularity Strategies’ Evaluation Methods
The CE paradigm can be analyzed at three levels of intervention: micro (product, company orsingle consumer level); meso (eco-industrial parks); and macro (cities, provinces, and regions) [54].Although CE evaluation methods can be developed to meet the needs of various stakeholders, e.g.,designers, industrial practitioners, policymakers, and consumers, the focus here, as discussed in theintroduction, is on their use in decision-making at the micro level for businesses with a focus onevaluation of circularity strategies for EoL recovery.
Business decision-makers seeking to select circular strategies are not interested in simply measuringand understanding improved environmental performance or progress against the triple bottom lineof sustainability, they need to understand the strategies’ financial viability [21,55] and also theirfeasibility [22]. In fact, key practical challenges for businesses to implement circular economy strategiesare customer demand and supply limitations, a lack of capital, regulatory uncertainty, and low or volatilematerial prices [12,56]. Technological challenges, such as material recovery techniques, are also listedas important but not as crucial as the market and regulatory challenges previously mentioned [11,57].Moreover, all these challenges are amplified if there are internal company barriers, e.g., companyculture and lack of awareness or trust or capabilities to implement CE (ibid.). Therefore, evaluationmethods that aim to comprehensively evaluate circular strategies and support decision-makers have toboth measure how well a product, service, or company performs with respect to the CE principles butmust also take into consideration other important challenges for the businesses.

Sustainability 2020, 12, 5129 5 of 19
Although the evaluation of circularity strategies is crucial for selecting the most appropriateone, it can also help identify hotspots and areas of improvement in order to overcome some of thechallenges with moving towards CE [58,59]. For example, Kambanou and Sakao [55] demonstratedhow Life Cycle Costing (LCC) can help compare business-as-usual to a circular scenario while alsoshowing where large material and energy costs occur in the product’s or service’s lifetime so thatdecision-makers can focus on replacing these high costs with labor costs, e.g., maintenance activities inthe circular scenario.
In recent years, there is a growing pool of academic studies that evaluate circularity strategies at amicro-level [9,49,60]. EoL evaluation methods can employ optimization, multi-criteria or empiricalmethods. Optimization evaluation methods use optimization problems to select the suitable circularitystrategy from various alternatives. However, they are primarily focused on optimizing economicbenefit [61,62]. Due to the complexity of mathematical models and their requirement of many inputparameters, it is difficult for companies to use this method effectively and efficiently, while empiricalmethods are based on the knowledge and experience gained from analyzing successful cases ratherthan conventional rule-based methods [63]. Multi-criteria decision-making methods (MCDM) helpdecision-making in complex and inter-related decision tasks [64,65], and is further presented in thefollowing section.
Table 1 presents a description of CE evaluation methods identified in this research. The ResourceConservative Manufacturing Project [66] developed a web-based tool, Circular Pathfinder (CP),to identify a suitable circularity strategy but focused on bio-cycles rather than techno cycles. However,this tool lacks scientific validation. Similarly, Alamerew and Brissaud [49] developed a productrecovery decision-making tool to evaluate CE strategies on a strategic level. Lee, Lu and Song [67]presented an End-of-life Index (EOLI) method to evaluate product performance in relation to circularitystrategies based on the calculation of total cost of each EoL process. The proposed index method assistsdesigners to adopt design for EoL approach.
Table 1. Description of CE (circular economy) evaluation methods.
Method Description
Circular pathfinder (CP) A web-based tool to identify a suitable strategy based on a survey of 10 product-relatedqualitative questions [66].
End-of-life index (EoLI) An EoL process cost-based index to evaluate circularity strategies includingremanufacturing, recycling etc. [67].
Product recovery multi-criteria decisiontool (PR-MCDT)
A CE evaluation tool that evaluates circularity strategies (remanufacturing, recycling,repair, and reuse) at strategic level. The strategies are assessed according to relevanteconomic, environmental and social indicators [49].
CE toolkit A web-based tool to assess product/service throughout the entire life cycle. The proposedtool could be used by companies, distributers/retailers and consumers [68].
CE assessment dashboard A dashboard of new and established quantitative indicators is proposed for CE strategyassessment in organizations [58].
Circularity potential indicator (CPI) A circularity performance indicator to measure the performance of products in the earlyphases of a new or re-design product development [60].
Multi-criteria matrix A multi-criteria approach to assist decision-making for EoL management of electronicproducts [69].
2.3. Multi-Criteria Evaluation Methods of Circularity Strategies
A multi-criteria decision-making method (MCDM) is a tool used to select the best compromisingstrategy from a list of several potential alternatives by taking into consideration several criteria [70].The method is usually used to solve complex problems by analyzing multiple criteria simultaneouslybased on both quantitative and qualitative information [71]. In MCDM, (i) the criteria, (ii) the indexesor sources of information used to measure the criteria, (iii) the weight and comparative value of thecriteria can be tailored to the case (ibid.). Additionally, MCDM takes into account the preference of theuser/decision-maker in the decision-making process [49]. In MCDM-based sustainability assessments,the choice and importance or weight of each criterion should take into consideration the values and

Sustainability 2020, 12, 5129 6 of 19
context-specific knowledge of the decision-makers and be the outcome of stakeholder- inclusivediscussions [22].
Because of MCDM’s ability to provide structure to complex decisions, as well as the othercharacteristics mentioned above, it has been used when assessing sustainability solutions, e.g., [22,72].Circular strategies, as discussed in Section 2.1, are a type of sustainability solution, and selecting theminvolves, as discussed in Section 2.2, various decision factors because there are multiple challenges andbarriers to overcome. Moreover, multiple strategies could be relevant to compare. Therefore, MCDMcan be a valuable method for evaluating circularity strategies.
With reference to Table 1, two methods for evaluating circularity strategies, the “multi-criteriamatrix” and “PR-MCDT” (product recovery multi-criteria decision tool), have employed MCDM.The PR-MCDT helps to assess the feasibility of a recovery business or to test the performance ofrecovery strategies in order to improve a business [49]. In addition, the multi-matrix method [69] usesan MCDM to evaluate the EoL product and its components for recovery. This method uses evaluationcriteria such as the residual value, environmental burden, weight, quantity, and ease of disassemblyof each component. These two methods, however, have specific fields of application and thereforepresent a fairly restrictive set of criteria and indexes which might not fully capture the whole spectrumof relevant criteria for comprehensively evaluating circularity strategies. A more comprehensivelist of criteria would need to address, first, the source challenges, as defined by Kirchherr et al. [11],as cultural, regulatory, market and technological as well as the potential benefits to the environment,society, and the economy.
The research on challenges shows that there are similarities between challenges, but they arealso case-specific. Therefore, the MCDM should provide flexibility to decision-makers to choose therelevant criteria, sub-criteria and indicators. Furthermore, when drawing on knowledge of usingMCDM for sustainability assessments, namely that setting criteria against each other or weighingthem can require normative judgments [73], it can be surmised that as many relevant stakeholders aspossible should be included in making the methodological choices of MCDM.
3. Materials and Methods
The point of departure for this research is a review of literature on the main themes related to theresearch question and sub-questions, namely, circularity strategies for a product and/or service, andevaluation methods of circularity strategies; identification and selection of decision-making criteria aswell as sub-criteria and indicators. More than fifty relevant publications related to the subject areaare reviewed. The research process for developing the evaluation method of circularity strategiesfor products and/or services includes (i) initial evaluation method selection, (ii) selection of criteria,sub-criteria and indicators, (iii) method development, and (iv) verification of the proposed method.
3.1. Initial Method Selection
A literature review was conducted to understand the state of the art on the evaluation ofcircularity strategies. As discussed in Section 2.2, circularity strategies’ evaluation methods oftenemploy optimization, multi-criteria, or empirical methods for decision-making. Based on the reviewof literature concerning the challenges and complexity faced by companies implementing circularitystrategies (Section 2.2), the advantages and disadvantages of using each method for decision-makingare analyzed. In this paper, a MCDM approach is used to develop a circularity strategies’ evaluationmethod. The reasons for choosing MCDM are: (i) that a wide range of criteria can be included, (ii) bothqualitative and quantitative data can be incorporated, and (iii) flexibility and tailoring to the caserequirements is allowed (see Section 2.3 for an in-depth review).
3.2. Selection of Decision Criteria, Sub-Criteria and Indicators
Based upon a comprehensive literature review of more than 50 relevant publications and feedbackfrom five experts in the subject domain, decision-making criteria, sub-criteria and indicators are

Sustainability 2020, 12, 5129 7 of 19
identified. Firstly, an exhaustive list of criteria was made. Then the decision-making factors were sortedinto various categories (i.e., business, technical, economic, environmental, legislative and societal)by the authors as seen in Table 2. Afterwards, the list was updated and verified based on expertisefeedback from the industry and academia. Detailed results of this research can be accessed fromAlamerew and Brissaud (2018) [49]. This list was revisited in preparation of this article and checkedagainst literature, e.g., challenges and barriers to circular strategy adoption, published in interveningyears, i.e., 2018–2020. In accordance with MCDM methodology, this list is recommended but notrequired since decision-makers can choose the most relevant criteria, sub-criteria and indicators fortheir case.
Table 2. List of decision criteria and sub-criteria [49].
Criteria Sub-Criteria/Indicator
Environmental Life Cycle Assessment (LCA), EoL impact indicator (EOLI), Human health (HH), Ecosystem quality (EQ), Resources (R),Economic Life Cycle Costing (LCC), disassembly cost, net recoverable value, logistics cost, EoL treatment cost,Social Job creation opportunity, exposure of employees to hazardous materials, level of customer satisfaction,Legislative Effect of legislative pressure, compliance with new and existing legislation,
Technical Technical state, availability of recovery facilities, separability of materials, advancement in technology, presence/removability ofhazardous content,
Business Market demand, competitive pressure, return core volume.
3.3. Method Development
Due to the complexity of circular systems, an integrated approach is required to incorporate allthe decision-making criteria and to take into consideration both quantitative and qualitative factors.Based on the result of a comprehensive literature review, evaluation of circularity strategies can beformulated as an MCDM problem. The multi-criteria evaluation method of circularity strategiesinvolves (i) description of the product under consideration, (ii) finding potential circularity strategies,(iii) identifying evaluation criterion and decision-making factors, (iv) evaluation of circularity strategies,and (v) analysis and ranking of circularity alternatives.
In this study, MCDM is used to build the proposed method. The proposed method is firstdeveloped based on simple multi-attribute rating technique (SMART) [74–76]. SMART is a multi-criteriadecision-making method that can comprehensively account both qualitative and quantitative criteria.Afterward, the authors reduce the complexity in order to develop a practical method that can beeffectively applied to real case studies. All authors contributed to the development of the method byiteratively commenting on the method during the development period.
3.4. Verification of the Method
To verify the application of the proposed circularity strategies’ evaluation method, two illustrativeexamples are presented based on two case studies. Secondary data from two Swedish companies,so-called Company A and Company B, is used to exemplify the application of the method. CompanyA is involved in waste management whereas Company B is a storage furniture supplier. Descriptionsof the case companies are presented in Section 6.
4. Multi-Criteria Evaluation Method of Product-Level Circularity Strategies Description
In this section, the main contribution of the research is presented. An MCDM is proposedto evaluate alternative circularity strategies for products in a specific company at the EoL stage.The proposed MCDM consists of five main steps: (I) description of the product and/or service underconsideration, (II) identification of potential circularity strategies, (III) identification of evaluationcriteria, sub-criteria and indicators, (IV) evaluation of circularity strategies, and (V) analysis andranking of alternative circularity strategies. The focus of this method is on steps III and IV. The graphicalrepresentation of the method is shown in Figure 2. In this section, each step of the evaluation methodis described in detail.

Sustainability 2020, 12, 5129 8 of 19
Figure 2. Depiction of the main steps of the proposed method.
4.1. Product Characterization
This first step of the method aims to identify the main characteristics of the product and/or serviceunder consideration. This information will help to identify decision-making criteria and potentialcircularity strategies that are relevant to the product at hand, in the next steps of the methodology [77].A potential circularity strategy is a possible candidate for evaluation and comparison during thedecision-making process [78]. A description of the product is decisive for a company to be able toefficiently choose potential circularity strategies for a typical product. Description of the productcovers relevant information regarding its characteristics, e.g., type of components and materials aswell as functional use by the consumer. The main output of this step is to identify characteristics thatinfluence the selection of circularity strategies.
4.2. Identification of Circularity Strategies
Based on the outputs of step 1, i.e., description of characteristics of the product, in this step,potential circularity strategies are identified. First, the current business strategy of the company(business-as-usual or traditional business strategy) is identified from a set of circularity strategiesdefined in Section 2.1. Then potential transformative strategies are selected based on the characteristicsof the product outlined in Section 4.1 and a set of circularity strategies defined in Section 2.1.The transformative strategy can be identified from the current business model of the company incase if the company is implementing circular strategies. Transformative circularity strategies mayinclude strategies such as advanced remanufacturing, multiple/mixed reuse strategies and productservice offerings. Afterwards, a possible future strategy is identified that may have considerablebusiness potential for the company in the near future. The main output of this step is a list of potentialcircularity strategies.
Depending on the specifics of the case, e.g., company size and complexity of the supply chain,it can be relevant to include a variety of stakeholders in this step and, as well, as employ tools thatsupport innovation for a circular economy. Bocken et al. (2019) [79] have reviewed such available toolsand new ones are being developed, e.g., Bloosma et al. (2020) [59].
4.3. Identification of Decision Criteria, Sub-Criteria and Indicators
There are various factors that influence the choice of a circularity strategy of products at EoLstage [12,14,61] (see Section 2.2). Based on a systematic literature review, Alamerew and Brissaud

Sustainability 2020, 12, 5129 9 of 19
(2018) [49], developed a list of CE evaluation criteria as well as sub-criteria, and evaluation indicatorsthat are presented in Table 2.
The list consists of both quantitative and qualitative criteria. These criteria cover, as discussed inSections 2.2 and 2.3, the circular strategies’ potential contributions to CE, i.e., environmental, economic,and social, as well as their feasibility, i.e., legislative, technical, and business. The latter three criteriaalso coincide with three of the four major challenges faced by companies when implementing circularstrategies, which were identified more recently by Kirchherr et al. (2018) [11] as cultural, regulatory,market, and technological. Therefore, the criteria in Table 2 are the recommended criteria for evaluatingcircularity strategies.
Alamerew and Brissaud (2018) [49] also suggest sub-criteria and indicators that can be usedwhen setting values to the criteria (Table 2). Not all the sub-criteria need to be used, e.g., only LifeCycle Assessment (LCA) could be used to evaluate the environmental criterion. Moreover, the listis not exhaustive, as new indicators targeting the circular economy are constantly being introduced.For example, Pauliuk (2018) [58] makes a strong case for using Material Flows Analysis (MFA) as anindicator of circularity.
Concerning the three criteria for assessing contributions towards a circular economy,i.e., environmental, economic, and social, there is a strong recommendation to use life cycle approachesbecause circularity strategies that influence one life cycle stage can shift burdens to other life cyclestages [77,80]. Therefore, Life Cycle Assessment (LCA) and LCC are recommended as the indicators forevaluating environmental and economic criteria respectively and care should be made when makingmethodological choices so that they can be used in parallel [81]. Since Social Life Cycle Assessment(SLCA) is not robust and widely used [82], other types of qualitative indicators are recommended assub-criteria or indicators for the criterion “social”.
Concerning the three feasibility criteria, i.e., legislative, technical, and business, there is astrong recommendation that decision-makers use qualitative indicators. For example, a scoring tableincluding three: 3—High; 2—Average; 1—Low; or five scales: 5—Very high; 4—High; 3—Average;2—Low; 1—Very Low can be used. Additionally, more than one type of indicator can be used so thatmultiple areas within a criterion are covered, e.g., volatility of the price of recovered materials andexpected demand.
It must be clarified that criteria, sub-criteria, and indicators can be changed depending on thespecifics of the case, such as the complexity of the supply chain, the decision-makers’ normative values,the availability of data, and the type of the product under consideration. For example, some companiesmight add a criterion about “company culture”. Learnings from the research on challenges companiesface when implementing circularity strategies, e.g., Kirchherr et al. (2018) [11], Mont et al. (2017) [56],Rizos et al. (2016) [12] indicate that challenges are case-specific although there are some similarities.Therefore, it is especially important that the sub-criteria and indicators for legislative, technical, andbusiness criteria are chosen carefully by decision-makers to suit the context.
Finally, as proposed by Lindfors et al. (2019), every effort should be made so that criteria,sub-criteria, and indicators are comprehensive but do not overlap, and that relevant stakeholders areincluded in the process of identifying them [22].
4.4. Evaluation of Circularity Strategies
After identifying the list of circularity strategies and evaluation criteria, sub-criteria, and indicators,the next phase of the method is to evaluate each alternative circularity strategy against the decisioncriteria. The main output of this step is an assessment value for each circularity strategy. The graphicalrepresentation of the main steps of the proposed evaluation method is shown below in Figure 2.
A typical problem consists of a set of available circularity strategies Ai (i = 1,2, . . . , n). Circularitystrategies are evaluated against a set of criteria Cj (j = 1,2, . . . , m). Each criteria Cj may be brokendown into Pj sub-criteria (decision factors) or indicators, Cjk (K = 1,2, . . . , Pj). The decision-maker is

Sustainability 2020, 12, 5129 10 of 19
expected to evaluate circularity strategies with respect to each decision criteria denoted as Xij (i = 1,2,. . . , n; j = 1,2, . . . , m).
The general model applied for the proposed method is:
M(Ai) = ΣWj Xi(j), j = 1,2,...m, i = 1,2, . . . , n, (1)
where:
Wj is the weighted value of j of m criteriaXi(j) is the value of i of criterion jM(Ai) is total evaluation result for each strategy.
The weighting value (Wj) is assigned based on the relative importance of each criterion/sub-criterionfor the evaluation decision. It depends on the type of product, the type of industry, and the perceptionof the decision-maker. In this step, the decision-maker assigns the value based on experience with thebusiness-as-usual product and strategy. Often, many decision-makers may be involved in assigningweighting values and a discursive approach is recommended.
Then, the evaluation score for each of the circularity strategies against each sub-criteria/decisionfactor and indicator both for the qualitative and quantitative factors is calculated. In this step,a scale-based parameter value (5—Very high; 4—High; 3—Average; 2—Low; 1—Very low) can beassigned for the qualitative decision factors such as business, technical, societal, and legislative. LCAand LCC can, for example, be performed to evaluate the environmental and economic performancefor the quantitative indicators respectively. As discussed in Section 4.3, these criteria, sub-criteriaand indicators can be changed depending on the preferences of the decision-maker(s) as well as theavailability of data and related factors.
Afterward, relative weighting (normalization) is conducted to allow a comparable scale for allcircular strategies using Equations (2) and (3). Depending on the typical problem, Equation (2) is usedwhen the objective of the problem is to maximize the result and Equation (3) is used when the objectiveis to minimize the result.
The normalization for maximization problem:
N = Xij/Xij max (2)
The normalization for minimization problem:
N = Xij min/X ij (3)
where:
Xij is the assigned value of Ai for the sub-criteria CjkXij max; Xij min are the maximum and minimum assigned value Ai for the sub-criteria Cj respectively.
Finally, the overall score of each circularity strategy is computed based on Equation (4) and rankedthe result in descending order.
M(Ai) = ΣWj Xi(j), j = 1,2,...m, i = 1,2, . . . , n, (4)
where:
Wj is the weighted value of j of m criteriaXi(j) is the value of i of criterion jM(Ai) is total evaluation result for each strategy.

Sustainability 2020, 12, 5129 11 of 19
4.5. Analysis of the Result and Recommendation
This step involves analyzing the overall score of each of the circularity strategies and providingrecommendations concerning the circularity strategies from the available list of alternatives. The mainelements and outcomes of the evaluation method for the user (decision-maker) are depicted in Figure 3.
Figure 3. Graphical repreesentaion of main outcomes of the evaluation method.
5. Verification of the Multi-Criteria Evaluation Method of Product-Level Circularity Strategies
The proposed circularity strategies’ evaluation method is verified through two illustrative exampleswith two case studies. Secondary data collected from two companies is used to verify the applicationof the proposed method to evaluate alternative circularity strategies. More details about the case studycompanies can be found from Kaddoura, Kambanou, Tillman, and Sakao (2019) [81]. In the followingsections, the application of the proposed method to each case company is presented.
5.1. Case Study for Company A
Company A offers vacuum waste collection system for residential areas, business premises, andtown centers worldwide. The collection system transports the waste through an underground pipelineand into a sealed container. In addition to product planning and installation, the company providesvarious services including maintenance. This study focuses on the inlet part of the waste collectionsystem due to frequent failure.
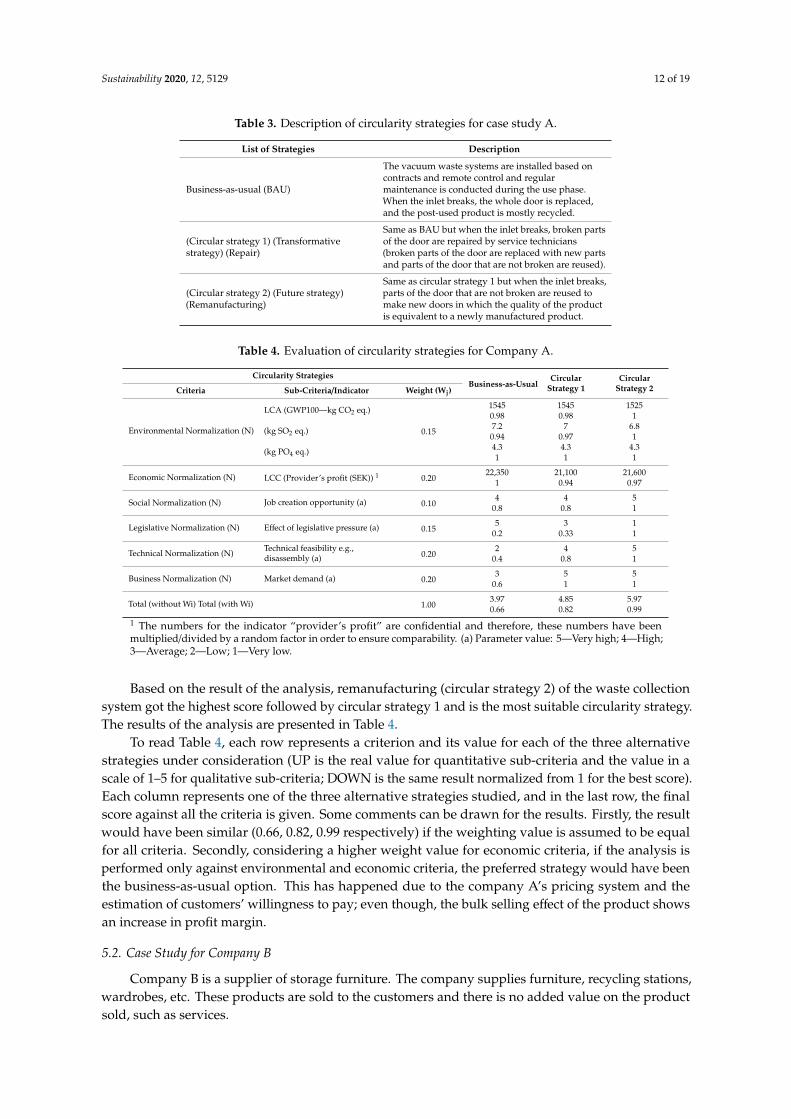
In this study, three business strategies are considered: Business-as-usual (when the inlet breaks,the whole door is replaced); circular strategy 1 (when the inlet breaks, broken parts of the door arereplaced with new parts, and parts of the door that are not broken are reused); and circular strategy 2(when the inlet breaks, parts of the door that are not broken are reused to make new doors). Table 3shows a description of circularity strategies for Company A.
The multi-criteria evaluation method has six main criteria to evaluate potential circularity strategies:Environmental, economic, social, legislative, technical, and business. The sub-criteria and indicatorsunder each criterion, which are used in this research are LCA, LCC, job creation opportunity, legislativepressure, technical feasibility (for instance, ease of disassembly, technological compatibility, etc.) andmarket demand respectively. Additionally, a weighting value of 0.15, 0.20, 0.10, 0.15, 0.20, 0.20 (basedon experience from previous study in [49] and [81]) is assigned respectively as shown in Table 4.
Sustainability 2020, 12, 5129 12 of 19
Table 3. Description of circularity strategies for case study A.
List of Strategies Description
Business-as-usual (BAU)
The vacuum waste systems are installed based oncontracts and remote control and regularmaintenance is conducted during the use phase.When the inlet breaks, the whole door is replaced,and the post-used product is mostly recycled.
(Circular strategy 1) (Transformativestrategy) (Repair)
Same as BAU but when the inlet breaks, broken partsof the door are repaired by service technicians(broken parts of the door are replaced with new partsand parts of the door that are not broken are reused).
(Circular strategy 2) (Future strategy)(Remanufacturing)
Same as circular strategy 1 but when the inlet breaks,parts of the door that are not broken are reused tomake new doors in which the quality of the productis equivalent to a newly manufactured product.
Table 4. Evaluation of circularity strategies for Company A.
Circularity StrategiesBusiness-as-Usual
CircularStrategy 1
CircularStrategy 2Criteria Sub-Criteria/Indicator Weight (Wj)
Environmental Normalization (N)
LCA (GWP100—kg CO2 eq.)
0.15
1545 1545 15250.98 0.98 1
(kg SO2 eq.) 7.2 7 6.80.94 0.97 1
(kg PO4 eq.) 4.3 4.3 4.31 1 1
Economic Normalization (N) LCC (Provider’s profit (SEK)) 1 0.2022,350 21,100 21,600
1 0.94 0.97
Social Normalization (N) Job creation opportunity (a) 0.104 4 5
0.8 0.8 1
Legislative Normalization (N) Effect of legislative pressure (a) 0.155 3 1
0.2 0.33 1
Technical Normalization (N)Technical feasibility e.g.,disassembly (a) 0.20
2 4 50.4 0.8 1
Business Normalization (N) Market demand (a) 0.203 5 5
0.6 1 1
Total (without Wi) Total (with Wi) 1.003.97 4.85 5.970.66 0.82 0.99
1 The numbers for the indicator “provider’s profit” are confidential and therefore, these numbers have beenmultiplied/divided by a random factor in order to ensure comparability. (a) Parameter value: 5—Very high; 4—High;3—Average; 2—Low; 1—Very low.
Based on the result of the analysis, remanufacturing (circular strategy 2) of the waste collectionsystem got the highest score followed by circular strategy 1 and is the most suitable circularity strategy.The results of the analysis are presented in Table 4.
To read Table 4, each row represents a criterion and its value for each of the three alternativestrategies under consideration (UP is the real value for quantitative sub-criteria and the value in ascale of 1–5 for qualitative sub-criteria; DOWN is the same result normalized from 1 for the best score).Each column represents one of the three alternative strategies studied, and in the last row, the finalscore against all the criteria is given. Some comments can be drawn for the results. Firstly, the resultwould have been similar (0.66, 0.82, 0.99 respectively) if the weighting value is assumed to be equalfor all criteria. Secondly, considering a higher weight value for economic criteria, if the analysis isperformed only against environmental and economic criteria, the preferred strategy would have beenthe business-as-usual option. This has happened due to the company A’s pricing system and theestimation of customers’ willingness to pay; even though, the bulk selling effect of the product showsan increase in profit margin.
5.2. Case Study for Company B
Company B is a supplier of storage furniture. The company supplies furniture, recycling stations,wardrobes, etc. These products are sold to the customers and there is no added value on the productsold, such as services.

Sustainability 2020, 12, 5129 13 of 19
In this study, two business strategies are considered: Business-as-usual (the product is sold to thecustomer and the customer is responsible for disposal of the product at the EoL phase), and upgrade(the product is upgraded by refreshing products’ appearance). In the circular strategy, the company isalso in charge of administering and coordinating the upgrading process. Table 5 shows a descriptionof circularity strategies considered for Company B.
Table 5. Description of circularity strategies for Company B.
List of Strategies Description
Business-as-usual The product is sold to the customer. The customer is responsible fordisposal of the product when it reaches its EoL phase.
Circular strategy (upgrading)The product is upgraded by refreshing products’ appearance andtherefore, its operational life for the customer is doubled. The companyis responsible for providing the intended service.
Case studies A and B use the same criteria and sub-criteria to evaluate circularity strategies. In thiscase study, a weighting value of 0.15, 0.20, 0.10, 0.15, 0.20, 0.20 (based on experience from the previousstudy by Alamerew and Brissaud [49] and [81]) is assigned respectively as shown in Table 6.
Table 6. Evaluation of circularity strategies for case study B.
Circularity StrategiesBusiness-as-Usual Circular Strategy
Criteria Sub-Criteria Weight (Wj)
Environmental Normalization (N)
LCA (GWP100—kg CO2 eq.)
0.15
230 125
(kg SO2 eq.)0.53 1.001.35 0.700.52 1.00
(kg PO4 eq.) 0.40 0.200.50 1.00
Economic Normalization (N) LCC (Provider’s profit (SEK)) 2 0.20550 6000.90 1.00
Social Normalization (N) Job creation opportunity (a) 0.102 4
0.5 1
Legislative Normalization (N) Effect of legislative pressure (a) 0.152 3
0.66 1
Technical Normalization (N) Technical feasibility e.g., disassembly (a) 0.202 5
0.4 1
Business Normalization (N) Market demand (a) 0.203 4
0.75 1
Total (without Wi) Total (with Wi) 1.003.73 6.000.63 1.00
2 The numbers for the indicator “provider’s profit” are confidential and therefore, these numbers have beenmultiplied by a random factor in order to ensure comparability. (a) Parameter value: 5—Very high; 4—High;3—Average; 2—Low; 1—Very low.
Based on the results of the analysis as presented in Table 6, upgrading the product is a suitablestrategy. The study shows that the circular offering, i.e., upgrading, is a preferred strategy over thebusiness-as-usual scenario. As opposed to the case study A, here, the weighting system does notinfluence the results because the circular strategy performs better against all criteria.
6. Discussion and Conclusions
6.1. Discussion
One of the challenges that impede companies from transforming their business towards a CEmodel is the lack of methods, tools, and indicators to be able to evaluate different circularity strategies.In this article, a multi-criteria evaluation method of circularity strategies for products and/or serviceshas been developed and verified. This method can be implemented at EoL phase by the companyproviding the initial product and third-party recovery/remanufacturing companies.
Sustainability 2020, 12, 5129 14 of 19
One of the limitations of this MCDM method is a lack of linkages between the criteria. MCDMis characterized by criteria independence without correlation [83]. Due to the complexity of CE, it isimperative to understand the interaction (direct or indirect dependency) among decision factors in thedecision-making process.
There is also a risk with MCDM, that sub-criteria and indicators present overlaps so the effect of adecision gets double-counted or that they do not comprehensively cover a criterion so some effects arenot taken into account when making a decision [22]. Moreover, MCDM uses qualitative indicators.The assignment of verbal grading to these indicators and its conversion into a parameter value basedon a qualitative scale is subject to ambiguity. When assigning weighing values to criteria, it may bedifficult for the decision-maker to decide which of the criteria have more influence and to quantify thisinfluence for the circularity alternatives. To minimize but not eliminate these risks, it is recommendedthat relevant stakeholders and decision-makers deliberate over and jointly discuss various choices,e.g., indicator choice, grading, and weighting.
In order to transform the qualitative criteria into quantitative numbers, a rating scale isused. In this study, a semantic scale, Likert, is recommended as it is commonly used in businessdecision-making [84,85]. A scoring scale from 1 to 5 is used to quantify the qualitative factors.Theoretically, the numerical scale/verbal grading cannot be restricted, and other scales can be usedfollowing investigation.
The proposed method uses an integrated approach to evaluate the environmental and economicbenefits of circularity strategies together with social, legislative, business and technical aspects.An illustrative example through the two case studies is presented which shows that the proposedmethod is simple and effective in dealing with circularity strategy evaluation problems. The casestudies demonstrate the process of evaluating CE strategies at the EoL phase of the product. However,the case examples lack in demonstrating the broader impact of each strategy due to the implementationof circular practices across the product life cycle such as the continuous flow of products, components,materials and information, as well as the application of service offering. This can be analyzed bystudying the environmental, economic and social benefit for the company and the resulting outcomedue to the implementation of circularity strategies.
The results from the cases demonstrate that the method can identify not only differencesbetween business-as-usual and circularity strategies, but also between different types of circularitystrategies. Compared to Alamerew and Brissaud (2018) [49], this method evaluates and comparesthe initial business of the company, a transformative strategy that transforms a product through theimplementation of advanced circularity strategies and future circular strategies.
Some of the main benefits of the proposed method are:
• It guides the decision-makers through the whole process of identifying and evaluating variouspotential circularity strategies against each other and business-as-usual.
• It helps companies identify potential circular offerings and strategies.• It suggests a list of criteria and sub-criteria/indicators which are relevant for evaluating circular
strategies, but also allows for flexibility so that the decision-maker can modify these criteria andprovides insights on how to approach such modifications.
• It can be used to evaluate and compare a large number of circular strategies.• It is a flexible method that can easily be scaled up or down to meet the needs of the decision-makers.
Finally, by using this method, more companies may be encouraged to implement circularitystrategies. This can reduce the environmental impacts associated with their products and/or services,and thereby potentially contribute to relative resource decoupling [86]. Of course, there is always a riskof rebound effects so it might not necessarily lead to absolute resource decoupling (ibid.). Therefore,a limitation of this evaluation method is that it does not take into consideration rebound effects.
This evaluation method, however, can even help companies who are, as Matschewsky (2019) [87]describes it, unintentionally contributing to relative resource decoupling to evaluate their contributions.

Sustainability 2020, 12, 5129 15 of 19
These are companies that have pursued circular strategies as good business without having consideredtheir environmental and other benefits.
6.2. Conclusions and Future Research
Evaluation of circularity strategies is crucial to select appropriate strategies and move towardsa CE. Even though various methods and indicators have been developed by academics to measurethe progress towards CE, there is a lack of circularity strategies’ evaluation methods at the productlevel [13,21]. Therefore, in this article, a multi-criteria evaluation method of product-level circularitystrategies is developed. Its contribution lies in the multi-criteria approach that can address thecomplexity of such an evaluation, and support decision-making by taking into account both how acircularity strategy performs with respect to the CE principles and how feasible the strategy is. This isdone by providing a list of recommended criteria, sub-criteria and indicators while still allowingcompanies to modify them based on their specific case. The application and usefulness of the proposedevaluation method are demonstrated by applying it on two cases: a vacuum waste collection systemand office furniture.
Although this research has contributed to filling some of the research gaps presented in Section 1,further investigations are required. One future research path is to use the proposed method for varioustypes of products, services, and industrial sectors together with practitioners. This helps to generalizethe application of the proposed method to various industrial sectors. Moreover, it could be interestingto compare and analyze the results across various industrial sectors. This helps to learn from successfulexperiences so that one industrial sector can learn from other sectors in an effort to transform to a CE.In addition, more research could be conducted to test the proposed method on first-hand company data.
Another important research opportunity could be to extend the proposed evaluation methodto include pre-use/use phase of the product/service, e.g., production energy efficiency measures.This method evaluates a post-use product/service at the EoL phase. Furthermore, the environmental,economic and social benefit of the strategies for the company and the resulting outcome could bestudied due to the implementation of circularity strategies. Along this line, apart from zooming out toinclude more types of circular strategies, further research could zoom in to identify sub-criteria andindicators that target specific circular strategies or product groups, e.g., reuse. Moreover, the interactionbetween criteria and sub-criteria and their influence on the overall result from a system perspectiveshould be studied in the future. One approach to address this gap would be to use Analytical NetworkProcess (ANP) to understand the inter-dependency among decision factors.
Author Contributions: Conceptualization, Y.A.A. and M.L.K; methodology, Y.A.A. and T.S.; validation, Y.A.A.;formal analysis, Y.A.A.; resources, M.L.K.; data curation, Y.A.A.; writing—original draft preparation, Y.A.A. andM.L.K.; writing—review and editing, Y.A.A., M.L.K., D.B. and T.S.; visualization, Y.A.A.; supervision, D.B. andT.S.; project administration, M.L.K., D.B. and T.S.; funding acquisition, D.B. and T.S. All authors have read andagreed to the published version of the manuscript.
Funding: This research was fully funded by the “Marie Sklodowska-Curie Innovative Training Network “Circ€uit”:Circular European Economy Innovative Training Network”, within Horizon 2020 Programme of the EuropeanCommission (grant number 721909). Moreover, we acknowledge the support of the Circularis (Circular Economythrough Innovation Design) project (no. 2016-03267), funded by VINNOVA, Sweden’s Innovation Agency.
Conflicts of Interest: The authors declare no conflict of interest.
References
1. Niskanen, J.; Anshelm, J.; McLaren, D. Local conflicts and national consensus: The strange case of circulareconomy in Sweden. J. Clean. Prod. 2020, 261, 121117. [CrossRef]
2. Geissdoerfer, M.; Savaget, P.; Bocken, N.M.P.; Hultink, E.J. The Circular Economy—A new sustainabilityparadigm? J. Clean. Prod. 2017, 143, 757–768. [CrossRef]
3. Rosa, P.; Sassanelli, C.; Urbinati, A.; Chiaroni, D.; Terzi, S. Assessing relations between Circular Economyand Industry 4.0: A systematic literature review. Int. J. Prod. Res. 2020, 58, 1662–1687. [CrossRef]

Sustainability 2020, 12, 5129 16 of 19
4. Fellner, J.; Lederer, J.; Scharff, C.; Laner, D. Present potentials and limitations of a circular economy withrespect to primary raw material demand. J. Ind. Ecol. 2017, 21, 494–496. [CrossRef]
5. EMF. Towards the Circular Economy: Economic and Business Rationale for an Accelerated Transition; EMF: Cowes,UK, 2013.
6. Gitelman, L.; Magaril, E.; Kozhevnikov, M.; Rada, E.C. Rational behavior of an enterprise in the energymarket in a circular economy. Resources 2019, 8, 73. [CrossRef]
7. Webster, K. The Circular Economy: A Wealth of Flows; Ellen MacArthur Foundation: Cowes, UK, 2015.8. Bocken, N.M.P.; Olivetti, E.A.; Cullen, J.M.; Potting, J.; Lifset, R. Taking the Circularity to the Next Level:
A Special Issue on the Circular Economy. J. Ind. Ecol. 2017, 21, 476–482. [CrossRef]9. Elia, V.; Gnoni, M.G.; Tornese, F. Measuring circular economy strategies through index methods: A critical
analysis. J. Clean. Prod. 2017, 142, 2741–2751. [CrossRef]10. Saidani, M.; Yannou, B.; Leroy, Y.; Cluzel, F.; Kendall, A. A taxonomy of circular economy indicators.
J. Clean. Prod. 2019, 207, 542–559. [CrossRef]11. Kirchherr, J.; Piscicelli, L.; Bour, R.; Kostense-Smit, E.; Muller, J.; Huibrechtse-Truijens, A.; Hekkert, M.
Barriers to the circular economy: Evidence from the European Union (EU). Ecol. Econ. 2018, 150, 264–272.[CrossRef]
12. Rizos, V.; Behrens, A.; van der Gaast, W.; Hofman, E.; Ioannou, A.; Kafyeke, T.; Flamos, A.; Rinaldi, R.;Papadelis, S.; Hirschnitz-Garbers, M.; et al. Implementation of circular economy business models by smalland medium-sized enterprises (SMEs): Barriers and enablers. Sustainability 2016, 8, 1212. [CrossRef]
13. Kristensen, H.S.; Mosgaard, M.A. A review of micro level indicators for a circular economy—Moving awayfrom the three dimensions of sustainability? J. Clean. Prod. 2020, 243, 118531. [CrossRef]
14. Bianchini, A.; Rossi, J.; Pellegrini, M. Overcoming the main barriers of circular economy implementationthrough a new visualization tool for circular business models. Sustainability 2019, 11, 6614. [CrossRef]
15. Geng, Y.; Fu, J.; Sarkis, J.; Xue, B. Towards a national circular economy indicator system in China: An evaluationand critical analysis. J. Clean. Prod. 2012, 23, 216–224. [CrossRef]
16. Linder, M.; Sarasini, S.; Loon, P. Van A metric for quantifying product-level circularity. J. Ind. Ecol. 2017, 21,545–558. [CrossRef]
17. Cayzer, S.; Griffiths, P.; Beghetto, V. Design of indicators for measuring product performance in the circulareconomy. Int. J. Sustain. Eng. 2017, 7038, 289–298. [CrossRef]
18. Huysman, S.; Schaepmeester, J.D.; Ragaert, K.; Dewulf, J.; Meester, S. De Resources, conservation andrecycling performance indicators for a circular economy: A case study on post-industrial plastic waste.Resour. Conserv. Recycl. 2017, 120, 46–54. [CrossRef]
19. Parchomenko, A.; Nelen, D.; Gillabel, J.; Rechberger, H. Measuring the circular economy—A multiplecorrespondence analysis. J. Clean. Prod. 2019, 210, 200–216. [CrossRef]
20. Sassanelli, C.; Rosa, P.; Rocca, R.; Terzi, S. Circular economy performance assessment methods: A systematicliterature review. J. Clean. Prod. 2019, 229, 440–453. [CrossRef]
21. Saidani, M.; Yannou, B.; Leroy, Y.; Cluzel, F. How to assess product performance in the circular economy?Proposed requirements for the design of a circularity measurement framework. Recycling 2017, 2, 6.[CrossRef]
22. Lindfors, A.; Feiz, R.; Eklund, M.; Ammenberg, J. Assessing the potential, performance and feasibility ofurban solutions: Methodological considerations and learnings from biogas solutions. Sustainability 2019, 11,3756. [CrossRef]
23. Ali, M.; Kennedy, C.M.; Kiesecker, J.; Geng, Y. Integrating biodiversity offsets within circular economy policyin China. J. Clean. Prod. 2018, 185, 32–43. [CrossRef]
24. Pesce, M.; Tamai, I.; Guo, D.; Critto, A.; Brombal, D.; Wang, X.; Cheng, H.; Marcomini, A. Circular Economyin China: Translating Principles into Practice. Sustainability 2020, 12, 832. [CrossRef]
25. Kirchherr, J.; Reike, D.; Hekkert, M. Conceptualizing the circular economy: An analysis of 114 definitions.Resour. Conserv. Recycl. 2017, 127, 221–232. [CrossRef]
26. Ellen MacArthur Foundation and Granta Design. An Approach to Measuring Circularity; Ellen MacArthurFoundation and Granta Design: Cowes, UK, 2015.
27. Stahel, W.R. The circular economy. Nature 2016, 531, 435–438. [CrossRef]28. Bakker, C.; den Hollander, M.; Van Hinte, E.; Zljlstra, Y. Products That Last: Product Design for Circular Business
Models; TU Delft Library: Delft, The Netherlands, 2014.
Sustainability 2020, 12, 5129 17 of 19
29. Niu, S.; Zhuo, H.; Xue, K. DfRem-Driven closed-loop supply chain decision-making: A systematic frameworkfor modeling research. Sustainability 2019, 11, 3299. [CrossRef]
30. Hopkinson, P.; De Angelis, R.; Zils, M. Systemic building blocks for creating and capturing value fromcircular economy. Resour. Conserv. Recycl. 2020, 155, 104672. [CrossRef]
31. Levänen, J.; Lyytinen, T.; Gatica, S. Modelling the Interplay Between Institutions and Circular EconomyBusiness Models: A Case Study of Battery Recycling in Finland and Chile. Ecol. Econ. 2018, 154, 373–382.[CrossRef]
32. Alamerew, Y.A.; Brissaud, D. Modelling reverse supply chain through system dynamics for realizing thetransition towards the circular economy: A case study on electric vehicle batteries. J. Clean. Prod. 2020,254, 120025. [CrossRef]
33. Sangwan, K.S. Key activities, decision variables and performance indicators of reverse logistics. Procedia CIRP2017, 61, 257–262. [CrossRef]
34. Julianelli, V.; Caiado, R.G.G.; Scavarda, L.F.; Cruz, S.P.D.M.F. Interplay between reverse logistics and circulareconomy: Critical success factors-based taxonomy and framework. Resour. Conserv. Recycl. 2020, 158, 104784.[CrossRef]
35. Korhonen, J.; Nuur, C.; Feldmann, A.; Seyoum Eshetu, B. Circular economy as an essentially contestedconcept. J. Clean. Prod. 2018, 175, 544–552. [CrossRef]
36. Di Maio, F.; Rem, P.C. A Robust Indicator for Promoting Circular Economy through Recycling. J. Environ. Prot.2015, 06, 1095–1104. [CrossRef]
37. Brissaud, D.; Zwolinski, P. The Scientific Challenges for a Sustainable Consumption and Production Scenario:The Circular Reuse of Materials for the Upgrading and Repurposing of Components. Procedia CIRP 2017, 61,663–666. [CrossRef]
38. Richa, K.; Babbitt, C.W.; Gaustad, G.; Wang, X. A future perspective on lithium-ion battery waste flows fromelectric vehicles. Resour. Conserv. Recycl. 2014, 83, 63–76. [CrossRef]
39. Burke, A. Performance, Charging, and Second-Use Considerations for Lithium Batteries for Plug-In Electric Vehicles;UC Davis Institute of Transportation Studies: Davis, CA, USA, 2009.
40. Winslow, K.M.; Laux, S.J.; Townsend, T.G. A review on the growing concern and potential managementstrategies of waste lithium-ion batteries. Resour. Conserv. Recycl. 2018, 129, 263–277. [CrossRef]
41. King, A.M.; Burgess, S.C.; Ijomah, W.; McMahon, C.A. Reducing waste: Repair, recondition, remanufactureor recycle? Sustain. Dev. 2006, 14, 257–267. [CrossRef]
42. Krikke, H.R. Recovery Strategies and Reverse Logistic Network Design. Ph.D. Thesis, University of Twente,Enschede, The Netherlands, 1998.
43. Paterson, D.A.P.; Ijomah, W.L.; Windmill, J.F.C. End-of-Life decision tool with emphasis on remanufacturing.J. Clean. Prod. 2017, 148, 653–664. [CrossRef]
44. Ijomah, W.L. A Model-Based Definition of The Generic Remanufacturing Business Process; University of Plymouth:Plymouth, UK, 2002.
45. Rose, C.M. Design for Environment: A Method for Formulating End-of-Life Strategies. Ph.D. Thesis, StanfordUniversity, Stanford, CA, USA, 2000.
46. Sundin, E. Product and Process Design for Successful Remanufacturing. Ph.D. Thesis, Linköping University,Linköping, Sweden, 2004.
47. Bauer, T.; Brissaud, D.; Zwolinski, P. Design for High Added-Value End-of-Life Strategies. In SustainableManufacturing; Springer: Cham, Switzerland, 2017; ISBN 978-3-319-48513-3.
48. Kurt, A.; Cung, V.; Mangione, F.; Cortes-Cornax, M.; Front, A. An extended circular supply chain modelincluding repurposing activities. In Proceedings of the International Conference on Control, Automationand Diagnosis (ICCAD), Grenoble, France, 2–4 July 2019; pp. 1–6.
49. Alamerew, Y.A.; Brissaud, D. Circular economy assessment tool for end of life product recovery strategies.J. Remanuf. 2018, 9, 169–185. [CrossRef]
50. Jawahir, I.S.; Bradley, R. Technological elements of circular economy and the principles of 6R-based closed-loopmaterial flow in sustainable manufacturing. Procedia Cirp 2016, 40, 103–108. [CrossRef]
51. Widmer, T.; Tjahjono, B.; Bourlakis, M. Defining value creation in the context of circular PSS. Procedia CIRP2018, 73, 142–147. [CrossRef]
52. Kumar, V.; Shirodkar, P.S.; Camelio, J.A.; Sutherland, J.W. Value flow characterization during product lifecycleto assist in recovery decisions. Int. J. Prod. Res. 2007, 45, 18–19. [CrossRef]

Sustainability 2020, 12, 5129 18 of 19
53. Thierry, M.; Salomon, M.; Vannunen, J.; Vanwassenhove, L. Strategic Issues in Product Recovery Management.Calif. Manag. Rev. 1995, 37, 114–135. [CrossRef]
54. Ghisellini, P.; Cialani, C.; Ulgiati, S. A review on circular economy: The expected transition to a balancedinterplay of environmental and economic systems. J. Clean. Prod. 2016, 114, 11–32. [CrossRef]
55. Kambanou, M.L.; Sakao, T. Using life cycle costing (LCC) to select circular measures: A discussion andpractical approach. Resour. Conserv. Recycl. 2020, 155, 104650. [CrossRef]
56. Mont, O.; Plepys, A.; Whalen, K.; Nußholz, J.L. Business Model Innovation For a Circular Economy: Driversand Barriers for the Swedish Industry–the Voice of REES Companies; Lund University Publications: Lund,Sweden, 2017.
57. Babbitt, C.W.; Gaustad, G.; Fisher, A.; Chen, W.-Q.; Liu, G. Closing the loop on circular economy research:From theory to practice and back again. Resour. Conserv. Recycl. 2018, 135, 1–2. [CrossRef]
58. Pauliuk, S. Critical appraisal of the circular economy standard BS 8001:2017 and a dashboard of quantitativesystem indicators for its implementation in organizations. Resour. Conserv. Recycl. 2018, 129, 81–92.[CrossRef]
59. Blomsma, F.; Pieroni, M.; Kravchenko, M.; Pigosso, D.C.A.; Hildenbrand, J.; Kristinsdottir, A.R.;Kristoffersen, E.; Shahbazi, S.; Nielsen, K.D.; Jönbrink, A.-K.; et al. Developing a circular strategiesframework for manufacturing companies to support circular economy-oriented innovation. J. Clean. Prod.2019, 241, 118271. [CrossRef]
60. Saidani, M.; Yannou, B.; Leoroy, Y.; Cluzel, F. Hybrid top-down and bottom-up framework to measureproducts’ circularity performance. In Proceedings of the 21st International conference on engineering design,ICED17, Vancover, BC, Canada, 21–25 August, 2017; Volume 1, pp. 81–90.
61. Doyle, K.; Ijomah, W.L.; Antony, J. Identifying the End of Life Decision Making Factors. In Design forInnovative Value Towards a Sustainable Society; Springer: Dordrecht, The Netherlands, 2012; pp. 530–534.[CrossRef]
62. Dunmade, I. PLETS model: A sustainability concept based approach to product end-of-life management. InProceedings of the Environmentally Conscious Manufacturing IV; Surendra, M.G., Ed.; International Society forOptics and Photonics: Bellingham, WA, USA, 2004; Volume 5583, pp. 118–126.
63. Shih, L.H.; Chang, Y.S.; Lin, Y.T. Intelligent evaluation approach for electronic product recycling via case-basedreasoning. Adv. Eng. Informatics 2006, 20, 137–145. [CrossRef]
64. Selmi, M.; Kormi, T.; Bel Hadj Ali, N. Comparison of multi-criteria decision methods through a rankingstability index. Int. J. Oper. Res. 2016, 27, 165. [CrossRef]
65. Velasquez, M.; Hester, P.T. An analysis of multi-criteria decision making methods. Int. J. Oper. Res. 2013, 10,56–66.
66. ResCoM Resource Conservative Manufacturing Project. Available online: https://rescomd58.eurostep.com/
idealco/pathfinder/ (accessed on 5 March 2020).67. Lee, H.M.; Lu, W.F.; Song, B. A framework for assessing product end-of-life performance: Reviewing the
state of the art and proposing an innovative approach using an end-of-life index. J. Clean. Prod. 2014, 66,355–371. [CrossRef]
68. Evans, J.; Bocken, N.M.P. Circular Economy Toolkit. Available online: http://circulareconomytoolkit.org/
index.html (accessed on 16 July 2019).69. Iakovou, E.; Moussiopoulos, N.; Xanthopoulos, A.; Achillas, C.; Michailidis, N.; Chatzipanagioti, M.;
Koroneos, C.; Bouzakis, K.D.; Kikis, V. A methodological framework for end-of-life management of electronicproducts. Resour. Conserv. Recycl. 2009, 53, 329–339. [CrossRef]
70. Mardani, A.; Jusoh, A.; Nor, K.M.D.; Khalifah, Z.; Zakwan, N.; Valipour, A. Multiple criteria decision-makingtechniques and their applications—A review of the literature from 2000 to 2014. Econ. Res. Istraz. 2015, 28,516–571. [CrossRef]
71. Macoun, P.; Prabhu, R. Guidelines for Applying Multi-Criteria Analysis to The Assessment of Criteria and Indicators;CIFOR: Bogor, Indonesia, 1999.
72. Feiz, R.; Ammenberg, J. Assessment of feedstocks for biogas production, part I—A multi-criteria approach.Resour. Conserv. Recycl. 2017, 122, 373–387. [CrossRef]
73. Dijk, M.; de Kraker, J.; van Zeijl-Rozema, A.; van Lente, H.; Beumer, C.; Beemsterboer, S.; Valkering, P.Sustainability assessment as problem structuring: Three typical ways. Sustain. Sci. 2017, 12, 305–317.[CrossRef]
Sustainability 2020, 12, 5129 19 of 19
74. Siregar, D.; Arisandi, D.; Usman, A.; Irwan, D.; Rahim, R. Research of Simple Multi-Attribute RatingTechnique for Decision Support. J. Phys. Conf. Ser. 2017, 930. [CrossRef]
75. Risawandi, R.R. Study of the Simple Multi-Attribute Rating Technique For Decision Support. IJSRST 2016, 2,491–494.
76. Taylor, J.M.; Love, B.N. Simple multi-attribute rating technique for renewable energy deployment decisions(SMART REDD). J. Def. Model. Simul. Appl. Methodol. Technol. 2014, 11, 227–232. [CrossRef]
77. Böckin, D.; Willskytt, S.; André, H.; Tillman, A.-M.; Ljunggren Söderman, M. How product characteristicscan guide measures for resource efficiency—A synthesis of assessment studies. Resour. Conserv. Recycl. 2020,154, 104582. [CrossRef]
78. Roy, B. Multicriteria Methodology for Decision Aiding; Springer Science & Business Media: Berlin/Heideberg,Germany, 1996.
79. Bocken, N.; Strupeit, L.; Whalen, K.; Nußholz, J. A review and evaluation of circular business modelinnovation tools. Sustainability 2019, 11, 2210. [CrossRef]
80. Finnveden, G.; Moberg, Å. Environmental systems analysis tools—An overview. J. Clean. Prod. 2005, 13,1165–1173. [CrossRef]
81. Kaddoura, M.; Kambanou, M.L.; Tillman, A.-M.; Sakao, T. Is prolonging the lifetime of passive durableproducts a low-hanging fruit of a circular economy? A multiple case study. Sustainability 2019, 11, 4819.[CrossRef]
82. Martínez-Blanco, J.; Lehmann, A.; Muñoz, P.; Antón, A.; Traverso, M.; Rieradevall, J.; Finkbeiner, M.Application challenges for the social Life Cycle Assessment of fertilizers within life cycle sustainabilityassessment. J. Clean. Prod. 2014, 69, 34–48. [CrossRef]
83. Ishizaka, A.; Labib, A. Analytic hierarchy process and expert choice: Benefits and limitations. OR Insight2009, 22, 201–220. [CrossRef]
84. Munshi, J. A method for constructing likert scales. SSRN Electron. J. 2014. [CrossRef]85. Nemoto, T.; Beglar, D. Developing likert-scale questionnaires. In Proceedings of the JALT Conference
Proceedings, Tokyo, Japan, 25–28 October 2014; pp. 1–8.86. Kjaer, L.L.; Pigosso, D.C.A.; Niero, M.; Bech, N.M.; McAloone, T.C. Product/Service-Systems for a Circular
Economy: The Route to Decoupling Economic Growth from Resource Consumption? J. Ind. Ecol. 2019, 23,22–35. [CrossRef]
87. Matschewsky, J. Unintended circularity?-Assessing a product-service system for its potential contribution toa circular economy. Sustainability 2019, 11, 2725. [CrossRef]
© 2020 by the authors. Licensee MDPI, Basel, Switzerland. This article is an open accessarticle distributed under the terms and conditions of the Creative Commons Attribution(CC BY) license (http://creativecommons.org/licenses/by/4.0/).


![MULTI-CRITERIA PROJECT PORTFOLIO OPTIMIZATION UNDER … Multi-criteria... · multi-criteria utility function [18] as a tool of the multi-criteria assessment of the projects under](https://static.fdocuments.net/doc/165x107/5d58df0b88c9931b1c8bdcb0/multi-criteria-project-portfolio-optimization-under-multi-criteria-multi-criteria.jpg)


