A modular parallelization framework for power flow ...
12
A modular parallelization framework for power flow transfer analysis of large-scale power systems Chuntian CHENG 1 , Bin LUO 1,2 , Jianjian SHEN 1 , Shengli LIAO 1 Abstract Power flow transfer (PFT) analysis under various anticipated faults in advance is important for securing power system operations. In China, PSD-BPA software is the most widely used tool for power system analysis, but its input/output interface is easily adapted for PFT analysis, which is also difficult due to its computationally intensity. To solve this issue, and achieve a fast and accurate PFT analysis, a modular parallelization framework is developed in this paper. Two major contributions are included. One is several integrated PFT analysis modules, including parameter initialization, fault setting, network integrity detection, reasonableness identification and result analysis. The other is a parallelization technique for enhancing computation efficiency using a Fork/Join framework. The proposed framework has been tested and validated by the IEEE 39 bus reference power system. Furthermore, it has been applied to a practical power network with 11052 buses and 12487 branches in the Yunnan Power Grid of China, providing decision support for large-scale power system analysis. Keywords Power flow transfer, Modular, Parallelization, Fork/Join framework, PSD-BPA 1 Introduction Many researchers have carried out in-depth analysis on massive blackouts that have occurred repeatedly world- wide, such as on 30–31st July 2012 in India [1, 2], 28th September 2003 in Italy [3], 4th November 2006 in Wes- tern Europe [4], 14th August 2003 in USA and Canada [5], and so on. Results show that the outage of a single line may result in critical overloads on other lines due to transfers of power flows, which are often the main contributors to the cascading failures leading to these undesired situations [6, 7]. One compromise operational solution is to reduce the transmission power well below its operational limits, but this means underutilization of network capacity. To guarantee security and simultaneously strike a balance with economic viability, it is necessary to perform extensive power flow transfer (PFT) analysis for anticipated faults in advance. Analysis related to PFT has been attracting much attention in power system research. Ma et al. [8] proposed a novel load transfer strategy based on the power transfer capacity for a main-transformer fault, to avoid the over- loading of the directly connected main transformers. Li and Yu [9] proposed a generalized power transfer distribution factor for power injection analysis. Yan and Zhou [10] firstly introduced the causes and phenomena of flow transfer, and then defined the flow transfer sensitivity. Cheng et al. [11] presented a search method based on a CrossCheck date: 15 May 2017 Received: 12 March 2016 / Accepted: 17 May 2017 / Published online: 21 December 2017 Ó The Author(s) 2017. This article is an open access publication & Bin LUO [email protected] Chuntian CHENG [email protected] Jianjian SHEN [email protected] Shengli LIAO [email protected] 1 Institute of Hydropower System and Hydroinformatics, Dalian University of Technology, Dalian 116024, China 2 Tsinghua Sichuan Energy Internet Research Institute, Chengdu 610200, China 123 J. Mod. Power Syst. Clean Energy (2018) 6(4):679–690 https://doi.org/10.1007/s40565-017-0354-4
Transcript of A modular parallelization framework for power flow ...

A modular parallelization framework for power flow transferanalysis of large-scale power systems
Chuntian CHENG1, Bin LUO1,2, Jianjian SHEN1, Shengli LIAO1
Abstract Power flow transfer (PFT) analysis under various
anticipated faults in advance is important for securing
power system operations. In China, PSD-BPA software is
the most widely used tool for power system analysis, but its
input/output interface is easily adapted for PFT analysis,
which is also difficult due to its computationally intensity.
To solve this issue, and achieve a fast and accurate PFT
analysis, a modular parallelization framework is developed
in this paper. Two major contributions are included. One is
several integrated PFT analysis modules, including
parameter initialization, fault setting, network integrity
detection, reasonableness identification and result analysis.
The other is a parallelization technique for enhancing
computation efficiency using a Fork/Join framework. The
proposed framework has been tested and validated by the
IEEE 39 bus reference power system. Furthermore, it has
been applied to a practical power network with 11052
buses and 12487 branches in the Yunnan Power Grid of
China, providing decision support for large-scale power
system analysis.
Keywords Power flow transfer, Modular, Parallelization,
Fork/Join framework, PSD-BPA
1 Introduction
Many researchers have carried out in-depth analysis on
massive blackouts that have occurred repeatedly world-
wide, such as on 30–31st July 2012 in India [1, 2], 28th
September 2003 in Italy [3], 4th November 2006 in Wes-
tern Europe [4], 14th August 2003 in USA and Canada [5],
and so on. Results show that the outage of a single line may
result in critical overloads on other lines due to transfers of
power flows, which are often the main contributors to the
cascading failures leading to these undesired situations
[6, 7]. One compromise operational solution is to reduce
the transmission power well below its operational limits,
but this means underutilization of network capacity. To
guarantee security and simultaneously strike a balance with
economic viability, it is necessary to perform extensive
power flow transfer (PFT) analysis for anticipated faults in
advance.
Analysis related to PFT has been attracting much
attention in power system research. Ma et al. [8] proposed a
novel load transfer strategy based on the power transfer
capacity for a main-transformer fault, to avoid the over-
loading of the directly connected main transformers. Li and
Yu [9] proposed a generalized power transfer distribution
factor for power injection analysis. Yan and Zhou [10]
firstly introduced the causes and phenomena of flow
transfer, and then defined the flow transfer sensitivity.
Cheng et al. [11] presented a search method based on a
CrossCheck date: 15 May 2017
Received: 12 March 2016 /Accepted: 17 May 2017 / Published
online: 21 December 2017
� The Author(s) 2017. This article is an open access publication
& Bin LUO
Chuntian CHENG
Jianjian SHEN
Shengli LIAO
1 Institute of Hydropower System and Hydroinformatics,
Dalian University of Technology, Dalian 116024, China
2 Tsinghua Sichuan Energy Internet Research Institute,
Chengdu 610200, China
123
J. Mod. Power Syst. Clean Energy (2018) 6(4):679–690
https://doi.org/10.1007/s40565-017-0354-4

minimal basic circuit set to confirm the lines to which the
power flow of a tripped line would be transferred. Xu et al.
[12] developed a new backup protection strategy based on
wide area measurement system (WAMS) to estimate the
flow transfer. The available transfer capability (ATC) cal-
culation is also a key issue for understanding the response
to faults [13, 14]. Yet, for operation of large-scale appli-
cation systems, to our knowledge, no mature, fast and also
accurate solution tools for PFT analysis have come out of
earlier studies, especially for global scanning analysis over
many contingencies.
With the rapid growth of power systems, we rely
increasingly on simulation tools, such as PSS/E (USA),
NETOMAC (Germany), PSCAD/EMTDC (Canada) and so
on. In China, the China Electric Power Research Institute
(CEPRI), after having introduced the BPA (Bonneville
Power Administration) program from United States in the
1980s, further developed the PSD-BPA software [15, 16]
and promoted it nationwide. Nowadays, it is one of the
indispensable analysis tools for power system analysis
[17]. However, all that is visible to the user is an interface
that receives input (i.e. operation mode) and provides
output, which are both presented in text form. It is not able
to update model parameters automatically, and it is tedious
to filter useful information from results that are in text
form. These factors make it hard to do PFT analysis
directly without auxiliary measures. Especially when
comes to large-scale power systems, the PFT analysis
involves much computation and time is also a major
impediment.
Parallel processing is now a widely available technol-
ogy, and has proved to be successful for improving effi-
ciency in power system analysis, like operational planning
[18], discrete event simulation [19], contingency analysis
[20], etc. But achieving parallelization for practical engi-
neering problems is still challenging. The difficulties lie in
the following areas:
1) To achieve parallelization with high performance and
low cost, algorithms should be coordinated with
existing parallel processing hardware and software
properly. However, for different practical needs and
computer configurations, an algorithm may need to be
newly reconstructed and the model may also change a
lot, so the design of all-purpose parallel codes
becomes much complex.
2) A viable cost-saving option is to take full advantage of
the existing simulation tools. However, they are
mostly not suited for further redevelopment. Applying
parallelization techniques to existing tools is also not
easy.
3) The practical engineering problems are mostly of large
scale with unknown emergencies, the requirements for
stability, portability and scalability of the paralleliza-
tion are high.
To achieve a fast and accurate implementation for PFT
analysis of large-scale power systems, this paper proposes
a modular parallelization framework based on existing
simulation tools. Modules integrated with the PSD-BPA
software to do automatic PFT analysis, including parameter
initialization, fault setting, network integrity detection,
reasonableness identification and result analysis, are firstly
designed and programmed via the Java programming lan-
guage. Then, based on the Fork/Join framework, the PSD-
BPA software and integrated modules are parallelized, and
the ‘‘divide-and-conquer’’ strategy is used to decompose
the huge task recursively into smaller subtasks that can be
executed simultaneously on different CPU threads. Simu-
lation results for the 10-unit, 39-bus IEEE reference power
system validate the proposed framework’s accuracy. Fur-
thermore, practical application to the Yunnan Power Grid
in China is also demonstrated. The parallel performance is
compared by applying it to different size schemes on dif-
ferent computer systems. The results show that the pro-
posed framework can feasibly guarantee accuracy and
efficiency, and is suitable for large-scale power systems.
The remainder of this paper is organized as follows.
Section 2 is devoted to detailed presentation of the pro-
posed framework, including integrated modules and par-
allel processing design. In Sect. 3, two case studies are
shown to evaluate the proposed framework’s performance
and results are carefully discussed. Finally, Sect. 4 outlines
the main conclusions.
2 Materials and methods
2.1 Modular PFT analysis model
2.1.1 PFT analysis model
The goal of PFT analysis in this paper is to obtain
accurately the changing active power of transmission lines
and cross sections from a base state to fault state under
given operating conditions [11, 12]. To describe this in
more detail, a simple example network with 3 buses and 3
branches (i.e. L1, L2 and L3) with anticipated N-1 outage of
L3 is shown in Fig. 1 below.
Base state: PL1 = p1, PL2 = p2, PL3 = p3;
Fault state: PL1 = p10, PL2 = p2
0, PL3 = p30 = 0;
where PLi is the active power flow value of branch Li; pidenotes the base state; and pi
0 denotes the fault state. When
the N-1 fault occurs to L3, the PFT results of L1 and L2 are
680 Chuntian CHENG et al.
123

defined as fL1 and fL2, respectively, and formulated as
follows [11]:
fL1 ¼p01 � p1
p3� 100%
fL2 ¼p02 � p2
p3� 100%
8>><
>>:
ð1Þ
Therefore, operators can know the accurate
redistribution of power flows after a fault in advance, and
quickly know the lines to which the power flow of the
tripped line has been transferred. This will be helpful in
making better pre-control decisions and in minimizing the
operational risk to the power grid.
2.1.2 Integrated modules
As it is hard to do PFT analysis directly with the PSD-
BPA software, auxiliary modules including parameter ini-
tialization, fault setting, network integrity detection, rea-
sonableness identification and result analysis are designed,
and encapsulated as executable programs via the Java
programming language. Their functionality is as
follows.
1) ParameterAnalysis.exe
Parse operational parameters, acquire all equipment infor-
mation and classify according to type, region, sub-region,
voltage level, etc. This provides well managed basic data
for other modules.
2) FaultSetting.exe
Set analysis conditions. According to the analysis condition
file (i.e. condition.txt in Table 1), the network parameters
are changed from their base-state values to their fault-state
values.
3) IntegrityDetection.exe
Network integrity is the prerequisite for simulation analy-
sis. During the computation, fault setting may lead to iso-
lated nodes or island regions so that the computation
cannot be continued. Here, we employ the depth-first
search (DFS) algorithm [21, 22] to perform integrity
detection. Consider the IEEE 9 reference power system as
a search example, shown in Fig. 2. At the beginning of the
DFS, all nodes are marked unvisited, and nodes accessed
during the search are marked already-visited to avoid
repetition. Assume that the left edges in the graph are
chosen before the right ones, and node A is selected as the
starting vertex. The DFS algorithm runs as follows:
a) Mark vertex A as already-visited.
b) For each branch (A, x), run a depth-first search for A
recursively. The notation (A, x) means a branch with
end nodes A and x, and x is unvisited.
c) The DFS has finished processing the vertex x and
backtracks to the parent.
The nodes are visited in the following order: A, B, C, F,
E, G, H, D, I. The DFS traversal is performed until all
nodes in the network having connections with node A are
visited. If the numbers of visited nodes and effective nodes
of current grid network are the same, it demonstrates that
all nodes are connected and there are no isolated nodes and
island regions. Otherwise, it means the existence of iso-
lated nodes or island regions. Then, an arbitrary unvisited
node is selected as the starting vertex, and the DFS algo-
rithm is performed again until all nodes in the network are
visited. With such recursive traversals, all isolated nodes
and island regions can be detected.
4) ReasonablenessIdentification.exe
The power flow results are output in text form. A large
amount of information is also output during the calculation
process. It is hard to directly judge the reasonableness of
results by manual means, and it is meaningless to perform
PFT analysis based on unreasonable power flow results,
therefore this module is programmed to monitor the entire
computing process. The convergence of the power flow
calculation, power flows in transmission lines, bus volt-
ages, transformer loads and other output information are
analyzed from output files. Based on pre-defined security
ranges, the reasonableness of results can be determined
automatically. The security ranges are defined according to
[23, 24]. For example, the security range of generator
terminal voltage is 0.95–1.05 p.u. of nominal voltage, the
allowable voltage deviation of 220 kV buses is 0%–10% of
nominal voltage under normal condition and - 5%–10%
under fault condition, and the overload of transmission
lines and transformers is not allowed.
5) ResultAnalysis.exe
Analyze the PSD-BPA output files of base state and fault
state, and further compute PFT results.
N-1 outage
etatstluaFetatsesaB
F
Active power flow direction
L3L2
L1
L3L2
L1
Fig. 1 Schematic diagram of PFT analysis
A modular parallelization framework for power flow transfer analysis of large-scale… 681
123

Hence, combined with these modules, the PSD-BPA
software can realize PFT analysis automatically. The
computation process of these modules is shown Fig. 3.
2.2 Parallel processing design
To enhance computation efficiency for large-scale
power systems, the modular PFT analysis is parallelized.
With reference to the parallel design shown in Fig. 3 and
Table 1, this section describes the parallelism analysis,
Fork/Join framework and parallelization of PSD-BPA
software in detail.
2.2.1 Parallelism analysis
Parallel computing refers to the decomposition of a
complex task into subtasks, and their assignment to dif-
ferent CPU cores for simultaneous computation, so as to
reduce computation time and improve efficiency. Two
necessary prerequisites are: � the subtasks under simulta-
neous computation must be independent of each other; and
` the computing facility must have multiple CPU cores.
To implement the parallelization, PFT analysis for one
fault is treated as a work unit, and can be managed by one
CPU logical thread at a time. Because they are imple-
mented in a modular way, the fault setting, integrity
detection, power flow calculation, reasonableness identifi-
cation and result analysis for any single fault are inde-
pendent. With advanced computer technology, multi-core
processors have become common, which furnishes a
powerful hardware support for wide applications of parallel
computing. Therefore, it is feasible to realize parallelized
analysis of PFT.
2.2.2 Fork/Join framework
Fork/Join parallelism is an easy-to-use but effective
design technique for parallelizing computations. It was
proposed by Lea [25] in 2000, and has been widely applied
in scientific fields [26, 27]. It was integrated, as a standard
parallel framework, into Java7 [28] and released in July
2011. The end users do not necessarily need a solid
background on parallel programming, but need only to
define the division of tasks and combination of interme-
diate results, leaving the error-prone, complex and reusable
part to be implemented by this framework. Figure 4 shows
a schematic diagram of the Fork/Join model.
The Fork/Join framework is based on the ‘‘divide-and-
conquer’’ strategy to handle large amounts of data. The basic
idea is to recursively split a large-scale task in half, and then
those halves are further split until the scale of subtasks is
small enough. In the process of task decomposition, a
threshold is defined for the scale of subtasks to determine
whether the current subtask needs to be further split, i.e.,
when the scale of a task is less than or equal to the threshold,
division of that task is stopped. An illustration is shown in
Fig. 5a. It can be observed that too small a threshold value
results in more recursive layers, and more subtasks.
Although this ensures all the computation threads are
working, the overhead of coordinating them will be greater.
Table 1 Input and configuration files for PFT analysis
Name Description
xx.DAT An operation mode input file with strict format in each row (generally called a card), each card comprising a number of short
segments with different properties. It contains the computation conditions and network parameters of the power grid. The
contained information is huge and managed in an obscure way, which makes it difficult to update parameters automatically
xx.SWI An operation mode input file with format like DAT, which contains parameters used for stability analysis of power systems. It is
also difficult to update parameters automatically
Condition.txt This file contains the analysis conditions. Two types are provided: one is global scanning analysis, including fault type (N-1, N-2,
N-x, N-1-1, etc.) and scanning ranges (region, voltage levels, etc.); and the other is the key cross section analysis, including
fault type, faulted equipment and influenced equipment
Output.txt This file is used to control the display of computation results. The results can be ranked by region, voltage, equipment type,
severity of PFT result, and so on. The results of network integrity detection and reasonableness identification during the
analysis process are also included
Change.txt This file is used to change the parameters of the base state, and perform PFT analysis again automatically. The information
includes units generation, loads, component parameters, on-off state, and so on
C
B
A
FE G H I
D
Search path; Backtrack
Fig. 2 Network integrity detection based on DFS algorithm
682 Chuntian CHENG et al.
123

In contrast, if the threshold value is too large, there are fewer
subtasks and some computation threads may be idle, which
does not make full use of multi-core resources. Therefore,
selecting an appropriate threshold value is important in
parallel design. To avoid both deep recursion and idle
computer resources, an appropriate threshold value is:
k ¼ m
a
l mð2Þ
where k is the threshold value; m is the task scale which is
quantified by the number of anticipated faults to be analyzed;
DAT SWI
ParameterAnalysis.exe
BPA input
pfnt.exe
condition.txt
FaultSetting.exe
ResultAnalysis.exe
Transfer result
ReasonablenessIdentification.exe
No. of child thread
Stop
Changebase state?
Y
N
change.txt
Power flow of base state
Modified BPA input
pfnt.exe
New BPA output
Main thread
Parallelization
Display results
Delete unused files
output.txt
Backup
IntegrityDetection.exe
Create a thread pool
Thread 1 Thread 2 Thread n-1 Thread n
BPA output
Shut down thread pool
BPA output
Combine all results
Fault 1 Fault 2 Fault n-1 Fault n
Call
Call
Programmed Modules; PSD-BPA software
Fig. 3 Schematic diagram of the modular parallel processing design of PFT analysis
Task
Subtasks
1
2
n
Threads
Fork Join
Fig. 4 Schematic diagram of Fork/Join model
A modular parallelization framework for power flow transfer analysis of large-scale… 683
123
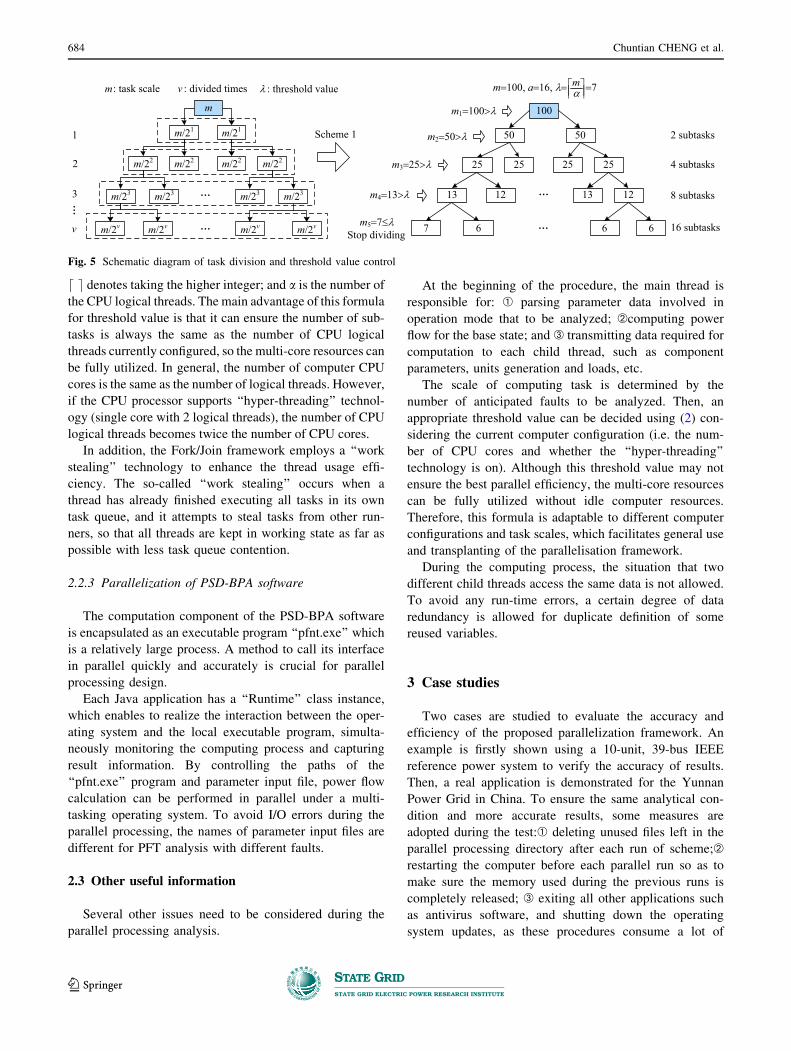
d e denotes taking the higher integer; and a is the number of
the CPU logical threads. The main advantage of this formula
for threshold value is that it can ensure the number of sub-
tasks is always the same as the number of CPU logical
threads currently configured, so the multi-core resources can
be fully utilized. In general, the number of computer CPU
cores is the same as the number of logical threads. However,
if the CPU processor supports ‘‘hyper-threading’’ technol-
ogy (single core with 2 logical threads), the number of CPU
logical threads becomes twice the number of CPU cores.
In addition, the Fork/Join framework employs a ‘‘work
stealing’’ technology to enhance the thread usage effi-
ciency. The so-called ‘‘work stealing’’ occurs when a
thread has already finished executing all tasks in its own
task queue, and it attempts to steal tasks from other run-
ners, so that all threads are kept in working state as far as
possible with less task queue contention.
2.2.3 Parallelization of PSD-BPA software
The computation component of the PSD-BPA software
is encapsulated as an executable program ‘‘pfnt.exe’’ which
is a relatively large process. A method to call its interface
in parallel quickly and accurately is crucial for parallel
processing design.
Each Java application has a ‘‘Runtime’’ class instance,
which enables to realize the interaction between the oper-
ating system and the local executable program, simulta-
neously monitoring the computing process and capturing
result information. By controlling the paths of the
‘‘pfnt.exe’’ program and parameter input file, power flow
calculation can be performed in parallel under a multi-
tasking operating system. To avoid I/O errors during the
parallel processing, the names of parameter input files are
different for PFT analysis with different faults.
2.3 Other useful information
Several other issues need to be considered during the
parallel processing analysis.
At the beginning of the procedure, the main thread is
responsible for: � parsing parameter data involved in
operation mode that to be analyzed; `computing power
flow for the base state; and ´ transmitting data required for
computation to each child thread, such as component
parameters, units generation and loads, etc.
The scale of computing task is determined by the
number of anticipated faults to be analyzed. Then, an
appropriate threshold value can be decided using (2) con-
sidering the current computer configuration (i.e. the num-
ber of CPU cores and whether the ‘‘hyper-threading’’
technology is on). Although this threshold value may not
ensure the best parallel efficiency, the multi-core resources
can be fully utilized without idle computer resources.
Therefore, this formula is adaptable to different computer
configurations and task scales, which facilitates general use
and transplanting of the parallelisation framework.
During the computing process, the situation that two
different child threads access the same data is not allowed.
To avoid any run-time errors, a certain degree of data
redundancy is allowed for duplicate definition of some
reused variables.
3 Case studies
Two cases are studied to evaluate the accuracy and
efficiency of the proposed parallelization framework. An
example is firstly shown using a 10-unit, 39-bus IEEE
reference power system to verify the accuracy of results.
Then, a real application is demonstrated for the Yunnan
Power Grid in China. To ensure the same analytical con-
dition and more accurate results, some measures are
adopted during the test:� deleting unused files left in the
parallel processing directory after each run of scheme;`
restarting the computer before each parallel run so as to
make sure the memory used during the previous runs is
completely released; ´ exiting all other applications such
as antivirus software, and shutting down the operating
system updates, as these procedures consume a lot of
50 50
25 25 2525
12 13 1213
100
6 6 67
m4
m5Stop dividing
1
2
3
v
Scheme 1m/21 m/21
m/22 m/22 m/22 m/22
m/23 m/23 m/23 m/23
m/2vm/2v m/2v m/2v
m
: task scalem : divided timesv : threshold value
2 subtasks
4 subtasks
8 subtasks
16 subtasks
m3
m2
m1
mm 100, a 16,
Fig. 5 Schematic diagram of task division and threshold value control
684 Chuntian CHENG et al.
123

computer memory; andˆ each scheme is repeated ten times
and the average value of the results is taken.
3.1 Testing environment and evaluation indicators
3.1.1 Computer configurations
The proposed framework is implemented via the Java
programming language. The case studies are analysed on
two different systems. Table 2 has detailed information on
the attributes of the test computer systems.
3.1.2 Performance indicators
Two performance measures are defined for evaluating
the parallel computing performance, speedup Sp and effi-
ciency Ep, as follows:
Sp ¼ T1=Tp ð3Þ
Ep ¼ Sp=p ð4Þ
where T1 is the execution time for serial processing under a
single core environment; and Tp is the execution time in
parallel with p cores. Under normal circumstances, Sp is
smaller than ideal speedup p, but in practical parallel
computing, ‘‘super-linear speedup’’ often occurs, when, Spis greater than p.
3.2 Case 1: IEEE 39 bus reference power system
To evaluate the proposed framework’s accuracy, PFT
analysis of the IEEE 39 test system (shown in Fig. 6) is
firstly carried out with serial and parallel processing
respectively, and comparison with the PowerWorld Simu-
lator (PWS) software [29] is also made. PWS is an inter-
active power system simulation package, which contains a
highly effective power flow analysis package capable of
efficiently solving systems of up to 250000 buses, and is
widely used in many fields like economic dispatch [30],
optimal power flow [31], power market simulation [32],
and so on. Here, PFT scanning analysis with N-1 outages is
considered. The N-1 fault is performed for each branch in
turn, and in each case, the PFT results for other remaining
non-failed branches are analyzed.
Simulation results show that the parallel computation
results are consistent with the serial ones. Besides, the
results of proposed framework are also in agreement with
those of PWS. The average difference in the power transfer
result is 0.28%. This verifies the feasibility and accuracy of
the proposed parallelization framework. Taking PFT
results with N-1 outage of branch L2-25 as an example, the
results are shown in Table 3. Before the fault, the power
flow value is 237.7* MW. When the fault occurs, the
output of generator 37 is sent out exclusively through L25-26and no longer via L2-3. Thus the power flow in L25-26increases (from 76.7 to 314.3 MW) considerably, whilst
the power flow in L2-3 decreases (from 364.6 to
158.9 MW). To meet the load at bus 3, apart from a little
power flowing via L16-17 which only increases slightly,
Table 2 Configuration parameters of test computer systems
Test computer Configuration 1 Configuration 2
Dell Precision T1600 Mini Tower workstation IBM System x3750 M4 server
Processor Inter(R) Xeon(R) E31245 @ 3.30 GHz Inter(R) Xeon(R) E5-45620 @ 2.20 GHz
CPUs 1 4
Cores 1 9 4 4 9 8
Logical threads 1 9 8 (hyper-threading) 4 9 16 (hyper-threading)
RAM 8.0 G 64.0 G
Operation system type Windows 7 Ultimate (64-bit) Windows Server 2008 R2 Enterprise (64-bit)
G
30
39
1
2
25
37
29
17
26
9
3
38
16
5
4
18
27
28
3624
35
22
21
20
34
23
19
33
10
11
13
14
15
8 31
126
32
7
G G G G
G
GG
G G
F
Fig. 6 IEEE 39 bus reference power system topology structure
A modular parallelization framework for power flow transfer analysis of large-scale… 685
123

power flows in the main branches, i.e., L26-27, L17-27, L17-18,
L3-18, increase significantly (from 268.5 to 503.3, 13.5 to
219.0*, 192.4 to 364.4, and 34.2* to 205.6* MW respec-
tively), and branch L17-27 even has a reverse power flow
after the fault. Because the computational efficiency is not
obvious on this small test network, the parallel perfor-
mance will not be discussed further.
3.3 Case 2: Yunnan power grid power system
3.3.1 Application background
As one of the national hydropower bases, the Yunnan
Power Grid of China Southern Power Grid Co., Ltd. (CSG)
which is one of the two state-owned electricity enterprises,
has become the main sending end of the West-to-East
Electricity Transmission Project. It plays a significant role
in guaranteeing safe and stable operation of CSG. With
rapid economic growth, the mismatch between transmis-
sion capacity and load growth reduces lines’ transmission
margins, causing great risk of multiple serious faults in
transmission lines or adjacent equipment, requiring
numerous PFT analyses for each operation mode. The
actual monthly typical operation mode is used as a case
example. The network has 11052 buses and 12487 bran-
ches (including short branches which are used as switches),
so PFT analysis involves large amounts of data analysis.
3.3.2 Result analysis
The testing schemes and task scales are shown in
Table 4. They are tested on two different computing
configurations with different multi-core environments as
shown in Table 2. ‘‘Hyper-threading’’ technology is also
tested. Based on actual operating experience, scheme 1
defines the PFT analysis of key high-voltage branches and
cross sections. Schemes 2–5 are for PFT scanning analysis
of branches whose voltage are 220 kV and above, and the
number of branches being checked is 736 (including 580
transmission lines and 156 short connection branches).
Thus, the number of branches that need to be checked in
schemes 2–5 is 736 times the number of faults. The results
are shown in Figs. 7 and 8, and discussed below.
Figures 7a, d and 8a, d show the computation time of
configurations 1 and 2 respectively. When compared to
scheme 2, scheme 1 has the same number of faults and the
number of checked branches is less. However, the com-
putation time is longer. As described in Sect. 2.2.1 above,
the PFT analysis for one fault is treated as a work unit. For
an individual fault with the same scale of grid network, the
computation time is almost the same. Yet, since scheme 1
defines fault settings according to actual operating experi-
ence, the operation mode after the fault was really expe-
rienced which guarantees the reasonableness of the power
flow, thus requiring further analysis of PFT results. In
contrast, in scheme 2, the power flow results are unrea-
sonable for some of the fault settings explored, thus further
analysis of PFT results is not required in those cases. As
such, result analysis of scheme 1 becomes more time-
consuming than scheme 2. This shows that the computa-
tion time is mainly determined by the total number of
faults, but not the number of branches checked. Therefore,
increasing by an integer multiple the number of branches
checked does not lead to an abrupt increase in computation
Table 3 Main PFT results when N-1 fault occurs to L2-25
Branch Parallel/
serial
Proposed parallelization framework PowerWorld Simulator software Difference of transfer
(%)
Before fault
(MW)
After fault
(MW)
Transfer
(%)
Before fault
(MW)
After fault
(MW)
Transfer
(%)
L2-25 – 237.7* 0.0 – 238.8* 0.0 – –
L25-26 Serial 76.7 314.3 100.0 75.5 314.2 100.0 0.0
Parallel 76.7 314.3 100.0 – – – –
L26-27 Serial 268.5 503.3 98.8 266.7 502.3 98.7 0.1
Parallel 268.5 503.3 98.8 – – – –
L17-27 Serial 13.5 219.0* 86.5 15.5 217.6* 84.6 1.9
Parallel 13.5 219.0* 86.5 – – – –
L2-3 Serial 364.6 158.9 - 86.5 363.1 157.7 - 86.0 - 0.5
Parallel 364.6 158.9 - 86.5 – – – –
L17-18 Serial 192.4 364.4 72.4 191.7 364.3 72.3 0.1
Parallel 192.4 364.4 72.4 – – –
L3-18 Serial 34.2* 205.6* 72.1 33.4* 205.3* 72.0 0.1
Parallel 34.2* 205.6* 72.1 – – – –
Note: L2-25 represents the branch from bus 2 to 25, and the superscript ‘‘ * ’’ means the power flow direction is reversed, i.e. from bus 25 to 2
686 Chuntian CHENG et al.
123

time, which facilitates batch scanning analysis in large-
scale systems.
A comparison of parallel performance in the same
scheme can be made under different core environments.
Increasing the number of CPU cores will reduce compu-
tation time (Figs. 7a, d, 8a, d), increase speedup (Figs. 7b,
e, 8b, e), and lower efficiency (Figs. 7c, f, 8c, f). One
reason for the decline of efficiency is due to the increased
memory from repeating definitions of some variables for
thread management, communication and data synchro-
nization, as the number of cores increases. Another reason
is that the parallelization framework applies to a part of the
whole process, but other parts such as parameter
initialization, power flow calculation of the base state, and
display of results are run in serial.
Speedups with 2 cores (Fig. 7b) are 2.15, 2.16, 2.13,
2.17 and 2.15, respectively, and all exceed the ideal
speedup. This can be attributed to the ‘‘hyper-threading’’
technology and the ‘‘super-linear speedup’’ phenomenon.
The same result can be also seen in Fig. 8b. When making
comparisons with ‘‘hyper-threading’’ on and off, it is evi-
dent that the ‘‘hyper-threading’’ technology can provide a
higher speedup, as they share more logical threads.
In configuration 1, when the ‘‘hyper-threading’’ is on
(Fig. 7b, c), the speedups for 2 cores and 4 cores are
approximately 2.15 and 3.60, efficiencies are around
Fig. 7 Computation time, efficiency and speedup for schemes 1–5 with configuration 1
Table 4 Configurations of different testing schemes
Scheme Fault type Test scale Remarks
Number of faults Checking branches
1 N-2 100 752 Operating experience
2 N-2 100 73600 Scanning analysis
3 N-2 200 147200 Scanning analysis
4 N-2 400 294400 Scanning analysis
5 N-2 600 441600 Scanning analysis
A modular parallelization framework for power flow transfer analysis of large-scale… 687
123

107.0% and 92.0%, and when ‘‘hyper-threading’’ is off
(Fig. 7e, f), they are 1.80%, 3.13%, 90.0% and 78.0%
respectively. Both speedup and efficiency are relatively
stable. Even when the computation scale increases signif-
icantly they do not appear to vary much. After repeated
tests, it is found that speedup and efficiency are primarily
determined by inherent characteristics of the PSD-BPA
software. Under different faults, the same operation mode
has the same scale of grid network, and calling the
‘‘pfnt.exe’’ interface takes the same time. Further analysis
of the time taken by each stage of the calculation process
indicated that calling the interface accounts for a large
proportion of the time while other modules take little time.
Therefore, the total computation time for each fault differs
only slightly. The average computation times for a single
fault in schemes 1–5 are 4.67 s, 4.22 s, 4.25 s, 4.21 s and
4.19 s, respectively. Note that the time for scheme 1 is a
little longer than for other schemes. Because this time is an
average value, different numbers of unreasonable power
flow results in each scheme also influence this difference as
explained above.
In configuration 2, as the number of CPU cores
increases, the efficiency drops dramatically (Fig. 8c, f) and
the gap between observed and ideal speedup grows
(Fig. 8b, e), quite especially with 16 and 32 cores. This is
mostly due to hard disk limitations. For example, if there
are 32 CPU cores and ‘‘hyper-threading’’ is on, at least
64 9 5 files (including 1 parameter input file, 2 result
output files and 2 calculation temporary file) are simulta-
neously read and written to the hard disk. For the large
scale of a real network such as the Yunnan Power Grid, the
parameter input file is approximately 2 MB and the result
output file is 10 MB. Therefore, different computer con-
figurations have an important impact on the parallel per-
formance, and the use of a high-speed disk (such as Solid
State Drive, SSD) should improve the parallel
performance.
In actual operation, to further improve working effi-
ciency, the settings of analysis condition can be saved for
reuse in different operation modes. For some branches or
cross sections that cannot be recognized due to changes in
the network, corresponding hints about settings will be
given during computation. They can be quickly reused after
slight modification.
4 Conclusion
In the future, ultra high voltage (UHV) AC/DC power
transmission, high penetration of renewables, and elec-
tricity market reforms will exacerbate uncertainty to
operational risk management of power systems. The need
for scanning analysis with different faults will impose great
computational burden of simulations.
The proposed framework in this paper is devoted to a
fast and accurate PFT analysis for large-scale power
Fig. 8 Computation time, efficiency and speedup for schemes 1–5 with configuration 2
688 Chuntian CHENG et al.
123

systems. A parallelization analysis of modular software is
developed for practical engineering. Successful application
to the Yunnan Power Grid demonstrates its feasibility,
efficiency and potential for widespread usage. Its charac-
teristics include:
1) High accuracy: the proposed framework is based on a
current mature commercial power flow calculation
tool (i.e. the PSD-BPA software). Throughout the
computation process, there is no need for model
simplification and grid network equivalence. So, the
framework can ensure the accuracy and reliability of
computation results.
2) Flexible portability: the focus of our research was not
on exploring the highest possible speed and efficiency,
but rather adaptation to different task scales and
computer configurations. This ensures flexible porta-
bility of the parallelization framework to different
computers, thus taking full advantage of multi-core
resources and attaining good performance.
3) Strong scalability: being implemented in a modular
way, the proposed framework is very easy and
efficient to extend to additional purposes. By adding
new power grid equipment parameters into operational
modes, it can automatically perform fast and accurate
PFT analysis as long as the input files are in the correct
format. The type of fault, such as N-1, N-2, N-x, N-1-1
and so on, can be set flexibly according to different
requirements.
4) Remarkable efficiency: through the parallelization of
PSD-BPA software and integrated modules, the pro-
posed framework attains very high efficiency. User
efficiency has also significantly improved compared to
the old manual work mode, especially for global
scanning analysis over many contingencies. This can
effectively meet requirements for fast PFT analysis in
an operational setting, furnishing technical support for
preventive control analysis.
The performance of the parallelized software was found
to be limited by calling the interface to the PSD-BPA
power flow calculator, and by reading and writing data files
to the hard disk. Therefore it is likely that further increases
in speed could be achieved by reconfiguring these interface
and input/output mechanisms.
Acknowledgements This work was supported by the Major Inter-
national Joint Research Project from the National Nature Science
Foundation of China (No. 51210014) and Major Program of National
Natural Science Foundation of China (No. 91547201).
Open Access This article is distributed under the terms of the
Creative Commons Attribution 4.0 International License (http://
creativecommons.org/licenses/by/4.0/), which permits unrestricted
use, distribution, and reproduction in any medium, provided you give
appropriate credit to the original author(s) and the source, provide a
link to the Creative Commons license, and indicate if changes were
made.
References
[1] Xue Y, Xiao S (2013) Generalized congestion of power sys-
tems: insights from the massive blackouts in India. J Mod Power
Syst Clean Energy 1(2):91–100
[2] Fang Y (2014) Reflections on stability technology for reducing
risk of system collapse due to cascading outages. J Mod Power
Syst Clean Energy 2(3):264–271
[3] Gan D, Hu J, Han Z (2004) After the 2003 blackouts across
several continentals. Autom Electr Power Syst 28(3):1–4
[4] Li C, Sun Y, Chen X (2007) Analysis of the blackout in Europe
on November 4, 2006. In: Proceedings of 2007 international
power engineering conference, Singapore, December 2007, 6 pp
[5] Atputharajah A, Saha T (2009) Power system blackouts—lit-
erature review. In: Proceedings of the fourth international con-
ference on industrial and information systems (ICIIS2009), Sri
Lanka, 28–31 December 2009, pp 460–465
[6] Tang Y, Yan J, Li C et al (2013) China’s valuable experiences
in defending large-scale and long-time blackouts. In: Proceed-
ings of power and energy engineering conference (APPEEC),
HK, China, 1–5 December 2013, 5 pp
[7] Ren H, Dobson I, Carreras BA (2008) Long-term effect of the
n-1 criterion on cascading line outages in an evolving power
transmission grid. IEEE Trans Power Syst 23(3):1217–1225
[8] Ma J, Ma W, Yang Qiu et al (2015) Load transfer strategy based
on power transfer capability for main-transformer fault. Int
Trans Electr Energ Syst 25:3439–3448
[9] Li X, Yu X (2012) A generalized power transfer distribution
factor for power injection analysis of power grids. In: Pro-
ceedings of the 38th annual conference on IEEE industrial
electronics society, Montreal, Canada, 25–28 October 2012,
pp 4724–4728
[10] Yan CY, Zhou XX, Kang JD et al (2010) Flow transferring
sensitivity and security index analysis. Proc CSEE 30(19):7–13
[11] Cheng LY, Zhang BH, Hao ZG et al (2010) Fast search of
power flow transfers based on minimal basic circuit set. Autom
Electr Power Syst 34(18):21–26
[12] Xu HM, Bi TS, Huang SF et al (2006) WAMS based flow
transfer identification algorithm. Autom Electr Power Syst
30(14):14–19
[13] Ejebe GC, Waight JG, Sanots-Nieto M et al (2000) Fast cal-
culation of linear available transfer capability. IEEE Trans
Power Syst 15(3):1112–1116
[14] Salim NA, Othman MM, Serwan MS et al (2014) Determination
of available transfer capability with implication of cascading
collapse uncertainty. IET Gener Transm Distrib 8(4):705–715
[15] Tang Y, Bu G, Ying Y et al (2012) User manual of PSD-BPA
power flow program. China Electric Power Reaserch Institute,
Beijing
[16] Tang Y, Bu G, Ying Y et al (2012) User manual of PSD-BPA
transient stability program. China Electric Power Reaserch
Institute, Beijing
[17] Li G, Li G (2005) The summary of power system simulation
software. J Electr Electron Eng Educ 27(3):61–65
[18] Silva E, Finardi E (2003) Parallel processing applied to the
planning of hydrothermal systems. IEEE Trans Parallel Distrib
Syst 14(8):721–729
[19] Wang J, Jagtap D, Abu-Ghazaleh N et al (2014) Parallel discrete
event simulation for multi-core systems: analysis and opti-
mization. IEEE Trans Parallel Distrib Syst 25(6):1574–1584
A modular parallelization framework for power flow transfer analysis of large-scale… 689
123
[20] Yang X, Liu C, Wang J (2013) Large-scale branch contingency
analysis through master/slave parallel computing. J Mod Power
Syst Clean Energy 1(2):159–166
[21] Kuo TC, Smith S, Smith GC et al (2016) A predictive product
attribute driven eco-design process using depth-first search.
J Clean Prod 112:3201–3210
[22] Her J, Ramakrishna R (2007) An external-memory depth-first
search algorithm for general grid graphs. Theor Comput Sci
374(1):170–180
[23] Guide on security and stability analysis for China Southern
Power Grid Co., Ltd. (CSG) (2009) Q/CSG 11004-2009
[24] Technical code for voltage and reactive power in power systems
(1989) SD 325-1989
[25] Lea D (2000) A Java fork/join framework. In: Proceedings of
the ACM 2000 conference on Java Grande, San Francisco,
USA, 36–43 June 2000, pp 36–43
[26] Cheng C, Wang S, Chau KW et al (2014) Parallel discrete
differential dynamic programming for multireservoir operation.
Environ Model Softw 57:152–164
[27] Mateos C, Zunino A, Campo M (2010) An approach for non-
intrusively adding malleable fork/join parallelism into ordinary
JavaBean compliant applications. Comput Lang Syst Struct
36(3):288–315
[28] JDK 7 (2017) http://openjdk.java.net/projects/jdk7/features.
Accessed 28 July 2017
[29] PowerWorld Simulator overview (2015) http://www.powerworld.
com/products/simulator/overview. Accessed 12 Aug 2015
[30] Krishnamurthy S, Tzoneva R (2013) Economic dispatch solu-
tion using different algorithms and softwares. In: Proceedings of
international conference on green computing, communication
and conservation of energy (ICGCE), Tamil Nadu, India, 12–14
December 2013, pp 700–705
[31] Zhang D, Li S, Zeng P et al (2014) Optimal microgrid control and
power-flow study with different bidding policies by using pow-
erworld simulator. IEEE Trans Sustain Energy 5(1):282–292
[32] Srinivasan D, Woo D (2008) Evolving cooperative bidding
strategies in a power market. Appl Intell 29(2):162–173
Chuntian CHENG received his B.Sc., M.Sc., and Ph.D. degrees
from Dalian University of Technology, China, in 1986, 1989, and
1994, respectively. Currently, he is a professor in Dalian University of
Technology. His research interests include power system optimiza-
tion, complex system optimization, and optimal operation of large-
scale hydropower systems.
Bin LUO received his B.Sc. and Ph.D. degree from Dalian University
of Technology, China, in 2010 and 2017, respectively. He is currently
working in Tsinghua Sichuan Energy Internet Research Institute. His
research interest is operation mode optimization and coordination,
power system risk assessment and control.
Jianjian SHEN received his Ph.D. degree from Dalian University of
Technology, China, in 2011. He is an assistant professor in Dalian
University of Technology. His interests include hydropower system
operations, hydrothermal coordination, and decision support system
development.
Shengli LIAO received his B.Sc. and Ph.D. degree in water resources
management from Dalian University of Technology, China, in 2002
and 2009, respectively. Currently, he is an assistant professor in
Dalian University of Technology. His research interests are in the
areas of power system optimization and hydrological modelling.
690 Chuntian CHENG et al.
123