A Model of China™s State Capitalism - USITC · A Model of China™s State Capitalism Xi Li,...
36
A Model of Chinas State Capitalism Xi Li, Xuewen Liu, Yong Wang HKUST January 2013 Li, Liu, Wang (HKUST) Chinas State Capitalism January 2013 1 / 36
Transcript of A Model of China™s State Capitalism - USITC · A Model of China™s State Capitalism Xi Li,...
A Model of China�s State Capitalism
Xi Li, Xuewen Liu, Yong Wang
HKUST
January 2013
Li, Liu, Wang (HKUST) China�s State Capitalism January 2013 1 / 36
State Capitalism!
State capitalism as alternative growth model
3Li, Liu, Wang (HKUST) China�s State Capitalism January 2013 2 / 36
State Capitalism Again!
US Congress blame SOE subsidies to POEsfor China CA surplus
4
Li, Liu, Wang (HKUST) China�s State Capitalism January 2013 3 / 36
Further SOE Reforms Needed
Li, Liu, Wang (HKUST) China�s State Capitalism January 2013 4 / 36
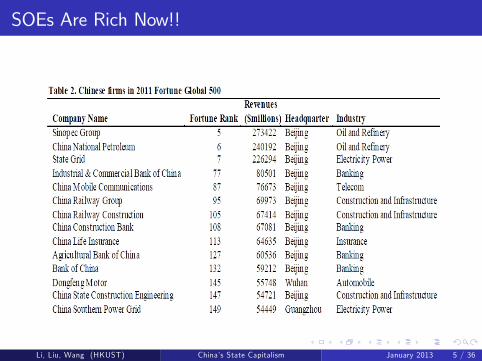
SOEs Are Rich Now!!
Li, Liu, Wang (HKUST) China�s State Capitalism January 2013 5 / 36
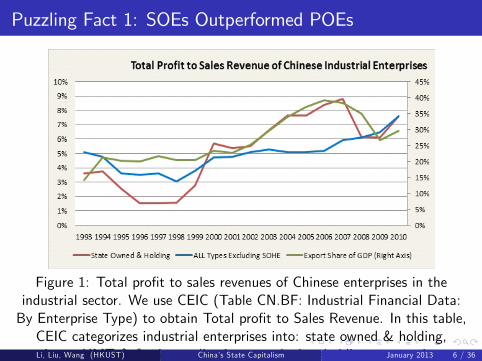
Puzzling Fact 1: SOEs Outperformed POEs
Figure 1: Total pro�t to sales revenues of Chinese enterprises in theindustrial sector. We use CEIC (Table CN.BF: Industrial Financial Data:By Enterprise Type) to obtain Total pro�t to Sales Revenue. In this table,CEIC categorizes industrial enterprises into: state owned & holding,private, HMT & foreign, collective owned, shareholding corporations,foreign funded, and Hong Kong, Macau & Taiwan funded. We divide allthe industrial enterprises into state owned & holding and the rest. Theright axis shows the ratio of export to GDP, also obtained from CEIC.
Li, Liu, Wang (HKUST) China�s State Capitalism January 2013 6 / 36
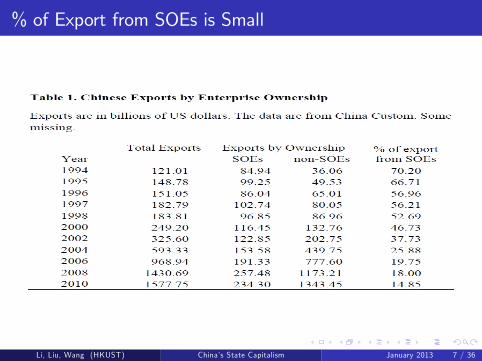
% of Export from SOEs is Small
Li, Liu, Wang (HKUST) China�s State Capitalism January 2013 7 / 36

Puzzling Fact 1: SOEs Outperformed Non-SOEs
Figure 2a: Average Pro�t per Industrial Enterprise (by Di¤erent OwnershipStructure): 1998-2010
Li, Liu, Wang (HKUST) China�s State Capitalism January 2013 8 / 36
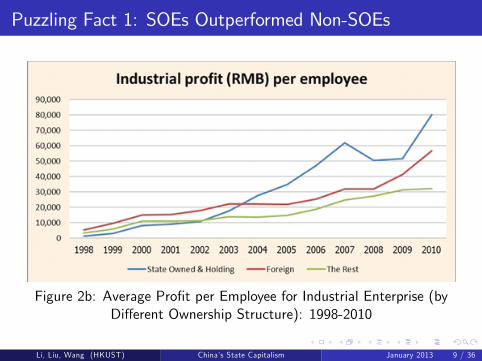
Puzzling Fact 1: SOEs Outperformed Non-SOEs
Figure 2b: Average Pro�t per Employee for Industrial Enterprise (byDi¤erent Ownership Structure): 1998-2010
Li, Liu, Wang (HKUST) China�s State Capitalism January 2013 9 / 36
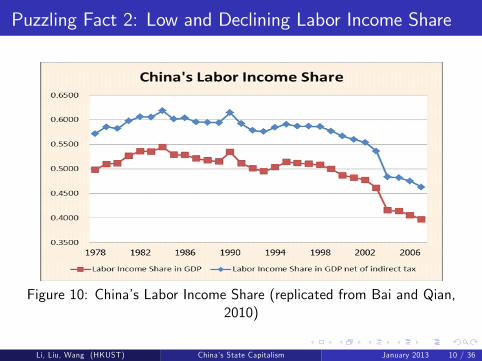
Puzzling Fact 2: Low and Declining Labor Income Share
Figure 10: China�s Labor Income Share (replicated from Bai and Qian,2010)
Li, Liu, Wang (HKUST) China�s State Capitalism January 2013 10 / 36
Puzzling Facts about Fast-Growing China Economy
SOEs have outperformed the private �rms in the past decade whilethe opposite was true in the 1990s, although the GDP growth rateswere stably high during the whole period. The recent experienceseems contradictory to the common notion that fast growth isincompatible with persistly servere resource misallocation acrossheterogeneous �rms (see Song, Storesletten, Zilibotti (2011); Hsiehand Klenow (2009)).
The labor income share in total GDP is persistently declining in thepast two decades, contradicting the Kaldor facts of neoclassicalgrowth model and the predictions of HO trade model.
Li, Liu, Wang (HKUST) China�s State Capitalism January 2013 11 / 36
Key Characteristics of China�s State Capitalism
Vertical Structure: SOEs monopolize key upstream industries whilethe downstream industries are largely open for private competition
Dual Labor Market and Structural Change: a huge labor supplyin the process of industrialization
Trade Liberalization: entering WTO in 2001, export-promotedstrategies
Li, Liu, Wang (HKUST) China�s State Capitalism January 2013 12 / 36
Key Mechanisms
Key Story: Upstream SOEs extract monopoly rents from expandingdownstream private sectors in the process of industrialization andglobalization
Declining Labor Income Share, wage is sustained at a constantlylow level during industrialization while GDP increases, especially aftertrade liberalization.
Without Vertical Structure, SOEs would be victims, rather thanbene�ciary, of trade liberalization and expansion of non-SOEs.
Without Openness, SOEs in the downstream industries could notexit so fast; Demand for downstream goods and services would besmall, hence the pro�ts of upstream SOEs would be small.
Without Labor Abundance, wage will increase fast as exportincreases, which limits the room for the monopoly pricing charged bythe upstream SOEs.
Li, Liu, Wang (HKUST) China�s State Capitalism January 2013 13 / 36
Related Literature
Structural Change and Economic Growth: Kongsmut, Rebelo, andXie (2001), Ngai and Pissaridies (2007), Acemoglu and Guerrieri(2008), Matsuyama (2008, 2009); Buera and Kaboski (2011), Yi andZhang (2011), Herrendorf, Rogerson and Valentinyi (2011);Restuccia, Yang, and Zhu (2008), Brandt, Hsieh and Zhu (2010).Economic Transitions and Institutional Reforms: Roland (2000),Lau, Qian, and Roland (2000), Murphy, Shleifer and Vishny (1992),Young (2000), Bruno (1972), Bai, Du, Tao and Sarah (2004)Declining Labor Income Share, Trade, and Dual Labor Market:Harrison (2002), Jaumotte and Tytell (2007), Karabarbounis andNeiman (2012); Ventura (1997), Acemoglu (2008), Feenstra (2004),Burnstein and Vogel (2011); Lewis (1954), Dooley, Folkerts-Landau,and Garber (2007), and Vollrath (2009)SOE Reforms and Resource Misallocation: Groves, Hong,McMillan, and Naughton (1994), Qian (1996), Li (1997), Lin, Cai andLi (1998); Hsieh and Klenow (2009), Song, Storetten, and Zilibotti(2011), Dollar and Wei (2007), Brandt, Tombe and Zhu (2010)
Li, Liu, Wang (HKUST) China�s State Capitalism January 2013 14 / 36
Road Map
Documenting the vertical structure (downstream capitalism andupstream SOE monopoly)
A Model of State Capitalism: Autarky, Trade (present)
Sustainability of this State Capitalism (future)
Emergence of State Capitalism (past)
General Implications for Other Countries
Li, Liu, Wang (HKUST) China�s State Capitalism January 2013 15 / 36
Facts about Vertical Structure [1]
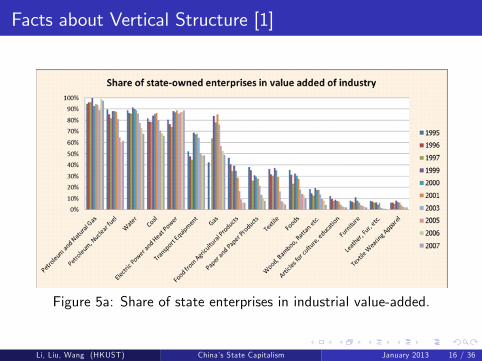
Figure 5a: Share of state enterprises in industrial value-added.
Li, Liu, Wang (HKUST) China�s State Capitalism January 2013 16 / 36
Facts about Vertical Structure [2]
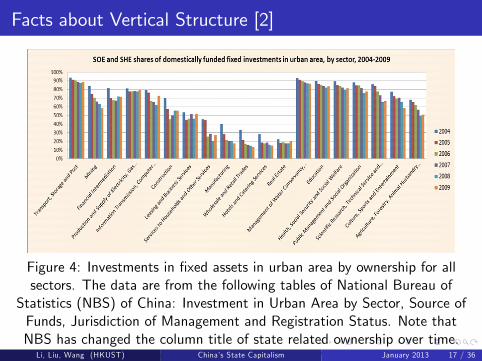
Figure 4: Investments in �xed assets in urban area by ownership for allsectors. The data are from the following tables of National Bureau of
Statistics (NBS) of China: Investment in Urban Area by Sector, Source ofFunds, Jurisdiction of Management and Registration Status. Note thatNBS has changed the column title of state related ownership over time.
NBS uses �state-owned and state-controlled� in Table 6-14 of2004;�state-owned and state-holding� in Table 6-14 of 2005;
�state-holding� in Table 6-14 of 2006; and �state-holding� in Table 5-14of 2007-2009. Before Year 2004, data for the state enterprises is not
available.
Li, Liu, Wang (HKUST) China�s State Capitalism January 2013 17 / 36
Model
Li, Liu, Wang (HKUST) China�s State Capitalism January 2013 18 / 36
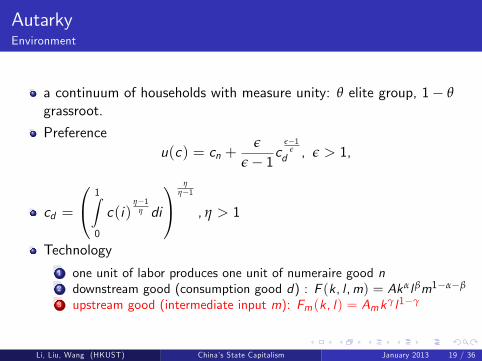
AutarkyEnvironment
a continuum of households with measure unity: θ elite group, 1� θgrassroot.
Preferenceu(c) = cn +
ε
ε� 1cε�1
εd , ε > 1,
cd =
0@ 1Z0
c(i)η�1
η di
1Aη
η�1
, η > 1
Technology1 one unit of labor produces one unit of numeraire good n2 downstream good (consumption good d) : F (k, l ,m) = Akαlβm1�α�β
3 upstream good (intermediate input m): Fm(k, l) = Amkγl1�γ
Li, Liu, Wang (HKUST) China�s State Capitalism January 2013 19 / 36
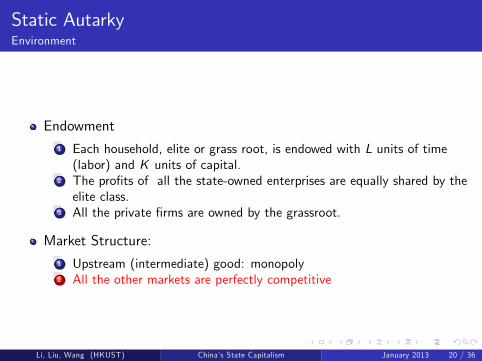
Static AutarkyEnvironment
Endowment1 Each household, elite or grass root, is endowed with L units of time(labor) and K units of capital.
2 The pro�ts of all the state-owned enterprises are equally shared by theelite class.
3 All the private �rms are owned by the grassroot.
Market Structure:1 Upstream (intermediate) good: monopoly2 All the other markets are perfectly competitive
Li, Liu, Wang (HKUST) China�s State Capitalism January 2013 20 / 36
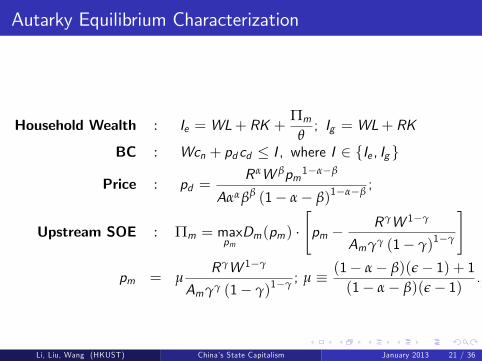
Autarky Equilibrium Characterization
Household Wealth : Ie = WL+ RK +Πm
θ; Ig = WL+ RK
BC : Wcn + pd cd � I , where I 2 fIe , Ig g
Price : pd =RαW βpm1�α�β
Aααββ (1� α� β)1�α�β;
Upstream SOE : Πm = maxpmDm(pm) �
"pm �
RγW 1�γ
Amγγ (1� γ)1�γ
#
pm = µRγW 1�γ
Amγγ (1� γ)1�γ ; µ � (1� α� β)(ε� 1) + 1(1� α� β)(ε� 1) .
Li, Liu, Wang (HKUST) China�s State Capitalism January 2013 21 / 36
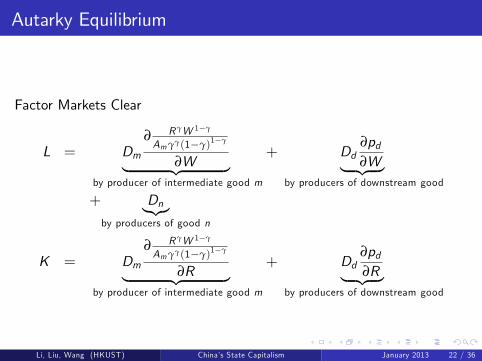
Autarky Equilibrium
Factor Markets Clear
L = Dm∂ RγW 1�γ
Amγγ(1�γ)1�γ
∂W| {z }by producer of intermediate good m
+ Dd∂pd∂W| {z }
by producers of downstream good
+ Dn|{z}by producers of good n
K = Dm∂ RγW 1�γ
Amγγ(1�γ)1�γ
∂R| {z }by producer of intermediate good m
+ Dd∂pd∂R| {z }
by producers of downstream good
Li, Liu, Wang (HKUST) China�s State Capitalism January 2013 22 / 36
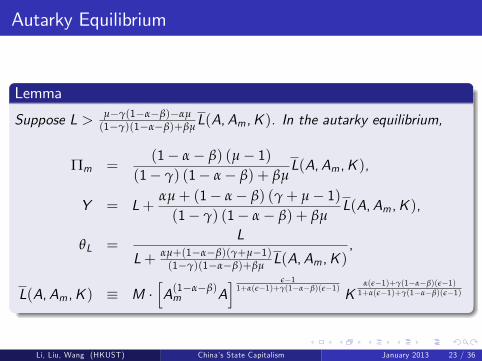
Autarky Equilibrium
Lemma
Suppose L > µ�γ(1�α�β)�αµ(1�γ)(1�α�β)+βµ
L(A,Am ,K ). In the autarky equilibrium,
Πm =(1� α� β) (µ� 1)
(1� γ) (1� α� β) + βµL(A,Am ,K ),
Y = L+αµ+ (1� α� β) (γ+ µ� 1)(1� γ) (1� α� β) + βµ
L(A,Am ,K ),
θL =L
L+ αµ+(1�α�β)(γ+µ�1)(1�γ)(1�α�β)+βµ
L(A,Am ,K ),
L(A,Am ,K ) � M �hA(1�α�β)m A
i ε�11+α(ε�1)+γ(1�α�β)(ε�1)
Kα(ε�1)+γ(1�α�β)(ε�1)1+α(ε�1)+γ(1�α�β)(ε�1)
Li, Liu, Wang (HKUST) China�s State Capitalism January 2013 23 / 36
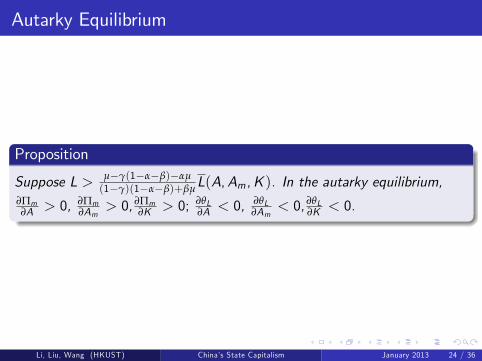
Autarky Equilibrium
Proposition
Suppose L > µ�γ(1�α�β)�αµ(1�γ)(1�α�β)+βµ
L(A,Am ,K ). In the autarky equilibrium,∂Πm∂A > 0, ∂Πm
∂Am> 0, ∂Πm
∂K > 0; ∂θL∂A < 0,
∂θL∂Am
< 0, ∂θL∂K < 0.
Li, Liu, Wang (HKUST) China�s State Capitalism January 2013 24 / 36
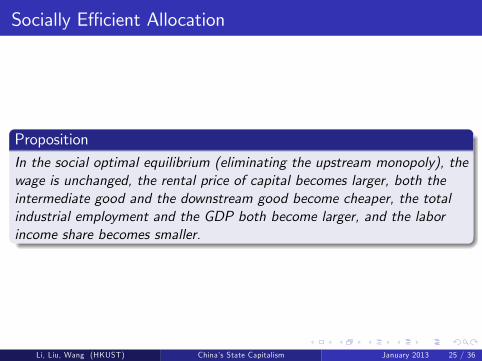
Socially E¢ cient Allocation
PropositionIn the social optimal equilibrium (eliminating the upstream monopoly), thewage is unchanged, the rental price of capital becomes larger, both theintermediate good and the downstream good become cheaper, the totalindustrial employment and the GDP both become larger, and the laborincome share becomes smaller.
Li, Liu, Wang (HKUST) China�s State Capitalism January 2013 25 / 36
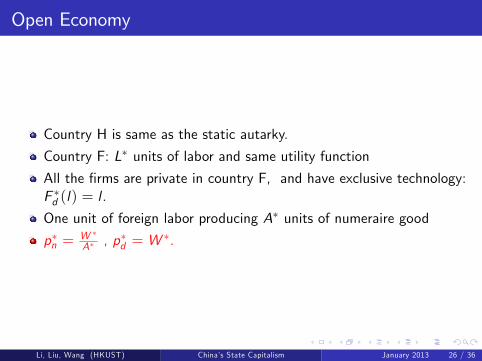
Open Economy
Country H is same as the static autarky.
Country F: L� units of labor and same utility function
All the �rms are private in country F, and have exclusive technology:F �d (l) = l .
One unit of foreign labor producing A� units of numeraire good
p�n =W �A� , p
�d = W
�.
Li, Liu, Wang (HKUST) China�s State Capitalism January 2013 26 / 36
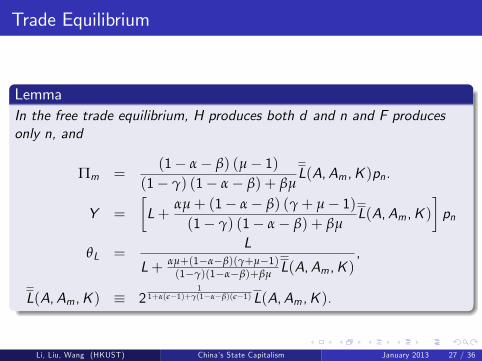
Trade Equilibrium
LemmaIn the free trade equilibrium, H produces both d and n and F producesonly n, and
Πm =(1� α� β) (µ� 1)
(1� γ) (1� α� β) + βµL(A,Am ,K )pn.
Y =
�L+
αµ+ (1� α� β) (γ+ µ� 1)(1� γ) (1� α� β) + βµ
L(A,Am ,K )�pn
θL =L
L+ αµ+(1�α�β)(γ+µ�1)(1�γ)(1�α�β)+βµ
L(A,Am ,K ),
L(A,Am ,K ) � 21
1+α(ε�1)+γ(1�α�β)(ε�1)L(A,Am ,K ).
Li, Liu, Wang (HKUST) China�s State Capitalism January 2013 27 / 36
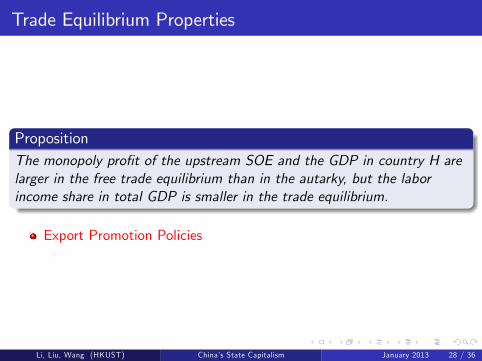
Trade Equilibrium Properties
PropositionThe monopoly pro�t of the upstream SOE and the GDP in country H arelarger in the free trade equilibrium than in the autarky, but the laborincome share in total GDP is smaller in the trade equilibrium.
Export Promotion Policies
Li, Liu, Wang (HKUST) China�s State Capitalism January 2013 28 / 36
Sustainability
Li, Liu, Wang (HKUST) China�s State Capitalism January 2013 29 / 36
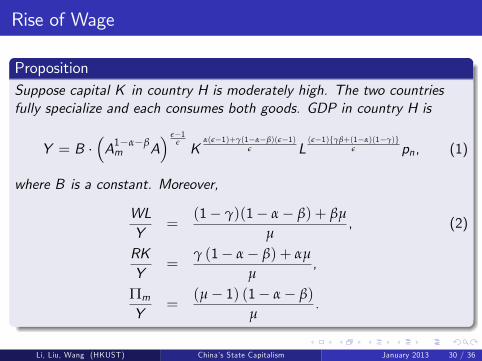
Rise of Wage
PropositionSuppose capital K in country H is moderately high. The two countriesfully specialize and each consumes both goods. GDP in country H is
Y = B ��A1�α�βm A
� ε�1εK
α(ε�1)+γ(1�α�β)(ε�1)ε L
(ε�1)fγβ+(1�α)(1�γ)gε pn, (1)
where B is a constant. Moreover,
WLY
=(1� γ)(1� α� β) + βµ
µ, (2)
RKY
=γ (1� α� β) + αµ
µ,
Πm
Y=
(µ� 1) (1� α� β)
µ.
Li, Liu, Wang (HKUST) China�s State Capitalism January 2013 30 / 36
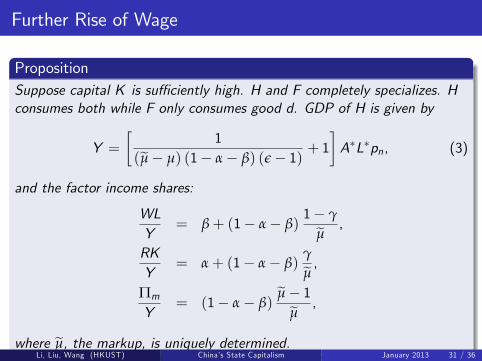
Further Rise of Wage
PropositionSuppose capital K is su¢ ciently high. H and F completely specializes. Hconsumes both while F only consumes good d. GDP of H is given by
Y =�
1(eµ� µ) (1� α� β) (ε� 1) + 1
�A�L�pn, (3)
and the factor income shares:
WLY
= β+ (1� α� β)1� γeµ ,
RKY
= α+ (1� α� β)γeµ ,
Πm
Y= (1� α� β)
eµ� 1eµ ,
where eµ, the markup, is uniquely determined.Li, Liu, Wang (HKUST) China�s State Capitalism January 2013 31 / 36
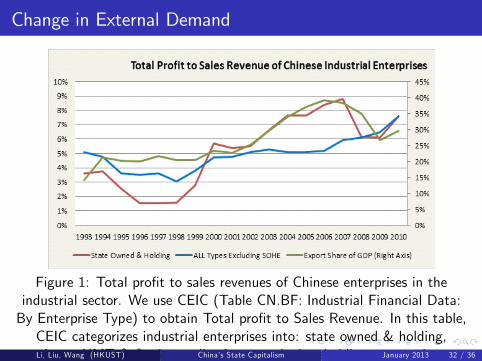
Change in External Demand
Figure 1: Total pro�t to sales revenues of Chinese enterprises in theindustrial sector. We use CEIC (Table CN.BF: Industrial Financial Data:By Enterprise Type) to obtain Total pro�t to Sales Revenue. In this table,CEIC categorizes industrial enterprises into: state owned & holding,private, HMT & foreign, collective owned, shareholding corporations,foreign funded, and Hong Kong, Macau & Taiwan funded. We divide allthe industrial enterprises into state owned & holding and the rest. Theright axis shows the ratio of export to GDP, also obtained from CEIC.
Li, Liu, Wang (HKUST) China�s State Capitalism January 2013 32 / 36

Emergence of China�s State Capitalism
φ : the fraction of downstream industries that are liberalized (φ = 0
at the beginning); cd =
0@ 1Z0
c(i)η�1
η di
1Aη
η�1
, η > 1
SOEs and non-SOEs are engaged in perfect competition in eachliberalized industry in the downstream.Each of the rest 1� φ fraction of the industries is monopolized byone state �rm.A = Ap if private, and A = As if state. As < Ap .
Key Result: When ApAsis su¢ ciently large, the total pro�t of
SOEs is maximized when φ = 1.To compete with private �rms in the liberalized industries, adownstream SOE needs a subsidy equal toR αW βpm1�α�β
ααββ(1�α�β)1�α�β
�1As� 1
Ap
�per unit of output.
Li, Liu, Wang (HKUST) China�s State Capitalism January 2013 33 / 36
More Discussions
Vertical Structure and Imperfect Competitions in Downstream
Income Distribution and Domestic Demand
Domestic Labor Market Integration ( ωL < L(A,Am ,K ))
Tax and Subsidies
Causes of Monopoly and Industrial Distribution of SOEs
Li, Liu, Wang (HKUST) China�s State Capitalism January 2013 34 / 36
Implications for Other Countries
Vietnam
India
Russia and other resouce-abundant countries
Li, Liu, Wang (HKUST) China�s State Capitalism January 2013 35 / 36
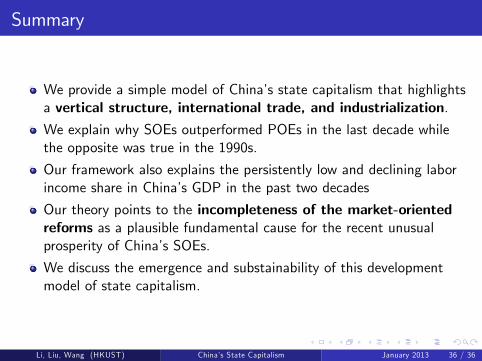
Summary
We provide a simple model of China�s state capitalism that highlightsa vertical structure, international trade, and industrialization.We explain why SOEs outperformed POEs in the last decade whilethe opposite was true in the 1990s.
Our framework also explains the persistently low and declining laborincome share in China�s GDP in the past two decades
Our theory points to the incompleteness of the market-orientedreforms as a plausible fundamental cause for the recent unusualprosperity of China�s SOEs.
We discuss the emergence and substainability of this developmentmodel of state capitalism.
Li, Liu, Wang (HKUST) China�s State Capitalism January 2013 36 / 36


![A Model of China's State Capitalism presentation · Li, Liu, Wang (HKUST) China™s State Capitalism June 2012 14 / 47. Facts about Vertical Structure [4] Li, Liu, Wang (HKUST) China™s](https://static.fdocuments.net/doc/165x107/5f2df8f0cf124a0b7127bbb9/a-model-of-chinas-state-capitalism-presentation-li-liu-wang-hkust-chinaas.jpg)