A model for patchy stomatal conductance in homobaric...
6
Journal of Computational Interdisciplinary Sciences (2009) 1(2): 83-88 © 2009 Pan-American Association of Computational Interdisciplinary Sciences ISSN 1983-8409 http://epacis.org A model for patchy stomatal conductance in homobaric leaves Marcus C. Ferraz 1 , Gustavo M. Souza 2 and Carmen P.C. Prado 1 Manuscript received on October 28, 2008 / accepted on January 20, 2009 ABSTRACT Many studies in the last years showed that, for a wide variety of plants, stomata apertures exhibits spatial temporal patterns in a phenomena known as patchy stomatal conductance. Many attempts were made to build numerical models to explain this complex behavior, but none were able to explain all of behaviors observed in nature. In this work we discuss some limitations of an hydraulic cellular automaton model proposed by Haefner, Buckley & Mott in 1997 (PC&E,20,1997). Besides considering a more realistic geometry, in which the areola are not hydraulically isolated, as in the original model, we show that small changes in the dynamics of individual stomata can lead to patchy behavior. Keywords: mathematical modeling, non-linear dynamics, patchy stomatal conductance, plant gas exchange, hysteresis. Correspondence to: Carmen P.C. Prado 1 Instituto de F´ ısica, Universidade de S˜ ao Paulo, Caixa Postal 66318, 05315-970 S˜ ao Paulo, SP, Brazil. 2 Universidade do Oeste Paulista, Laborat ´ orio de Ecofisiologia Vegetal, Rod. Raposo Tavares km 572, 19067-175 Presidente Prudente, SP, Brazil. E-mails: [email protected] and [email protected]
Transcript of A model for patchy stomatal conductance in homobaric...

“main” — 2009/6/8 — 19:33 — page 83 — #1
Journal of Computational Interdisciplinary Sciences (2009) 1(2): 83-88© 2009 Pan-American Association of Computational Interdisciplinary SciencesISSN 1983-8409http://epacis.org
A model for patchy stomatal conductance in homobaric leaves
Marcus C. Ferraz1, Gustavo M. Souza2 and Carmen P.C. Prado1
Manuscript received on October 28, 2008 / accepted on January 20, 2009
ABSTRACT
Many studies in the last years showed that, for a wide variety of plants, stomata apertures exhibits spatial temporal patterns in aphenomena known as patchy stomatal conductance. Many attempts were made to build numerical models to explain this complexbehavior, but none were able to explain all of behaviors observed in nature. In this work we discuss some limitations of an hydrauliccellular automaton model proposed by Haefner, Buckley & Mott in 1997 (PC&E,20,1997). Besides considering a more realisticgeometry, in which the areola are not hydraulically isolated, as in the original model, we show that small changes in the dynamics ofindividual stomata can lead to patchy behavior.
Keywords: mathematical modeling, non-linear dynamics, patchy stomatal conductance, plant gas exchange, hysteresis.
Correspondence to: Carmen P.C. Prado1Instituto de Fısica, Universidade de Sao Paulo, Caixa Postal 66318, 05315-970 Sao Paulo, SP, Brazil.2Universidade do Oeste Paulista, Laboratorio de Ecofisiologia Vegetal, Rod. Raposo Tavares km 572, 19067-175 Presidente Prudente, SP, Brazil.
E-mails: [email protected] and [email protected]

“main” — 2009/6/8 — 19:33 — page 84 — #2
84 A MODEL FOR PATCHY STOMATAL CONDUCTANCE IN HOMOBARIC LEAVES
1 INTRODUCTION
Stomata play an important role in the physiology of plants. Theyperform a control task, allowing necessary carbon assimilationwhile preventing excessive water loss. Most of the water absorbedby a plant is lost through stomata and practically all CO2 enteringthe plant also passes through them. Plants can control and ad-just stomata apertures in order to adapt themselves to changes inenvironmental conditions.
Until some time ago, experiments on stomatal conductancecould measure only the average behavior of the leaf, and it wasassumed that individual stomata reacted independently one fromthe other to external stimuli, with a normal distribution of apertu-res [13, 16]. However, with the development of more precise expe-rimental techniques, as chlorophyll fluorescence, it was possibleto measure the behavior of stomata in smaller regions of the leaf,showing that this assumption was not correct. In a large numberof plants, under some circumstances like hydraulic stress, sto-mata displayed a rich dynamics with the appearance of complexspatio-temporal patterns, in a behavior known as patchy stomatalconductance [7, 8, 10, 14, 15]. The origin of this complex beha-vior is still an open question. One of the possible hypotheses isthat this patchy behavior is a signature of the complex mecha-nisms governing water transport in the mesophyll of the leaf.
In this paper we explore the possible role played by mecha-nisms of water transport in the mesophyll in the onset of patchi-ness, and examine some properties of the dynamics of individualstomata. Some attempts to explain patchiness by modeling hy-draulic interactions among stomata have already been considered[5, 7, 10]. In our opinion, however, these attempts were not ableto generate the wealth of behavior observed in nature, as claimed.We show that a more realistic, less restrictive geometry as wellas memory effects in the dynamics of each pore are enough togive rise to a very rich collective response. Our model is moreadequate to describe homobaric leaves, in which areolas are notisolated one from the other [11]. In the following sections we re-visit the pioneering work of [5], on which we based most of ourown work, presenting our criticism to their findings. Then, we pre-sent and discuss some modifications to their model, in particularto the geometry of the model and the dynamic behavior of eachpore. Finally, we summarize our findings in the conclusions.
2 THE HYDRAULIC HYPOTHESIS
Some models for single stoma dynamics, based on hydraulicconsiderations [4, 12], are able to predict different dynamic res-ponses, but contain a large number of parameters. That fact
limits their use in understanding the dominant mechanisms res-ponsible for the onset of patchiness. Also, these models are notadequate to describe any collective behavior (patchiness). Morerecently, [5] proposed a two-dimensional hydraulic model, takinginto account interactions between neighboring stomata, which aresupposed to be arranged in a very regular and restrictive geome-try. In their model the leaf is represented by a square grid; eachsite of this grid is a stomatal unit (SU), consisting of a pair of guardcells and the surrounding epidermal tissue. Interactions betweenguard cells and the epidermal tissue, as well as between each sto-matal unit and its neighbors, are taken into account. Each subsetof 4 × 4 SUs form an areola, and areolas are separated one fromanother by veins, that act as water reservoirs (see Fig. 1).
Stomatal Unit
Veins
An areola
(1,1) (1,2)
(2,2)
Figure 1 – Geometry of the model proposed by Haefner, Buckley and Mott in1997. An areola was made of 4 × 4 Stomatal Units and completely surroundedby veins, for which the water potential was kept constant.
The dynamics of this system is governed by a set of discreterules, which were inspired in differential equations associated withaccepted biological hypotheses. They also assumed a piecewiselinear, slow and continuous function to describe the relationshipbetween stomata apertures and the turgor pressure differencesbetween guard cells and the epidermis. Our work employs thesame equations, except for this last one.
Two independent variables are associated to each SU of thegrid: the water potential 9 of the whole SU and the osmotic pres-sure πg of guard cells. Due to close contact and experimentalevidences, there is no distinction between the water potentials ofguard cells and the surrounding epidermis, so they were conside-red the same. The osmotic pressure πe of epidermis is constant.The water potential 9 of a generic stomatal unit i evolves in timeaccording to
9 i (t + 1) = 9 i (t) + a[Fi (t) − Ei (t)
], (1)
where Fi =∑n
j=1(9j − 9 i ) is the flow to site i (the sum
is performed over all n = 8 neighbors). The evaporation rate
Journal of Computational Interdisciplinary Sciences, Vol. 1(2), 2009

“main” — 2009/6/8 — 19:33 — page 85 — #3
MARCUS C. FERRAZ, GUSTAVO M. SOUZA and CARMEN P.C. PRADO 85
Ei is proportional to the water vapor mole fraction deficit 1w
and to the stomata aperture Ai ,
Ei = q 1w Ai . (2)
The aperture Ai of the stomata depends on the difference inturgor pressures Pg and Pe of the guard cells and the surroun-ding epidermis (Pe,g = 9−πe,g , if πe,g < 9 , zero otherwise)
Ai =
{Pi
g − θ i Pie if Pi
g > θ i Pie
0 otherwise,(3)
θ i is the rate between mechanical coefficients of guard andepidemic cells, and can vary slightly for each SU. Ai grows li-nearly with Pg − Pe except for a threshold defined by θ i . Theconductance gi , that is usually measured in experiments, is pro-portional to the aperture Ai . The osmotic pressure π i
g of a guardcell in stomatal unit i evolves in time towards a maximum valueπ i,ss(t), at a rate proportional to the difference between thecurrent value of π i
g and π i,ss(t),
π ig(t + 1) = π i
g(t) + α(π i,ss(t) − π i
g(t)). (4)
The maximum value π i,ss changes with site and time,according to the epidermal turgor pressure Pe,
π i,ss(t) = πming +
Pie (t)
Pmaxe
(πmax
g − πming
), (5)
where Pmaxe , πmax
e and πmine are parameters of the model.
The water potential 9 of the veins was kept constant and equalto zero. Equations (1) to (5) are iterated to give the time evolu-tion of the system.
We carefully tried to reproduce the results of Haefner et al. [5].Except for the values of a and α, we simulated the above equati-ons with the same parameter values employed in their work. Wealso built a graphic interface, placing in each cell (SU) a black cir-cle with a diameter proportional to the aperture of the stomata. Thevisualization of the process confirmed some of the results presen-ted in this paper. We noticed also that there were no qualitativedifferences in assuming a triangular distribution for mechanicalcoefficients θ i (as employed in [5]), and an uniform distributionbetween a minimum and maximum values. For simplicity, then,we adopted the latter.
The first problem we found was related to the spatial geometryof the model. Because each SU interacts only with its first neigh-bors, and veins act as water reservoirs with a constant 9 , oneareola was hydraulically isolated from the other. So, the results
obtained for a leaf with, for instance, 100 × 100 SUs (25 × 25areolas), were exactly the same that would have been obtained bysimulating an areola 625 times and arranging them side by sidein a grid. So the conclusion presented in [5], that areolas synch-ronize if the initial conditions (and parameters) are the same, iseasy to be understood and quite obvious indeed. In larger are-olas no inner stomata opens, since there is never enough watercoming into them from the veins. So, it is sufficient to study whathappens with a single areola. For the sake of visualization, we willgive most of the examples for areolas made of 4 × 4 SUs.
Regarding the time evolution of this model, we observed twoimportant features.
1. The asymptotic behavior does not depend on initial con-ditions or on morphological details of each pore.
If one waits enough time for transients to die, each SU ofan areola converges exactly to the same steady state con-ductance value. Differences in the morphology and initialconditions of SUs do not change this behavior, as can beseen in Figure 2. The number (1,1),(1,2) and (2,2) showthe only three possible relative positions of the SU withrespect to veins (see Fig. 1).
In Figure 2 (a) we show the time evolution of conductancegi for all 16 SU of the areola when random values of θ i
are assigned to them, and in Figure 2 (b) time evolution ofconductance gi when θi is the same, but initial conditionsare not. One can see that the steady state behavior is notaffected neither by the choice of mechanical coefficientsnor by the initial conditions.
2. No sustained oscillations or patchiness are observed in thelimit of continuous time evolution. Indeed, the time evolu-tion of equation (1) was inspired in a differential equation,
d9
dt≈
19
1t= c
(Fi − Ei ),
that is,
9(t + 1) ≈ 9(t) + a(Fi − Ei ),
with a = c 1t. (6)
This approximation is reasonable for small values of 1tonly. The parameter a is the product of a constant c (finite,with biological meaning of hydraulic conductivity) and 1t ,which should be as small as possible. If a smaller value for1t is employed, the only change should be in the num-ber of time steps needed to simulate the same total time.
Journal of Computational Interdisciplinary Sciences, Vol. 1(2), 2009

“main” — 2009/6/8 — 19:33 — page 86 — #4
86 A MODEL FOR PATCHY STOMATAL CONDUCTANCE IN HOMOBARIC LEAVES
(a) Different mechanical coeficient. (b) Different initial conditions.
Figure 2 – Time evolution of individual conductance of all 16 SUs of an areola. (a) SUs have different mechanical coefficients; Bottom: SUs have same mechanicalcoefficients, but different initial conditions. a = 0.008, α = 0, 1 and 1w = 15, q = 1, −3, 0 ≤ πg ≤ −1, 5 and −2, 0 ≤ 9 ≤ 0 in t = 0.
This is equivalent to consider (except by a scaling factor)smaller and smaller values for a. On the other hand, if thevalue of 1t (or a) is not small enough, the system ap-parently will never reach an stationary state, moving backand forth around the steady state value, in a behavior thatcould have been taken by real oscillations1. This is exac-tly what we have observed in our simulations: the aper-ture of each SU adjusted itself to balance the water fed intothe system through the xylem (defined by its average dis-tance from veins) with the water lost in the pores throughevaporation. That is observed even if we consider a lessrestrictive geometry that circumvents the problem pointedout in the item above. So we think that maybe the oscil-lations reported by [5] were an artifact of discreteness oftime. The time evolution of 9(t) can not depend on thevalue of 1t (the same reasoning can be applied to equa-tion 4 and α).
3 A MODEL FOR HOMOBARIC LEAVES
In view of these results, we decided to consider another geome-try, in which the veins, or water sources, are randomly distri-buted over the leaf. The fraction v of sites in the grid definedas veins is a new parameter and can be related to the water up-take from the soil through the xylem to the leaf. The veins formnatural obstacles to the transport of water among neighboringSUs, but do not fully isolate them in areolas. Also, it seems morerealistic to assume the existence of sources of water throughout
the leaf, since the water available in the bulk of the leaf is also dueto movements of molecules on wet cell walls. We adopted peri-odic boundary conditions, which means that we are consideringa very large leaf, and looking at the dynamics in the bulk. In oursimulations we observed that stomatal apertures did form spatialpatches, but the aperture of each individual pore was still static:there were no moving patches or sustained oscillations. Figure 3shows the time evolution of some SUs with different numbers ofneighboring ‘veins’ in that case.
We then introduced modifications in the dynamics that con-trols opening and closing of stomata. We assumed that the ope-ning movement was divided into two distinct phases [3, 6], astress phase and a motor phase. According to these authors, du-ring the stress phase the guard cell pressure appears to increase,but pores remain closed. At a threshold pressure level, the po-res open slightly, commencing motor phase. Beyond this point,stomatal opening progresses rapidly. The stomata literally ‘pops’open once a sufficient guard cell osmotic pressure potential hasbeen achieved. This effect can be introduced if we replace equa-tion 3 by (see Fig. 4).
Ai =
1
2tanh[γ 1P − di ] if 1P > 0
and 1P(t) > 1P(t − 1) (opening)
1
2tanh[γ 1P − d0] if 1P > 0
and 1P(t) < 1P(t − 1) (closing)
0 if 1P ≤ 0
, (7)
1In eq. (2), if a is not small enough, 9(t + 1) will apparently ‘oscillate’ (back and forth) around the steady state value 9∞, since |a (Fi − Ei )| is larger than|9(t + 1) − 9∞| This movement, due only to limitations of the numerical approximation, disappears if a is small enough, and shall not be interpreted as realoscillations, that would not depend on the value of a. The same reasoning is applied to parameter α.
Journal of Computational Interdisciplinary Sciences, Vol. 1(2), 2009
“main” — 2009/6/8 — 19:33 — page 87 — #5
MARCUS C. FERRAZ, GUSTAVO M. SOUZA and CARMEN P.C. PRADO 87
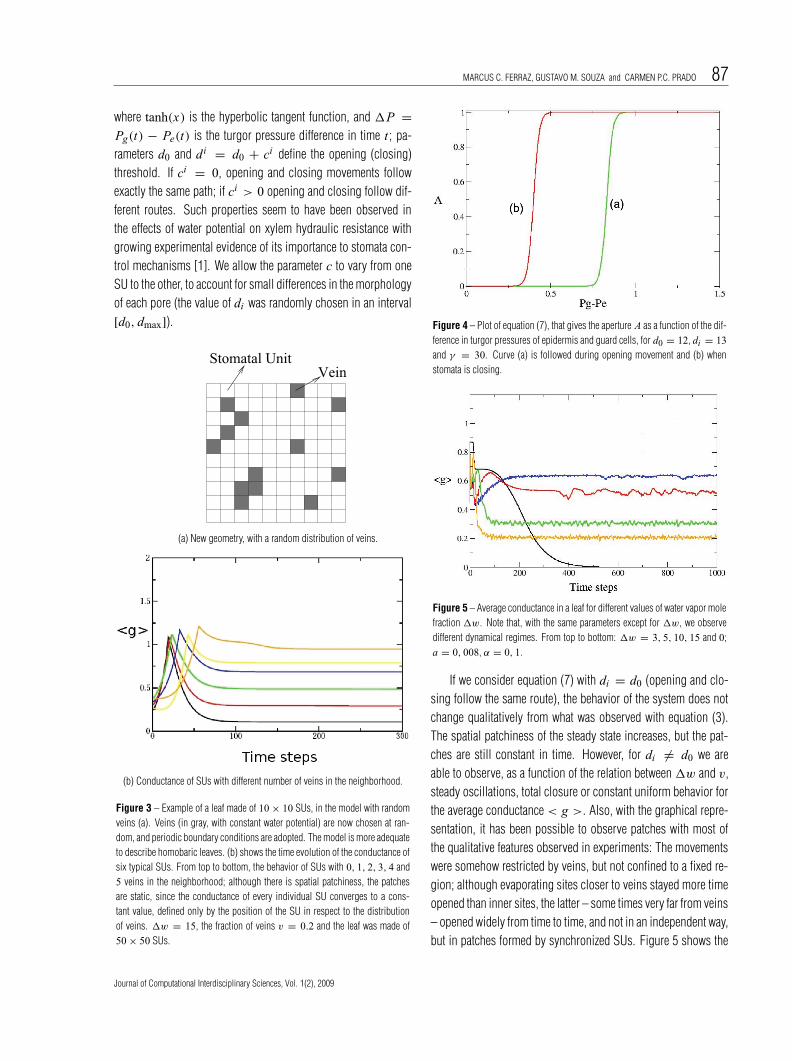
where tanh(x) is the hyperbolic tangent function, and 1P =Pg(t) − Pe(t) is the turgor pressure difference in time t ; pa-rameters d0 and di = d0 + ci define the opening (closing)threshold. If ci = 0, opening and closing movements followexactly the same path; if ci > 0 opening and closing follow dif-ferent routes. Such properties seem to have been observed inthe effects of water potential on xylem hydraulic resistance withgrowing experimental evidence of its importance to stomata con-trol mechanisms [1]. We allow the parameter c to vary from oneSU to the other, to account for small differences in the morphologyof each pore (the value of di was randomly chosen in an interval[d0, dmax]).
VeinStomatal Unit
(a) New geometry, with a random distribution of veins.
(b) Conductance of SUs with different number of veins in the neighborhood.
Figure 3 – Example of a leaf made of 10 × 10 SUs, in the model with randomveins (a). Veins (in gray, with constant water potential) are now chosen at ran-dom, and periodic boundary conditions are adopted. The model is more adequateto describe homobaric leaves. (b) shows the time evolution of the conductance ofsix typical SUs. From top to bottom, the behavior of SUs with 0, 1, 2, 3, 4 and5 veins in the neighborhood; although there is spatial patchiness, the patchesare static, since the conductance of every individual SU converges to a cons-tant value, defined only by the position of the SU in respect to the distributionof veins. 1w = 15, the fraction of veins v = 0.2 and the leaf was made of50 × 50 SUs.
Figure 4 – Plot of equation (7), that gives the aperture A as a function of the dif-ference in turgor pressures of epidermis and guard cells, for d0 = 12, di = 13and γ = 30. Curve (a) is followed during opening movement and (b) whenstomata is closing.
Figure 5 – Average conductance in a leaf for different values of water vapor molefraction 1w. Note that, with the same parameters except for 1w, we observedifferent dynamical regimes. From top to bottom: 1w = 3, 5, 10, 15 and 0;a = 0, 008, α = 0, 1.
If we consider equation (7) with di = d0 (opening and clo-sing follow the same route), the behavior of the system does notchange qualitatively from what was observed with equation (3).The spatial patchiness of the steady state increases, but the pat-ches are still constant in time. However, for di 6= d0 we areable to observe, as a function of the relation between 1w and v,steady oscillations, total closure or constant uniform behavior forthe average conductance < g >. Also, with the graphical repre-sentation, it has been possible to observe patches with most ofthe qualitative features observed in experiments: The movementswere somehow restricted by veins, but not confined to a fixed re-gion; although evaporating sites closer to veins stayed more timeopened than inner sites, the latter – some times very far from veins– opened widely from time to time, and not in an independent way,but in patches formed by synchronized SUs. Figure 5 shows the
Journal of Computational Interdisciplinary Sciences, Vol. 1(2), 2009

“main” — 2009/6/8 — 19:33 — page 88 — #6
88 A MODEL FOR PATCHY STOMATAL CONDUCTANCE IN HOMOBARIC LEAVES
average conductance < g > of the whole leaf, for different valuesof 1w (and fixed v). We observe that the same model produ-ces different dynamics, in different environmental conditions. Forsmall values of the water vapor deficit, the conductance of the leafconverges to a constant value, but for higher values it is possibleto observe oscillations.
4 CONCLUSION
In conclusion, we revisited a previous work [5], that presented amodel for patchy behavior based on mechanisms of water trans-port in the mesophyll of the leaf, pointing out important limitati-ons in it. Introducing two important modifications in the model,however, we showed that the mechanism of water transport fromthe xylem to the evaporating sites may still be sufficient to ex-plain stomatal patchiness. Stomatal patchiness is observed in awide variety of plants that, in general, display different behaviorunder different environmental or metabolic conditions. Our worksuggests that some kind of inertia, recent memory, or else, theexistence of some refractory period for the response of each in-dividual pore to metabolic conditions in the surrounding tissue,may be enough to explain why stomata dynamics displays such arich complex behavior. The hypothesis of hysteresis is very plau-sible and has been observed in other cell behaviors subjected tothreshold dynamics, like neurons. We hope to stimulate furtherwork to check the validity of this suggestion.
ACKNOWLEDGMENTS
The authors thank FAPESP (Fundacao de Amparo a Pesquisa doEstado de Sao Paulo) and CNPq (Conselho Nacional de Pesquisae Desenvolvimento Tecnologico) for financial support.
REFERENCES
[1] BUCKLEY TN. 2005. The control of stomata by water balance. New
Phytol., 168: 275–292.
[2] BUCKLEY TN, MOTT KA & FARQUHAR GD. 2003. A hydromechani-
cal and biochemical model of stomatal conductance. Plant Cell Environ.,
26: 1767–1785.
[3] COOKE JR, DEBAERDEMAEKER JG, RAND RH & MANG HA. 1976.
Finite-Element shell analysis of guard cell deformations. Transac. ASAE
19: 1107–1121.
[4] DELWICH MJ & COOKE JR. 1977. An analytic model of the hydraulic
aspects of stomatal dynamics. J. Theor. Biol., 69: 113–141.
[5] HAEFNER JW, BUCKLEY TN & MOTT KA. 1997. A spatially expli-
cit model of patchy stomatal responses to humidity. Plant Cell Environ.,
20: 1087–1097.
[6] MEIDNER H & EDWARDS M. 1975. Direct measurements of turgor
pressure potentials of guard cells. J. Exp. Bot., 26: 319–330.
[7] MOTT KA & BUCKLEY TN. 1998. Stomatal heterogeneity. J. Exp.
Bot., 49: 407–417.
[8] MOTT KA & BUCKLEY TN. 2000. Patchy stomatal conductance:
emergent collective behavior of stomata. Trends Plant Sci., 5: 258–262.
[9] MOTT KA & PEAK D. 2006. Stomatal patchiness and Task-performing
Networks. Ann. Bot. 1-8, Advance Access published on November 3,
2006; doi:10.1093/aob/mcl234.
[10] PEAK D, WEST JD, MESSINGER SM & MOTT KA. 2004. Evidence
for complex, collective dynamics and emergent, distributed computation
in plants. Proc. Nat. Acad. Sci. USA, 101: 918–922.
[11] PIERUSCHKA R, SCHURR U & JAHNKE S. 2005. Lateral gas
diffusion inside leaves, J. Exp. Bot. 56: 857–864.
[12] RAND RH & ELLENSON JL. 1989. Dynamics of stomata fields in
leaves. Planta, 177: 35–46.
[13] SAXE H. 1979. A structural and functional study of the co-ordinated
reactions of individual Commelina communis L. stomata. Amer. J. Bot.,
66: 1044–1052.
[14] SOUZA GM, OLIVEIRA RF & CARDOSO VJM. 2004. Temporal dyna-
mics of stomatal conductance of plants under water deficit: can homeos-
tasis be improved by more complex dynamics? Braz. Arch. Biol. Tech.,
47: 423–431.
[15] SOUZA GM, PINCUS SM & MONTEIRO JAF. 2005. The complexity-
stability hypothesis in plant gas exchange under water deficit. Braz. J.
Plant Physiol., 17: 363–373.
[16] SPENCE RD. 1987. The problem of variability in stomatal responses,
particularly aperture variance, to environmental and experimental condi-
tions. New Phytol., 107: 303–315.
Journal of Computational Interdisciplinary Sciences, Vol. 1(2), 2009