A Model-based Approach to the Forward and Inverse · PDF fileand asymmetrical bronchial tree...
17
Biocybernetics and Biomedical Engineering 2008, Volume 28, Number 1, pp. 41–57 * Correspondence to: Adam G. Polak, Chair of Electronic and Photonic Metrology, Wrocław Uni- versity of Technology, B. Prusa 53/55, 50-317 Wrocław, Poland, e-mail: [email protected] A Model-based Approach to the Forward and Inverse Problems in Spirometry ADAM G. POLAK* Chair of Electronic and Photonic Metrology, Wrocław University of Technology, Wrocław, Poland The respiratory system is one of the most essential systems sustaining human life. Its com- plexity raises, however, serious difficulties when one is trying to analyse the lung structure or function experimentally. An alternative approach consists in conducting research via mathematical modelling. This paper reviews the most essential model-based approaches to the so-called forward and inverse problems in spirometry, focusing on research the author has been involved in. A few selected results achieved with the aid of the mathematical models of the forced expiration illustrate the state of the art, and current challenging issues in modelling the respiratory system are depicted. K e y w o r d s: respiratory system, spirometry, forward model, inverse model 1. Introduction The respiratory system is one of the most complex and simultaneously most essential systems sustaining human life. Its complexity raises serious difficulties when one is trying to analyse the lung structure or function. Especially the connection between these two issues forms a very challenging area of current research [1]. Another important area is the improvement in existing and development in new diagnostic techniques for assessment of lung pathology, especially in case of such disorders as asthma and chronic obstructive pulmonary disease (COPD) [2]. The most common test of the lung function is spirometry including the forced expiration manoeuvre. It consists in as deep and strong as possible expiration preceded by maximum inhalation. It has been shown that the registered maximum expiratory flow-volume (MEFV) curve is highly reproducible, effort-independent and simulta- neously sensitive to respiratory disorders [3].
Transcript of A Model-based Approach to the Forward and Inverse · PDF fileand asymmetrical bronchial tree...

Biocybernetics and Biomedical Engineering2008, Volume 28, Number 1, pp. 41–57
* Correspondence to: Adam G. Polak, Chair of Electronic and Photonic Metrology, Wrocław Uni-versity of Technology, B. Prusa 53/55, 50-317 Wrocław, Poland, e-mail: [email protected]
A Model-based Approach to the Forwardand Inverse Problems in Spirometry
ADAM G. POLAK*
Chair of Electronic and Photonic Metrology, Wrocław University of Technology,Wrocław, Poland
The respiratory system is one of the most essential systems sustaining human life. Its com-plexity raises, however, serious difficulties when one is trying to analyse the lung structure or function experimentally. An alternative approach consists in conducting research via mathematical modelling. This paper reviews the most essential model-based approaches to the so-called forward and inverse problems in spirometry, focusing on research the author has been involved in. A few selected results achieved with the aid of the mathematical models of the forced expiration illustrate the state of the art, and current challenging issues in modelling the respiratory system are depicted.
K e y w o r d s: respiratory system, spirometry, forward model, inverse model
1. Introduction
The respiratory system is one of the most complex and simultaneously most essential systems sustaining human life. Its complexity raises serious difficulties when one is trying to analyse the lung structure or function. Especially the connection between these two issues forms a very challenging area of current research [1]. Another important area is the improvement in existing and development in new diagnostic techniques for assessment of lung pathology, especially in case of such disorders as asthma and chronic obstructive pulmonary disease (COPD) [2]. The most common test of the lung function is spirometry including the forced expiration manoeuvre. It consists in as deep and strong as possible expiration preceded by maximum inhalation. It has been shown that the registered maximum expiratory flow-volume (MEFV) curve is highly reproducible, effort-independent and simulta-neously sensitive to respiratory disorders [3].

42 A.G. Polak
For many reasons, as e.g. the respiratory system complexity, ethical issues or limitations of existing diagnostic techniques, the problems of deeper insight into the lung structure and function as well as development and testing of new diagnostic techniques cannot be addressed experimentally. A complementary approach consists in conducting research via mathematical modelling. Computer-implemented models enable a wide range of simulations mimicking natural lung behaviour, including pathological alternations. Finding answers to specific questions about the system under investigation using computer simulations is called the forward problem solv-ing. On the contrary, applying mathematical models to determine system parameters from the raw measurement data, as e.g. retrieving changes in airway mechanics from the MEFV curve, is named the inverse problem solving. This paper reviews the most essential model-based approaches to the forward and inverse problems in spirometry within the period of last fifty years. It is organized as follows. First, the most successful computational models with the symmetrical and asymmetrical bronchial tree structures are presented (Section 2.1). Then the ongoing study on the inverse problem solving in spirometry is summarised (Section 2.2). Section 3 depictures selected results achieved by the author with the aid of the mathematical models of respiratory system. Finally, in Section 4 general conclusions concerning profits of the forward and inverse models for the forced expiration as well as main directions of future investigations are drawn.
2. Models of the Forced Expiration
2.1. Forward Models
Fry was the first who tried to predict the MEFV curve from the mathematical model of respiratory system treated as a uniform elastic tube situated in a pleural pressure environment, and afterwards from the Weibel symmetrically branching model of bronchial tree [4, 5]. Although the predicted values of maximum flow at high lung volumes were reasonable, at lower volumes they were too high. Similar, simplified models focusing on local mechanisms of flow limitation were also proposed later [6, 7]. Dawson and Elliott [8] explained the mechanism limiting forced expiratory flow on the basis of local speed of wave propagation at the so called choke point in the intrathoracic airways, and Shapiro [9] showed additionally that flow limitation could occur in collapsible tubes by purely viscous dissipation. Elad and co-workers incorporated dynamic equations for flow in their model [10, 11], however they did this at the expense of reduction of the airway tree geometry to a “trumpet” tube with physical properties varying continuously, as first proposed by Fry, and allowing flow to exceed the critical wave-speed value. The predictions of the wave-speed theory were tested successfully by Hyatt et al. [12]. This theory and the phenomenological description of pressure losses were used by Lambert and associates [13] to create

43Forward and Inverse Problems in Spirometry
the mathematical model of maximum expiratory flow. The model predictions agreed with published values of maximum flow dependence on gas density and viscosity. The Lambert model for the forced expiration has been proven to be a valuable tool in the analysis of respiratory system for the last two decades. Its computational abili-ties have been enhanced [14] by applying a method of succeeding approximations when finding maximal airflows in the quasi-static conditions at the consecutive lung volumes in the whole range of vital capacity. Only a few approaches to modelling the maximum expiration from the het-erogeneous lung can be found in the literature. First trials were limited to only two different lung regions [15, 16, 17], and just recently a general computational model with a larger number of heterogeneous lung compartments was proposed [18, 19]. Simulations proved that the model captures the main phenomena observed in vivo during forced expiration, as effort-independence of flow, independence of flow from the properties of airways downstream to a choke point, characteristic differences of lung regional pressures and volumes, and a shape of their variability during exhalation.
2.1.1. Homogeneous Model
A complex, morphology-based homogeneous model has been discussed extensively elsewhere [13, 14]. Its bronchial tree structure, following the geometry proposed by Weibel [20], consists of 24 symmetrical generations (0–23), each possessing identical airways arranged in parallel. Mechanical properties of the airways are specified for each generation and computer implementation of the model allows their independent adjustment. First of all, they include parameters describing the dependence of the airway lumen area A [dm2] on transmural pressure Ptm [kPa], i.e. the tube law [13]:
A PA P P P
A P Ptm
m tmn
tm
m tmn
( ) =−( ) ≤
− −( ) −( )⎡⎣
⎤
−
−
α
α
0 1
0 2
1 0
1 1 1
1
2
, ,
⎦⎦ >
⎧⎨⎪
⎩⎪ , ,Ptm 0 (1)
where Am [dm2] is the maximal lumen area, α0 is the normalized area (i.e. A/Am) at zero transmural pressure, and n1 and n2 are shape-changing scalars. P1 [kPa] andP2 [kPa] are pressure asymptotes given by:
P n
P n
1 1 0 0
2 2 0 01
= ′
= −( ) ′
α α
α α
,
, (2)
where α'0 [kPa–1] denotes the slope of the α0 – Ptm curve (i.e. dα0/dPtm) at Ptm = 0 kPa. Additionally, intrapleural bronchi lengths alter with lung volume (VL [dm3])[5, 21]:

44 A.G. Polak
l V lV V
VLt L
t
( )..= +
+⎛
⎝⎜
⎞
⎠⎟1 5
13
1 5 (3)
where l1.5 [dm] is the length of an airway at lung volume VL of 1.5 dm3, and Vt [dm3] is lung tissue volume. Another model feature is the use of non-linear characteristics for the lung recoil [22]:
P V
V V
CV V
V V
C
V V
V V
Vst L
L
stL tr
m tr
st
m tr
m L
t
( )
,
ln
=
− ≤
− −−
⎛
⎝⎜
⎞
⎠⎟ +
0 ,
rr
stL tr
V
CV V
− >
⎧
⎨⎪⎪
⎩⎪⎪
0 , ,
(4)
where Pst [kPa] is static lung recoil pressure, Vm [dm3] and V0 [dm3] are maximal and minimal lung volumes, Vtr [dm3] is transition volume, and Cst [dm3 · kPa–1] is lung compliance at zero recoil pressure. During simulations, pressure drops along compliant airways are calculated solving numerically the differential formula for the pressure gradient (including both wave-speed flow limitation and viscous pressure losses) at every lung volume analysed [13, 23]:
dP
dx
f x
S x
f x
qA x
APtm
=− ( )− ( )
=− ( )
− ( )∂
∂⎛
⎝⎜
⎞
⎠⎟
11
2 2
3
ρ, (5)
where f [kPa · dm–1] is the elementary dissipative pressure loss [24], S = u/c is the local wave-speed index equal to the ratio between flow (u) and wave (c) speed, q [dm3 · s–1] is volume flow in the bronchus, and ∂A/∂Ptm [dm2 · kPa–1] is elementary compliance of the airway wall dependent on the transmural pressure Ptm. Since the bronchial tree is fully symmetrical, the calculated pressure drop is simultaneously the pressure loss along the analysed generation. Integration of pressure is interrupted at each junction between the airway generations for the evaluation of convective acceleration of gas according to the Bernoulli law. The calculated total pressure drop across the bronchial tree is then summarized with the pressure loss in the upper airways which depends on two scaling coefficients [14], and equated to the driving pressure produced by the lung elastic recoil and expiratory muscle. The driving pressure (Pd [kPa]) is the function of expiration time and lung volume [14]:
P t V P eV
d L mt L,( ) = −( ) −⎛
⎝⎜⎞⎠⎟
−1 τ RVVC
, (6)

45Forward and Inverse Problems in Spirometry
where Pm [kPa] is maximal expiratory pressure, t [s] stands for time of expiration, τ [s] is a time constant of expiratory muscle activation, RV [dm3] denotes residual volume, and VC [dm3] is vital capacity. The model includes above 150 parameters describing mechanical properties of the airways, lung tissues, and expiratory muscle.
2.1.2. Heterogeneous Model
A computational model including an asymmetric structure of the bronchial tree has been described recently [18, 19]. The airway structure follows the description by Horsfield, et al. [25] and is presented as a branching pattern of the distinct airway orders. Each order is characterized by its own mechanical properties, and the orders of two daughter airways are established through a set of order-specific recursion indexes. The bronchial tree includes over 6 million airways that may possess distinct features at any given time during expiration. Solving such a problem is computation-ally unrealistic. A reasonable simplification is achieved by replacing peripheral parts of the Horsfield tree with the symmetrical Weibel’s ones. Therefore, airway branching from the trachea (order 35) follows the Horsfield asymmetry down to a designated order in the bronchial tree (order 32 in Fig. 1). Then branches with airways of smaller orders are replaced with the symmetric structures. The dimension of each peripheral tree depends on the order of the mother airway. The peripheral trees lead to identical alveoli of the same properties (volume, pressure, recoil). Hence, all the alveoli subtended by a given branch are treated as a single alveolar compartment. Consequently, the lung is divided into a number of the alveolar regions allowed to empty non-uniformly with own compartmental flows. Each region is characterized by its own recoil characteristics producing individual driving pressure.
Fig. 1. Asymmetric structure of the bronchial tree: A — separate airways (numbers in parentheses denote Horsfield’s orders), S — symmetric peripheral trees (numbers in parentheses denote Horsfield’s orders
of “mother” airways), C — alveolar compartments, and q — airflows from the compartments [19]
46 A.G. Polak
Drops of pressure (∆P) along the distinct airways are computed by numerical integration of the equation for the pressure gradient in a flexible tube proposed by Lambert (Eq. 5). Considering flows through the airways and pressures at their con-nections (Fig. 1), one is able to write an equation for each pathway. The pressure losses ∆Pi [kPa] of the succeeding airways belonging to the given branch are added and equalled to a driving pressure Pdk [kPa] of the kth lung compartment. These losses of pressure are computed for the actual lung volume and airflow which is a sum of flows coming from the compartmental branches leading to the airway given. This approach yields the following system of non-linear equations:
∆
∆
∆
P q q q P
P q q q P
P q q q
i ki
d
j kj
d
l k
1 2 1
1 2 2
1 2
, , , ,
, , , ,
, , ,
…
…
…
( ) =
( ) =
∑∑
(( ) =∑l
dkP .
(7)
Solving it (the Raphson-Newton numerical method [26]) for the input data consisting of mechanical properties of the airways and lung tissue allows determination of k unknown compartmental flows (seven in Fig. 1) as well as node pressures for a given time and lung volume. A sum of peripheral flows qk [dm3 · s–1] gives the expiratory flow measured at the airway opening (i.e. the MEFV curve). Calculations are made at succeeding time instants and then compartmental volumes are calculated by integra-tion of flows, taking into account individual compartment recoil pressures [19]:
P V
N N V V
C
N
NV V
V V
C
st k Ck
alv ak Ck
st
alv
akCk tr
m tr
st
, ( )
, ,
=
⋅ − ≤
−
0
⋅⋅ −− ⋅
⎛
⎝⎜
⎞
⎠⎟ + − >ln
V V
V N N V
V V
C
N
NV Vm tr
m alv ak Ck
tr
st
alv
akCk
0 , ttr ,
⎧
⎨⎪⎪
⎩⎪⎪
(8)
where Pst,k [kPa] is recoil pressure in the kth compartment, VCk [dm3] is the volume of the compartment, Nalv is the total number of alveoli, and Nak is the number of alveoli in the given compartment. During calculations related to a given time instant (or lung volume) flow is treated as quasi-steady.
2.2. Inverse Model
The observed connection between the respiratory state and the shape of the MEFV curve encourages to elaborate a method for calculation of lung parameters using the flow-volume data. Solving this inverse problem requires application of a mathematical model that couples the respiratory mechanical properties with the MEFV curve. Such

47Forward and Inverse Problems in Spirometry
a model should include all parameters influencing the measured data significantly [27, 28]. The described above forward models are too complex for the estimation of the respiratory system parameters. The early study by Lambert [29] exposed these difficulties and finally he failed in solving the problem. Recently, Lambert and co-workers were somewhat successful predicting individual flow-volume curves with the use of their model [30, 31]. It has been proved, however, that the set of parameters determining maximal expiratory flow is much bigger than the maximal airway areas adjusted in those studies.
2.2.1. Reduction of the Symmetric Model
Proposed by Weibel equations [20] expressing the relationship between airway dimen-sions and the generation number follow the fact that the properties of neighbouring airways are interrelated. The huge number of airway parameters can be reduced by use of scaling functions capturing changes in distribution of the airway mechanical properties along the bronchial tree [28, 32]. Such changes may result from possible pathology or intersubject variability. The following rescaling, dependent on the generation number g, has been proposed [32] (the baseline values of the airway parameters are denoted as θ* and the rescaled ones as θ):
A gp g p
A gma a
m( ) =+ +( ) ( )2
1 1 2exp* , (9)
α α01 2
0
1 0 33 2 4
1g
g
p g pg
z z
( ) =+ −( )+ +( ) ( )exp . .
exp* , (10)
′ ( ) =+ +( )
′ ( )α α01 2
21
gp g p
gc c
mexp* , (11)
n g p g p n gn n1 11 12 1( ) = +( ) ⋅ ( )* , (12)
n g p g p n gn n2 21 22 2( ) = +( ) ( )* , (13)
where pa1, pa2, pz1, pz2, pc1, pc2, pn11, pn12, pn21, pn22 are the dimensionless scaling pa-rameters. The airway lengths at lung volume VL of 1.5 dm3 (l1.5) are related to the known patient’s height (H [cm]) [32], assuming that the baseline data derive from a man of 176 cm:
l gH
l g1 5 1 5176. .*( ) = ( ) . (14)
This approach allowed reducing the model for the forced expiration to 25 free parameters [32].

48 A.G. Polak
2.2.2. Selection of Identifiable Parameters
It is common that only a few of the parameters of the complex model affect its output considerably. In such instance the set of the “most influential” parameters can be selected for estimation, and typical values ascribed to the others [33]. The advantage of this approach is that the computational scheme of the complex model can be still used during the inverse problem solving instead of elaboration of a simplified one. Selection can be done on the ground of the sensitivity analysis. The parameters, however, may differ in the magnitude by several orders, so it may be also the case of the sensitivity vectors. Usually it is better to use the normalized sensitivity,
X X X XN = ⋅ ( )( )−diag diag ,T
1 2 (15)
where X = ∂ym / ∂θ is sensitivity of the model output ym to the parameters θ, to observe the connection of the individual parameters with specific fractions of the output data [34], or the relative estimate sensitivity to measurement data:
X Ry
R X X Xd = ∂∂
= ( )− − −1 1 1θθ^ T T , (16)
where y denotes the vector of the measured data (i.e. the forced expiratory flow) to select the most influential and simultaneously less-correlated parameters (R is a di-agonal matrix with the vector of parameter ranges r on its diagonal) [33, 35]. Finally, the vector of l 2 norms of the sensitivity vectors (a scalar measure of the individual parameter importance) is used to choose the parameters for estimation. The decrease of the free parameter number increases the systematic error and reduces the random one [33]. An optimal number of the estimated parameters that keeps a balance be-tween these two components is searched. It has been shown that using the above procedures 16 parameters describing intrapleural airway mechanics and the lung static recoil influence the descending part of the MEFV curve. This range of data has been chosen for model identifica-tion [33]. Nine from the selected parameters has been the most influential and less correlated and the inverse model assumes the estimation only of their values [35]. The maximal systematic errors may reach 30–40% of the ranges in some instances, nonetheless, tracking the relative parameter adjustment during disease development should be more accurate.
2.2.3. Regularisation of Estimation
When a model structure is poorly identifiable, the parameter estimation may be numerically ill-conditioned. One of general approaches to resolve the problem is to regularize estimation by introducing a penalty term.

49Forward and Inverse Problems in Spirometry
The gradient methods of estimation search a parameter vector θθ^ minimizing a certain criterion function V. Adding the penalty term Ω modifies the criterion func-tion as follows:
V V kR θθ θθ θθ( ) = ( ) + ( )Ω , (17)
where k is a scalar coefficient of the regularization. One of the most popular regu-larizing techniques in model identification is the ridge regression [36]. It tries to keep the parameter estimates in the neighbourhood of the “working point” θ* of the identified system:
V kRR mθθ θθ θθ θθ( ) = − ( ) + −12
2 12
2y y * . (18)
In case of the non-linear estimation it yields the Levenberg-Marquardt step used during iterative calculations [37]:
θθ θθ θθ θθ θθ^ ^ ^ ^ ^i i i i i i ik+
−
= − ⎛⎝⎜
⎞⎠⎟
⎛⎝⎜
⎞⎠⎟
+⎡⎣⎢
⎤⎦⎥
⎛⎝⎜
⎞⎠⎟
−1
1
µ X X I X yT T yym iθθ^⎛⎝⎜
⎞⎠⎟
⎛⎝⎜
⎞⎠⎟ , (19)
where i denotes the iteration number, I is the identity matrix, and µ determines the step size. In the Tikhonov regularization the penalty term imposes smoothness on the estimates [38] — a very useful feature in case of estimating mechanical parameters distributed along the airway generations:
VTP mθθ θθ θθ( ) = − ( ) +12
2 12
2y y Dγ , (20)
where γ is a regularization coefficient. Usually, matrix D is a discrete derivative operator of the nth order. In case of the first derivative it has the following form:
D =
−−
−
⎡
⎣
⎢⎢⎢⎢⎢⎢
⎤
⎦
⎥⎥⎥⎥⎥⎥
1 1 0 0 0
0 1 1 0 0
0 0 0 1 1
0 0 0 0 0
. (21)
To apply the Tikhonov regularization during non-linear estimation one has to take the following step:

50 A.G. Polak
θθ θθ θθ θθ θθ^ ^ ^ ^ ^i i i i i+
−
= + ⎛⎝⎜
⎞⎠⎟
⎛⎝⎜
⎞⎠⎟
+⎡⎣⎢
⎤⎦⎥
⎛⎝⎜
⎞⎠⎟
−1
1
µ γX X D D X yT T T yy D Dm i iθθ θθ^ ^⎛⎝⎜
⎞⎠⎟
⎛⎝⎜
⎞⎠⎟ −
⎡
⎣⎢
⎤
⎦⎥γ T . (22)
Another possibility to regularize estimation of the airway parameters is the use of parametric functions describing a given parameter distribution along the bronchial tree. This approach reduces the number of the free parameters as well as correlations between them. Two Gaussian-like functions for rescaling α0 and α0' [39] with four own parameters in total have been chosen, assuming that constriction or dilation of the airways is concentrated in approximately such a manner in several neighbouring generations [40]. The first parameter indicates the central generation with biggest dilation, the second one corresponds to the width of constriction/dilation across the generations and the two others to the magnitude of changes of α0 and α0'. Figure 2 demonstrates capabilities of the functions to capture different scenarios of airway mechanics modifications.
Fig. 2. Exemplary shapes of the Gaussian-like function used for the airway properties rescaling after constriction or dilation, demonstrating its capabilities
Despite benefits following the former steps including reduction of the model and selection of the parameters for estimation, some of the sensitivity vectors are still highly correlated in their local linear approximations. Thus, the Gaussian-like func-tions and the ridge regression have been used recently to retrieve changes in airway mechanics from the MEFV curve evolution after administration of bronchodilator [40]. Currently, the use of the Tikhonov regularization in estimation of the airway mechanical parameters is being analysed.

51Forward and Inverse Problems in Spirometry
3. Selected Results
3.1. Mimicking Main Physiological Phenomena
It has been shown that both the symmetrical and asymmetrical models for the forced expiration are able to mimic the main experimentally documented physiological phenomena. The best known of them is flow independence from patient’s effort, as well as from external resistance, over most of vital capacity. In the first case alterna-tion of expiratory muscle force was simulated by simultaneous decreasing maximal pressure Pm and increasing time constant τ. In the second one, adding the external resistance Rext at the airway outlet was simulated with the remaining settings of the model being unchanged [14]. Results of such simulations are shown in Fig. 3. Another important feature of the lung is its inhomogeneous emptying following both the asymmetrical structure of the bronchial tree and the heterogeneous nature of most of respiratory disorders. It was demonstrated that the heterogeneous model for
Fig. 3. (A) simulated influence of patient’s effort on the MEFV curve, (B) simulated influence of externalresistance on the MEFV curve [14]
Fig. 4. Non-uniform emptying of alveolar compartments: (A) alveolar pressures, (B) compartment volumes(normalized to their initial values) [19]

52 A.G. Polak
the forced expiration reproduces variability in compartment pressures and volumes (Fig. 4) known from experimental studies [19]. Small differences between pressure trajectories result from the history of emptying of the individual regions (Fig. 4A). However, greater variety among the behaviour of compartment volumes is apparent (Fig. 4B). Some compartments empty faster at the beginning to slow down during the last period of expiration, whereas others behave in an opposite way.
3.2. Analysis of the Flow Limitation Pattern
The multi-compartmental model with the asymmetrical structure of the bronchial tree is well suited to investigate the mechanisms of heterogeneous flow limitation. It has been used to track positions of the flow limiting sites (the so-called choke points), and to investigate their arrangement and movement during forced expira-tion [41]. A typical pattern of the flow limitation is presented in Fig. 5A. It shows the change of the flow limitation index S in the pathway leading from the trachea to the alveolar compartment C1 (see Fig. 1). This pathway includes the following airways: A1 (1st position), A2, A3, A4 and the 22 successive airway generations in the segment S1. Wave-speed limitation appears in the airway A4 (4th position) after about 0.1 s of expiration and then the choke point moves upstream to the airway inside segment S1 at about 1 second of expiration (in both locations S is close to 1). Finally, the wave-speed flow limitation vanishes after 1.5 s which corresponds to about 94% of VC. Comparing the maximal values of the flow limitation indexes achieved inside each of the seven pathways seen Fig. 1, it is evident that flow limitation begins at the similar time in every branch of the bronchial tree, forming a parallel pattern of the choke points (Fig. 5B). In the first phase, the maximal values are approximately equal to 1, and, depending on a branch, between 1.2 and 1.5 s they drop to values within the range of 0.6 – 0.7 [41].
Fig. 5. (A) Index of wave-speed flow limitation S (value given by the greyscale) in airways belonging to the pathway leading to the alveolar compartment C1; (B) Maximal values of the flow limitation indexes
in the seven pathways shown in Fig. 1 [41]
53Forward and Inverse Problems in Spirometry
3.3. Simulation of Lung Function Evolution after Heart-lung Transplantation
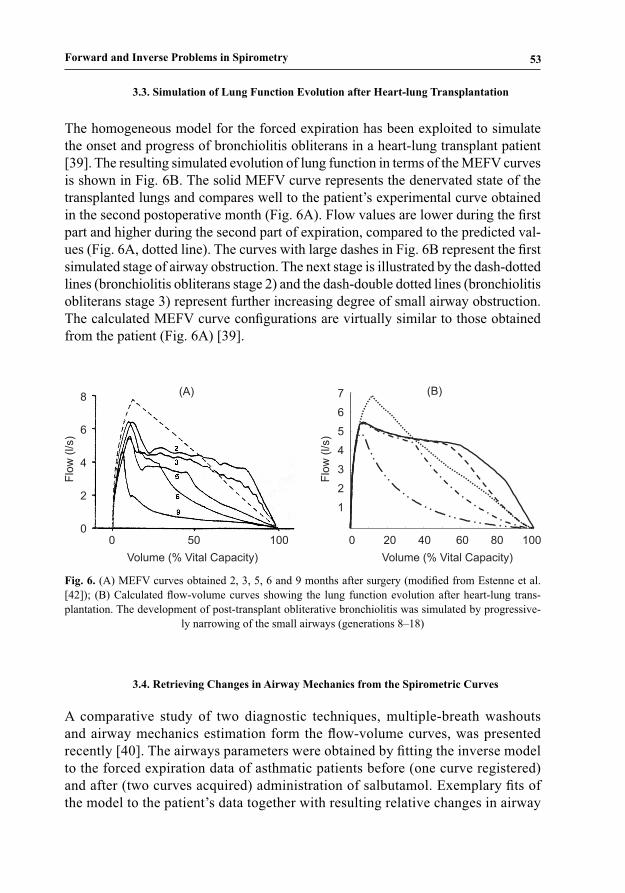
The homogeneous model for the forced expiration has been exploited to simulate the onset and progress of bronchiolitis obliterans in a heart-lung transplant patient [39]. The resulting simulated evolution of lung function in terms of the MEFV curves is shown in Fig. 6B. The solid MEFV curve represents the denervated state of the transplanted lungs and compares well to the patient’s experimental curve obtained in the second postoperative month (Fig. 6A). Flow values are lower during the first part and higher during the second part of expiration, compared to the predicted val-ues (Fig. 6A, dotted line). The curves with large dashes in Fig. 6B represent the first simulated stage of airway obstruction. The next stage is illustrated by the dash-dotted lines (bronchiolitis obliterans stage 2) and the dash-double dotted lines (bronchiolitis obliterans stage 3) represent further increasing degree of small airway obstruction. The calculated MEFV curve configurations are virtually similar to those obtained from the patient (Fig. 6A) [39].
Fig. 6. (A) MEFV curves obtained 2, 3, 5, 6 and 9 months after surgery (modified from Estenne et al. [42]); (B) Calculated flow-volume curves showing the lung function evolution after heart-lung trans-plantation. The development of post-transplant obliterative bronchiolitis was simulated by progressive-
ly narrowing of the small airways (generations 8–18)
3.4. Retrieving Changes in Airway Mechanics from the Spirometric Curves
A comparative study of two diagnostic techniques, multiple-breath washouts and airway mechanics estimation form the flow-volume curves, was presented recently [40]. The airways parameters were obtained by fitting the inverse model to the forced expiration data of asthmatic patients before (one curve registered) and after (two curves acquired) administration of salbutamol. Exemplary fits of the model to the patient’s data together with resulting relative changes in airway

54 A.G. Polak
resistance and compliance are shown in Fig. 7. Administration of salbutamol de-creased resistance and increased compliance of the airways, particularly around generation 11 [40]. Comparison between averaged parameters characterising each of the airway generations from 13 postdilated asthmatic and control normal subjects is shown in Fig. 8. Postdilated resistances of the central airways of asthmatic group are signifi-cantly larger and compliances smaller than control ones (P < 0.01). First and most distal properties were undistinguishable (P > 0.05) [40].
Fig. 7. (A) Model fits (black lines) to the asthmatic patient’s flow-volume curves; (B) Airway resistancesand compliances after administration of salbutamol related to pre-salbutamol values
Fig. 8. Comparison of resistances (A) and compliances (B) of airway generations (mean ± SD) of post--salbutamol asthmatic patients (dashed line) with normal subjects (solid line)
4. Conclusions
The history of the forced expiratory modelling encompasses nearly 50 years. The mathematical models designed to predict the flow-volume curve underwent systematic development stimulated by new empirical results. The main points of the progress

55Forward and Inverse Problems in Spirometry
were recognition of wave-speed as the main mechanism responsible for flow limitation and integrating it into the model, and the use of the morphology-based descriptions of the bronchial tree. These attempts resulted in a correct prediction of flow by the models using morphological data on the airway and the lung tissue mechanics. It seems that the recently proposed forward models, especially the heterogeneous one, capture all the main phenomena that are observed during experiments. It should be emphasised that the computational models for the forced expiration, particularly this of Lambert’s, have appeared to be a very valuable tool when investigating respiratory pathophysiology for the last two decades. Research on the inverse model for the forced expiration, enabling quantitative assess-ment of respiratory parameters from the registered flow-volume curve, has encountered more obstacles and is not still finished. Resent investigations including model reduction, selection of its identifiable parameters and the use of regularisation techniques set a hope that the inverse problem can be solved in the nearest future, at least to a certain extent. The approach with the Tikhonov regularisation of estimation, granting in simultaneous adjustment of parameters of the individual airways and in reduction of too big differ-ences between neighbouring generations, seems to be particularly promising. Such an inverse model would be an important tool improving diagnosis based on spirometry performed during provocation and bronchodilation tests. There are still new challenging issues in modelling the forced expiration. Re-cently it has been shown how to derive a realistic, morphology and anatomy based three-dimensional model of the lung [43]. Further, it is possible to personalise such a model of a given subject using medical imaging techniques as magnetic resonance (MRI) or computed tomography (CT) [44]. It should be possible, giving a personalised structure of the bronchial tree, to fit some other model parameters and to simulate the forced expiration of that patient, as well as to investigate the connection between changes in the lung structure and function.
References
1. Paiva M., Prisk G.K., Verbanck S.: Foreword. Respir. Physiol. Neurobiol. 2005, 148, 1–2. 2. Murray C.J.L., Lopez A.D.: Evidence-based health policy — lessons from the Global Burden of
Disease Study. Science 1996, 274, 740–743. 3. Hyatt R.E., Schilder D.P., Fry D.L.: Relationship between maximum expiratory flow and degree of
lung inflation. J. Appl. Physiol. 1958, 13, 331–336. 4. Fry D.L.: Theoretical considerations of the bronchial pressure-flow-volume relationships with particu-
lar reference to the maximum expiratory flow-volume curves. Phys. Med. Biol. 1958, 3, 174–194. 5. Fry D.L.: A preliminary lung model for simulating the aerodynamics of the bronchial tree. Comp.
Biomed. Res. 1968, 2, 111–134. 6. Pardaens J., van de Woestijne K.P., Clément J.: A physical model for expiration. J. Appl. Physiol.
1972, 33, 479–490. 7. Lambert R.K, Wilson T.A.: A model for the elastic properties of the lung and their effect on expiratory
flow. J. Appl. Physiol. 1973, 34, 34–48.

56 A.G. Polak
8. Dawson S.D.. Elliott E.A.: Wave-speed limitation on expiratory flow — a unifying concept. J. Appl. Physiol.: Respirat. Environ. Exercise Physiol. 1977, 43, 498–515.
9. Shapiro A.H.: Steady flow in collapsible tubes. J. Biomech. Eng. 1977, 99, 126–147.10. Elad D., Kamm R.D., Shapiro A.H.:. Mathematical simulation of forced expiration. J. Appl. Physiol.
1988, 65, 14–25.11. Shin J.J., Elad D., Kamm R.D.: Simulation of forced breathing maneuvers, In: M.Y. Jaffrin, C. Caro
(Eds.), Biological Flow, Plenum Press, New York 1995.12. Hyatt R.E., Wilson T.A. Bar-Yishay E.: Prediction of maximal expiratory flow in excised human
lungs. J. Appl. Physiol.: Respirat. Environ. Exercise Physiol. 1980, 48, 991–998.13. Lambert R.K., Wilson T.A., Hyatt R.E., Rodarte J.R.: A computational model for expiratory flow.
J. Appl. Physiol.: Respirat. Environ. Exercise Physiol. 1982, 52, 44–56.14. Polak A.G.: A forward model for maximum expiration. Comp. Biol. Med., 1998, 28, 613–625.15. Pardaens J., van de Woestijne K.P., Clément J.: Simulation of regional lung emptying during slow
and forced expirations. J. Appl. Physiol. 1975, 39, 191–198.16. Solway J., Fredberg J.J., Ingram R.H. Jr., Pedersen O.F., Drazen J.M.: Interdependent regional lung
emptying during forced expiration: a transistor model. J. Appl. Physiol. 1987, 62, 2013–1025.17. Lambert, R.K.: A new computational model for expiratory flow from nonhomogeneous human lungs.
ASME Trans. J. Biomech. Eng. 1989, 111, 200–205.18. Polak A.G., Lutchen K.R.: Forced expiration from heterogeneous lungs – a model study. Am. J. Respir.
Crit. Care Med. 2001, 163, A823.19. Polak A.G., Lutchen K.R.: Computational model for forced expiration from asymmetric normal lungs.
Ann. Biomed. Eng. 2003, 31, 891–907.20. Weibel E.R.: Morphometry of the Human Lung. Springer, Berlin 1963.21. Hughes J.M.B., Hoppin F.G. Jr., Mead J.: Effect of lung inflation on bronchial length and diameter
in excised lungs, J. Appl. Physiol. 1972, 32, 25–35.22. Bogaard J.M., Overbeek S.E., Verbraak A.F.M., Vons C., Folgering H.T.M., van der Mark Th.W., Roos
C.M., Sterk P.J. and the Dutch CNSLD study group: Pressure-volume analysis of the lung with an exponential and linear-exponential model in asthma and COPD. Eur. Respir. J. 1995, 8, 1525–1531.
23. Polak A.G.: A unified mathematical model for airflow during maximum expiration. Modelling, Me-asurement & Control, C, 1997, 56, 55–64.
24. Reynolds D.B.: Steady expiratory flow-pressure relationship of a model of the human bronchial tree. J. Biomech. Eng. 1982, 104, 153–158.
25. Horsfield K., Dart G., Olson D.E., Cumming G.: Models of the human bronchial tree. J. Appl. Physiol. 1971, 31, 207–217.
26. Press W.H., Teukolsky S.A., Vetterling W.T., Flannery B.P.: Numerical Recipes in C: the Art of Scientific Computing. Cambridge University Press, Cambridge 1992.
27. Polak A.G.: Toward a metrological model of maximal expiration, In: H. Boom, C. Robinson, W. Rutten, M. Neuman, H. Wijkstra (Eds.), Annual International Conference of the IEEE Engineering in Medicine and Biology – Proceedings, IEEE, New York 1997, 4, 1691–1692.
28. Polak A.G., Mroczka J.: A metrological model for maximum expiration. Measurement, 1998, 23, 265–270.
29. Lambert R.K.: Sensitivity and specificity of the computational model for maximal expiratory flow. J. Appl. Physiol.: Respirat. Environ. Exercise Physiol. 1984, 57, 958–970.
30. Lambert R.K., Castile R.G., Tepper R.S.: Model of forced expiratory flows and airway geometry in infants. J. Appl. Physiol. 2004, 96, 688–692.
31. Lambert R.K., Beck K.C.: Airway area distribution from the forced expiration maneuver. J. Appl. Physiol. 2004, 97, 570–578.
32. Mroczka J., Polak A.G.: Reduced model for forced expiration and analysis of its sensitivity, In: D.D. Feng, O. Dubois, J. Zaytoon, E. Carson (Eds.), Modelling and Control in Biomedical Systems 2006 (including Biological Systems), Elsevier, Oxford 2006, 159–164.

57Forward and Inverse Problems in Spirometry
33. Polak A.G.: Indirect measurements: combining parameter selection with ridge regression. Meas. Sci. Technol. 2001, 12, 278–297.
34. Thomaseth K., Cobelli C.: Generalized sensitivity functions in physiological system identification. Ann. Biomed. Eng. 1999, 27, 607–616.
35. Mroczka J., Polak A.G.: Selection of identifiable parameters from the reduced model for forced expiration, In: J. Nagel, R. Magjarevic (Eds.), World Congress on Medical Physics and Biomedical Engineering, IFMBE Proceedings, Springer, Berlin 2006, 14, 664–667.
36. Hoerl A.E., Kennard R.W.: Ridge regression: biased estimation for non-orthogonal problems. Tech-nometrics, 1970, 12, 55–62.
37. Sjöberg J., Zhang Q., Ljung L., Benveniste A., Delyon B., Glorennec P.-Y., Hjalmarsson H., Juditsky A.: Nonlinear black-box modeling in system identification: a unified overview. Automatica, 1995, 31, 1691–1724.
38. Tikhonov A.N., Arsenin V.Y.: Solutions of Ill-Posed Problems. Winston, Washington 1977.39. Morlion B., Polak A.G.: Simulation of lung function evolution after heart-lung transplantation using
a numerical model. IEEE Trans. Biomed. Eng. 2005, 52, 1180–1187.40. Polak A.G., Verbanck S., Paiva M.: Flow-volume curves and multiple-breath washouts. Workshop
on Structure and Function in the Periphery of the Lung, Brussels, September 15–16, 2005. (unpubli-shed).
41. Polak A.G., Mroczka J.: Analysis of flow limiting mechanisms during forced expiration, In: J. Nagel, R. Magjarevic (Eds.), World Congress on Medical Physics and Biomedical Engineering, IFMBE Proceedings, Springer, Berlin 2006, 14, 88–91.
42. Estenne M., Ketelbant P., Primo G., Yernault J. C.: Human heart-lung transplantation: physiologic aspects of the denervated lung and post-transplant obliterative bronchiolitis. Am. Rev. Respir. Dis. 1987, 135, 976–978.
43. Tawhai H.M., Pullan, A.J., Hunter, P.J.: Generation of an anatomically based three-dimensional model of the conducting airways. Ann. Biomed. Eng. 2000, 28, 793–802.
44. Tgavalekos N.T., Venegas J.G., Suki B., Lutchen K.R.: Relation between structure, function, and imaging in a three-dimensional model of the lung. Ann. Biomed. Eng. 2003, 31, 363–373.