A Mobile Phone GuiDE: a GUI Decoder and Enricher Emily Z. Yan · A Mobile Phone GuiDE: a GUI...
54
A Mobile Phone GuiDE: a GUI Decoder and Enricher by Emily Z. Yan Submitted to the Department of Electrical Engineering and Computer Science in partial fulfillment of the requirements for the degree of Master of Engineering in Computer Science and Engineering at the MASSACHUSETTS INSTITUTE OF TECHNOLOGY September 2006 @ Massachusetts Institute of Technology 2006. All rights reserved. Author ...... . . . . .. .. . Department of Electrical Engineering and Computer Science August 22, 2006 Certified by.. ............... Larry Rudolph Principal Research Scientist Thesis Supervisor Accepted by .... ............. ,,Athur C. Smith Chairman, Department Committee on Graduate Students MASSACHU $ INS OF TECHNOLOGy CT ! 3200]7 BARKER LIBRARIES
Transcript of A Mobile Phone GuiDE: a GUI Decoder and Enricher Emily Z. Yan · A Mobile Phone GuiDE: a GUI...

A Mobile Phone GuiDE:
a GUI Decoder and Enricher
by
Emily Z. Yan
Submitted to the Department of Electrical Engineering and ComputerScience
in partial fulfillment of the requirements for the degree of
Master of Engineering in Computer Science and Engineering
at the
MASSACHUSETTS INSTITUTE OF TECHNOLOGY
September 2006
@ Massachusetts Institute of Technology 2006. All rights reserved.
Author ...... . . . . .. .. .Department of Electrical Engineering and Computer Science
August 22, 2006
Certified by.. ...............
Larry RudolphPrincipal Research Scientist
Thesis Supervisor
Accepted by .... .............,,Athur C. Smith
Chairman, Department Committee on Graduate StudentsMASSACHU $ INS
OF TECHNOLOGy
CT ! 3200]7 BARKER
LIBRARIES

2

A Mobile Phone GuiDE:
a GUI Decoder and Enricher
by
Emily Z. Yan
Submitted to the Department of Electrical Engineering and Computer Scienceon August 22, 2006, in partial fulfillment of the
requirements for the degree ofMaster of Engineering in Computer Science and Engineering
Abstract
Much information can be obtained from knowing what tasks the user does on his orher cell phone. This paper describes GuiDE, an automated user-activity recognitionsystem on the mobile phone. GuiDE's unique approach to activity recognition ex-ploits GUI screenshots taken as the individual interacts with their cell phone. Thesescreenshots are aggregated into a graph to help probabilistically determine whetheror not a set of screenshots can be considered a user-level activity. A frequency countof different sets of screenshots is also kept to act as a sanity check against the prob-abilistic result. GuiDE is just a partial step towards a much more powerful tool thatcan correlate GUI information with other services to provide a better understandingof user activity.
Thesis Supervisor: Larry RudolphTitle: Principal Research Scientist
3

4

Acknowledgments
I foremost want to thank my advisor, Larry Rudolph, for his guidance and support
over the past three years that I have known him. He has really challenged me and
given me a new understanding of what it means to do research. To my fellow labmates,
thanks for always making the eighth floor in Stata an interesting place to be. To my
fellow coworkers and interns at NRCC, thanks for all the valuable discussion that
took place concerning the design of this work. Finally, thanks to all my friends and
family, who have listened and encouraged me throughout this process. God bless.
5

6

Contents
1 Introduction 11
2 Related Works 15
3 Design 19
3.1 Defining a Pattern ....... ............................ 19
3.2 Why Observable State .......................... 20
3.3 Finding Patterns . . . . . . . . . . . . . . . . . . . . . . . . . . . . . 21
3.3.1 The G raph . . . . . . . . . . . . . . . . . . . . . . . . . . . . 21
3.3.2 Pattern finding Algorithms . . . . . . . . . . . . . . . . . . . . 23
3.4 An Evolving System . . . . . . . . . . . . . . . . . . . . . . . . . . . 34
4 Implementation 35
4.1 Getting the Screenshots . . . . . . . . . . . . . . . . . . . . . . . . . 35
4.2 Building the Graph . . . . . . . . . . . . . . . . . . . . . . . . . . . 38
4.3 Detecting Patterns . . . . . . . . . . . . . . . . . . . . . . . . . . . . 40
4.4 D iscussion . . . . . . . . . . . . . . . . . . . . . . . . . . . . . . . . . 42
5 Final Discussion and Conclusion 43
5.1 R esults . . . . . . . . . . . . . . . . . . . . . . . . . . . . . . . . . . . 43
5.2 A pplications . . . . . . . . . . . . . . . . . . . . . . . . . . . . . . . . 46
5.3 Future W ork . . . . . . . . . . . . . . . . . . . . . . . . . . . . . . . . 46
5.4 Conclusion . . . . . . . . . . . . . . . . . . . . . . . . . . . . . . . . . 47
7

A Windows Server Event Log 49
8

List of Figures
1-1 Activity table - a sample of how activities can be logged in a table
format. This table is not constrained to activities on the cell phone,
but can encompass all detectable user actions. . . . . . . . . . . . . . 12
3-1 Smaller changes in the UI correlate to less importance for the user. a)
The clock icon changes on the main screen and only the icon area is
changing. b) The entire GUI body changes when the user accesses a
new application . . . . . . . . . . . . . . . . . . . . . . . . . . . . . . 21
3-2 Benchmark paths: a) Standard Sequential path - a normal activity
b) Composite path - two activities performed one after the other c)
Interleaved path - one activity interrupted by another. May or may
not return to the node user was at prior to interruption. . . . . . . . 23
3-3 Sequential Match Algorithm: the flow chart in which each path is
evaluated . . . . . . . . . . . . . . . . . . . . . . . . . . . . . . . . . 24
3-4 Matching options for the Composite path . . . . . . . . . . . . . . . 25
3-5 Matching options for the Interleaved path . . . . . . . . . . . . . . . 26
3-6 Sequential Match Algorithm Startup: the first path into the system
must be a pattern because there is nothing to compare it to. After-
wards, bootstrapping logic becomes more complicated. . . . . . . . . 28
3-7 Sequential Match Algorithm with Frequency Counts: all paths are
sorted in the same bucket. Paths that occur more frequently are con-
sidered patterns, and paths that occur less frequently are considered
T B C s. . . . . . . . . . . . . . . . . . . . . . . . . . . . . . . . . . . . 29
9

3-8 Sample Input Paths for the Graph Algorithm: These two paths demon-
strate why options 1 and 2 will not work for GuiDE. Option 1 evaluates
both paths to a value of 0.16. Option 2 evaluates both paths to a value
of 0.75 Yet, these two paths should not have equal value as only the
first should be classified as an activity. . . . . . . . . . . . . . . . . . 31
3-9 Root nodes act as punctuation, and splits the Composite path into two
sm aller paths. . . . . . . . . . . . . . . . . . . . . . . . . . . . . . . 32
4-1 Changes seen in the GUI - a) Although a keypress occurs between these
pairs, the title does not change, so no screenshot is taken. b) In these
examples, a title change is sensed and a screenshot taken. Note how
in the second pairing, the word itself does not change, but the pixel
values do. The system cannot distinguish between these two cases. . 37
4-2 A sample preliminary graph. a) Notice how the music player can be
entered from two different applications. Title hashing catches when ap-
plications overlap. b) An interruption occurred while using the camera
application. The phone icon on the second node shows that the user
is in the middle of a call. . . . . . . . . . . . . . . . . . . . . . . . . 38
4-3 GUI used to select directory of cell phone screenshots for graph aggre-
gation . . . . . . . . . . . . . . . . . . . . . . . . . . . . . . . . . . . 39
4-4 Once the user feels that enough data has been aggregated into the
graph, the used can select the option to "start pathing". ....... 41
5-1 Tiered events: the graph on the left is from hashing over the entire GUI
body and capturing every keypress. The graph on the right uses the
same dataset, but hashes only the title. The difference is remarkable
as nodes collapse into "clusters". . . . . . . . . . . . . . . . . . . . . 44
5-2 Composite and Interleaved Paths in Reality: a) Taking a picture and
then sending it as a message b) Receiving a call when using the camera 44
10
Chapter 1
Introduction
It is possible to learn a great deal of information about any individual by study-
ing their cell phone usage; not just calls, but the activities they do on their mobile
devices. We define activities to mean user-level activities, such as sending a text
message or taking a picture, along with the menu navigation required to access the
correct applications. To access most cell phone applications, phones tend to require
at least three keypresses (one for the main menu, one for the submenu, and one for
the final selection). From there, cell phone services are generally associated with only
one application (e.g. taking a picture uses the Camera application). However, there
are exceptions; sending a text message, for example, involves both SMS messaging
and looking up a contact in the Contacts database. As cell phones evolve into hand-
held mobile computing devices, the number of multi-sttep tasks is expected to only
increase.
To study these multi-step tasks, we need to be able to recognize the activity
that happens on the phone. Ideally, activities would be stated at a human-level of
understanding (e.g. receiving a call, sending a text message). This is because low-
level activity cannot be as easily comprehended or referenced. A simple model to
represent these activities is a table denoting each activity, its start time, and its end
time (figure 1-1).
In this thesis, we propose that this model of human-level activities can be built
over time by observing the cell phone GUI and finding patterns in its change of state.
11

Figure 1-1: Activity table - a sample of how activities can be logged in a table format.This table is not constrained to activities on the cell phone, but can encompass alldetectable user actions.
By definition, GUIs are a reflection of the state on the cell phone. By design, cell
phone GUIs also have a natural menu hierarchy used to better convey information to
the user [1]. By monitoring the user's interactions with this hierarchy, clear patterns
of cell phone state emerge as individuals repeatedly perform the same tasks.
To find these patterns, screenshots of the GUI are taken during cell phone usage
and then aggregated into a graph. The more an individual uses their cell phone, the
more the graph reflects patterns of usage; the graph also correlates with the UI of
the cell phone, showing evidence of roots, or menu screens. Roots act as a marker for
beginning and ending activities, allowing chains of GUI state to be aggregated into
human-level activities.
To demonstrate this hypothesis, we have implemented GuiDE (GUI Decoder and
Enricher). This system takes screenshots based on strategic changes within the GUI.
These screenshots, and transitions between screenshots, are aggregated into a graph
structure. Nodes in this graph represent visually similar screens and therefore similar
cell phone states. Edges within the graph represent transitions between these visu-
ally similar screens. Once this graph has achieved steady state, a specific traversal
of screens can be detected as either a known or abnormal pattern by strategically
breaking down the traversal path into root bracketed segments and analyzing the
probabilistic correlation between nodes.
12
Activity Start Time End Time
sent text message 2:45 pm 2:50 pm
received call 3:12 pm 3:47 pm
took a picture 4:00 pm 4:01 pm
followed navigation 5:12 pm 5:20 pmdirections 5:12 pm 5:2 pm
changed ringtone 5:30 pm 5:32 pm

Although this work was implemented for a Nokia 6680 phone, this same technique
could be applied to any system that exhibits sporadic repeated actions. This is
because the interface to the system is based on screenshots to represent the occurrence
of lower-level events.
There are other benefits in being able to profile a user and recognize their cell
phone activity. For example, a cell phone can preemptively react to a user's action,
shortcutting excess keystrokes. A cell phone could also determine if user activity
differed from previously known actions, implying a newly installed application or the
implementation of different settings. The strongest use case, however, would be to log
user level actions themselves, allowing for new questions to be asked of a database. In
conjunction with other logging services (e.g. bluetooth or gps), it would be possible
to ask "Where was I when I sent a text message at noon?" or "Who did I meet when
I was last listening to music?"
Chapter 2 discusses the design of the system, comparing it to alternatives. Chapter
3 goes into more depth about the implementation. Chapter 4 addresses results and
discusses what was learned from the process, along with future works.
13

14

Chapter 2
Related Works
GuiDE recognizes patterns of sequential actions in a cell phone's visually observable
state, and uses this information to abstract activities that the user may be performing
on the cell phone. GuiDE's novelty is in the following characteristics:
" abstracting activities on the cell phone platform
" making use of the natural hierarchy and design of the GUI to achieve this
purpose
At this time, no other system that has emerged with these characteristics. How-
ever, automated activity recognition itself is not a new field. A survey of different
activity recognition applications can be categorized as follows: recognition of a user's
location, recognition of a user's interaction with a computer, and recognition of a
user's daily interactions with distributed sensors. For each, we consider systems cur-
rently exploring the field and how these systems compare to GuiDE.
Recognition: User Location ; Platform: Cell Phone
Because the cell phone is a mobile device generally carried with the user, several
systems have been developed that make use of the cell phone's services. These systems
attempt to find patterns within the user's location data, abstracting higher level
location concepts. Anderson and Muller [2] use a Hidden Markov Model to process
GSM data and determines whether or not the user is stationary, walking, or driving.
15

Liao et al. [7] create Relational Markov Networks based off a user's cell phone GPS
data and from that labels a person's activity location. Yu [12] samples GPS data
from the phone and combines it with GSM cell coverage data when GPS is absent.
A variant of k-means clustering is then used to produce clusters and learn where the
user spends his time.
The concept of pattern detection between these systems and GuiDE is very similar.
However, an interesting, but important, distinction to note between sampling user
location and user interaction with the cell phone is that user location sampling can
happen at a slower pace since a user's location cannot alter very abruptly. Because of
this, these systems are better able to conserve battery resources compared to GuiDE.
Recognition: User Interaction; Platform: Desktop
Activity recognition has also been developed for the desktop. CALO [3] instruments
common applications to create a database about user's actions. Questions can be
run over this database, allowing the program to draw correlations between the dif-
ferent services that gather data simultaneously. TaskTracer [10] monitors a user's
interactions with his or her computer via a Publisher-Subscriber architecture. By
keeping a record of all of their interactions with computer resources and applications,
and associating these records with specific tasks, it allows users to be able to ac-
cess past activities and restore the associated context. Similar to TaskTracer is Van
Kleek's work [6], which contains a slightly expanded framework. Treating all docu-
ments, e-mail, and web pages uniformly by observing a user's low-level actions and
converting them into a higher-level vocabulary, the framework stores information in
remembrance logs. Additional information from the user's environment, such as the
user's activity level, current music, and location, also is stored under the framework to
provide user context. The user can then query for the log for individual or expanded
window entries. Future work includes allowing users to examine their past to better
understand how they are working.
A desktop differs from a cell phone primarily in its greater ability to multi-task.
Due to its larger screen, and ability to change the relative position of windows, the
16
algorithm that GuiDE provides is unlikely to support the flexibility involved in a PC.
Recognition: User Interaction; Platform: Exterior Environment;
Taking an even broader view, other systems use low-level sensor data, including cell
phone sensor data, to abstract a higher-level description of an individual's lifestyle.
These applications target achieving context aware applications. Eagle [4], in con-
junction with the MIT Media Lab, used cell phones as wearable sensors, acting as a
detector for location based services (GPS, GSM) and interaction (bluetooth). This
data was aggregated into different models in an attempt qualify a person's daily rou-
tine. Morikawa et al. [8] equip a RFID transmitter/receiver to the cell phone to
collect information from different sources. The cell phone then combines this infor-
mation into a Profile Aggregator, which uses semantic web technology to connect
related information. Sensay [11] attempts to use various sensors available on the
cell phone, as well as augment its contextual knowledge by analyzing application.
Given this information, the phone dynamically adapts to changes in environmental
and physiological states. This includes manipulating ringer volume and making call
suggestions to both the user and caller.
Achieving the ability to define user-level activities on the cell phone would help
support the framework of the context aware applications, helping them to become
more powerful. This works well in conjunction with other systems, as opposed to
offering as a replacement.
17

18

Chapter 3
Design
GuiDE's goal is to detect patterns in the changes of observable state seen through
the GUI and, from those patterns, extract user-level activities (e.g. sending a text
message). In this section, we will define what is meant by a pattern, discuss the
reason for using observable state, and describe how can patterns be detected through
monitoring.
3.1 Defining a Pattern
A pattern is a series of actions that encompasses a user-level activity. It is hard to
provide a computational definition of user-level activities; informally, we say that an
activity is something with a beginning and an end and leaves the phone in roughly the
same state. We define actions as involving low-level events that may or may not span
more than one application. For example, taking a picture involves only the camera
application, but sending a text message often involves both accessing the Contacts
database and activating the SMS messaging system. Patterns exist for two reasons:
" Cell phones have limited display real estate. This causes multi-step tasks to
occur in a clear serial order to provide continuity to the user.
* Cell phones tend to be used for short specific tasks. These tasks are often the
ones most valuable to a user and thus repeated more frequently.
19

Why do we care about patterns at all? Patterns primarily allow us to convert
low-level occurrences to a human-level of understanding. When converting this infor-
mation to a log or an activity table, the system can maintain a much more efficient
representation by only holding on to the higher-level concept versus all the separate
lower-level actions.
3.2 Why Observable State
To observe user-level activities, we have chosen to seek patterns in cell phone actions.
The key question is how to extract the lower-level state in which to monitor these
patterns.
The first option is maintaining a log of the lowest-level activities (e.g. key presses
and raw events). The problem with this method is that most cell phones do not have
a methodology for readily publishing this information. Even if this publication did
exist, it requires an intimate knowledge of the cell phone APIs, making any program
developed needing to be tailored for each cell phone platform. Plus, some cell phones
may publish certain activities that others do not; if we made any assumption about
what a certain activity means, we may find that it does not exist on a different
platform.
The second, but less intuitive, option is to monitor the GUI. This does not seem
obvious at first because the GUI does not necessarily have a one-to-one mapping
with low-level activities. Additionally, the concept of using the GUI, also known as
screen scraping, is not well received. Screen scraping is notorious for being too brittle;
changing the GUI in any form, even as simple as adding a button, tends to break
most screen scraping systems.
However, the GUI reflects changes in observable state, displaying events that hold
value in some way to the user. A GUI also holds a great deal of semantics; the
larger the change in the GUI, the more important the low-level activity is to the user.
This causes us to think of low-level activities as tiered, a realization that cannot be
accomplished by monitoring only the lowest-level activities.
20

a) Small change, b) Large change,user doesn't care: user is impacted:
Figure 3-1: Smaller changes in the UI correlate to less importance for the user. a)The clock icon changes on the main screen and only the icon area is changing. b)The entire GUI body changes when the user accesses a new application
It is because of the ability to recognize tiered events that we have chosen to proceed
with the second method. An additional benefit is that, unlike the first method,
processing screenshots requires little previous knowledge of cell phone APIs. We will
also demonstrate why screen scraping's main weakness, inability to be flexible, is not
an issue with the algorithms presented in the following section as no assumptions are
made as to the overall layout of a cell phone's GUI.
3.3 Finding Patterns
Finding patterns require searching for a series of actions that occur together with
high probability. In this section, we discuss the data structure and the algorithms
used to achieve this purpose.
3.3.1 The Graph
Definitions
A graph is a data structure with nodes and edges. Both nodes and edges can have
weight. We will adopt the following representation:
* Node: a cluster of visually similar screens. A node's weight is the number of
times the user has visited this cluster.
21

* Edge: a transition between screens in different clusters. This can be obtained
by the serial ordering of screenshots. An edge's weight is the probability the
user has departed a node using that edge (number of departures using this edge
divided by the number of times the source node has been visited).
" Path: a specific traversal of screenshots (nodes).
A pattern is then a series of screens that have a high probabilistic correlation.
Section 3.3.2 defines how to determine which paths are considered "highly probable".
Steady State
Because cell phones are used for short, specific tasks that are repeated over time [91,the graph will gradually move to steady-state. A graph has achieved steady-state
when the probabilities most accurately reflect the user's habits. In other words, new
paths of information would make very little impact on the relative weights of nodes
and the probabilistic weights of edges.
Without steady state, all information in the graph is still in flux and may not
accurately reflect the individual's cell phone usage. An extreme example is when the
graph contains no information. All paths of data, including erroneous paths, would
then be considered "highly correlated" only because there is no data demonstrating
other options.
A steady-state graph should demonstrate certain traits that we define:
1. Patterns: a set of highly correlated nodes. If a user consistently performs a
set of actions, there will be high probabilistic correlation over that set of nodes
(the transitions between those nodes have been frequently seen relative to other
edges).
2. Interruptions or Mistakes: a set of poorly correlated nodes. These represent
statistically rare injections of GUIs that are not part of the commonly performed
task. Note that if a user consistently presses the wrong key or selects the wrong
menu item, we do not consider it a mistake.
22

a) Standard:
b) Composite:
c) Interleaved:
0000t
0D 00Q* a
Figure 3-2: Benchmark paths: a) Standard Sequential path -Composite path - two activities performed one after the otherone activity interrupted by another. May or may not return toprior to interruption.
a normal activity b)c) Interleaved path -the node user was at
3. Menus: nodes with edge probabilities evenly distributed amongst numerous
outgoing edges. This is where the individual uses the same node to access
several different services. Note that not all menus give rise to menu nodes. We
label a node as a menu only if it appears to act like a menu or a choice point.
4. Roots: nodes with a large visitation frequency. An extreme form of a menu,
these are nodes where the user most frequently enters the cell phone GUI to
access all other applications.
3.3.2 Pattern finding Algorithms
This section discusses four pattern finding methods: the sequential match algorithm,
the sequential match algorithm with path frequency counts, the graph algorithm, and
the graph algorithm with path frequency counts. With each, we list the benefits and
flaws, and show why the graph method with frequency counts is the best approach.
For all approaches, the three paths in Figure 3-2 are used as benchmarks.
23
00oo
...... ........ Ak- - I-- -

Path entersinto system
compare to allknown patterns
is Patha pattern?
yes no
Patterns L
Figure 3-3: Sequential Match Algorithm: the flow chart in which each path is evalu-ated
Sequential Match Algorithm
The sequential match system maintains no graph information and instead tries to
qualify patterns purely based on paths previously seen.
In this system, every new path entered into the system is one of two types: (i)
Pattern and (ii) To Be Classified (TBC). Patterns are paths that encompass an ac-
tivity exactly how it is. TBCs are paths that either need to be broken down into
common actions or cannot be broken down and represent a rare action. If we refer
back to figure 3-2, the Sequential path is considered a Pattern, and the Composite
and the Interleaved paths are considered TBCs.
We would like to create a matching system between incoming paths and patterns,
and at first this seems similar to a string matching problem. If a path is equivalent
to any Pattern in the system, then it is a Pattern, and therefore a known activity.
But what does it mean when a path does not match any pattern in the system?
Most likely, this path is a TBC and can be broken down. To determine the appropriate
action, we refer back to figure 3-2 and use the Composite and Interleaved paths to
determine what we would like to see.
24
. ...... . .......

Option 1: Splitting the path
Option 2: Covering the path
Figure 3-4: Matching options for the Composite path
* Composite Path: requires a subset match with any one pattern. If we say
Pattern A is the first activity and Pattern B is the second activity, then there
are two possibilities (see figure 3-4):
- Option 1: Paths are split when a subset match is discovered. In this example,
the Composite path would be split into two parts. However, because Pattern
A and B share the root node, this split would leave the latter portion of the
path unrecognizable as Pattern B. The root node would need to be duplicated
before making the split.
- Option 2: Paths are never split into separate parts, even when a subset
match is detected. Instead, the system attempts to "cover" a path with known
patterns. If ever a set of patterns sufficiently covers the entire path, the system
can break the path into the separate patterns. Note that this option has more
overhead as it requires each path to maintain a set of possible covers. However,
it is safer in the respect that the system does not preemptively break up a path.
* Interleaved Path: requires that the pattern allow for insertions. If Pattern A
is the interrupted activity and Pattern B is the interuptee, then there are two
25

Option 1: Recognize allowing insertions
Step 16 >
Step 2
Option 2: Recognize not allowing insertions
Step 1
Step 2O
Figure 3-5: Matching options for the Interleaved path
options (see figure 3-5):
- Option 1: Matching allows for insertions. The system recognizes that Pat-
tern A exists within this path, but has only been interrupted by some other
nodes. These nodes are dropped out and left to be matched later as Pattern B.
Note that if the extra "interrupted-from" node exists, it would erroneously be
dropped out with Pattern B.
- Option 2: Matching does not allow for insertions, and instead must be an
exact match to a previous pattern in the system. The system recognizes Pat-
tern B within Pattern A, and pulls it out of the path, leaving Pattern A to be
later recognized by the system. Note that if the extra "interrupted-from" node
exists, it would remain as part of Pattern A and could potentially be collapsed.
Combining these two path requirements, there seems to be only one viable set of
rules that can be used to evaluate a match. Splitting does not seem to be a favorable
option under any circumstance. Splitting with duplication (as option 1 suggests for
the Composite path) fails because the Interleaved path does not require any nodes
to be duplicated. However, splitting without duplication results in multiple versions
26
of how the activity is represented in an incorrect maner (e.g. pattern B with a root
head vs. pattern B without a root head, causing the latter to be a "pattern" for the
former). This leaves the option to "cover" a path. Coverage cannot be combined
with matching with insertions, as this would lead to errors in standard matching
techniques. Thus, the system must allow exact subset matches, with covering to
determine when a path has been fully classified.
Unfortunately, the matching algorithm assumes there already exists a database
of all possible patterns. This assumption implies one of two things: either that only
patterns are inputted into the system before matching occurs, or that the system
algorithmically determines which paths are patterns and TBCs upon startup. The
former is not a viable option; even if the user tried to carefully instrument his or
her activity patterns, he or she cannot control a possible interrupt at any time (e.g.
receiving a call). Because of this, we explore the feasibility of bootstrapping the
system.
When the first path comes into the system, the system places it in the pattern
bucket because we have nothing to compare it to. When the next path enters the
system, the system checks to see if any of the paths in the pattern bucket achieve an
exact subset match. If there is a match, but not a complete covering of the path, the
new path will be categorized as a TBC.
The system then needs to make the reverse check: see if the second path is an
exact subset match to the path in the pattern bucket. To understand this, take this
example. Suppose the first path (x) that entered the system was actually a TBC and
erroneously got placed into the pattern bucket. Then the second path (y) that enters
the system is actually a pattern that can break down x. In this case, the only correct
measure is to check if y is a subset match to x, along with the original check to see if
x is a subset match to y.
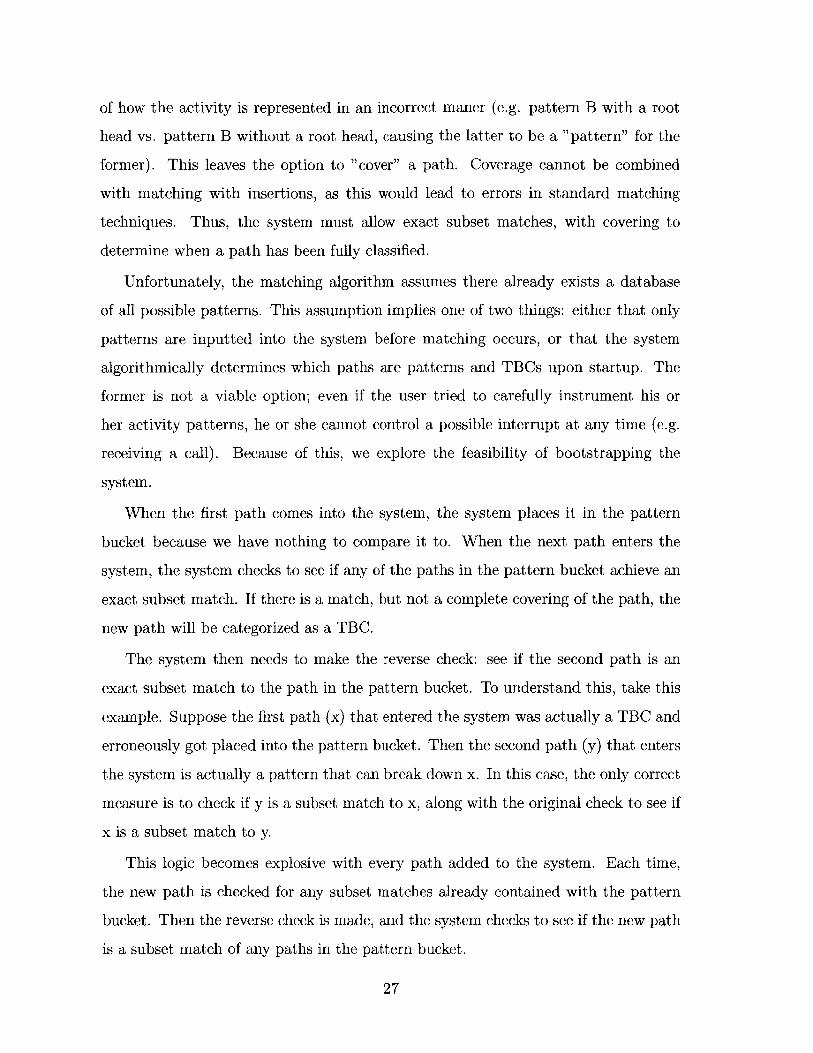
This logic becomes explosive with every path added to the system. Each time,
the new path is checked for any subset matches already contained with the pattern
bucket. Then the reverse check is made, and the system checks to see if the new path
is a subset match of any paths in the pattern bucket.
27

a) first path b) all following pathsx e nther into t enmpr i to
syate d.
What happens when all these checks equa l ? W eansayta h e ahi
the new path must b onsidered a patten. pthite udmertattennyah
noa pattern?
yes pattern ay pa ttend to
for~~~~~ ~~ sustmace f l atsaans l ter pats.~
no
no
Figure 3-6: Sequential Match Algorithm Startup: the first path into the system mustbe a pattern because there is nothing to compare it to. Afterwards, bootstrappinglogic becomes more complicated.
What happens when all these checks fail? We cannot say that the new path is a
TBC because we have then spread the problem to include the TBC bucket. Instead,
the new path must be considered a pattern. This would mean that the only paths
classified as TBCs are ones that have yet to be fully covered by existing patterns.
This system seems complicated, inefficient, and requires a great deal of overhead
(e.g. the covering information). The problem lies with the fact that we can never be
sure if a given path is a pattern or a TBC, so the system needs to continuously look
for subset matches of all paths against all other paths.
Sequential Match Algorithm with Path Frequency Counts
Another method to separate patterns from TBCs is using a frequency count. Instead
of executing a pure matching algorithm, this system emphasizes the concept that cell
phone users repeatedly perform short, specific tasks.
In this algorithm, all paths fall into the same bucket. The system checks to see
if it has seen that path before. If it has, it increments that path count by one. If
not, it adds the new path to the bucket. Over time, the paths gradually separate into
28

Path entersinto system
High frequency(Pattern)
All PathsLow frequency
(TBC)
s path aTBC?
yes z'no
Ate/tto ) Path Is abreak down atm(oeinto pttems e d )
Figure 3-7: Sequential Match Algorithm with Frequency Counts: all paths are sortedin the same bucket. Paths that occur more frequently are considered patterns, andpaths that occur less frequently are considered TBCs.
frequent paths and infrequent paths. Frequently seen paths are considered patterns,
and rarely seen paths are considered TBCs.
The algorithm for basic matching and breaking down of TBCs into patterns re-
mains the same as in the previous model. Thus, the system still looks for exact
subsets of patterns in TBCs and uses a covering model in order to know when a TBC
is fully classified.
While this system solves the issue of separating patterns from TBCs, the weak-
nesses involved in the matching algorithm itself (the overhead and complication of
exact subset matching with coverage) still persists. Also, a new issue is not knowing
exactly where the cutoff lies between patterns and TBCs. If TBCs are very rare, then
the gap in frequencies between the two categories should be quite large. However,
if TBCs are common, this gap is not as apparent. It does not seem that matching
algorithms are the way to go.
29

Graph Algorithm
The graph algorithm makes use of the graph structure mentioned in 3.3.1. Once the
graph has reached steady state, the system is ready to classify new paths of data as
either a known pattern or an abnormal action. The system first adds the path data
into the graph before proceeding with the classification schema.
Our goal is to analyze the probabilities along a given input path. If the proba-
bilities are correlated with high probability, the path is classified as an activity. If
not, then the path is classified as an abnormality. There are four options to analyze
probabilities. We describe each one, and discuss how the first three are not suitable
to GuiDE's needs:
1. Multiply the edge probabilities along the path: Calculate the multiplicative
product of all probabilities along this path and see if the result is near zero.
This method has the benefit that any one low probability edge will drive the
overall path probability to near zero. Unfortunately, longer paths are also au-
tomatically disqualified as the multiplication of fractions similarly drives the
result towards zero. This is not the desired behavior; a more accurate quantifi-
cation of a path's probability is the mean probability which are not swayed by
the length of the data set.
2. Use a constant low probability threshold for the mean probability: Calculate
the average probability over the path and compare it to a fixed threshold. If the
average falls below this threshold, the path is considered an abnormality. If the
threshold is set too low, it might never be reached. If set too high, there would
be the problem of false negatives as less frequent patterns would be classified
as abnormalities. Another problem is the nature of the statistic; the presence
of a single low probability edge does not greatly sway the overall value of the
mean. Thus the one bad edge of Path B does not have a large impact.
3. Use a constant low probability threshold for each edge probability: Check each
probability over the path and compare it to a fixed threshold. If any of these
30

a) Long path, 0.5 0.8 0.8 0.7 0.9 0.8
highly correlated:
b) Short path,contains mistake:
Figure 3-8: Sample Input Paths for the Graph Algorithm: These two paths demon-
strate why options 1 and 2 will not work for GuiDE. Option 1 evaluates both paths
to a value of 0.16. Option 2 evaluates both paths to a value of 0.75 Yet, these two
paths should not have equal value as only the first should be classified as an activity.
probabilities fall below this threshold, the path is considered an abnormality.
This accurately causes paths to be labeled as abnormal with only one low prob-
ability edge. However, there is again the difficulty of finding an accurate thresh-
old.
4. Calculating a statistic to determine the presence of outliers: Choose a standard
statistic for finding outliers in a dataset. If there are any low outliers (high
outliers are ignored because probabilities of 1 does not signify an erroneous
action), the path is rejected. This method allows us to detect the presence of
single low probability edges without relying on the length of dataset, yet sets a
relative threshold based on the probabilities seen within the path.
Because of the flaws mentioned for the first three options, the method that per-
forms the best is option 4: calculating a statistic to determine the presence of outliers.
GuiDE uses the most basic outlier check: If any given edge falls outside of two
standard deviations less than the mean probability of the graph, we consider this a
low probability edge and label the path as abnormal. This technique suitably meets
the requirements for two of the benchmark paths: the Standard and Interleaved
paths. The Standard path will be recognized as an activity as all nodes are strongly
correlated. The Interleaved path will be rejected as an activity because one edge falls
outside the range of two standard deviations.
31

Figure 3-9: Root nodes act as punctuation, and splits the Composite path into twosmaller paths.
The Composite path remains a problem. Two activities in succession create an
overall highly correlated path since neither is an incorrect action. However, because
the entire path is a composition of activities, it should also not be recognized as a
standard activity performed by the user.
To solve this case, we use the knowledge that our graph has "roots". Root nodes
act as a punctuation, dividing a path into two smaller paths (see figure 3-9). Now the
system has the chance to accurately classify each subpath. If we assume that a user
has stopped his or her current action by idling for a suitably long period of time (e.g.
to take an extreme example, thirty minutes), it is possible to further break down a
path based on the idle time between screenshots. However, this assumption is not
correct; a long idle time does not always signify activity markers. For example, users
often leave their music application playing for extended periods of time.
There are some flaws to this design. One flaw is the need for the graph to have
achieved steady state. As previously mentioned, analyzing probabilities will not work
correctly if the graph does not accurately reflect the standard cell phone usage of the
individual we are attempting to profile.
Another flaw is the issue of false positives; some paths can be erroneously identified
as activities. Consider a path where the user solely traversed highly visited edges, but
in the end cancelled and never completed a single action. This path would then be
incorrectly labeled as a pattern even though no activity was performed. It is possible
32
to argue that this path would never exist because a steady state graph implies that
the individual is an expert user and has no reason to wander; however, this argument
does not hold much merit since the graph may evolve over time. This evolution
process by definition means that at some point, there will be paths that don't fit the
"standard".
Finally, what does it mean when the system detects an abnormal activity? Cur-
rently, the definition is if an edge has a probability that falls outside of two standard
deviations from the mean and is simply logged within the table. It would be better
for GuiDE to identify paths that are activities but contain a mistake. If we could
determine a way to "drop" the nodes that represent the mistake and still recognize
the overall activity, this system would be more robust.
Graph Algorithm with Path Frequency Count
A simple augmentation to the above algorithm that reduces false positives is to add a
frequency count to all evaluated paths. If the system labels certain paths as activities
yet they are rarely seen, it is unlikely that the path was actually an activity. This
extra tidbit of information adds a sanity check to the evaluation process, solving the
complication of false positives.
This method appears the most appealing and is the one GuiDE implements. To
reiterate the benefits, the system:
e Captures common patterns within a graph structure
* Avoids complicated string matching and associated structural overhead
e Provides a simple sanity check that can validate the result
Section 5.3 addresses options that could be implemented in future iterations of
GuiDE to improve the classification of abnormal activities.
33
3.4 An Evolving System
GuiDE's strongest point is that it constantly adapts to what the user does. Although
steady state is required for the GuiDE to function correctly, the internal graph rep-
resentation never locks itself on one set of probabilities. Because of this, If a user
begins to consistently perform a series of actions, the system gradually learns about
the presence of a new activity. At first, the system would log the sequence as an
abnormal activity, but the path would gradually be reinforced by the cell phone user.
This causes the graph to move towards a new steady state where the new pattern
passes the statistical check.
34

Chapter 4
Implementation
The previous section mentioned that GuiDE consists of three main components: tak-
ing the screenshots, creating the graph, and checking incoming paths as activities.
The first component is performed on a Nokia 6680 (S60 2nd edition, feature pack
2), and involves a python script to strategically take screenshots. The other two
components involve offline processing on a PC.
4.1 Getting the Screenshots
In order to obtain the screenshots, Python 1.3.1 for the Nokia S60 series phones
contains a function suitably named screenshot 0 within the graphics library. This
generates an Image object that can then be saved as various formats, including jpg
and png. The resulting image has the same brightness regardless whether or not the
backlight is on.
There are three possible systems for taking screenshots:
1. Timer-based system: screenshots are taken at regular intervals. However, be-
cause individual can leave their cell phone idle for hours, this system wastes
memory capacity as new screenshots would not convey new information.
2. Event-based system: screenshots are taken based on various events. Event
systems work well when the set of appropriate events to focus on is well defined.
35
Unfortunately, because cell phones do not have a system in place to readily
publish these events, this option is not very feasible at this time.
3. Hybrid system: A timer based system that saves images only upon an event
detectable from the screenshot.
Because option 1 lacks efficiency, and option 2 cannot be performed at this time,
we have chosen to implement option 3. However, clearly not all changes within the
GUI can be considered an event. For example, we would not want a new screenshot
to be taken every time the clock updates.
We discussed in section 3.2 that GUIs naturally organize low level events into their
degree of importance by how much they choose to change the GUI. The problem is
distinguishing what level of change is required to mark "important" events.
Most changes within the GUI are small to give consistency as the user interacts
with the cell phone. The largest level of change occurs when a new application is
accessed; here, the entire GUI body changes to reflect the new application. Because
we cannot distinguish one change in the GUI from another, we instead focus on the
title area. There is a strong correlation between a changing title and a changing GUI
body. Based on these semantics, we use a changing title to represent when a new
screenshot should be taken.
Title comparisons are made by checking for a change of at least 5 pixels in the
indicated region. Using a configuration file to define the rectangle of pixels, this hash
perfectly identifies unique screens, although not similar screens. This also leads to
an interesting complication where actions that gray out the title area causes a new
screenshot to be taken (aka warnings, accessing the menu - see figure 4-1). We will
see in section 4.3 why this is actually not an issue.
When a title change occurs, a new screenshot is taken and the script enters "alert
mode". In alert mode, a check is made for a new screen every second. If the user
fails to switch to a new title screen within a five second frame (perhaps he or she is
scrolling through a long list), the script falls back into "semi-alert mode" and checks
for a new screen every five seconds. After 75 seconds in "semi-alert mode", the script
36

a) No screenshot taken:
-12
-PeauLaa 92.3-Stay OWa Way.aa 7M (
Figure 4-1: Changes seen in the GUI - a) Although a keypress occurs between thesepairs, the title does not change, so no screenshot is taken. b) In these examples, atitle change is sensed and a screenshot taken. Note how in the second pairing, theword itself does not change, but the pixel values do. The system cannot distinguishbetween these two cases.
finally falls into "idle" state and checks for a new screen once every minute. The
three states were introduced as a battery saving efficiency. The script also produces
a small click after screenshot is taken, providing feedback to the user that the script
is marking the user's path.
The check for a new screen compares the new title to the previous one. If no
difference is detected, the Image object is discarded and does not use up additional
phone memory. However, if the title has changed, the screenshot is stored and given
the name of the timestamp this difference was detected. By using timestamps, the
system guarantees a collision free naming system.
Some events do fall outside of the title area (e.g. incoming calls). A possible
solution, though not implemented in this version of GuiDE, is to directly compare all
the pixels within the cell phone GUI. If over a certain threshold of pixels have changed,
a screenshot will be taken. Unfortunately, not only is this more computationally
expensive and draining on the battery, it is difficult to tell at this point what this
threshold should be. Further research would be needed to explore how large the area
37
b) Screenshot taken:

0.5 0.166 .0 .333 .333 .333
.5 .0 .333 .333 .0
.0 ).5 .0
0.166 AO
.0 l..
.5 .5a)
5 .5
F Expigai
Figure 4-2: A sample preliminary graph. a) Notice how the music player can beentered from two different applications. Title hashing catches when applicationsoverlap. b) An interruption occurred while using the camera application. The phoneicon on the second node shows that the user is in the middle of a call.
of change within the GUI reflects an event's importance.
Screenshots are periodically uploaded to a webserver. This is where offline pro-
cessing begins and the data is aggregated into a graph.
4.2 Building the Graph
All the screenshots that are deposited onto the web server are processed using a java
program. This java program builds a graph that represents the individual's usage of
their cell phone through detected screenshot changes. Currently this process is not
38

Figure 4-3: GUI used to select directory of cell phone screenshots for graph aggrega-tion
automated, and instead provides a GUI for the user to choose which directory they
wish to process information.
There are two classes that are used in building the graph: Extractor and GraphBuilder.
Extractor is responsible for the interface to the file system; it parses the chosen direc-
tory for all files with the extension of .jpg. It then fully loads all of these files as java
Image objects. This step is necessary because only Images that are fully loaded can
have their pixel values analyzed. However, to not lose the information given by the
filename (namely, the timestamp the screenshot was taken), both Image and filename
are loaded into a temporary object: ImageFile.
GraphBuilder acts as an interface to the Graph class. Taking in a set of sorted
ImageFiles, GraphBuilder then converts the images into Nodes and Edges to be added
into the Graph.
" Every ImageFile is converted to a Node: the Node object is currently created
based on taking a xor hash over a configuration file (C: \featurecoord. txt)
defined area that contains the coordinates of the title. This hash perfectly
identifies unique screens, although not similar screens. This also leads to an
interesting complication where actions that gray out the title area causes a new
screenshot to be taken (aka warnings, accessing the menu). I will explain in
section 4.3 why this is actually not an issue.
" Every transition between ImageFiles is converted to an Edge: once ImageFiles
have been converted to Nodes, an Edge is the pairing of two Nodes that are in
39
- - - -- - ' - --- ' - - . z . -id-:JAN
directofy-1 Start P

temporal order.
If Graph detects that an added Node or Edge has been seen before, it will instead
increment the count for that object. This leads to the concept of node and edge
weights. A Node's weight is the number of times it has been visited. An Edge's weight
is the probability it was used when exiting its start node.
Graph at all times keeps track of which Node has the highest weight, or the most
number of visits from the user. This node is considered the root node, or the node
through which all actions stem from. Other data structures it uses to help keep this
organized is a list of all edges, nodes, and a map from nodes to edges.
GraphBuilder also has the function serialize(. This generates a text file containing
a textual version of the graph in dot. This file can then be consumed by graphviz [5]
to generate a visual display. Unfortunately, graphviz is incapable of using images as
node labels, so in conjunction with a log file, I have substituted the title hashes with
the actual title in question in figure 4-2.
This graph starts with no knowledge of the user or of any screenshots. After a
sufficient amount of data collection, this graph should enter steady state; that is to
say that further paths of data do not have a significant impact on the graph structure
or weights. It is only at this point that we can proceed to using the final component
of GuiDE.
4.3 Detecting Patterns
In section 3.3.1, we gave the requirement that the graph must be in steady state to
proceed, where steady state was defined as incoming data has very little impact on
the graph and its weights. At this point, the user is the judge of whether or not the
system has received enough information to be considered in steady state; he or she
can then select the button that says "start pathing".
Directories selected through the user interface are now treated as Paths, and are
broken up whenever a root node is detected (see 3-9).
To check to see if the Path is considered an activity, the Graph checks for a "low"
40

Nodes now represent paths
Figure 4-4: Once the user feels that enough data has been aggregated into the graph,the used can select the option to "start pathing".
probability along the Path, where low is classified as being outside of two standard
deviations from the graph's mean. Since every new path is added before processing
takes place, a new mean and standard deviation must be calculated. The Graph
maintains a running sum of probabilities and a count of the number of edges at all
times to help expedite this process.
In summary, here is the pseudocode for detecting a pattern in the Graph:
add path to graph data mean = graph's average probability
stddev = graph's standard deviation of probabilities
segments = path split into smaller paths, separated by roots
for each segment:
for each edge in segment:
prob = edge's probability
if (prob < (mean - 2*stddev)):
classify segment as "abnormal activity"
classify segment as "recognized activity"
Note that activities that include a grayed out screen remain "highly correlated"
under this definition because that screen was part of the user traversal of paths.
41
-- -iira - - - - - - - -- -- -- -- -M

4.4 Discussion
Nodes technically represent a "cluster" of images, or screenshots that distinctly differ
in pixels. However, in this implementation of GuiDE, no clustering algorithms are
used due to both time constraint and the difficulty of finding an appropriate algorithm.
The majority of algorithms require that the number of clusters be defined. Since
that exact number will never be known, and preliminary experimentations yielded a
problem with overfitting, this was left as an exercise for the next iteration of GuiDE.
An interesting paper that is attempting to autonomously detect which features and
clusters are important is [cite Coen's work], which could solve the overfitting issue.
The current implementation also only keeps track of one root. Since there can be
multiple roots for a given graph, future work would be to keep a list of nodes, sorted
in weight order. To distinguish which nodes are roots, the program would need to
look for two sets of nodes: those that are highly used, and those that are not used as
frequently. The easiest, but not necessarily correct, metric would be to use the nodes
that have the largest gap in weight as a separation boundary.
An argument that has been raised is that root nodes are not actually the ones that
are traversed most often but instead are the ones where the user spends the greatest
amount of average time. There are a few reasons why the number of traversals
provides more information than the average dwell time spent at a node. First, cell
phones have large idle times. Because users are not continuously acting with their
phone, screens such as the idle screen would have huge dwell times, which is not
proportional to its importance. Also, menu screens should assumedly have very little
time spent in them by an expert user as the expert user knows exactly where they
want to go. However, a user must use the menu in order to arrive at their desire
application. By giving a node this weight, the graph begins to display more of the
hierarchical structure built into the cellphone.
42

Chapter 5
Final Discussion and Conclusion
This section discusses current results (and errors), what has been learned, possible
applications of GuiDE in its current state, and what can be done for future iterations.
5.1 Results
The python script was installed on two individuals' cell phones (model Nokia 6680):
one representing a simple user and one representing a complex user. The difference
between a simple and complex user is the number of services they choose to use on
their phones. The simple user primarily used the phone and alarm clock service. The
complex user had many more service interactions, including the web browser, camera,
and calendar.
Unfortunately, no long term data could be obtained for these subjects as Python
(the platform, not the script) tended to arbitrarily crash without display an error
status. However, even with the small datasets of over an hour in length, the concept of
tiered events was evident when experimenting with different hash values for the graph
(see figure 3-1). Paths also demonstrated the Interleaved and Composite properties
that we used as benchmarks (see figure 5-2).
Datasets tended to have two main sources of error besides the problem with
Python.
. Timer errors: The python script has three cascading timer modes in order
43

-
-
MUM)
(4 "-7T. F>A0r
.FIL
0 7
( .0 lom
Figure 5-1: Tiered events: the graph on the left is from hashing over the entire GUIbody and capturing every keypress. The graph on the right uses the same dataset, buthashes only the title. The difference is remarkable as nodes collapse into "clusters".
a) Composite:
e SI
b) Interleaved:
Figure 5-2: Composite and Interleaved Paths in Reality: a) Taking a picture andthen sending it as a message b) Receiving a call when using the camera
44

to conserve battery power, but needs to still be able to capture changes in
screenshots. Unfortunately, it is possible to miss an event while the timer is
during an "idle" state. Individual actions can be captured if the user is willing
to wait for the program to click and indicate its wakeful state, but sudden events
such as an alarm going off cannot be controlled. The best solution would be
for the phones to provide even a rudimentary event publishing system. GuiDE
would not need to understand the events, just be able to react to them.
Monitoring errors: Not all events are captured by monitoring the title. For
example, an incoming call displays only in the bottom half of the screen. If an
event publishing system was implemented on the phone, as mentioned in the
previous bullet, this problem would be solved. Another solution would be to
be able to id the screenshot by node as opposed to by title; this means that
clustering information would need to also reside on the phone.
Despite these errors, GuiDE shows a couple promising traits. For one, successful
activity encapsulation achieves a fair amount of storage efficiency as the system logs
activities over a long list of events. Appendix A shows a snippet of a windows server
log to check messages in the inbox. The total length is actually 3235 lines in a 257kb
file. Given that we can log this same event in one line of a table that is at most 1kb,
we have achieved over a 100:1 efficiency ratio.
The system on a whole is also fairly flexible. Because GUIs are being used as
the interface to detect events and to create graphs, GuiDE could be implemented for
any platform with structured, commonly repeated actions. It would also be possible
to change the definition of nodes such that screenshots are unnecessary. As long as
the nodes represent proper clusters of tiered events, the graph algorithms still work
correctly.
45

5.2 Applications
There are a couple other applications of GuiDE besides activity recognition. As
mentioned before, by putting these activities into a log, along with events from other
services, a user can run queries over a database. "Where was I when I sent a text
message at noon?" or "Who did I meet when I was last listening to music?"
Another application is that GuiDE's graph information can be used as a tool to
analyze a platform's usability. For example, if the graph depicted a fairly commonly
executed path that required a large number of keypresses, UI experts could see this
and attempt to have the commonly used application moved up to somewhere more
easily accessed.
5.3 Future Work
There are many aspects of GuiDE that can still be improved upon. Here are some of
the improvements that have been left for future iterations:
" On-phone processing: Currently, both the graph building and the evaluation
of patterns is calculated offline. If both existed in some form on the phone,
the activity identification scheme could happen as an individual uses their cell
phone. The danger is how to do this without causing the phone to use too much
battery power.
" Clustering: GuiDE makes uses of a hash to identify the different screens for
both on-phone differentiation and offline graph processing. However, this only
achieves unique identification between screens and does not convey any sense
of similarity between screenshots. Proper clustering techniques would allow a
more accurate definition of nodes for the graph. This stronger definition also
makes it easier to identify screens based on their node, which would allow the
program to expand its focus area outside the title bar.
" Naming activities: Activities are right now "virtual activities", meaning that
they are not named in an understandable fashion. One possibility is to have
46
the user name the activities. Since all activities are composed of screenshots,
the screenshots can be shown to the user when an activity has achieved a high
frequency. The user can then label the activity to whatever he of she deems
appropriate. This method comes with the added benefit that the label holds
relevance to the user and can therefore be easily referred to at the appropriate
time.
" Special-case activity recognition: There are still many methods unexplored that
would increase the correlation between recognized activities. For example, al-
though the cell phone menus are built in a hierarchical fashion, not all users
make use of this hierarchy. Instead of repeatedly hitting the back button upon
completing a task, one option is to hit the "Menu" key and exit directly to the
root. Therefore, it is possible to identify paths that go straight back to the root
as being the same as the paths that go to the root through submenu screens.
* Confidence probabilities: Although the systems identifies what it does and does
not consider an activity, there is always the possibility of error. This is partic-
ularly true if the graph has not yet achieved steady state. Providing confidence
probabilities in the table would help judge the accuracy of the decision. A simple
metric for identified activities could be the average over the entire path, scaled
by its frequency. For paths identified as abnormal activities, the confidence
could be one minus the lowest probability edge.
5.4 Conclusion
In this thesis, we have implemented GuiDE, a system designed to perform automated
recognition of cell phone activities. It does this by taking screenshots of the cell
phone's GUI and aggregating the data into a graph structure. This graph then reflects
probabilities of the states for the GUI and transitions between states. The system
detects patterns within the graph by checking an incoming path's probabilities. If the
probabilities appear highly correlated (i.e. no edge falls below two standard deviations
47

from the mean), and the path appears frequently, the path is classified as a pattern.
Although no long term data could be collected without the Python platform on the
cell phone crashing, we were still able to achieve a couple insights into GUI structure.
Additionally, the flexibility offered by the system allows GuiDE to interface easily
with other platforms. Overall, although further research would need to be performed
to fully validate the system, GuiDE has laid the groundwork for a very powerful tool.
48

Appendix A
Windows Server Event Log
[start of command buffer from app 9] 0.000
RWindow[59]::Activate() 0.000
RWindow [59] ::Invalidate({{0,0},{176,144}}) 0.000
RWindow [15] ::Inquire0ff set (3) 0.000
Reply Buffer: {56,0} 0.000
[start of command buffer from app 9] 0.000
RGc[4] : :Activate(15) 0.000
RGc[4]::SetPenColor({0,0,0}) 0.000
RWindow[15] : : Invalidate({{0,0},{108,28}}) 0.000
RWindow[15] : :BeginRedraw({{0,0},{108,28}}) 0.000
RGc[4]::SetBrushStyle(1) 0.000
RGc[4]::SetBrushColor({255,255,255}) 0.000
RGc[4]::SetPenStyle(0) 0.000
RGc[4]::SetBrushStyle(1) 0.000
RGc[4]::DrawRect({{0,0},{108,28}}) 0.000
RGc[4]::GdiBlt({0,0}, {34136}, {{56,0},{164,28}}) 0.000
RGc[4]::SetPenStyle(1) 0.016
RGc[4]::SetBrushStyle(0) 0.000
RGc[4]::Reseto 0.000
RGc[4]::SetPenColor({0,0,0}) 0.000
RGc[4]::SetStrikethroughStyle(0) 0.000
RGc[4]::SetUnderlineStyle(0) 0.000
RGc[4]::SetPenColor({0,0,0}) 0.000
49

RGc[4]::SetBrushColor({255,255,255}) 0.000
RGc[4]::UseFont({0x8f80}) 0.000
RGc[4]::DrawText("Inbox", {{1,7},{105,28}}, 16, 0, 0) 0.000
RWindow[15]::EndRedraw() 0.000
RGc[4]::Deactivate() 0.000
RWindow[59]::Invalidate({{0,0},{176,144}}) 0.000
[start of command buffer from app 9] 0.000
RWindow[22]::SetVisible(EFalse) 0.000
RWindow[22]::Invalidate({{0,188},{176,208}}) 0.000
[start of command buffer from app 9] 0.000
RWsSession[1]::GetEvent(TWsEvent *aEvent) 0.000
EEventKeyUp (scanCode 167, mdfs 0x8000)
(dest 333127932, time 22/08/2006 14:20:31.42) 0.000
[start of command buffer from app 9] 0.000
RWsSession[1]::GetRedraw(TWsRedrawEvent *aEvent) 0.000
Redraw (handle 333308180): rect {{0,0},{176,144}} 0.000
[start of command buffer from app 9] 0.000
RGc[4]::Activate(59) 0.000
RWindow[59]::BeginRedraw({{0,0},{176,144}}) 0.000
RGc[4]::Reseto 0.000
RGc[60]::SetBrushColor({255,255,255}) 0.000
RGc[60]::SetPenStyle(0) 0.000
RGc[60]::SetBrushStyle(1) 0.000
RGc[60]::DrawRect({{0,0},{176,208}}) 0.000
RGc[60]::SetPenStyle(1) 0.000
RGc[60]::SetBrushStyle(0) 0.000
RGc[60]::Reset() 0.000
RGc[60]::SetBrushStyle(0) 0.000
RGc[60]::UseFont({0x70c4}) 0.000
RGc[60]::SetPenColor({0,0,0}) 0.000
RGc[60]::DrawText("No messages", {{14,34},{164,49}}, 11, 0, 27) 0.000
RGc[60]::SetBrushStyle(0) 0.000
RGc[60]::SetPenColor({0,0,0}) 0.000
RGc[60]::SetBrushStyle(1) 0.000
RWindow[59]::EndRedraw() 0.000
RGc[4]::Deactivate() 0.000
50
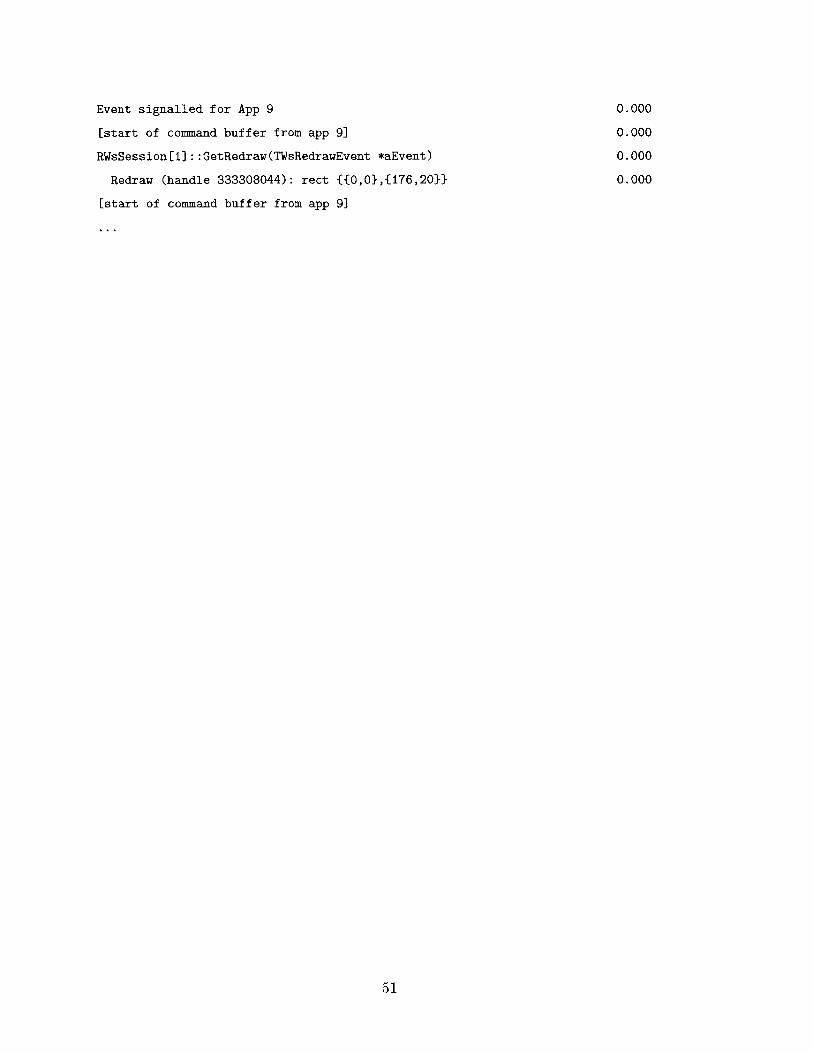
Event signalled for App 9 0.000
[start of command buffer from app 9] 0.000
RWsSession[1] ::GetRedraw(TWsRedrawEvent *aEvent) 0.000
Redraw (handle 333308044): rect {{0,0},{176,20}} 0.000
[start of command buffer from app 9]
51

52
Bibliography
[1] Robert St. Amant, Thomas E. Horton, and Frank E. Ritter. Model-based evalu-
ation of cell phone menu interaction. In Proceedings of the ACM Conference on
Human Factors in Computing Systems (CHI '04), 2004.
[2] Ian Anderson and Henk Muller. Practical activity recognition using gsm data.
Technical report, University of Bristol, U.K., 2006.
[3] Adam Cheyer, Jack Park, and Richard Giuli. Iris: Integrate. relate. infer. share.
In Workshop on The Semantic Desktop - Next Generation Personal Information
Management and Collaboration Infrastructure at the International Semantic Web
Conference (ISWC2005), 2005.
[4] Nathan Eagle and Alex (Sandy) Pentland. Reality mining: Sensing complex
social systems. Personal and Ubiquitous Computing, 10:255 - 268, March 2006.
[5] Graphviz. http://www.graphviz.org, an open source visualization project.
[6] Max Van Kleek. A framework for ubiquitously capturing users work and life
patterns. CSAIL Student Workshop submission, 2006.
[7] Lin Liao, Dieter Fox, and Henry Kautz. Location-based activity recognition
using relational markov networks. Technical report, University of Washington,
2005.
[8] Daisuke Morikawa, Masaru Honjo, Akira Yamaguchi, Satoshi Nishiyama, and
Masayoshi Ohashi. Cell-phone based user activity recognition, management and
utilization. mdm, 0:51, 2006.
53

[9] Ivo Salmre. Writing Mobile Code: Essential Software Engineering for Building
Mobile Applications, chapter 2. Addison Wesley Professional, 2005.
[10] Jianqiang Shen, Lida Li, Thomas G. Dietterich, and Jonathan L. Herlocker. A
hybrid learning system for recognizing user tasks from desktop activities and
email messages. In IUI '06: Proceedings of the 11th international conference on
Intelli- gent user interfaces, 2006.
[11] Daniel Siewiorek, Asim Smailagic, Junichi Furukawa, Neema Moraveji, Kathryn
Reiger, and Jeremy Shaffer. Sensay: A context-aware mobile phone. Technical
report, Carnegie Mellon University, 2003.
[12] Xiao Yu. Learning significant user locations with gps and gsm. Master's thesis,
MIT, 2006.
54