A microrna screen to identify regulators of peritoneal ...
9
RESEARCH ARTICLE Open Access A microrna screen to identify regulators of peritoneal fibrosis in a rat model of peritoneal dialysis Fan Lin, Xu Wu, Huidi Zhang, Xiaohan You, Zhoucang Zhang, Rongrong Shao and Chaoxing Huang * Abstract Background: Peritoneal fibrosis is a common complication in patients treated with long-term peritoneal dialysis. The aim of this study was to identify the microRNAs (miRNAs) involved in regulation of peritoneal fibrosis in a rat model of peritoneal dialysis. Methods: Twenty-four Sprague–Dawley (SD) rats were randomly allocated into three groups: (i) Control group (Cg, n = 8); (ii) Saline group (Sg, n = 8): daily intraperitoneal injection with 0.9% normal saline; (iii) Hypertonic dialysate group (HDg, n = 8): daily intraperitoneal injection with 4.25% peritoneal dialysis solution. Rats were sacrificed after four weeks for histological evaluation of peritoneal membrane and the expression of α-SMA and COL-1. A miRNA screen was performed using microarray analysis to identify differentially expressed miRNAs, which were then validated by real-time PCR. Results: Compared with the control and the saline groups, hypertonic dialysate group showed impaired peritoneal function accompanied by a spectrum of morphological changes including thicker peritoneal membrane, higher collagen deposition, infiltration of mononuclear cells and neovascularization in the peritoneum. Increased mRNA and protein levels of α-SMA and COL-1 were observed in hypertonic dialysate group, indicating the progression of peritoneal fibrosis. The miRNA screen identified 8 significantly down-regulated miRNAs (miR-31, miR-93, miR-100, miR-152, miR-497, miR-192, miR-194 and miR-200b) and one highly up-regulated miRNA (miR-122) in the hypertonic dialysate group. The results were confirmed by real-time PCR. Conclusions: Altered miRNA expression in peritoneum was found in the rat model of peritoneal fibrosis, indicating that these miRNAs may be associated with pathogenesis of peritoneal fibrosis. Keywords: Peritoneal fibrosis, miRNA, Peritoneal dialysis, Epithelial-to-mesenchymal transition Background Peritoneal dialysis (PD) has been adopted worldwide as a renal replacement treatment for patients with chronic kidney disease. It has been used as an alternative to hemodialysis due to its advantages in controlling blood pressure and maintaining electrolyte balance [1,2]. In addition, PD does not require routine visits to a hospital or medical facility and thus offers a better quality of life and lower cost to the patients [3,4]. However, long-term PD is usually associated with development of structural and functional alterations in the peritoneal membrane [5,6]. Several risk factors for development of peritoneal fibrosis in PD patients have been implicated, including the bioincompatibility of hyperglycemic PD solutions, recurrent peritonitis, and increased concentration of growth factors such as FGF-2, TGF-β, CTGF, VEGF, etc. [7,8]. These factors may result in changes in the morphology of the peritoneal mesothelial cells and sediment of the extracellular matrix in peritoneum, and those changes ultimately lead to peritoneal fibrosis and ultrafiltration failure. Therefore, prevention and treatment of peritoneal fibrosis are critical to maintain the peritoneal membrane integrity and prolong PD treatment in patients. Recent studies have demonstrated that the anti-fibrogenic strategies, such as development of a more biocompatible * Correspondence: [email protected] Department of Nephrology, The First Affiliated Hospital of Wenzhou Medical University, 2 Fuxuexiang Street, Wenzhou, Zhejiang 325000, China © 2015 Lin et al. Open Access This article is distributed under the terms of the Creative Commons Attribution 4.0 International License (http://creativecommons.org/licenses/by/4.0/), which permits unrestricted use, distribution, and reproduction in any medium, provided you give appropriate credit to the original author(s) and the source, provide a link to the Creative Commons license, and indicate if changes were made. The Creative Commons Public Domain Dedication waiver (http://creativecommons.org/publicdomain/zero/1.0/) applies to the data made available in this article, unless otherwise stated. Lin et al. BMC Nephrology (2015) 16:48 DOI 10.1186/s12882-015-0039-z
Transcript of A microrna screen to identify regulators of peritoneal ...

Lin et al. BMC Nephrology (2015) 16:48 DOI 10.1186/s12882-015-0039-z
RESEARCH ARTICLE Open Access
A microrna screen to identify regulators ofperitoneal fibrosis in a rat model ofperitoneal dialysis
Fan Lin, Xu Wu, Huidi Zhang, Xiaohan You, Zhoucang Zhang, Rongrong Shao and Chaoxing Huang*Abstract
Background: Peritoneal fibrosis is a common complication in patients treated with long-term peritoneal dialysis.The aim of this study was to identify the microRNAs (miRNAs) involved in regulation of peritoneal fibrosis in a ratmodel of peritoneal dialysis.
Methods: Twenty-four Sprague–Dawley (SD) rats were randomly allocated into three groups: (i) Control group(Cg, n = 8); (ii) Saline group (Sg, n = 8): daily intraperitoneal injection with 0.9% normal saline; (iii) Hypertonic dialysategroup (HDg, n = 8): daily intraperitoneal injection with 4.25% peritoneal dialysis solution. Rats were sacrificed after fourweeks for histological evaluation of peritoneal membrane and the expression of α-SMA and COL-1. A miRNA screenwas performed using microarray analysis to identify differentially expressed miRNAs, which were then validated byreal-time PCR.
Results: Compared with the control and the saline groups, hypertonic dialysate group showed impaired peritonealfunction accompanied by a spectrum of morphological changes including thicker peritoneal membrane, higher collagendeposition, infiltration of mononuclear cells and neovascularization in the peritoneum. Increased mRNA and proteinlevels of α-SMA and COL-1 were observed in hypertonic dialysate group, indicating the progression of peritoneal fibrosis.The miRNA screen identified 8 significantly down-regulated miRNAs (miR-31, miR-93, miR-100, miR-152, miR-497,miR-192, miR-194 and miR-200b) and one highly up-regulated miRNA (miR-122) in the hypertonic dialysate group.The results were confirmed by real-time PCR.
Conclusions: Altered miRNA expression in peritoneum was found in the rat model of peritoneal fibrosis, indicating thatthese miRNAs may be associated with pathogenesis of peritoneal fibrosis.
Keywords: Peritoneal fibrosis, miRNA, Peritoneal dialysis, Epithelial-to-mesenchymal transition
BackgroundPeritoneal dialysis (PD) has been adopted worldwide as arenal replacement treatment for patients with chronickidney disease. It has been used as an alternative tohemodialysis due to its advantages in controlling bloodpressure and maintaining electrolyte balance [1,2]. Inaddition, PD does not require routine visits to a hospitalor medical facility and thus offers a better quality of lifeand lower cost to the patients [3,4]. However, long-termPD is usually associated with development of structuraland functional alterations in the peritoneal membrane
* Correspondence: [email protected] of Nephrology, The First Affiliated Hospital of Wenzhou MedicalUniversity, 2 Fuxuexiang Street, Wenzhou, Zhejiang 325000, China
© 2015 Lin et al. Open Access This article isInternational License (http://creativecommoreproduction in any medium, provided youlink to the Creative Commons license, andDedication waiver (http://creativecommonsarticle, unless otherwise stated.
[5,6]. Several risk factors for development of peritonealfibrosis in PD patients have been implicated, includingthe bioincompatibility of hyperglycemic PD solutions,recurrent peritonitis, and increased concentration of growthfactors such as FGF-2, TGF-β, CTGF, VEGF, etc. [7,8].These factors may result in changes in the morphology ofthe peritoneal mesothelial cells and sediment of theextracellular matrix in peritoneum, and those changesultimately lead to peritoneal fibrosis and ultrafiltrationfailure. Therefore, prevention and treatment of peritonealfibrosis are critical to maintain the peritoneal membraneintegrity and prolong PD treatment in patients. Recentstudies have demonstrated that the anti-fibrogenicstrategies, such as development of a more biocompatible
distributed under the terms of the Creative Commons Attribution 4.0ns.org/licenses/by/4.0/), which permits unrestricted use, distribution, andgive appropriate credit to the original author(s) and the source, provide aindicate if changes were made. The Creative Commons Public Domain.org/publicdomain/zero/1.0/) applies to the data made available in this

Lin et al. BMC Nephrology (2015) 16:48 Page 2 of 9
PD solution, treatment of TGF-β-inhibiting proteoglycanand inhibition of the renin-angiotensin system, have thepotential to attenuate or prevent the onset of peritonealfibrosis in multiple animal models [9-12].miRNAs are 19 to 25-nucleotide, non-coding RNA
transcripts, and thought to be instrumental in controllingeukaryotic cell functions by modulating the post-transcriptional activity of target mRNAs throughtranslational repression or mRNA degradation [13,14].Because of the sophisticated roles miRNAs play inregulating various basic cellular processes such asproliferation, differentiation and apoptosis, dysregulationof miRNAs has been associated with a wide spectrum ofhuman malignancies [15,16]. Recently, the involvement ofmiRNAs in different fibrotic disorders, including systemicsclerosis, liver cirrhosis, cardiac fibrosis and idiopathicpulmonary fibrosis, has attracted a considerable amountof attention [17-22]. There is accumulating evidence thatshows the miRNA-regulated epithelial-to-mesenchymaltransition (EMT) in human peritoneal mesothelial cells,which has been indicated by previous research as a keymechanism for the development and progression ofperitoneal fibrosis [23-25]. Furthermore, recent studieshave discovered the enrichment of specific extracellularmiRNAs in peritoneal dialysis effluent, implying thepotential of those miRNAs as diagnostic biomarkers[26-28]. More direct evidence comes from a studyusing a mouse model of peritoneal dialysis, in whichmicroRNA-29 (miR-29) was identified to be aninhibitor of peritoneal fibrosis through suppression ofTGF-β signaling pathway [29]. Therefore, it will begreat interest to perform a comprehensive miRNAscreen to identify additional regulatory candidatesand examine their roles in pathogenesis of peritonealfibrosis.In this study, we performed an extensive screen to
identify miRNAs with potential regulatory function inperitoneal fibrosis using a rat PD model. This study setthe foundation for further exploration of the miRNAmachinery in peritoneal fibrosis and for development oftargeted therapy in PD patients.
MethodsAnimalsMale SD rats weighing 140 to 160 g were purchasedfrom SLAC Laboratory Animals Co (Shanghai, China).They were allowed to acclimatize for 1 week before thebeginning of the experiment. Animals were maintainedunder specific pathogen free (SPF) conditions and allowedfree access to food and water. All animal experiments inthis study were approved by the Animal Care Committee ofthe Wenzhou Medical College of China (SCXK2007-0005)and conducted in accordance with “Recommendationson the Establishment of Animal Experimental Guidelines”
approved at the 80th General Assembly of the JapaneseScience Council in 1980.Twenty-four SD rats were randomly divided into three
groups: (i) Control group (Cg, n = 8); (ii) Saline group(Sg, n = 8): daily intraperitoneal injection with 0.9%normal saline; (iii) Hypertonic dialysate group (HDg, n = 8):daily intraperitoneal injection with 4.25% peritoneal dialysissolution (Baxter HealthCare, Deerfield, IL, USA). Thevolume of saline and 4.25% peritoneal dialysis solutionsused in daily injection was 20 ml. The duration of treat-ment was four weeks for establishment of peritoneal fibro-sis, which was determined by earlier studies and ourprevious observation [30,31].
Peritoneal function test and sample collectionAfter four weeks of treatment, a 2-hour peritonealequilibration test (PET) was performed. During eachPET, rats were given 20 ml of 4.25% glucose peritonealdialysis solution (PDS) via a 20-gauge needle into theperitoneal cavity. Dialysate samples (1 ml) were taken at2 hours after infusion. Blood samples were taken fromthe inferior vena cava at the end of the PET. During thePET, animals were awake and had free access to waterand food.The dialysate and blood samples were centrifuged and
stored at −20°C until assayed. Concentrations of creatinineand glucose in serum and dialysate were measured byenzymatic methods using a Hitachi 7600–110 AutomatedBiochemistry analyzer (Hitachi, Tokyo, Japan). Net ultrafil-tration (UF) was determined as the volume of fluidremoved after the 2-hour PET subtracted by the volumeof fluid administered. The efficiency of solute transportacross the peritoneal membrane was determined byglucose reabsorption (D2/D0, concentration of glucose indialysate at 2 hours relative to that in the infused dialysissolution) and creatinine transport (D/Purea, dialysate toplasma concentration ratio of creatinine at 2 hours).Following sample collection, all rats were sacrificed by
bleeding from the abdomen. The peritoneal cavity wasopened with minimal handling or trauma, and tissues ofthe visceral and parietal peritoneum were taken for furthermeasurement.
Cytologic examination and histologyWhite blood cell count in peritoneal effluent was obtainedusing an Olympus CX31 microscope (Olympus, Tokyo,Japan).Each peritoneum was fixed with 4% paraformaldehyde
solution and processed for paraffin embedding. Tissuesections (4 μm) were then stained with hematoxylin andeosin and Masson’s trichrome stain for histologicalexamination of peritoneal mesothelial cells, thickness ofthe peritoneal tissues, inflammatory cell infiltration, and

Lin et al. BMC Nephrology (2015) 16:48 Page 3 of 9
small vascular proliferation using an Olympus CX31microscope.
Immunohistochemical staining of the peritoneumFor immunohistochemistry (IHC), tissue sections weredeparaffinized, rehydrated, and incubated with 3%hydrogen peroxide to inhibit the activity of endogenousperoxidase. The sections were then incubated with primaryantibodies against α-SMA and COL-1 (Abcam, Cambridge,MA, USA) overnight at 4°C. On the next day, the sectionswere incubated with biotin-conjugated secondaryantibodies, followed by incubation with horseradishperoxidase (HRP)-conjugated streptavidin. The resultantprimary-secondary antibodies-biotin-streptavidin-HPR com-plex was then stained with diaminobenzidine (DAB),which led to reddish-brown stains representing positiveimmunoreactions. The reaction was interrupted by rinsingwith distilled water. Samples were then contrasted withMayer hematoxylin and examined using an opticphotomicroscope at a magnification of 400X. To include anegative control, phosphate buffered saline (PBS) wasused in place of the primary antibodies. For each tissuesection, 10 different images were randomly selected andanalyzed by semi-quantitative assessment using theImage-Pro Plus 6.0 software (Media Cybernetics, Inc.,Rockville, MD, USA). The mean optical density wascalculated by the overall optical density from all positivestaining divided by total area.
RNA extraction and quality determinationTotal RNA was extracted from the peritoneum of ratsusing the Trizol Reagent according to the manufacturer’sinstructions (Invitrogen, Grand Island, NY, USA). TheRNA concentration and purity were determined using aVarioskan Flash Multimode Reader (Thermo Scientific,Waltham, MA, USA). The concentration of total RNA(μg/ml) was calculated using the formula: OD260 Xdilution factor X 40 μg/ml. An OD260/280 ratio between1.9 and 2.1 was considered an indication of high qualityRNA, thereby making the RNA sample suitable for geneexpression analysis. RNA integrity was also assessed usingthe Agilent 2100 Bioanalyzer (Agilent Technologies, SantaClara, CA, USA), which detected the integrity of 18S and28S RNA peaks.
Microarray analysisFor each sample, 500 ng of total RNA was labeledusing the FlashTag Biotin HSR RNA Labeling Kit andprepared for the GeneChip miRNA Arrays accordingto the manufacturer’s recommendations (Genisphere,Hartfield, PA, USA).After labeling, samples were hybridized on the Affymetrix
GeneChip miRNA 2.0 Arrays (Affymetrix, Santa Clara,CA, USA) in a volume of 100 μl reaction mix at 48°C and
60 rpm for 16 hours. Immediately following hybridization,the arrays were washed and stained with streptavidin-phycoerythrin conjugates in the GeneChip Fluidics Station450. Finally, the arrays were scanned using a GeneChipScanner 3000 7G (Affymetrix).The microarray data were analyzed using the Affymetrix
GeneChip Command Console (AGCC) software. Foldchanges higher than 2 or lower than 0.5 were consideredto be significantly different between two groups.
Real-time PCR analysisRNA expression in visceral peritoneum was evaluated byreal-time PCR analysis. cDNA was synthesized from thepurified total RNA using a cDNA Reverse TranscriptionKit (Thermo Scientific) according to the manufacturer’sinstructions. cDNA was amplified using the SYBRGreen PCR Master mix in a 7500 Real-Time System(Applied Biosystems, Grand Island, NY, USA). Relativeexpressions of mRNA and miRNA were calculated usingthe 7500 Real-Time System software.For miRNA, the real-time PCR reaction was maintained
at 95°C for 3 min, followed by 95°C for 5 s and 60°C for35 s for 40 cycles. For mRNA, the real-time PCR reactionwas maintained at 95°C for 3 min, followed by 95°C for 15s and 60°C for 1 min for 40 cycles. The dissociation curveswere analyzed to ensure amplification of a single PCRproduct. In order to ensure reliability of the results, allsamples were processed in triplicate. Quantificationwas performed by the comparative cycle threshold(Ct) method [32]. To normalize the data, the GAPDHmRNA and the U6 miRNA were used as housekeepinggenes. The sequences of PCR primers are listed inAdditional files 1 and 2.
Statistical analysisStatistical analysis was performed using the SPSS 18software (IBM, Armonk, New York, USA). All numericalresults were expressed as the mean ± standard deviation(SD). Comparison between groups was made by one-wayanalysis of variance (ANOVA). Pairwise comparison wasmade by Tamhane’s T2 test. A value of P <0.05 wasconsidered statistically significant.
ResultsHypertonic dialysate group had reduced ultrafiltrationcapacityNet ultrafiltration (UF) was measured in a 2-hour PETafter four weeks of dialysis treatment. Compared withthe control group and the normal saline group, thehypertonic dialysate group showed significantly reduced UFcapacity and glucose reabsorption (D2/D0) while increaseddialysate-to-plasma urea ratio (D/Purea) (all P <0.05)(Table 1). These results indicated that the peritoneal

Table 1 Peritoneal function test in three groups after fourweeks treatment
Groups N UF (ml) D2/D0 D/Purea
Control 8 27.97 ± 1.11 0.28 ± 0.04 0.12 ± 0.03
Saline 8 28.40 ± 0.95 0.27 ± 0.03 0.12 ± 0.05
Hypertonic dialysate 8 10.53 ± 0.75*# 0.14 ± 0.02*# 0.42 ± 0.05*#
*compared with the control group, P <0.05.#compared with the saline group, P <0.05.
Lin et al. BMC Nephrology (2015) 16:48 Page 4 of 9
function was greatly impaired following long-term peri-toneal dialysis.
Hypertonic dialysate group showed morphologicalchanges of peritoneumWhite blood cell count in peritoneal effluent wasmeasured for signs of inflammation and peritonitis. In
Masson’s trichrome
H&E
α-SMA
COL-1
Normal
Figure 1 Histological examination of rat peritoneum and expression of α-Sstaining (original magnification: X200) of peritoneum isolated from the cdialysate group (C1). (A2, B2 and C2) Masson’s trichrome staining (origigroup (A2), the normal saline group (B2), and the hypertonic dialysate groupthe hypertonic dialysate group had increased collagen deposition compa(original magnification: X400) of peritoneum from the control group (A3),(C3). (A4, B4 and C4) COL-1 staining (original magnification: X400) of per(B4), and the hypertonic dialysate group (C4).
all three groups, the white blood cell count was lower than100/mm3 when examined using an optic microscope, indi-cating that no rats in three groups developed peritonitis.To assess the potential structural change induced
by hypertonic dialysis in the peritoneal membrane,histological examination was performed in tissue sam-ples of peritoneum obtained from the three groups.The peritoneal membrane in the control and salinegroups appeared as a monolayer of mesothelial cells(Figure 1,A1 and B1). However, the peritoneum wasthicker and appeared more edematous in the hypertonicdialysate group (Figure 1,C1). Mononuclear cell infiltration,fibroblastic activation, neovascularization and interstitialedema were more prominent in the hypertonic dialysategroup than in the control and saline groups. The re-sults from Masson’s trichrome staining showed that
Saline Hypertonic dialysate
MA and COL-1 after four weeks treatment. (A1, B1 and C1) H&Eontrol group (A1), the normal saline group (B1), and the hypertonicnal magnification: X200) of parietal peritoneum isolated from the control(C2). Collagen was stained green. Note that the peritoneum fromred with the other two groups. (A3, B3 and C3) α-SMA stainingthe normal saline group (B3), and the hypertonic dialysate groupitoneum from the control group (A4), the normal saline group

Lin et al. BMC Nephrology (2015) 16:48 Page 5 of 9
the collagen deposition was significantly higher andthe peritoneal membrane was much thicker in thehypertonic dialysate group than in the control and salinegroups (Figure 1,A2,B2 and C2).
Hypertonic dialysate group had increased expression ofEMT markersDuring peritoneal fibrosis, mesothelial cells acquire afibroblast-like phenotype in a process called EMT, whichis critical in driving changes in extracellular matrix.Alpha-smooth muscle actin (α-SMA) and type I collagen(COL-1) are mesenchymal markers, the expression ofwhich corresponds to morphological changes in theperitoneum [33,34]. α-SMA (Figure 1,A3,B3 and C3) andCOL-1 (Figure 1,A4,B4 and C4) were highly expressedin the peritoneal mesothelial cells, peritoneal mesothe-lium matrix, infiltrated inflammatory cells, and vascularendothelial cells in the hypertonic dialysate group.When using the semi-quantitative imaging software toanalyze the staining intensity, the hypertonic dialysategroup showed significantly higher expression of α-SMAand COL-1 compared with the control and saline groups(all P <0.05) (Table 2). No significant differences in expres-sion of α-SMA and COL-1 between the control and salinegroups were observed (all P >0.05). The results from IHCwere further validated in mRNA level by real-time PCR.Consistently, α-SMA and COL-1 levels showed no signifi-cant differences between the control and saline groups(all P >0.05) (Figure 2). In contrast, expression of α-SMA and COL-1 were both up-regulated in thehypertonic dialysate group (all P <0.05) (Figure 2).Additional EMT marker vimentin [35] was also investi-gated, and highly up-regulated expression was observedin the hypertonic dialysate group (Figure 2). These resultsdemonstrated that the progression of peritoneal fibrosiswas accompanied by morphological changes and develop-ment of EMT in rat peritoneum treated with hypertonicdialysate.
Microarray analysis identified differentially expressedmiRNAsAn extensive miRNA screen was performed to identifymiRNAs which were differentially regulated during theprocess of peritoneal fibrosis. The results were analyzed
Table 2 Expression of α-SMA and COL-1 (measured bymean optical density) after four weeks treatment
Groups α-SMA COL-1
Control 0.0222 ± 0.0114 0.0433 ± 0.0058
Saline 0.0454 ± 0.0090† 0.0509 ± 0.0015†
Hypertonic dialysate 0.1464 ± 0.0052*# 0.1379 ± 0.0037*#
*Compared with the control group, P <0.05.#Compared with the saline group, P <0.05.†Compared with the control group, P >0.05.
by making comparisons between the hypertonic dialysateand saline groups, between the hypertonic dialysate andcontrol groups, and between the saline and controlgroups. It was found that 8 miRNAs were significantly andconsistently down-regulated in the hypertonic dialysategroup (miR-31, miR-93, miR-100, miR-152, miR-497,miR-192, miR-194 and miR-200b), and within whichmiR-192, miR-194 and miR-200b were also down-regulatedin the normal saline group (Table 3). Significantly increasedexpression of miR-122 was observed in the hypertonicdialysate group compared with the saline and controlgroups (Table 3).
Real-time PCR analysis validated the results frommicroarrayRelative expression of the miRNAs identified frommicroarray analysis was measured by real-time PCR. Theresults demonstrated that in the hypertonic dialysategroup, miR-31, miR-93, miR-100, miR-152, miR-497,miR-192, miR-194 and miR-200b were all significantlydown-regulated whereas miR-122 was highly up-regulated(all P <0.05) (Figure 3). These results were consistent withthose from microarray analysis. However, no significant dif-ferences in miRNA expression were observed between thecontrol and normal saline groups (all P >0.05) (Figure 3).
DiscussionIn the present study, a rat model of peritoneal fibrosiswas successfully established through daily intraperitonealinjection of 4.25% hypertonic dialysate for 4 weeks. Thismodel has been widely used in numerous previous studiesand provides valuable information needed to understandthe pathological process of peritoneal fibrosis induced byperitoneal dialysis fluid [30,31]. Compared to the peritonealdialysis performed through abdominal cavity intubationwith a catheter, intraperitoneal injection of dialysate hasmany advantages such as lower cost, higher feasibility andreduced risk of developing exit site infection. In order toassess the potential impact of peritoneal mechanical injurycaused by daily injection, a saline group in which the ratsreceived daily peritoneal injection of saline solutions wasused and compared to the untreated control group.Our results showed that there were no significantdifferences in all the indicators of peritoneal fibrosisbetween saline and untreated control groups, suggest-ing that the peritoneal mechanical injury was not aconfounding factor in our study.Progression of dialysis-induced peritoneal fibrosis in
our rat model led to impaired peritoneal function,which was indicated by reduced ultrafiltration capacity, de-creased glucose reabsorption (D2/D0) and higher dialysate-to-plasma urea ratio (D/Purea). During the histologicalexamination, we observed thicker peritoneal membraneand higher collagen deposition. Pathogenesis of peritoneal

Figure 2 Relative expression of α-SMA, COL-1 and vimentin in visceral peritoneum after four weeks treatment. Relative mRNA expression (%)of α-SMA, COL-1 and vimentin was measured by real-time PCR analysis and comparisons were made between the control, normal saline andhypertonic dialysate groups. The results are presented as mean ± SD from 3 independent experiments. The differences in expression of α-SMA,COL-1 and vimentin between the saline group and the hypertonic dialysate group were significant (all P <0.05).
Lin et al. BMC Nephrology (2015) 16:48 Page 6 of 9
fibrosis is accompanied by a series of cellular changesincluding mononuclear cell infiltration, fibroblasticactivation, neovascularization and interstitial edema,and all these changes were more prominent in thehypertonic dialysate group. The expression levels ofα-SMA, COL-1 and vimentin were all markedly higher inthe hypertonic dialysate group, indicating that the peritonealmesothelial cells had acquired a mesenchymal phenotypethrough the process of EMT and had enhanced productionof extracellular matrix components [36]. In an effort toidentify potential regulators of peritoneal fibrosis, a miRNAscreen was performed, which represented a parallel andhigh-throughput method of detecting hundreds of miRNAssimultaneously. Quantitative real-time PCR is the goldenstandard for gene expression quantification and thus usedin our study to validate the results from microarrayanalysis [37]. Compared with the control and salinegroups, both miRNA microarray and real-time PCRanalyses demonstrated that miR-31, miR-93, miR-100,
Table 3 Change of microRNA expression by microarrayanalysis in three groups after four weeks treatment
HDg vs. Sg HDg vs. Cg Sg vs. Cg
Down-regulated Fold-change Fold-change Fold-change
rno-miR-31 0.37* 0.42* /
rno-miR-100 0.45* 0.40* /
rno-miR-93 0.45* 0.48* /
rno-miR-152 0.38* 0.40* /
rno-miR-497 0.33* 0.44* /
rno-miR-192 / 0.24* 0.28*
rno-miR-194 / 0.14* 0.12*
rno-miR-200b / 0.19* 0.27*
Up-regulated Fold-change Fold-change Fold-change
rno-miR-122 3.87* 2.49* /
*indicates significant difference between the two groups./indicates no significant difference between the two groups.
miR-152, miR-497, miR-192, miR-194 and miR-200bwere significantly down-regulated, and miR-122 washighly up-regulated in the hypertonic dialysate group.Overall, the results from microarray analysis correlatedwell with those from real-time PCR, which demonstratesthe reliability of the miRNA screen and warrants furtherinvestigation.The role of miRNAs in tissue fibrosis has been previously
studied in multiple animal models and patients withfibrotic diseases. In a mouse model of pulmonary fibrosis,miR-31 was shown to be down-regulated in the fibroblasts[38]. This result is consistent with ours in the rat model ofperitoneal fibrosis. Furthermore, miR-31 was identified as adirect modulator of integrin-α(5) and RhoA, two criticalactivators of the migratory activity of fibroblasts [38].These results provide us a clue to find out the targets ofmiR-31 in peritoneum. In patients with renal fibrosis andIgA nephropathy, the urinary miR-93 level correlated withthe degree of glomerular scarring and was regulated by theTGF-β1/SMAD3 pathway [39]. However, miR-93 wasfound to be up-regulated in patients with renal fibrosis,which is the opposite of our finding in peritoneal fibrosis.The function of miR-93 in tissue fibrosis might be context-dependent and tissue specific. The exact mechanism bywhich miR-93 regulates the development of progressiverenal and peritoneal fibrosis needs further investigation.Decreased expression of miR-192 was detected in patientswith established diabetic nephropathy, and its expressionlevel correlated with the degree of tubulointerstitial fibrosis[40]. However, opposite results were shown in a kidneydisease model of obstructive nephropathy, in which over-expression of Smad7 inhibited the expression of miR-192and resulted in suppression of renal fibrosis [41]. Furtherstudies are needed to elucidate how miR-192 exhibits itsinhibitory activity on peritoneal fibrosis. miR-194 has beenassociated with liver fibrosis in a rat model. It was found tobe down-regulated in fibrotic liver, similar as we observedin peritoneal fibrosis [42]. Introduction of miR-194 in
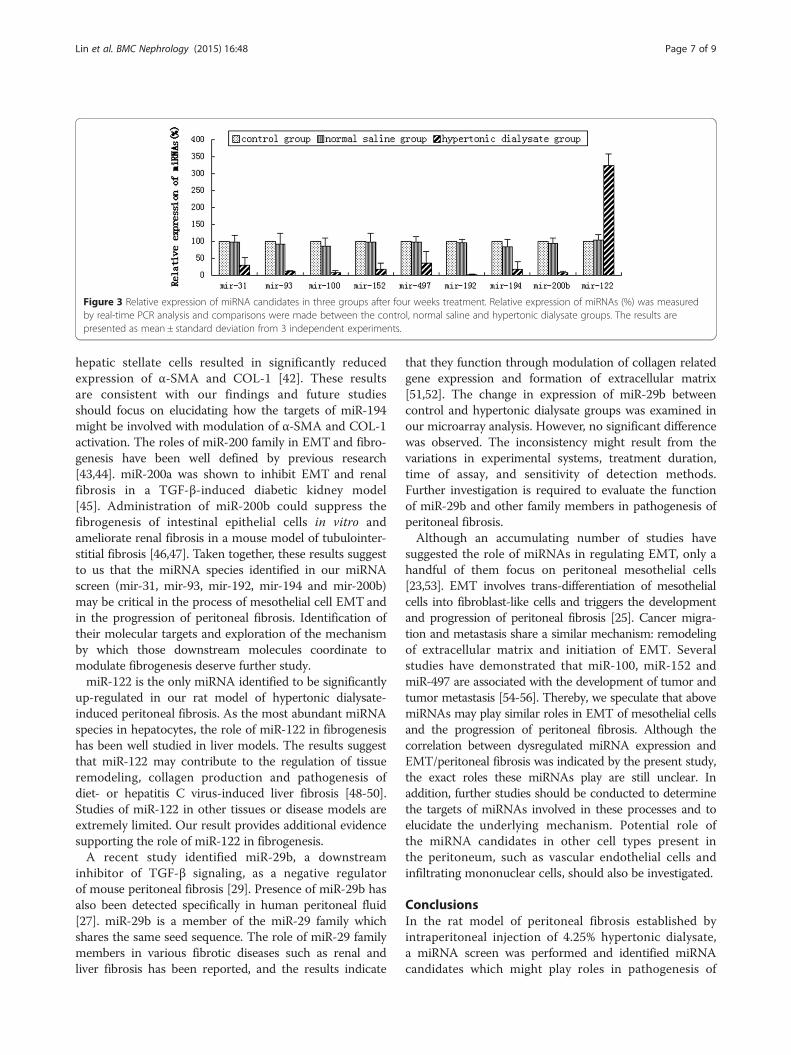
Figure 3 Relative expression of miRNA candidates in three groups after four weeks treatment. Relative expression of miRNAs (%) was measuredby real-time PCR analysis and comparisons were made between the control, normal saline and hypertonic dialysate groups. The results arepresented as mean ± standard deviation from 3 independent experiments.
Lin et al. BMC Nephrology (2015) 16:48 Page 7 of 9
hepatic stellate cells resulted in significantly reducedexpression of α-SMA and COL-1 [42]. These resultsare consistent with our findings and future studiesshould focus on elucidating how the targets of miR-194might be involved with modulation of α-SMA and COL-1activation. The roles of miR-200 family in EMT and fibro-genesis have been well defined by previous research[43,44]. miR-200a was shown to inhibit EMT and renalfibrosis in a TGF-β-induced diabetic kidney model[45]. Administration of miR-200b could suppress thefibrogenesis of intestinal epithelial cells in vitro andameliorate renal fibrosis in a mouse model of tubulointer-stitial fibrosis [46,47]. Taken together, these results suggestto us that the miRNA species identified in our miRNAscreen (mir-31, mir-93, mir-192, mir-194 and mir-200b)may be critical in the process of mesothelial cell EMT andin the progression of peritoneal fibrosis. Identification oftheir molecular targets and exploration of the mechanismby which those downstream molecules coordinate tomodulate fibrogenesis deserve further study.miR-122 is the only miRNA identified to be significantly
up-regulated in our rat model of hypertonic dialysate-induced peritoneal fibrosis. As the most abundant miRNAspecies in hepatocytes, the role of miR-122 in fibrogenesishas been well studied in liver models. The results suggestthat miR-122 may contribute to the regulation of tissueremodeling, collagen production and pathogenesis ofdiet- or hepatitis C virus-induced liver fibrosis [48-50].Studies of miR-122 in other tissues or disease models areextremely limited. Our result provides additional evidencesupporting the role of miR-122 in fibrogenesis.A recent study identified miR-29b, a downstream
inhibitor of TGF-β signaling, as a negative regulatorof mouse peritoneal fibrosis [29]. Presence of miR-29b hasalso been detected specifically in human peritoneal fluid[27]. miR-29b is a member of the miR-29 family whichshares the same seed sequence. The role of miR-29 familymembers in various fibrotic diseases such as renal andliver fibrosis has been reported, and the results indicate
that they function through modulation of collagen relatedgene expression and formation of extracellular matrix[51,52]. The change in expression of miR-29b betweencontrol and hypertonic dialysate groups was examined inour microarray analysis. However, no significant differencewas observed. The inconsistency might result from thevariations in experimental systems, treatment duration,time of assay, and sensitivity of detection methods.Further investigation is required to evaluate the functionof miR-29b and other family members in pathogenesis ofperitoneal fibrosis.Although an accumulating number of studies have
suggested the role of miRNAs in regulating EMT, only ahandful of them focus on peritoneal mesothelial cells[23,53]. EMT involves trans-differentiation of mesothelialcells into fibroblast-like cells and triggers the developmentand progression of peritoneal fibrosis [25]. Cancer migra-tion and metastasis share a similar mechanism: remodelingof extracellular matrix and initiation of EMT. Severalstudies have demonstrated that miR-100, miR-152 andmiR-497 are associated with the development of tumor andtumor metastasis [54-56]. Thereby, we speculate that abovemiRNAs may play similar roles in EMT of mesothelial cellsand the progression of peritoneal fibrosis. Although thecorrelation between dysregulated miRNA expression andEMT/peritoneal fibrosis was indicated by the present study,the exact roles these miRNAs play are still unclear. Inaddition, further studies should be conducted to determinethe targets of miRNAs involved in these processes and toelucidate the underlying mechanism. Potential role ofthe miRNA candidates in other cell types present inthe peritoneum, such as vascular endothelial cells andinfiltrating mononuclear cells, should also be investigated.
ConclusionsIn the rat model of peritoneal fibrosis established byintraperitoneal injection of 4.25% hypertonic dialysate,a miRNA screen was performed and identified miRNAcandidates which might play roles in pathogenesis of

Lin et al. BMC Nephrology (2015) 16:48 Page 8 of 9
peritoneal fibrosis. Strong correlation between alteredexpression of these miRNA candidates and epithelial-to-mesenchymal transition was also indicated. We believethat a better understanding of the roles these miRNAsplay in peritoneal fibrosis will lead to identification ofeffective diagnostic markers and therapeutic targets inpatients with progressive peritoneal fibrosis and ultra-filtration failure during long-term PD.
Additional files
Additional file 1: Sequences of primers used in real-time PCR ana-lysis of mRNA expression.
Additional file 2: Sequences of primers used in real-time PCR ana-lysis of miRNA.
AbbreviationsSD: Sprague–Dawley; SPF: Specific pathogen free; miRNA: MicroRNA;PD: Peritoneal dialysis; EMT: Epithelial-to-mesenchymal transition;PDS: Peritoneal dialysis solution; PET: Peritoneal equilibration test;UF: Ultrafiltration; PBS: Phosphate buffered saline; IHC: Immunohistochemistry;HRP: Horseradish peroxidase; SD: Standard deviation; DAB: Diaminobenzidine;AGCC: Affymetrix GeneChip Command Console; α-SMA: alpha-smooth muscleactin; COL-1: type I collagen.
Competing interestsThe authors declare that they have no competing interests.
Authors’ contributionsFL participated in the design of the study, carried out the microarrayanalysis, and drafted the manuscript. XW carried out the RT-PCR analysis.HZ participated in the establishment of rat model. XY performed histologicalanalysis. ZZ performed the peritoneal function test. RS performed thestatistical analysis. CH conceived of the study, and participated in its designand coordination and helped to draft the manuscript. All authors read andapproved the final manuscript.
AcknowledgementsThis study was supported by the Surgical Laboratory and the Animal CareCommittee of Wenzhou Medical College. This project was part of theMedical and Health Science and Technology Program of Zhejiang(No.2010KYA135).
Received: 15 December 2014 Accepted: 24 March 2015
References1. Bargman JM. Advances in peritoneal dialysis: a review. Semin Dial.
2012;25(5):545–9.2. Heaf JG, Lokkegaard H, Madsen M. Initial survival advantage of peritoneal
dialysis relative to haemodialysis. Nephrol Dial Transplant. 2002;17(1):112–7.3. Shih YC, Guo A, Just PM, Mujais S. Impact of initial dialysis modality and
modality switches on Medicare expenditures of end-stage renal diseasepatients. Kidney Int. 2005;68(1):319–29.
4. Gokal R, Figueras M, Olle A, Rovira J, Badia X. Outcomes in peritonealdialysis and haemodialysis–a comparative assessment of survival andquality of life. Nephrol Dial Transplant. 1999;14 Suppl 6:24–30.
5. Krediet RT, Struijk DG. Peritoneal changes in patients on long-term peritonealdialysis. Nat Rev Nephrol. 2013;9(7):419–29.
6. Devuyst O, Margetts PJ, Topley N. The pathophysiology of the peritonealmembrane. J Am Soc Nephrol. 2010;21(7):1077–85.
7. Pletinck A, Vanholder R, Veys N, Van Biesen W. Protecting the peritonealmembrane: factors beyond peritoneal dialysis solutions. Nat Rev Nephrol.2012;8(9):542–50.
8. Tsushima Y, Kanal E, Thomsen HS. Nephrogenic systemic fibrosis: risk factorssuggested from Japanese published cases. Br J Radiol. 2010;83(991):590–5.
9. Qi H, Xu C, Yan H, Ma J. Comparison of icodextrin and glucose solutions forlong dwell exchange in peritoneal dialysis: a meta-analysis of randomizedcontrolled trials. Perit Dial Int. 2011;31(2):179–88.
10. Bajo MA, Perez-Lozano ML, Albar-Vizcaino P, del Peso G, Castro MJ,Gonzalez-Mateo G, et al. Low-GDP peritoneal dialysis fluid (‘balance’) hasless impact in vitro and ex vivo on epithelial-to-mesenchymal transition(EMT) of mesothelial cells than a standard fluid. Nephrol Dial Transplant.2011;26(1):282–91.
11. Margetts PJ, Gyorffy S, Kolb M, Yu L, Hoff CM, Holmes CJ, et al.Antiangiogenic and antifibrotic gene therapy in a chronic infusion model ofperitoneal dialysis in rats. J Am Soc Nephrol. 2002;13(3):721–8.
12. Noh H, Ha H, Yu MR, Kim YO, Kim JH, Lee HB. Angiotensin II mediates highglucose-induced TGF-beta1 and fibronectin upregulation in HPMC throughreactive oxygen species. Perit Dial Int. 2005;25(1):38–47.
13. Bartel DP. MicroRNAs: genomics, biogenesis, mechanism, and function.Cell. 2004;116(2):281–97.
14. Sontheimer EJ, Carthew RW. Silence from within: endogenous siRNAs andmiRNAs. Cell. 2005;122(1):9–12.
15. Kloosterman WP, Plasterk RH. The diverse functions of microRNAs in animaldevelopment and disease. Dev Cell. 2006;11(4):441–50.
16. Jansson MD, Lund AH. MicroRNA and cancer. Mol Oncol. 2012;6(6):590–610.17. Vettori S, Gay S, Distler O. Role of MicroRNAs in Fibrosis. Open Rheumatol J.
2012;6:130–9.18. Wei J, Bhattacharyya S, Tourtellotte WG, Varga J. Fibrosis in systemic
sclerosis: emerging concepts and implications for targeted therapy.Autoimmun Rev. 2011;10(5):267–75.
19. Pinzani M, Rosselli M, Zuckermann M. Liver cirrhosis. Best Pract Res ClinGastroenterol. 2011;25(2):281–90.
20. Krenning G, Zeisberg EM, Kalluri R. The origin of fibroblasts and mechanismof cardiac fibrosis. J Cell Physiol. 2010;225(3):631–7.
21. Creemers EE, Pinto YM. Molecular mechanisms that control interstitialfibrosis in the pressure-overloaded heart. Cardiovasc Res. 2011;89(2):265–72.
22. Wynn TA. Integrating mechanisms of pulmonary fibrosis. J Exp Med.2011;208(7):1339–50.
23. Zhang K, Zhang H, Zhou X, Tang WB, Xiao L, Liu YH, et al. miRNA589regulates epithelial-mesenchymal transition in human peritoneal mesothelialcells. J Biomed Biotechnol. 2012;2012:673096.
24. Zhou Q, Yang M, Lan H, Yu X. miR-30a negatively regulates TGF-beta1-inducedepithelial-mesenchymal transition and peritoneal fibrosis by targeting Snai1.Am J Pathol. 2013;183(3):808–19.
25. Yanez-Mo M, Lara-Pezzi E, Selgas R, Ramirez-Huesca M, Dominguez-Jimenez C,Jimenez-Heffernan JA, et al. Peritoneal dialysis and epithelial-to-mesenchymaltransition of mesothelial cells. N Engl J Med. 2003;348(5):403–13.
26. Chen J, Kam-Tao P, Kwan BC, Chow KM, Lai KB, Luk CC, et al. Relationbetween microRNA expression in peritoneal dialysis effluent and peritonealtransport characteristics. Dis Markers. 2012;33(1):35–42.
27. Weber JA, Baxter DH, Zhang S, Huang DY, Huang KH, Lee MJ, et al. ThemicroRNA spectrum in 12 body fluids. Clin Chem. 2010;56(11):1733–41.
28. Ge Y, Xiao L, Chen X, Peng Y, Sun L, Liu F. MicroRNAs in peritoneal dialysiseffluent are promising biomarkers for peritoneal fibrosis in peritonealdialysis patients. Med Hypotheses. 2012;78(1):155–6.
29. Yu JW, Duan WJ, Huang XR, Meng XM, Yu XQ, Lan HY. MicroRNA-29b inhibitsperitoneal fibrosis in a mouse model of peritoneal dialysis. Lab Invest.2014;94(9):978–90.
30. Wieczorowska-Tobis K, Polubinska A, Breborowicz A, Oreopoulos DG.A comparison of the biocompatibility of phosphate-buffered saline anddianeal 3.86% in the rat model of peritoneal dialysis. Adv Perit Dial.2001;17:42–6.
31. Duman S, Gunal AI, Sen S, Asci G, Ozkahya M, Terzioglu E, et al. Doesenalapril prevent peritoneal fibrosis induced by hypertonic (3.86%)peritoneal dialysis solution? Perit Dial Int. 2001;21(2):219–24.
32. Livak KJ, Schmittgen TD. Analysis of relative gene expression data usingreal-time quantitative PCR and the 2(−Delta Delta C(T)) Method. Methods.2001;25(4):402–8.
33. Diez M, Musri MM, Ferrer E, Barbera JA, Peinado VI. Endothelial progenitorcells undergo an endothelial-to-mesenchymal transition-like process mediatedby TGFbetaRI. Cardiovasc Res. 2010;88(3):502–11.
34. Alipio ZA, Jones N, Liao W, Yang J, Kulkarni S, Sree Kumar K, et al. Epithelialto mesenchymal transition (EMT) induced by bleomycin or TFG(b1)/EGF inmurine induced pluripotent stem cell-derived alveolar Type II-like cells.Differentiation. 2011;82(2):89–98.

Lin et al. BMC Nephrology (2015) 16:48 Page 9 of 9
35. Mendez MG, Kojima S, Goldman RD. Vimentin induces changes in cellshape, motility, and adhesion during the epithelial to mesenchymaltransition. FASEB J. 2010;24(6):1838–51.
36. Strippoli R, Benedicto I, Perez Lozano ML, Cerezo A, Lopez-Cabrera M, delPozo MA. Epithelial-to-mesenchymal transition of peritoneal mesothelialcells is regulated by an ERK/NF-kappaB/Snail1 pathway. Dis Model Mech.2008;1(4–5):264–74.
37. Peirson SN, Butler JN, Foster RG. Experimental validation of novel andconventional approaches to quantitative real-time PCR data analysis. NucleicAcids Res. 2003;31(14):e73.
38. Yang S, Xie N, Cui H, Banerjee S, Abraham E, Thannickal VJ, et al. miR-31 is anegative regulator of fibrogenesis and pulmonary fibrosis. FASEB J.2012;26(9):3790–9.
39. Wang G, Kwan BC, Lai FM, Chow KM, Li PK, Szeto CC. Urinary miR-21, miR-29,and miR-93: novel biomarkers of fibrosis. Am J Nephrol. 2012;36(5):412–8.
40. Krupa A, Jenkins R, Luo DD, Lewis A, Phillips A, Fraser D. Loss of MicroRNA-192promotes fibrogenesis in diabetic nephropathy. J Am Soc Nephrol.2010;21(3):438–47.
41. Chung AC, Dong Y, Yang W, Zhong X, Li R, Lan HY. Smad7 suppresses renalfibrosis via altering expression of TGF-beta/Smad3-regulated microRNAs.Mol Ther. 2013;21(2):388–98.
42. Venugopal SK, Jiang J, Kim TH, Li Y, Wang SS, Torok NJ, et al. Liver fibrosiscauses downregulation of miRNA-150 and miRNA-194 in hepatic stellatecells, and their overexpression causes decreased stellate cell activation.Am J Physiol Gastrointest Liver Physiol. 2010;298(1):G101–6.
43. Yang S, Banerjee S, de Freitas A, Sanders YY, Ding Q, Matalon S, et al.Participation of miR-200 in pulmonary fibrosis. Am J Pathol.2012;180(2):484–93.
44. Xiong M, Jiang L, Zhou Y, Qiu W, Fang L, Tan R, et al. The miR-200 familyregulates TGF-beta1-induced renal tubular epithelial to mesenchymaltransition through Smad pathway by targeting ZEB1 and ZEB2 expression.Am J Physiol Renal Physiol. 2012;302(3):F369–79.
45. Wang B, Koh P, Winbanks C, Coughlan MT, McClelland A, Watson A, et al.miR-200a Prevents renal fibrogenesis through repression of TGF-beta2expression. Diabetes. 2011;60(1):280–7.
46. Chen Y, Ge W, Xu L, Qu C, Zhu M, Zhang W, et al. miR-200b is involved inintestinal fibrosis of Crohn’s disease. Int J Mol Med. 2012;29(4):601–6.
47. Oba S, Kumano S, Suzuki E, Nishimatsu H, Takahashi M, Takamori H, et al.miR-200b precursor can ameliorate renal tubulointerstitial fibrosis. PLoS One.2010;5(10):e13614.
48. Csak T, Bala S, Lippai D, Satishchandran A, Catalano D, Kodys K, et al.microRNA-122 regulates hypoxia-inducible factor-1 and vimentin inhepatocytes and correlates with fibrosis in diet-induced steatohepatitis.Liver Int. 2015;35(2):532–41.
49. Li J, Ghazwani M, Zhang Y, Lu J, Fan J, Gandhi CR, et al. miR-122 regulatescollagen production via targeting hepatic stellate cells and suppressingP4HA1 expression. J Hepatol. 2013;58(3):522–8.
50. Estrabaud E, Lapalus M, Broet P, Appourchaux K, De Muynck S, Lada O, et al.Reduction of microRNA 122 expression in IFNL3 CT/TT carriers and duringprogression of fibrosis in patients with chronic hepatitis C. J Virol.2014;88(11):6394–402.
51. Liu Y, Taylor NE, Lu L, Usa K, Cowley Jr AW, Ferreri NR, et al. Renal medullarymicroRNAs in Dahl salt-sensitive rats: miR-29b regulates several collagensand related genes. Hypertension. 2010;55(4):974–82.
52. Roderburg C, Urban GW, Bettermann K, Vucur M, Zimmermann H,Schmidt S, et al. Micro-RNA profiling reveals a role for miR-29 in humanand murine liver fibrosis. Hepatology. 2011;53(1):209–18.
53. Mongroo PS, Rustgi AK. The role of the miR-200 family in epithelial-mesenchymaltransition. Cancer Biol Ther. 2010;10(3):219–22.
54. Huang L, Lin JX, Yu YH, Zhang MY, Wang HY, Zheng M. Downregulation ofsix microRNAs is associated with advanced stage, lymph node metastasisand poor prognosis in small cell carcinoma of the cervix. PLoS One.2012;7(3):e33762.
55. Tsuruta T, Kozaki K, Uesugi A, Furuta M, Hirasawa A, Imoto I, et al. miR-152 isa tumor suppressor microRNA that is silenced by DNA hypermethylation inendometrial cancer. Cancer Res. 2011;71(20):6450–62.
56. Li D, Zhao Y, Liu C, Chen X, Qi Y, Jiang Y, et al. Analysis of MiR-195 andMiR-497 expression, regulation and role in breast cancer. Clin Cancer Res.2011;17(7):1722–30.
Submit your next manuscript to BioMed Centraland take full advantage of:
• Convenient online submission
• Thorough peer review
• No space constraints or color figure charges
• Immediate publication on acceptance
• Inclusion in PubMed, CAS, Scopus and Google Scholar
• Research which is freely available for redistribution
Submit your manuscript at www.biomedcentral.com/submit