Introduction to EEG for non-epileptologists working in seizure prediction and dynamics
A Micro-power EEG Acquisition SoC with Integrated Seizure Detection Processor for
Continuous Patient Monitoring
Naveen Verma, Ali Shoeb, John Guttag, and Anantha Chandrakasan
Massachusetts Institute of Technology
2009 Symposium on VLSI Circuits

Epilepsy
Electrical Onset:• Abnormal EEG observed at scalp
Clinical Onset:• Convulsions causemuscle artifacts
On-scalp Field Potentials (EEG):
Clinical onset
Electrical onset
~7.5sec
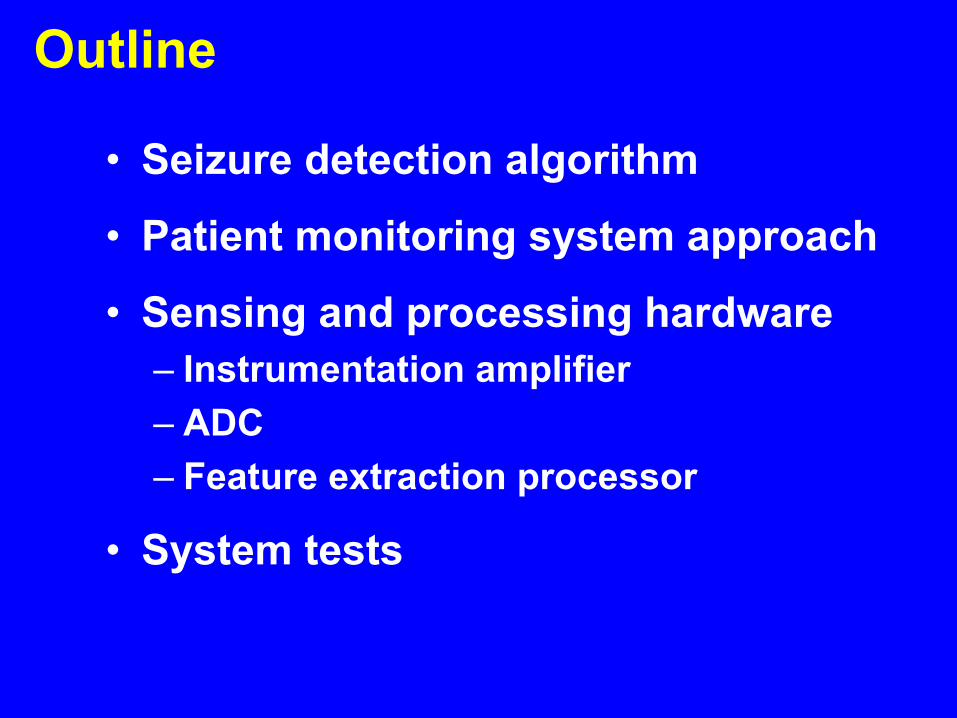
Outline
• Seizure detection algorithm
• Patient monitoring system approach
• Sensing and processing hardware– Instrumentation amplifier– ADC– Feature extraction processor
• System tests

Need for Patient-Specific Learning
Interictalburst
Patient A:
Combine spectral and (patient-specific) spatial information for high specificity
Seizure 1 onset
Excited channels

Need for Patient-Specific LearningPatient A:
Algorithm must learn patient’s seizure andbackground activity
Seizure 2 onset
Seizure 1 onset
Excited channels
Excited channels

Patient-Specific Detection Algorithm
Feature Vector
Test vector
non-seizure training vectors
seizure training vectors
SVM Classification
Support vector machine (SVM) is trained to determine optimal patient-specific decision boundary

Latency:• Specific: 6.77 ± 3.0 sec• Non-sp.: 30.1 ±1 5 sec
Specificity:• Specific: 0.3 ± 0.7 /hr• Non-sp.: 2.0 ± 5.3 /hr
Sensitivity:• Specific: 0.93• Non-sp.: 0.66
Algorithm Validation
010
2030
4050
60
1 2 3 4 5 6 7 8 9 10 11 12 13 14 15 16
0
2
4
6
1 3 5 7 9 11 13 15
00.20.40.60.8
1
1 2 3 4 5 6 7 8 9 10 11 12 13 14 15 16
Patient specific detectorNon-specific detector [Wilson’04]
Late
ncy
(sec
)Fa
lse
Ala
rms/
Hou
rSe
nsiti
vity
Patient Number
60
40
20
0
6
4201
0.6
0.2
Patient test results (Boston Children’s Hospital, 536 hours):
[Shoeb, EMBC’07]

System Approach- Wireless EEG
1808 µWTotal1733 µWRadio (CC2550)
3 µWADCs (12b, 11kS/s)72 µWInst. amps
Wireless EEG Power
Recording cables are unsafe during patient convulsions,but for wireless EEG, radio power dominates
18 Channel recording:
• Start-up: 4.8 µW• Active: 43.2kb/s*40nJ/b• Idle-mode: 0.46µW
Instrumentation amplifier
12b ADC
Rad
io I/
F

Local Feature Vector Extraction
120 µW1808 µWTotal43 µW1733 µWRadio (CC2550)2.1 µW--Digital processing3 µW3 µWADCs (12b, 11kS/s)
72 µW72 µWInst. ampsLocal feature extraction Wireless EEG
Local feature extraction reduces data rate by 43x, total system power by 14x

Inst. Amp Architecture/Needs1) Electrode offset (EO)
differential-mode2) Signal reference, 60Hz
common-mode3) 1/f noise, etc.
Chopper-stabilized LNA(gain: 40dB)
2-pole LPF(gain: 20dB)
Single-differential converter (gain: 12dB)
>10MΩ

Chopper LNA
1) Passive EO rejection enables low VDD2) Modulator at virtual ground does not load electrodes
FCHOP
RHP
IN+
IN-CIN
CFB
AC coupling passively
rejects offset
Electrode signal causes no
voltage swing at virtual ground

Chopper LNA
CIN
IN- IN+
CIN
FCHOP
M
RINT
RHP
IN+
IN-CIN
CFB
CINT
IOS,CHOP
Input modulator causes SC conductance
(→ IOS,CHOP)
GM-C Servo loop provides chopping offset current to avoid saturation through RHP
IOS,CHOP
X

Chopper LNA Op-Amp
Op-amp achieves good noise-efficiency:1) Low VDD (<1V)→ EO rejected by AC coupling2) Current of 1st diff. stage dominates→ high CL stability
Demodulate before dominant-pole:
Chopping does not limit BW
[Denison, ISSCC’07]

Inst. Amp. Measurements
10-1 100 101 102 10310-10
10-9
10-8
10-7
10-6
10-5
10-4
10-3
130nV/√Hz
Frequency (Hz)
V/√H
z
10-1 100 101 102 1030
10
20
30
40
50
60
70
Frequency (Hz)
Gai
n (d
B)
Output Response Noise (input referred)
• LNA power: 3.5µW • RIN: 700MΩ• CMRR: 60dB • Noise: 1.3µVrms (0.5-100Hz)
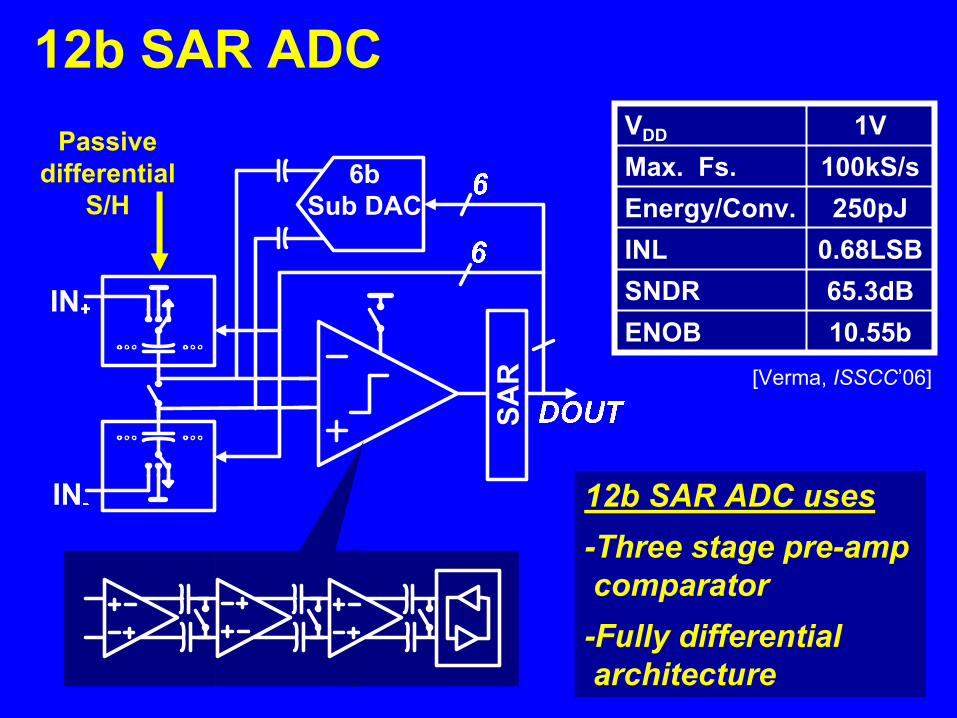
Passive differential
S/H
12b SAR ADC1VVDD
10.55bENOB65.3dBSNDR
0.68LSBINL250pJEnergy/Conv.
100kS/sMax. Fs.
[Verma, ISSCC’06]
12b SAR ADC uses-Three stage pre-amp comparator-Fully differential architecture

EEG Spectral Analysis
ω20Hz
[Gotman, EEG & ClinicalNeurophis.’81]
Need for Spectral Resolution:
0
0.2
0.4
0.6
0.8
1
2 4 6 8Number of Filters
Sens
itivi
ty
2 Filters 8 Filters
( 1117 hrs, 30 patients)

Feature Extraction Processor
48th order FIR
46th order FIR
0
-20
-40
-60 105 15 20 25 30Frequency (Hz)
Mag
nitu
de (d
B)
Modulated Filter Bank:3Hz Bandwidth
-25dB Stop-band
BPF1 (fc=0Hz) Σ I•IΣ I•IΣ I•IΣ I•IΣ I•IΣ I•IΣ I•I
BPF2 (fc=3Hz)BPF3 (fc=6Hz)BPF4 (fc=9Hz)BPF5 (fc=12Hz)BPF6 (fc=15Hz)BPF7 (fc=18Hz)
ADC Samples
(12b, 600Hz)
Feature-Vector
(112b, serial)
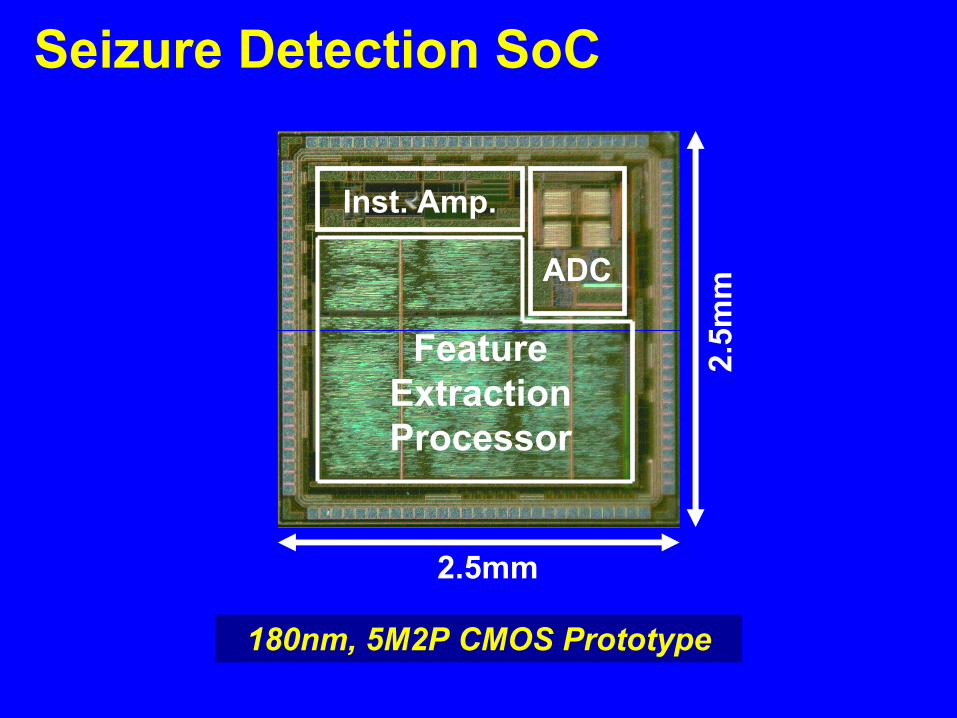
Feature Extraction Processor
Inst. Amp.
ADC
2.5mm
2.5m
m
Seizure Detection SoC
180nm, 5M2P CMOS Prototype

Performance Summary
9µJTotal energy per feature-vector0.5HzFeature vector computation rate234nJDigital energy per feature-vector65dBADC SNDR
0.68/0.66LSBADC INL/DNL100kS/sADC max. sampling rate250pJADC energy per conversion
12bADC resolution>60dBI-amp CMRR
>1VI-amp electrode offset tolerance
1.3µVrmsI-amp noise (input referred, 0.5Hz-100Hz)
>700MΩI-amp input impedance3.5µWI-amp LNA power
1VSupply voltage
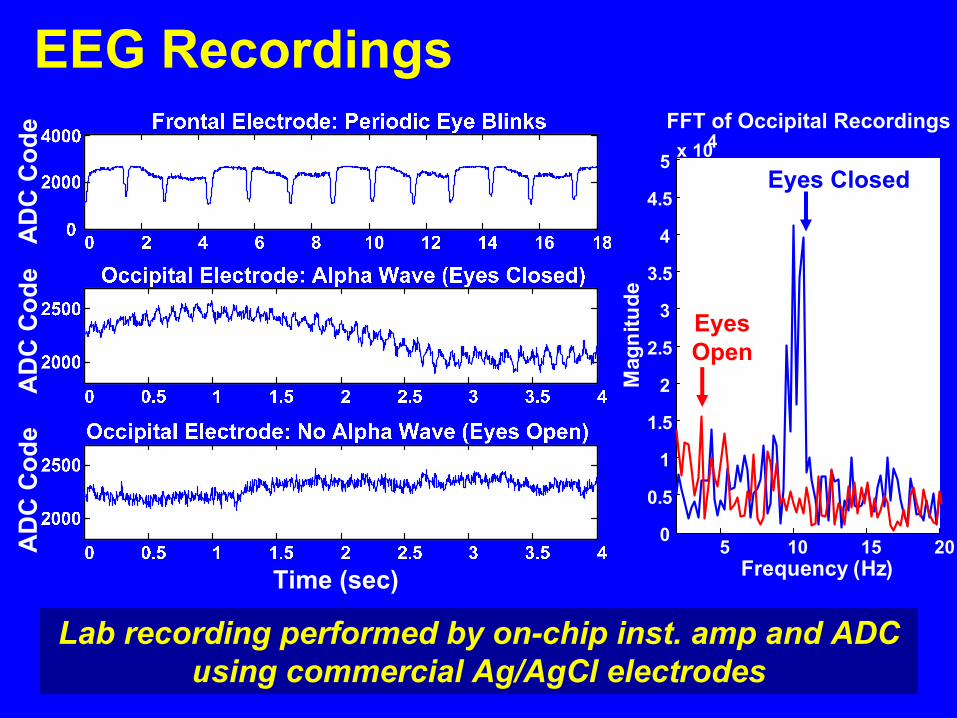
EEG Recordings
Lab recording performed by on-chip inst. amp and ADC using commercial Ag/AgCl electrodes
5 10 15 200
0.5
1
1.5
2
2.5
3
3.5
4
4.5
5 x 10⁴FFT of Occipital Recordings
Mag
nitu
de
Frequency (Hz)
Eyes Closed
Eyes Open

Feature Vector Classification
System trained to detect relaxed eyes-closed (alpha) state: <2.5sec latency observed

Conclusions
• Patient-specific learning improves seizure detection
• General importance of spectral and spatial features can be exploited to compress EEG data
• Low-power EEG acquisition requires targeted rejection mechanisms in instrumentation amp
Acknowledgements: Funding by Intel Foundation Ph.DFellowship Program and MIT CICS. IC fabrication by NSC