A Method for Choosing the Best Samples for Mars Sample Return
15
A Method for Choosing the Best Samples for Mars Sample Return Peter R. Gordon and Mark A. Sephton Abstract Success of a future Mars Sample Return mission will depend on the correct choice of samples. Pyrolysis- FTIR can be employed as a triage instrument for Mars Sample Return. The technique can thermally dis- sociate minerals and organic matter for detection. Identification of certain mineral types can determine the habitability of the depositional environment, past or present, while detection of organic matter may suggest past or present habitation. In Mars’ history, the Theiikian era represents an attractive target for life search missions and the acquisition of samples. The acidic and increasingly dry Theiikian may have been habitable and followed a lengthy neutral and wet period in Mars’ history during which life could have originated and proliferated to achieve relatively abundant levels of biomass with a wide distribution. Moreover, the sulfate minerals produced in the Theiikian are also known to be good preservers of organic matter. We have used pyrolysis-FTIR and samples from a Mars analog ferrous acid stream with a thriving ecosystem to test the triage concept. Pyrolysis-FTIR identified those samples with the greatest probability of habitability and habitation. A three-tier scoring system was developed based on the detection of (i) organic signals, (ii) carbon dioxide and water, and (iii) sulfur dioxide. The presence of each component was given a score of A, B, or C depending on whether the substance had been detected, tentatively detected, or not detected, respectively. Single-step (for greatest possible sensitivity) or multistep (for more diagnostic data) pyrolysis- FTIR methods informed the assignments. The system allowed the highest-priority samples to be catego- rized as AAA (or A*AA if the organic signal was complex), while the lowest-priority samples could be categorized as CCC. Our methods provide a mechanism with which to rank samples and identify those that should take the highest priority for return to Earth during a Mars Sample Return mission. Key Words: Mars—Astrobiology—Search for Mars’ organics—Infrared spectroscopy—Planetary habitability and biosignatures. Astrobiology 18, 556–570. 1. Introduction A ttempts to discover whether life exists or has previ- ously existed on Mars have not yet been conclusive. To seek greater certainty when reading the rock record of hab- itability and habitation on Mars, mission concepts are being proposed that involve the return of samples to Earth (McLennan et al., 2012). Once on Earth, samples of Mars can be distributed to multiple laboratories that host the most powerful analytical techniques available. The probability of successfully obtaining conclusive evidence of past or present life on Mars is inevitably influenced by the choice of sample to be returned to Earth (Sephton and Carter, 2015). Conse- quently, attention has been directed toward methods that triage the range of possible sampling opportunities on Mars to effectively select a few highest-priority samples. Environments on Mars that are believed to have been wet (Carr, 1996) are the primary locations for life searches (McLennan et al., 2012). Sedimentary features imply the presence of liquid water to produce alluvial fans (Malin and Edgett, 2000), distributary fans (Malin and Edgett, 2003; Bhattacharya et al., 2005; Lewis et al., 2008), and paleo- lakes (Irwin et al., 2005). Hydrated minerals represent evi- dence of water on early Mars (Bibring et al., 2006; Poulet et al., 2005). Isotopic evidence suggests the presence of a thicker atmosphere in the past (Owen and Bar-Nun, 1995). Impacts and Astromaterials Research Centre, Department of Earth Science and Engineering, Imperial College London, UK. ª Peter R. Gordon and Mark A. Sephton, 2018; Published by Mary Ann Liebert, Inc. This Open Access article is distributed under the terms of the Creative Commons License (http://creativecommons.org/licenses/by/4.0), which permits unrestricted use, distribution, and reproduction in any medium, provided the original work is properly credited. ASTROBIOLOGY Volume 18, Number 5, 2018 Mary Ann Liebert, Inc. DOI: 10.1089/ast.2017.1744 556
Transcript of A Method for Choosing the Best Samples for Mars Sample Return

A Method for Choosing the Best Samplesfor Mars Sample Return
Peter R. Gordon and Mark A. Sephton
Abstract
Success of a future Mars Sample Return mission will depend on the correct choice of samples. Pyrolysis-FTIR can be employed as a triage instrument for Mars Sample Return. The technique can thermally dis-sociate minerals and organic matter for detection. Identification of certain mineral types can determine thehabitability of the depositional environment, past or present, while detection of organic matter may suggestpast or present habitation. In Mars’ history, the Theiikian era represents an attractive target for life searchmissions and the acquisition of samples. The acidic and increasingly dry Theiikian may have been habitableand followed a lengthy neutral and wet period in Mars’ history during which life could have originated andproliferated to achieve relatively abundant levels of biomass with a wide distribution. Moreover, the sulfateminerals produced in the Theiikian are also known to be good preservers of organic matter. We have usedpyrolysis-FTIR and samples from a Mars analog ferrous acid stream with a thriving ecosystem to test thetriage concept. Pyrolysis-FTIR identified those samples with the greatest probability of habitability andhabitation. A three-tier scoring system was developed based on the detection of (i) organic signals, (ii)carbon dioxide and water, and (iii) sulfur dioxide. The presence of each component was given a score of A,B, or C depending on whether the substance had been detected, tentatively detected, or not detected,respectively. Single-step (for greatest possible sensitivity) or multistep (for more diagnostic data) pyrolysis-FTIR methods informed the assignments. The system allowed the highest-priority samples to be catego-rized as AAA (or A*AA if the organic signal was complex), while the lowest-priority samples could becategorized as CCC. Our methods provide a mechanism with which to rank samples and identify those thatshould take the highest priority for return to Earth during a Mars Sample Return mission. Key Words:Mars—Astrobiology—Search for Mars’ organics—Infrared spectroscopy—Planetary habitability and biosignatures.Astrobiology 18, 556–570.
1. Introduction
Attempts to discover whether life exists or has previ-ously existed on Mars have not yet been conclusive. To
seek greater certainty when reading the rock record of hab-itability and habitation on Mars, mission concepts are beingproposed that involve the return of samples to Earth(McLennan et al., 2012). Once on Earth, samples of Mars canbe distributed to multiple laboratories that host the mostpowerful analytical techniques available. The probability ofsuccessfully obtaining conclusive evidence of past or presentlife on Mars is inevitably influenced by the choice of sampleto be returned to Earth (Sephton and Carter, 2015). Conse-
quently, attention has been directed toward methods thattriage the range of possible sampling opportunities on Mars toeffectively select a few highest-priority samples.
Environments on Mars that are believed to have been wet(Carr, 1996) are the primary locations for life searches(McLennan et al., 2012). Sedimentary features imply thepresence of liquid water to produce alluvial fans (Malin andEdgett, 2000), distributary fans (Malin and Edgett, 2003;Bhattacharya et al., 2005; Lewis et al., 2008), and paleo-lakes (Irwin et al., 2005). Hydrated minerals represent evi-dence of water on early Mars (Bibring et al., 2006; Pouletet al., 2005). Isotopic evidence suggests the presence of athicker atmosphere in the past (Owen and Bar-Nun, 1995).
Impacts and Astromaterials Research Centre, Department of Earth Science and Engineering, Imperial College London, UK.
ª Peter R. Gordon and Mark A. Sephton, 2018; Published by Mary Ann Liebert, Inc. This Open Access article is distributed under theterms of the Creative Commons License (http://creativecommons.org/licenses/by/4.0), which permits unrestricted use, distribution, andreproduction in any medium, provided the original work is properly credited.
ASTROBIOLOGYVolume 18, Number 5, 2018Mary Ann Liebert, Inc.DOI: 10.1089/ast.2017.1744
556

The duration of equable conditions probably extended intothe era when volcanic emissions and the loss of atmosphereled to increasingly acidic and saline chemistries (Bibringet al., 2006). There have been some suggestions that wetenvironments may still be found on present-day Mars. Re-curring slope lineae are an observed phenomenon on Mars,and while now thought to be better explained by dry sandflows (Dundas et al., 2017), they have been interpreted asthe result of present-day water-containing flows (Ojha et al.,2015), while other proposals to explain these features in-clude subsurface water reservoirs that produced surfaceoutflows from late Hesperian to the present day (Fassettet al., 2010; Rodrıguez et al., 2010; Bramson et al., 2015).
The geological history of Mars is generally described bythree main eras, namely, the Noachian, Hesperian, andAmazonian, for which ages are informed by crater densitystudies. Mineralogical mapping data from the Mars Expressorbiter has led to a proposed complementary timescale thatreflects the dominant mineralogies present on Mars (Bibringet al., 2006). The new timescale provides immediate min-eralogical context in reference to one of the following eras:the Phyllocian, Theiikian, or Siderikian, which reflectabundant phyllosilicates, sulfates, and iron oxides, respec-tively. If life emerged on Mars, then this event most likelyoccurred in the Phyllocian era when wet and neutral con-ditions were prevalent and conditions were most similar tothose on present-day Earth. It is reasonable to consider thatany Phyllocian life would have persisted for the remainderof the era and experienced the transition to the Theiikian erawhen wet and neutral settings were replaced with wet andacidic environments (Bibring et al., 2006). It is also logicalto assume that by the beginning of the Theiikian any life thatoriginated in the Phyllocian would have evolved and pro-liferated to achieve the greatest possible abundance of bio-mass and its widest distribution. The Early Theiikianbiomass would have been available for preservation in themartian rock record. The acidic conditions in the Theiikianled to the widespread deposition of sulfate minerals, andsulfate-rich environments are known to sustain life and offerhigh potential for organic matter preservation (Farmer andDes Marais, 1999).
Developing triage methods for use on Mars is hindered bythe lack of readily accessible martian samples. No sampleshave been returned from Mars by space missions, and me-teorites from Mars are precious and present in relativelysmall amounts. Testing of Mars triage methods musttherefore rely on the use of analog sites and samples. Mi-neralogical samples such as the glassy volcanic ash JSCMars-1 allow the testing of equipment destined for use onthe basalt-rich martian surface (Allen et al., 1997). Astro-biology studies seek out Mars-like conditions that includedry areas such as the Atacama Desert or cold environmentssuch as the Antarctic Dry Valleys (Marlow et al., 2011;Preston and Dartnell 2014). Yet the analogues most relevantto the early Theiikian are highly acidic rivers and streamsoften reflecting the aqueous oxidation of pyrite, a celebratedexample of which is Rıo Tinto, Spain (Fernandez-Remolaret al., 2005).
One instrument that has been proposed for triage on Marsis pyrolysis-FTIR (Sephton et al., 2013). Fourier transforminfrared (FTIR) is relatively simple in operation, has alimited demand for resources, produces richly diagnostic
information, and has been considered for use on Mars pre-viously (Anderson et al., 2005). Pyrolysis-FTIR negates themechanical sample loading challenges associated with othersolid phase FTIR techniques by adding a thermal extractiontechnique that has been successfully deployed on numer-ous missions on which pyrolysis ovens were used, namelyViking 1 and 2, Phoenix, and Mars Science Laboratory(Biemann et al., 1976; Hoffman et al., 2008; Mahaffy et al.,2012). During pyrolysis-FTIR, samples are rapidly heated (upto 20,000�C s-1) to produce volatiles that are subsequentlydetected and characterized by infrared spectroscopy. Aneffective triage method should prioritize samples that dis-play evidence of a life-supporting environment, containorganic compounds, and if possible suggest that those or-ganic compounds are complex and therefore information-rich in nature. Pyrolysis-FTIR has been demonstrated toprovide diagnostic information on the mineralogy of sam-ples and therefore past habitability (Gordon and Sephton,2016b). Pyrolysis-FTIR has also been utilized to provideinsights into the probability of the presence of biosignatures,demonstrating that detection of organic compounds in con-centrations as low as tens of parts per million is achievable(Gordon and Sephton 2016a).
In this paper, we apply pyrolysis-FTIR to a Mars analogsample set. Ferrous sulfate–rich streams are found on thesouthern coast of England where oxidation of sedimentarypyrite produces acidic waters. The sulfate-rich streamssupport a vibrant ecosystem of acid-tolerant species andprovide effective analogues for the Theiikian of Mars. Weuse the sulfate ecosystem samples and pyrolysis-FTIR toemulate the sample triage and selection process as could beoperated on Mars. In the case of an actual mission, the triageprocess would be preceded by complementary steps, such asimaging or spectroscopy; however, this study aims todemonstrate the triage capability of pyrolysis-FTIR whenused in isolation. Our findings suggest an effective methodfor choosing those samples which would provide the highestpossibility of success when returned to Earth for life-detection analyses.
2. Methods
2.1. Sample selection
Samples were obtained from two acidic, ferrous sulfate–rich streams located in Dorset, southern England: onecharacterized by flowing water (Fig. 1) and one that wasdry (Lewis et al., 2018). The collected sample set is listedin Table 1. The majority of samples collected came fromthe flowing stream, which was located at St Oswald’s Bay,while the dry stream was to the east of St Oswald’s Bay, ina small cove known as Stair Hole. Oxidation of pyrite,abundant in the Wealden Beds from which the St Oswald’sBay stream flows, gives the water a pH of 3.5, and jarositedeposits accumulate where the ferrous sulfate–rich watersevaporate. The dry stream at Stair Hole was less acidic,with a pH level of 5. Lateral variations across the steamsection were significant. Where water volumes and/or pHincreased, jarosite was converted to goethite; and wherethe stream was relatively dry, a jarosite-containing quartzsand occurred. The goethite was covered by a purple mi-crobial mat, and the deepest parts of the stream containedacidophilic algae. The sample codes listed in Table 1 are
SAMPLE TRIAGE DURING MARS SAMPLE RETURN 557

descriptive with, for example, a flowing stream samplewith wood over goethite-rich minerals being called ‘‘FlowWG’’and a dry stream containing a microbial mat over jarosite-rich minerals being called ‘‘DryMJ.’’ Stream samples wereobtained as cores before being freeze-dried and crushed inpreparation for analysis. Details of sample collection andpreparation are present in a previously published paper(Lewis et al., 2018).
2.2. Attenuated total reflectance–FTIR
All sulfate stream samples were analyzed by using aThermo Nicolet 5700 FTIR spectrometer fitted with an at-tenuated total reflectance (ATR) Thermo Orbit accessory toprovide supporting characterization data for the samples.These data revealed the chemical nature of the samples butwere not used in the triage process, which utilized pyrolysis-
FTIR exclusively. Note that these data did not influence theselection of samples in the triage process, and similar ATRdata need not be acquired on Mars. Powdered samples werepressed against the diamond ATR crystal and spectra col-lected by using a method aggregating 128 sample scans overa 150 s period at a resolution of 4 cm-1, from which abackground scan (i.e., a spectrum taken of the crystal plat-form with no sample present) was subtracted. Resultingspectra were then processed with an automatic baselinecorrection method provided by the Thermo Scientific OMNICSoftware Suite, which attempts to account for the effects ofoptical depths varying as a function of wavelength. Spec-tral features arising from hydroxyl, water of hydration,carbonates, sulfates, and organic compounds were identi-fied in the ATR-FTIR spectra by using the same criteria asdescribed in a previous investigation (Gordon and Sephton,2016b).
FIG. 1. A ferrous sulfate–rich stream in Dorset, southern England. Oxidation of pyrite gives the water a pH of 3.5 (inset).Jarosite is precipitated, and where water volumes and/or pH increase, the jarosite is converted to goethite. A map is included(bottom) showing the locations of the sampling regions, St Oswald’s Bay and Stair Hole, within the United Kingdom.
558 GORDON AND SEPHTON

Ta
ble
1.
Sa
mples
fro
mF
lo
win
ga
nd
Dry
Acid
ic,
Ferro
us
Su
lfa
te–R
ich
Strea
ms
Sam
ple
Code
Hand
spec
imen
des
crip
tion
Dis
tance
from
wes
tbank
(cm
)D
ista
nce
from
cente
r(c
m)
pH
Max
pote
nti
al
gas
pro
duct
sby
stoic
hio
met
ry(%
)
Flo
win
gst
ream
Ban
kse
dim
ent
(Wes
t)F
low
BS
1Q
uar
tzsa
nd
wit
hso
me
clay
min
eral
san
dja
rosi
te0
-225
5w
:2.3
,s:
0.1
Flo
wB
S2
Quar
tzsa
nd
wit
hcl
aym
iner
als
and
som
eja
rosi
te30
-195
4.5
w:3
.9,
s:2.2
Mat
tover
goet
hit
eF
low
MG
1a
Mic
robia
lm
atover
quar
tzsa
nd
wit
hgoet
hit
ew
ith
som
eja
rosi
te85
-140
4w
:3.7
,s:
2.6
Flo
wM
G1b
Mic
robia
lm
atover
quar
tzsa
nd
wit
hab
undan
tgoet
hit
ean
dso
me
jaro
site
w:7
.8,
s:1.2
Flo
wM
G1c
Mic
robia
lm
atover
quar
tzsa
nd
wit
hso
me
jaro
site
and
clay
min
eral
sw
:1.1
,s:
1.2
Flo
wM
G2a
Mic
robia
lm
atover
quar
tzsa
nd
wit
hab
undan
tgoet
hit
ean
dso
me
clay
min
eral
s150
-75
5.5
w:6
.2,
s:0.0
Flo
wM
G2b
Mic
robia
lm
atover
quar
tzsa
nd
wit
hab
undan
tgoet
hit
ew
:4.8
,s:
0.0
Flo
wM
G2c
Mic
robia
lm
atover
quar
tzsa
nd
wit
hso
me
jaro
site
and
clay
min
eral
sw
:1.2
,s:
1.6
Wood
over
goet
hit
eF
low
WG
1a
Wood
inquar
tzsa
nd
wit
hab
undan
tgoet
hit
e190
-35
4.5
w:4
.6,
s:0.0
Flo
wW
G1b
Mic
robia
lm
atover
quar
tzsa
nd
wit
hso
me
jaro
site
and
clay
min
eral
sw
:1.4
,s:
1.8
Mat
tover
jaro
site
Flo
wM
J1a
Mic
robia
lm
atover
quar
tzsa
nd
wit
hab
undan
tgoet
hit
ean
dso
me
jaro
site
and
clay
min
eral
s225
04
w:3
.6,
s:0.4
Flo
wM
J1b
Mic
robia
lm
atover
quar
tzsa
nd
w:0
.0,
s:0.0
Flo
wM
J1c
Mic
robia
lm
atover
quar
tzsa
nd
wit
hab
undan
tja
rosi
tew
:2.8
,s:
6.7
Wood
over
jaro
site
Flo
wW
J1a
Wood
inquar
tzsa
nd
wit
hab
undan
tja
rosi
tean
dso
me
clay
min
eral
sQ
:64.9
,G
:0,
J:27,
I:0,
K:8
.1,
M:0
260
35
5w
:4.2
,s:
6.9
Flo
wW
J1b
Wood
inquar
tzsa
nd
wit
hab
undan
tja
rosi
tean
dso
me
clay
min
eral
sQ
:63.2
,G
:0,
J:27.5
,I:
0,
K:9
.3,
M:0
w:4
.4,
s:7.0
Ban
kse
dim
ent
(Eas
t)F
low
BS
3Q
uar
tzsa
nd
wit
hab
undan
tcl
aym
iner
als
and
som
eja
rosi
te325
100
4w
:2.5
,s:
0.3
Quar
tzsa
nd
Flo
wQ
1Q
uar
tzsa
nd
wit
hso
me
clay
min
eral
sQ
:87.4
,G
:0,
J:0.5
,I:
6.9
,K
:3.4
,M
:1.8
380
155
4w
:0.9
,s:
0.1
Dry
stre
am
Dry
MJ1
aM
icro
bia
lm
atover
quar
tzsa
nd
wit
hab
undan
tgoet
hit
ean
dso
me
jaro
site
and
clay
min
eral
sQ
:40.3
,G
:18,
J:5.5
,I:
25.3
,K
:10.9
,M
:0
5w
:5.3
,s:
1.4
Dry
MJ1
bM
icro
bia
lm
atover
quar
tzsa
nd
wit
hab
undan
tgoet
hit
ean
dja
rosi
tew
:5.9
,s:
4.9
Sam
ple
codes
are
pre
fixed
by
‘‘F
low
’’or
‘‘D
ry’’
toin
dic
ate
whet
her
they
wer
eex
trac
ted
from
the
flow
ing
and
dry
stre
am,
resp
ecti
vel
y.
The
foll
ow
ing
two
lett
ers
des
crib
eth
egen
eral
nat
ure
of
the
sam
ple
:ei
ther
BS
(ban
kse
dim
ent)
,or
som
eco
mbin
atio
nof
M(m
icro
bia
lm
at)
or
W(w
ood)
over
G(g
oet
hit
e)or
J(j
arosi
te).
The
num
ber
suffi
xes
dis
tinguis
had
dit
ional
core
sta
ken
for
sim
ilar
sam
ple
types
,w
hil
eth
ele
tter
edsu
ffix
indic
ates
the
stra
tigra
phic
/ver
tica
lposi
tion
of
asa
mple
wit
hin
the
sam
eco
re(w
ith
‘‘a’
’bei
ng
the
top-m
ost
sam
ple
).S
toic
hio
met
ryab
bre
via
tions
are
asfo
llow
s:w
=w
ater
;s
=su
lfur
dio
xid
e.
559

2.3. Pyrolysis-FTIR
Each pyrolysis sample was prepared by adding a quantity(in the range 4–23 mg) of the chosen sample type to a quartztube with the powder being held in place by quartz woolplugs at both ends. Mass measurements were taken, on ascale accurate to 0.1 mg, during the sample preparation stepsso that the mass of powdered sample could be determined.
Pyrolysis was achieved with a CDS Analytical Pyroprobe5200. The pyroprobe is a length of metal rod with a plati-num coil heating element at one end. The quartz tube con-taining the sample was loaded into the platinum coil beforethe probe was inserted into a gas-tight CDS Analytical BrillCell, which provided an interface with the FTIR spectrom-eter (ZnSe windows at two ends of the cell permit an in-frared beam to traverse the intermediate cell volume).Pyrolysis was achieved when the coil was heated at a con-trolled rate of 20,000�C s-1 and then held at the desiredtemperature for 7.2 s. Gas products liberated from the solidsample were contained within the helium atmosphere of theBrill Cell. A controlled helium flow was used to purge thecell of spent pyrolysis products between analyses.
Fourier transform infrared analysis was conducted with aThermo Scientific Nicolet 5700 FTIR spectrometer. Beforepyrolysis, a background scan was taken with the probeloaded in the purged cell. The sample spectrum was takenimmediately after the probe had finished its rapid heatingstep. Background and sample spectra were composed of 32scans taken over 19.5 s at a resolution of 4 cm-1. To accountfor background artifacts introduced by the experimentalprocess, blanks were prepared in the same manner as geo-logical samples. Before each collection session, three pro-cedural blanks were analyzed at each of the temperaturemodes used for analysis. For each sample spectrum ob-tained, an average of the appropriate procedural blankspectra was subtracted. The standard deviation of proceduralblanks was used to calculate the 95% confidence interval(i.e., 2s), used to represent the uncertainty in measurements.
Measurements of spectral features were taken and re-corded: a peak located at 2349 cm-1 corresponding to theanti-symmetric stretch in carbon dioxide, one at 3853 cm-1
arising from a stretching mode of water, one at 1352 cm-1
corresponding to the sulfur dioxide anti-symmetric stretch-ing mode, one at 3016 cm-1 corresponding to the methaneanti-symmetric stretching mode and the height of a peak at2933 cm-1. Organic compounds, depending on the molecu-lar composition and structure, typically produce features in abroad spectral window corresponding to the C-H stretch; forcomparison with a previous study (Gordon and Sephton,2016a), the region (3150–2740 cm-1) was chosen to repre-sent organic compounds. The mass of methane, water, car-bon dioxide, and sulfur dioxide products were determinedby reference to mass calibration curves. Spectrometer op-eration and data processing were both achieved with theThermo Scientific OMNIC Software Suite.
2.4. Triage operation
To identify samples of highest priority for biosignaturedetection, a triage methodology was developed. A phasedapproach was adopted to utilize the advantages of differentmodes of pyrolysis-FTIR (the advantages of the chosenmodes had been determined in previous investigations
[Gordon and Sephton 2016a, 2016b]). The phases weredesigned to occur in a sequence: an initial habitability as-sessment phase, a subsequent habitation assessment phase,and a final diagnostic phase. A scoring system was intro-duced to allow discernment and ranking of samples. Revi-sion of a sample score can occur as new information fromsubsequent phases becomes available. All samples weresubjected to the first two phases, and some low-prioritysamples were analyzed in the third phase just to verify thetriage method; in actual field operation, samples would onlybe promoted to subsequent phases based on their favorableresponses to pyrolysis-FTIR. Individual triage phases mayindicate different scores for aliquots of the same sample. Inthese cases, the sample maintains the highest rank achievedeven if the higher rank was awarded in the previous phase.
2.4.1. Triage phase one (the habitability assessmentphase). All samples were first subjected to a single-step1000�C pyrolysis-FTIR analysis. This mode was identifiedin previous work as a high-sensitivity method for detectinggeological indicators of habitability (Gordon and Sephton,2016b). Certain minerals indicative of past habitability, suchas serpentinites and carbonates, only release their identify-ing gases at high temperatures. At high temperatures, or-ganic compounds are more prone to complete thermaldissociation, and their products consolidate into a methanesignal. Organic compounds also undergo more aggressivecombustion at higher temperatures owing to the greaterenergy input and interaction with any oxidants which arisefrom decomposition of the mineral matrix than at lowertemperatures. However, combusted organic compounds arerevealed through the simultaneous release of combustionproducts (carbon dioxide and water). Thus, the 1000�Csingle step acts as the triage ‘‘catch all’’ phase, providinggood general-purpose sensitivity but lacking more detaileddiagnostic information.
2.4.2. Triage phase two (the habitation assessmentphase). The highest-ranking sample types of the habit-ability assessment (single-step 1000�C) phase were passedto a subsequent round of single-step 700�C pyrolysis-FTIRanalyses. A temperature of 700�C avoids the extensive or-ganic compound thermal dissociation of the higher 1000�Cstep and is more sensitive to detection and identification ofcomplex organic compounds. Although during an actualtriage operation only the highest-ranking samples would goforward to the habitation (single-step 700�C) assessment, inthis study all samples were analyzed at both 700�C and1000�C to test the efficacy of the triage methodology.
2.4.3. Triage phase three (the diagnostic phase). Thehighest-ranking sample types of the previous phases werethen passed to multistep pyrolysis-FTIR analysis (successiveanalysis steps performed at 500�C, 750�C, and 1000�C).This form of pyrolysis-FTIR provides additional diagnosticinformation relative to single-step analysis. The character-istic decomposition temperatures and the ratio of gases re-leased at the different temperature steps are characteristicfor each mineral phase (Gordon and Sephton, 2016b).Comparing these with preexisting reference spectra can helpidentify the material type in situ. Although, as explainedabove, during an actual triage operation only the highest-
560 GORDON AND SEPHTON

ranking samples from single-step analysis would be usedfurther for multistep analysis, in this study a number of low-priority samples were also processed in the multistep phaseto test the accuracy of the triage methodology.
2.5. Classifying and ranking sample potential
In the aim of maximizing resource efficiency, it is not in-tended, in the case of an actual mission, that samples of lowscientific value will be processed by the full set of triage phasesdescribed above. To discover the samples that should be pro-cessed further following single-step analyses, a scoring logicwas applied to the pyrolysis-FTIR outcomes. This process isillustrated in Fig. 2 and described in detail below.
Three tiers of assessment were used to construct a triagecode for each sample. Each part of the code is determined bythe response of the FTIR signals representing that tier (de-scribed below in Sections 2.5.1, 2.5.2, and 2.5.3). Before asample is scored using the criteria of each tier, the presenceof a signal is considered, the thresholds for which were setto discern strongly against false positives and are as follows:
C. Confirmed—signal over double the associated uncertainty.T. Tentative—signal greater than the associated uncer-
tainty but weaker than double.N. None—signal less than uncertainty.
Because the objective of Mars Sample Return is the de-tection of evidence of life, the importance of the tiers decreases
from Tier 1 to Tier 3. Tier 1 represents direct organic re-sponses, Tier 2 represents the gaseous products of organicdegradation or indicators or habitability, while Tier 3 repre-sents gaseous indicators of habitability. Tier 3 also providesinformation on the presence of sulfates, which are a recognizedorganic signal attenuator (owing to the generation of oxidantsduring heating and the corresponding combustion of organiccompounds present), and their presence suggests that any or-ganic detection in Tier 1 can only be a minimum value.
2.5.1. Tier 1—Organic compound response. This is thehighest-priority tier. Owing to the great importance of or-ganic matter as evidence of life, complex organic com-pounds are preferred over methane. Where complex organicresponses are present instead or in addition to methane,therefore, they are indicated by modifying the A with asuperscript (*).
A. Confirmed organic compounds (A*) or methane signal (A).B. Tentative organic compounds or methane signal.C. No organic compounds or methane detected.
2.5.2. Tier 2—Simultaneous water and carbon dioxideresponse. Individually, these gases serve as habitabilityindicators; however, a simultaneous release (i.e., both gasespresent in the spectrum resulting from a pyrolysis-FTIRanalysis) introduces the possibility of combusted organiccompounds. With carbon dioxide and water having otherpossible non-organic sources, an additional criterion is ap-plied: both carbon dioxide and water contents must exceed2% of the initial sample weight to be considered a strongsignal. In a previous investigation (Gordon and Sephton,2016a), mineral types representative of the Phyllocian andTheiikian, the martian eras considered most habitable, onlyproduced simultaneous releases of water and carbon dioxideabove 2% of initial sample mass when organic compoundswere present in the sample.
A. Confirmed and strong (above 2% of sample mass)water and carbon dioxide signals.
B. Tentative or confirmed but low (equal or less than 2%of sample mass) water and carbon dioxide signals.
C. No simultaneous release of water and carbon dioxide.
2.5.3. Tier 3—Sulfur dioxide response. As sulfates havebeen recognized for aiding the preservation of biosignatures(Aubrey et al., 2006), samples presenting sulfur dioxide aredesirable. In addition, sulfur dioxide has been seen to assistthe combustion of organic compounds when heated (Lewiset al., 2014); thus when a sulfur signal is present, it is likelythat any accompanying hydrocarbon signal represents aminimum response for the organic richness of the originalsample and provides encouragement for any organic com-pound detection in Tier 1 or corroboration for any organiccombustion signature in Tier 2.
A. Confirmed sulfur dioxide signal.B. Tentative sulfur dioxide signal.C. No sulfur dioxide.
In summary, a sample scoring A*AA would be thehighest-priority sample and CCC the lowest. Two samplesthat are assigned the same code can be ranked against each
FIG. 2. Logic for scoring samples for the purpose ofranking them.
SAMPLE TRIAGE DURING MARS SAMPLE RETURN 561

other by (i) prioritizing the sample with a response forcomplex organic compounds and (ii) providing a higherrank to the samples with greatest responses in the highest-priority tier (i.e., Tier 1 > Tier 2 > Tier 3).
3. Results
3.1. Attenuated total reflectance-FTIR
The results from ATR-FTIR analysis are presented inTable 2. A broad peak for water of hydration was observed forall samples and detected in weak form for two samples from theflowing stream containing microbial mat over jarosite andquartz sand (FlowMJ1b and FlowQ1), while it was detectedstrongly in all other samples. Hydroxyl peaks were observed instrong form for wood-containing samples and bank sedimentsfrom the flowing stream and a microbial mat–containing sam-ple from the dry stream (FlowWJ1b, FlowBS1, FlowBS2,FlowBS3, DryMJ1a), and they were observed in weak form forwood-, microbial mat–, and quartz sand–containing samplesfrom the flowing stream (FlowWG1a, FlowWG1b, FlowMG1c,FlowMJ1a, FlowMJ1b, FlowQ1). Some samples exhibited abroad peak around 1400 cm-1, which is characteristic of car-bonates, yet they cannot be conclusively assigned as such be-cause the other characteristic carbonate peaks at 890–800 cm-1
and 760–670 cm-1 were not conclusively identifiable. Thus,samples exhibiting a broad 1400 cm-1 peak were identified tohave organic matter because alkanes, alcohols, and amides canhave strong responses in this region. A feature representingsulfates could be identified in all samples in the region of1090 cm-1. In wood-, microbial mat–, and quartz sand–containing samples and bank sediments from the flowing stream
(FlowWG1b, FlowMG2a, FlowMG2b, FlowMJ1a, FlowMJ1b,FlowQ1, FlowBS1), the 1090 cm-1 response only came in theform of a small shoulder, which was insufficient to conclusivelydetermine the presence of sulfates. Sulfates could be determinedweakly in wood-containing samples and bank sediments fromthe flowing stream (FlowWG1a, FlowBS3) but strongly in allother samples. Organic compounds were indicated by broadfeatures arising from C-H stretching in the 3050–2650 cm-1
region, and they were observed strongly in wood- and microbialmat–containing samples from the flowing and dry streams(FlowWG1a, FlowMG1a, FlowMG2a, FlowMJ1a, DryMJ1a)and weakly in wood- and microbial mat–containing samplesfrom the flowing and dry streams and bank sediments fromthe flowing stream (FlowWG1b, FlowWJ1b, FlowMG1b,FlowMG2b, DryMJ1b, FlowBS1, FlowBS2). A small sharppeak at 3020 cm-1 representing C-H stretching was observed inspectra from wood and microbial mat samples from the flowingand dry streams (FlowWG1a, FlowWJ1b, FlowMG1b,FlowMG2b, DryMJ1a, and DryMJ1b).
3.2. Triage phase one (the habitability assessmentphase) using single-step pyrolysis-FTIR (1000�C)
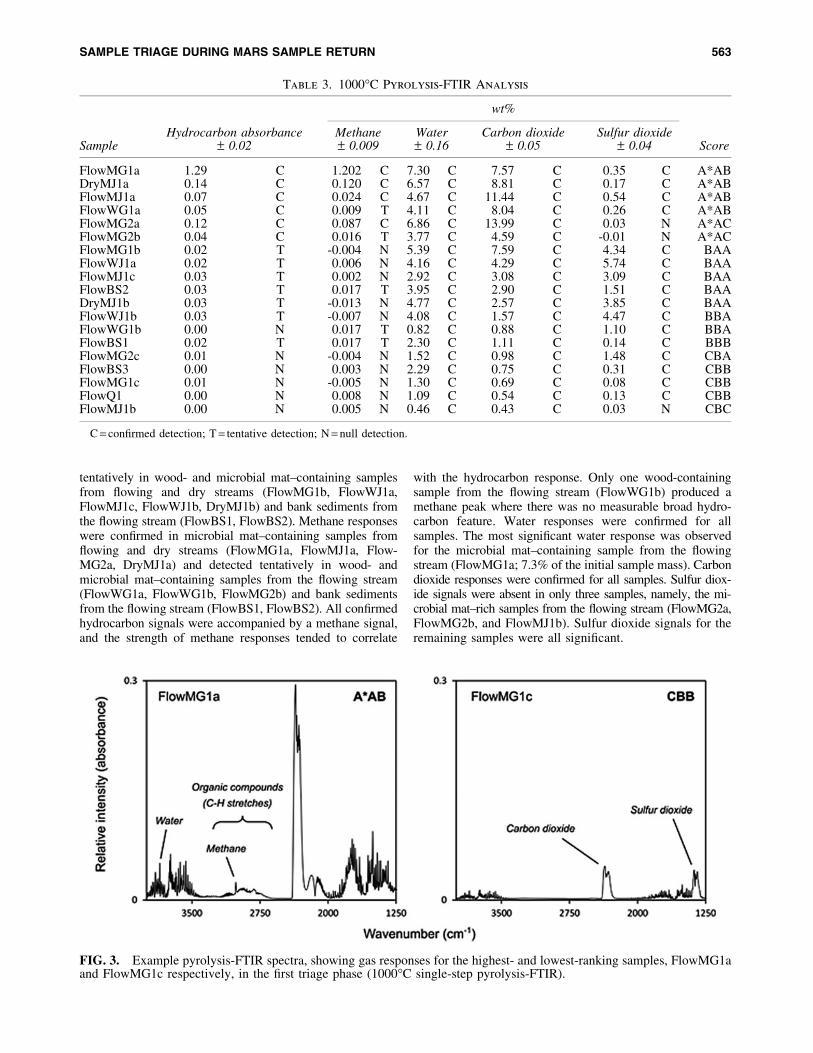
Results from the first triage phase (1000�C single-steppyrolysis-FTIR) are presented in Table 3. Figure 3 shows anexample pyrolysis-FTIR spectra, containing gas responses forthe highest- and lowest-ranking samples, FlowMG1a andFlowMG1c, respectively. Hydrocarbon responses were con-firmed in the wood- and microbial mat–containing samplesfrom flowing and dry streams (FlowWG1a, FlowMG1a,FlowMJ1a, FlowMG2a, FlowMG2b, DryMJ1a) and detected
Table 2. ATR-FTIR Results
Sample Code HydroxylWater of hydration /
adsorbed waterCarbonate
ionSulfate
ionOrganic
compounds
Flowing stream
Bank sediment (W) FlowBS1 - - ? ,
FlowBS2 - - - ,
Matt over goethite FlowMG1a - ? - -
FlowMG1b - - ,
FlowMG1c , - -
FlowMG2a - ? ? -
FlowMG2b - ? ,
FlowMG2c - -
Wood over goethite FlowWG1a , - ? , -
FlowWG1b , - ? ,
Matt over jarosite FlowMJ1a , - ? ? -
FlowMJ1b , , ?FlowMJ1c - -
Wood over jarosite FlowWJ1a - -
FlowWJ1b - - - ,
Bank sediment (E) FlowBS3 - - ,
Quartz sand FlowQ1 , , ?
Dry streamDryMJ1a - - ? - -
DryMJ1b - - ,
Solid squares represent strong identification, while an empty square represents a relatively weak signal. A question mark is used to denotesamples that exhibit a spectral feature in the characteristic region yet cannot be conclusively assigned: a broad peak around 1400 cm-1 in thecase of carbonates and a shoulder at around 1090 cm-1 in the case of sulfates.
562 GORDON AND SEPHTON
tentatively in wood- and microbial mat–containing samplesfrom flowing and dry streams (FlowMG1b, FlowWJ1a,FlowMJ1c, FlowWJ1b, DryMJ1b) and bank sediments fromthe flowing stream (FlowBS1, FlowBS2). Methane responseswere confirmed in microbial mat–containing samples fromflowing and dry streams (FlowMG1a, FlowMJ1a, Flow-MG2a, DryMJ1a) and detected tentatively in wood- andmicrobial mat–containing samples from the flowing stream(FlowWG1a, FlowWG1b, FlowMG2b) and bank sedimentsfrom the flowing stream (FlowBS1, FlowBS2). All confirmedhydrocarbon signals were accompanied by a methane signal,and the strength of methane responses tended to correlate
with the hydrocarbon response. Only one wood-containingsample from the flowing stream (FlowWG1b) produced amethane peak where there was no measurable broad hydro-carbon feature. Water responses were confirmed for allsamples. The most significant water response was observedfor the microbial mat–containing sample from the flowingstream (FlowMG1a; 7.3% of the initial sample mass). Carbondioxide responses were confirmed for all samples. Sulfur diox-ide signals were absent in only three samples, namely, the mi-crobial mat–rich samples from the flowing stream (FlowMG2a,FlowMG2b, and FlowMJ1b). Sulfur dioxide signals for theremaining samples were all significant.
Table 3. 1000�C Pyrolysis-FTIR Analysis
SampleHydrocarbon absorbance
wt%
ScoreMethane Water Carbon dioxide Sulfur dioxide
– 0.02 – 0.009 – 0.16 – 0.05 – 0.04
FlowMG1a 1.29 C 1.202 C 7.30 C 7.57 C 0.35 C A*ABDryMJ1a 0.14 C 0.120 C 6.57 C 8.81 C 0.17 C A*ABFlowMJ1a 0.07 C 0.024 C 4.67 C 11.44 C 0.54 C A*ABFlowWG1a 0.05 C 0.009 T 4.11 C 8.04 C 0.26 C A*ABFlowMG2a 0.12 C 0.087 C 6.86 C 13.99 C 0.03 N A*ACFlowMG2b 0.04 C 0.016 T 3.77 C 4.59 C -0.01 N A*ACFlowMG1b 0.02 T -0.004 N 5.39 C 7.59 C 4.34 C BAAFlowWJ1a 0.02 T 0.006 N 4.16 C 4.29 C 5.74 C BAAFlowMJ1c 0.03 T 0.002 N 2.92 C 3.08 C 3.09 C BAAFlowBS2 0.03 T 0.017 T 3.95 C 2.90 C 1.51 C BAADryMJ1b 0.03 T -0.013 N 4.77 C 2.57 C 3.85 C BAAFlowWJ1b 0.03 T -0.007 N 4.08 C 1.57 C 4.47 C BBAFlowWG1b 0.00 N 0.017 T 0.82 C 0.88 C 1.10 C BBAFlowBS1 0.02 T 0.017 T 2.30 C 1.11 C 0.14 C BBBFlowMG2c 0.01 N -0.004 N 1.52 C 0.98 C 1.48 C CBAFlowBS3 0.00 N 0.003 N 2.29 C 0.75 C 0.31 C CBBFlowMG1c 0.01 N -0.005 N 1.30 C 0.69 C 0.08 C CBBFlowQ1 0.00 N 0.008 N 1.09 C 0.54 C 0.13 C CBBFlowMJ1b 0.00 N 0.005 N 0.46 C 0.43 C 0.03 N CBC
C = confirmed detection; T = tentative detection; N = null detection.
FIG. 3. Example pyrolysis-FTIR spectra, showing gas responses for the highest- and lowest-ranking samples, FlowMG1aand FlowMG1c respectively, in the first triage phase (1000�C single-step pyrolysis-FTIR).
SAMPLE TRIAGE DURING MARS SAMPLE RETURN 563
The samples in Table 3 were ranked by their scores fol-lowing the 1000�C phase. Within each scoring group,ranking was determined by the signal strengths of the con-firmed gas in the most important relevant tier (i.e., Tier 1 >Tier 2 > Tier 3). In practice, this stage could allow a numberof samples to be disregarded for further analysis. For thesake of this study, all samples were passed forward to phasetwo to reveal the robustness of the triage concept.
3.3. Triage phase two (the habitation assessmentphase) using single-step pyrolysis-FTIR (700�C)
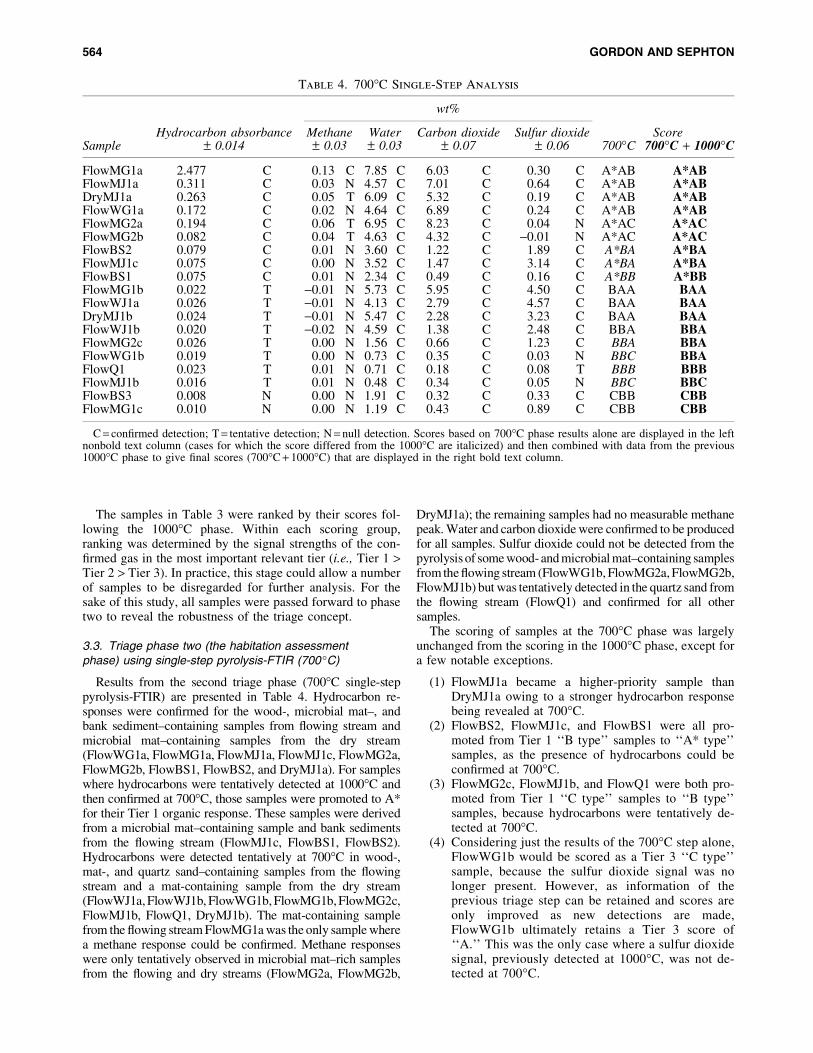
Results from the second triage phase (700�C single-steppyrolysis-FTIR) are presented in Table 4. Hydrocarbon re-sponses were confirmed for the wood-, microbial mat–, andbank sediment–containing samples from flowing stream andmicrobial mat–containing samples from the dry stream(FlowWG1a, FlowMG1a, FlowMJ1a, FlowMJ1c, FlowMG2a,FlowMG2b, FlowBS1, FlowBS2, and DryMJ1a). For sampleswhere hydrocarbons were tentatively detected at 1000�C andthen confirmed at 700�C, those samples were promoted to A*for their Tier 1 organic response. These samples were derivedfrom a microbial mat–containing sample and bank sedimentsfrom the flowing stream (FlowMJ1c, FlowBS1, FlowBS2).Hydrocarbons were detected tentatively at 700�C in wood-,mat-, and quartz sand–containing samples from the flowingstream and a mat-containing sample from the dry stream(FlowWJ1a, FlowWJ1b, FlowWG1b, FlowMG1b, FlowMG2c,FlowMJ1b, FlowQ1, DryMJ1b). The mat-containing samplefrom the flowing stream FlowMG1a was the only sample wherea methane response could be confirmed. Methane responseswere only tentatively observed in microbial mat–rich samplesfrom the flowing and dry streams (FlowMG2a, FlowMG2b,
DryMJ1a); the remaining samples had no measurable methanepeak. Water and carbon dioxide were confirmed to be producedfor all samples. Sulfur dioxide could not be detected from thepyrolysis of some wood- and microbial mat–containing samplesfrom the flowing stream (FlowWG1b, FlowMG2a, FlowMG2b,FlowMJ1b) but was tentatively detected in the quartz sand fromthe flowing stream (FlowQ1) and confirmed for all othersamples.
The scoring of samples at the 700�C phase was largelyunchanged from the scoring in the 1000�C phase, except fora few notable exceptions.
(1) FlowMJ1a became a higher-priority sample thanDryMJ1a owing to a stronger hydrocarbon responsebeing revealed at 700�C.
(2) FlowBS2, FlowMJ1c, and FlowBS1 were all pro-moted from Tier 1 ‘‘B type’’ samples to ‘‘A* type’’samples, as the presence of hydrocarbons could beconfirmed at 700�C.
(3) FlowMG2c, FlowMJ1b, and FlowQ1 were both pro-moted from Tier 1 ‘‘C type’’ samples to ‘‘B type’’samples, because hydrocarbons were tentatively de-tected at 700�C.
(4) Considering just the results of the 700�C step alone,FlowWG1b would be scored as a Tier 3 ‘‘C type’’sample, because the sulfur dioxide signal was nolonger present. However, as information of theprevious triage step can be retained and scores areonly improved as new detections are made,FlowWG1b ultimately retains a Tier 3 score of‘‘A.’’ This was the only case where a sulfur dioxidesignal, previously detected at 1000�C, was not de-tected at 700�C.
Table 4. 700�C Single-Step Analysis
Sample
wt%
Hydrocarbon absorbance Methane Water Carbon dioxide Sulfur dioxide Score– 0.014 – 0.03 – 0.03 – 0.07 – 0.06 700�C 700�C + 1000�C
FlowMG1a 2.477 C 0.13 C 7.85 C 6.03 C 0.30 C A*AB A*ABFlowMJ1a 0.311 C 0.03 N 4.57 C 7.01 C 0.64 C A*AB A*ABDryMJ1a 0.263 C 0.05 T 6.09 C 5.32 C 0.19 C A*AB A*ABFlowWG1a 0.172 C 0.02 N 4.64 C 6.89 C 0.24 C A*AB A*ABFlowMG2a 0.194 C 0.06 T 6.95 C 8.23 C 0.04 N A*AC A*ACFlowMG2b 0.082 C 0.04 T 4.63 C 4.32 C -0.01 N A*AC A*ACFlowBS2 0.079 C 0.01 N 3.60 C 1.22 C 1.89 C A*BA A*BAFlowMJ1c 0.075 C 0.00 N 3.52 C 1.47 C 3.14 C A*BA A*BAFlowBS1 0.075 C 0.01 N 2.34 C 0.49 C 0.16 C A*BB A*BBFlowMG1b 0.022 T -0.01 N 5.73 C 5.95 C 4.50 C BAA BAAFlowWJ1a 0.026 T -0.01 N 4.13 C 2.79 C 4.57 C BAA BAADryMJ1b 0.024 T -0.01 N 5.47 C 2.28 C 3.23 C BAA BAAFlowWJ1b 0.020 T -0.02 N 4.59 C 1.38 C 2.48 C BBA BBAFlowMG2c 0.026 T 0.00 N 1.56 C 0.66 C 1.23 C BBA BBAFlowWG1b 0.019 T 0.00 N 0.73 C 0.35 C 0.03 N BBC BBAFlowQ1 0.023 T 0.01 N 0.71 C 0.18 C 0.08 T BBB BBBFlowMJ1b 0.016 T 0.01 N 0.48 C 0.34 C 0.05 N BBC BBCFlowBS3 0.008 N 0.00 N 1.91 C 0.32 C 0.33 C CBB CBBFlowMG1c 0.010 N 0.00 N 1.19 C 0.43 C 0.89 C CBB CBB
C = confirmed detection; T = tentative detection; N = null detection. Scores based on 700�C phase results alone are displayed in the leftnonbold text column (cases for which the score differed from the 1000�C are italicized) and then combined with data from the previous1000�C phase to give final scores (700�C + 1000�C) that are displayed in the right bold text column.
564 GORDON AND SEPHTON

From these results, the highest-priority samples that wereselected for improved characterization by multistep pyrolysis-FTIR were wood- and microbial mat–containing samplesfrom flowing stream and a microbial mat–containing samplefrom the dry stream (FlowMG1a, FlowMJ1a, FlowMG2b,FlowMG2b, FlowWG1a, FlowWG1a, and DryMJ1a). Thelow-priority samples chosen to test the robustness of thetriage concept were FlowMJ1b (the lowest-ranked sample)and FlowMG1c (a sample located from the same core asthe highest-priority sample but representing a low-prioritysample observed to produce all gases except hydrocarbons).
3.4. Triage phase three (the diagnostic phase) usingmultistep pyrolysis-FTIR (500�C, 750�C, and 1000�C)
The results from the third triage phase (multisteppyrolysis-FTIR) are presented in Table 5. Hydrocarbonswere confirmed for all high-priority samples at the 500�Cstep but were absent from the 750�C and 1000�C steps,except for a tentative detection in a sample containing mi-crobial mat over goethite from the flowing stream(FlowMG1a) at 750�C. For the low-priority comparisonsamples, hydrocarbon signals were absent in all analysesexcept for in a sample containing microbial mat over jar-osite from the flowing stream (FlowMJ1b), where a hydro-carbon absorbance was tentatively observed. Methane wasmostly undetected in all samples during multistep pyrolysis-
FTIR, across all temperature steps, the exceptions beingsamples containing (i) microbial mat over goethite from theflowing stream (FlowMG1a) with methane observed tenta-tively at 500�C and confirmed at 750�C; (ii) microbial matover jarosite from the dry stream (DryMJ1a) with methaneobserved tentatively at 500�C and 750�C; and (iii) microbialmat over goethite from the flowing stream (FlowMG2a)with methane observed tentatively at 750�C. Water wasconfirmed for all high-priority samples at 500�C and 750�C.For all these samples, quantities of water were on the orderof 5 times greater at the lower of these two temperaturesteps, except for the microbial mat over jarosite sample fromthe dry stream (DryMJ1a), which had only about twice asmuch water at 500�C than 750�C. Water could only beconfirmed for one high-priority sample at the 1000�C step,namely, the microbial mat over jarosite from the dry streamDryMJ1a. However, two samples containing microbial matover goethite from the flowing stream (FlowMG1a andFlowMG2a) had tentative releases. The low-priority sam-ples both produced confirmed water signals at 500�C and750�C but no water responses at 1000�C. Carbon dioxidewas confirmed in all cases, except for a sample of microbialmat over goethite from the flowing stream (FlowMG1c) at1000�C. Sulfur dioxide could be detected in all samples ateach temperature step. The majority of sulfur dioxide wasobserved at 750�C in each sample with the exception ofsamples of microbial mat over goethite and jarosite from the
Table 5. Multistep Analysis, Performed on the Six Highest-Priority Samples Identified
through the Preceding ‘‘Habitation Sensitivity’’ Triage Phase (Table 4)
Sample Hydrocarbon absorbance
% wt
Methane Water Carbon dioxide Sulfur dioxide
500�CFlowMG1a 3.022 0.03 6.90 3.59 0.07DryMJ1a 0.363 0.03 4.49 3.26 0.13FlowMG2a 0.303 0.00 7.04 6.68 0.07FlowWG1a 0.075 – 0.013 0.01 – 0.02 4.28 – 0.09 3.94 – 0.05 0.29 – 0.03FlowMJ1a 0.059 0.00 1.63 1.39 0.24FlowMG2b 0.035 0.00 3.83 2.41 0.00FlowMJ1b 0.024 -0.01 0.43 0.33 0.07FlowMG1c 0.006 0.00 1.01 0.30 0.13
750�CFlowMG1a 0.05 0.11 1.24 3.86 0.34DryMJ1a -0.01 0.04 2.13 4.38 0.23FlowMG2a 0.01 0.02 1.10 5.72 0.25FlowWG1a 0.00 – 0.03 0.01 – 0.02 0.90 – 0.11 4.12 – 0.03 0.49 – 0.03FlowMJ1a 0.01 0.01 0.29 1.29 0.15FlowMG2b 0.00 0.01 0.60 2.51 0.14FlowMJ1b 0.01 0.01 0.71 0.49 0.06FlowMG1c 0.01 0.00 0.37 0.30 0.71
1000�CFlowMG1a 0.005 0.01 0.25 3.42 0.29DryMJ1a 0.014 0.02 0.43 2.75 0.38FlowMG2a 0.014 0.02 0.19 4.89 0.40FlowWG1a 0.009 – 0.016 0.01 – 0.03 0.10 – 0.18 1.10 – 0.09 0.65 – 0.02FlowMJ1a 0.003 0.00 0.08 0.75 0.15FlowMG2b 0.011 0.01 -0.06 0.57 0.21FlowMJ1b -0.014 0.00 0.11 0.44 0.05FlowMG1c -0.002 0.00 0.08 0.04 0.17
Results are ordered by the total response of hydrocarbons for each sample across all three temperature steps. Two low-priority samples,FlowMJ1b and FlowMG1c, are included for comparison.
SAMPLE TRIAGE DURING MARS SAMPLE RETURN 565

flowing stream (FlowMJ1a and FlowMG2b) where the mainreleases were at 500�C and 1000�C, respectively. In certainwood- and microbial mat–containing samples (FlowMG2a,FlowMG2b, FlowWG1a), no mineral source of sulfur wasobvious, and the sulfur dioxide observed was likely to bebiologically sourced. Following multistep pyrolysis-FTIR,the most shallow sample of microbial mat over goethitefrom the flowing stream (FlowMG1a) remained the highest-priority sample.
4. Discussion
4.1. Attenuated total reflectance-FTIR
Attenuated total reflectance results are used only as sup-porting data and would not be expected to be employedduring sample triage on Mars Sample Return. The presenceof water in all samples is perhaps expected considering theirorigin from a stream environment. The samples exhibitinghydroxyl peaks in ATR-FTIR correlate with samples thatcontain clay minerals which have hydroxyl units in theirstructure (Giese and Datta, 1973). Stronger hydroxyl signalstended to be observed in samples taken from near the edgesof the flowing stream. Thus, the absence of hydroxyl peaksfrom a number of samples with biogenic matter above goethiteor jarosite minerals (FlowMG1a, FlowMG1b, FlowMG2a,FlowMG2b, FlowMG2c, FlowMJ1c, FlowWJ1a, and DryMJ1b)derived generally from the middle of the stream suggestingthat ATR results are reflecting variations in clay mineralcontents at the various sampling locations. All samples ex-hibiting the broad 1400 cm-1 peak were also identified tohave organic matter because alkanes, alcohols, and amidescan have strong peaks in this region. There are a number ofsamples for which ATR-FTIR can identify features sugges-tive of sulfate bonds; one example is FlowMG2a (a sampleof a microbial mat over goethite-rich minerals). FlowMG2ahas a clear shoulder around 1090 cm-1, which is where aprominent sulfate peak occurs. It could be the case thatsulfur compounds are present in noncrystalline forms withinthe biomass component of some samples.
4.2. Triage phase one (the habitability assessmentphase) using single-step pyrolysis-FTIR (1000�C)
A sample from the flowing acid stream with wood frag-ments over goethite minerals (FlowWG1a) appears to showhydrocarbon signals at 1000�C, but hydrogen chloride peaksappear in the same region, and the assignment is uncertain.There is an apparent correlation between the strength of thehydrocarbon signal and the water signal. The weakest waterresponse at 0.46% wt was from FlowMJ1b, the interior ofthe hard, sandy nodule, which has likely been isolated fromaqueous processes for some time. FlowWG1b producedrelatively small amounts of water and sulfur dioxide. It isprobable that the most significant carbon dioxide signals arethe by-products from organic compound combustion. Forlow-level responses, adsorbed species may contribute. Yetsome samples produce no organic compound signals wherethe carbon dioxide signal is too significant to be attributedentirely to adsorbed species (e.g., FlowMG2c, approx. 1%wt carbon dioxide); thus the carbon dioxide signal can act asnonspecific indicator for the presence of organic compoundsin samples.
Particular attention should be paid to cases where organiccompound signals are absent, the carbon dioxide signal ishigh, and there is a sulfur dioxide response, because of theability of sulfates to produce oxygen during thermal de-composition, which can then combust organic matter (Lewiset al., 2014). Three scenarios can be envisaged as follows:(i) sulfates are present in amounts greater than those neededto combust any organic matter, and carbon dioxide andsulfur dioxide are observed following pyrolysis, but no hy-drocarbon signal exists; (ii) sulfates are present in amountsequal to those needed to combust any organic matter, andcarbon dioxide is observed following pyrolysis, but no sul-fur dioxide or hydrocarbon signals are present; and (iii)sulfates are present in amounts less than those needed tocompletely combust any organic matter, and carbon dioxideand organic responses are observed following pyrolysis, butno sulfur dioxide is present.
The most shallow and middle-depth samples from theleast acidic core of the stream bed produced no sulfur di-oxide, and samples from the edges of the stream producedrelatively low levels of sulfur dioxide, indicating the influ-ence of the sulfate-rich flowing water in sulfate mineralproduction. FlowMG2a had the strongest carbon dioxidesignal of all samples, lacked a sulfur dioxide response, andhad a hydrocarbon response. These data are consistent withscenario (iii) described above where carbon dioxide is en-hanced and hydrocarbon signals diminished when organicmatter is pyrolyzed in the presence of sulfates (Lewis et al.,2014). For this sample, ATR-FTIR data hint at a possiblesulfur feature.
The presence of water, carbon dioxide, and sulfur dioxide inpyrolysis-FTIR results can indicate habitable environments(Gordon and Sephton, 2016b). Single-step 1000�C pyrolysis-FTIR data were employed for habitability assessment. Duringsingle-step 1000�C pyrolysis-FTIR, FlowWG1b and FlowMJ1bwere revealed as the least likely samples to have undergonesignificant alteration by water (water levels are 0.82% wt and0.46% wt, respectively). Most other samples produced water>1% and thus can be suspected to contain hydrated mineralphases and are good candidates for habitable environments. Ithas been demonstrated that hydrated minerals generally producewater in amounts greater than 5% of mineral weight (Gordon andSephton, 2016b). Carbon dioxide was observed for all samples,and the strongest carbon dioxide signal arose from FlowMG2a,which produces 14% carbon dioxide (pure carbonates producecarbon dioxide in amounts >20% of their weight). A number ofsamples produce significant sulfur dioxide signals (>1%) andthus can be assumed to contain sulfates. Methane production wasconfirmed for several samples: FlowMG1a (1.202%), DryMJ1a(0.120%), FlowMJ2a (0.024%), and FlowMG2a (0.087%).These samples were all obtained from the top of the respectivecores where microbial mats were observed. Concurrent releaseof water and carbon dioxide can result from the combustion ofhydrocarbons. Significant concurrent releases (both water andcarbon dioxide >2% initial sample mass) were observed forFlowMG1a, FlowMJ1a, FlowWG1a, FlowMG2a, FlowMG2b,FlowMG1b, FlowWJ1a, FlowMJ1c, FlowBS2, DryMJ1a, andDryMJ1b. These signals were also generally stronger at the topof the cores where microbial mats are present. Strong concurrentreleases are not observed for samples from the banks of thestream where microbial mats are absent. In summary, whenusing single-step pyrolysis at 1000�C, habitability is indicated by
566 GORDON AND SEPHTON

the release of water, carbon dioxide, or sulfur dioxide, whilehabitation is suggested by the concurrent release of carbon di-oxide and water, and more strongly indicated by methane ormore complex hydrocarbon signals.
4.3. Triage phase two (the habitation assessmentphase) using single-step pyrolysis-FTIR (700�C)
When compared to the 1000�C single-step pyrolysis-FTIRphase, 700�C pyrolysis-FTIR produces stronger hydrocarbonsignals across all samples tested. Consequently, three samplesthat were previously tentatively believed to have producedhydrocarbons were confirmed to produce hydrocarbons at thelower temperature (FlowBS2, FlowMJ1c, and FlowBS1).Four samples were promoted from producing no hydrocar-bons to tentatively producing hydrocarbons (FlowMG2c,FlowWG1b, FlowQ1, and FlowMJ1b). FlowWG1b tenta-tively produced methane at 1000�C, so its score was un-changed. These results reinforce the choice of using 700�C asa more diagnostic temperature for detecting organic com-pounds than 1000�C. Across the entire sample set, methanesignals were less intense following 700�C single-steppyrolysis-FTIR than during 1000�C single-step pyrolysiswhere almost complete conversion of all organic matter to asingle analyte at the higher temperature facilitates detection.
Water quantities were observed to be similar betweenpyrolysis-FTIR analyses at 700�C and 1000�C, suggestingthat the sources of water were probably the combustion oforganic compounds, low energy bound mineral water (waterof hydration and crystallization, associated with weatheredmaterial), and adsorbed water. Of the samples with stronghydroxyl responses from ATR-FTIR, only FlowBS1 andFlowWJ1b did not produce more water at 1000�C than at700�C (FlowBS2, FlowBS3, and DryMJ1a all producedmore water at 1000�C).
Carbon dioxide amounts produced from the samples werelower at 700�C than at 1000�C. The reason for lower levelsof carbon dioxide at 700�C is because at 1000�C the extentof hydrocarbon combustion is greater. High-temperaturecarbon dioxide can result from decomposition of calciumcarbonate, but any mineral source of carbon dioxide waseliminated by the ATR-FTIR data (Tables 1 and 2).
Sulfur dioxide quantities are generally comparable be-tween the single-step 700�C and 1000�C pyrolysis-FTIRmodes. For FlowWG1b, the signal seen at 1000�C disappearswhen subjected to pyrolysis at 700�C, and the sulfur dioxidesignal for FlowQ1 (confirmed at 1000�C) was only tenta-tively observed. Samples with sulfur dioxide responses thatwere only observed when pyrolyzed at a higher temperaturemost probably contain more thermally stable sulfate minerals;for example, calcium, sodium, and magnesium sulfates alldecompose above 700�C (Lewis et al., 2014).
4.4. Triage phase three (the diagnostic phase) usingmultistep pyrolysis-FTIR (500�C, 750�C, and 1000�C)
Using data from the two previous phases of assessment(single step pyrolysis at 1000�C and 700�C), we were ableto select the highest-priority samples (FlowMG1a, FlowM-J1a, DryMJ1a, FlowWG1a, FlowMG2a, and FlowMG2b)for improved characterization by multistep pyrolysis-FTIR.Two low-priority samples were also chosen for comparison(FlowMJ1b and FlowMG1c).
The three most organic-rich samples processed by multi-step pyrolysis-FTIR (FlowMG1a, FlowMG2a, and DryMJ1a)produced their major hydrocarbon responses at 500�C andrelatively constant quantities of carbon dioxide across alltemperature steps. The three other high-priority samplesdisplayed a reduction in carbon dioxide response at 1000�Cto approximately half (FlowMJ1a) or a quarter (FlowWG1aand FlowMG2b) of that at 750�C. FlowMG1c had displayedthe weakest response for organic compounds in previousassessments, and what organic matter that was present wasdetected at 500�C. The temperature resolution of multisteppyrolysis-FTIR appears highly diagnostic for the presenceof organic matter.
For the samples with the poorest organic response(FlowMG1c), carbon dioxide was released at 500�C and750�C but not at 1000�C. Sulfur dioxide was present at alltemperatures, but the maximum release occurred at 750�C(0.71% wt). The temperature-step release profile was re-flective of the temperature-dependent reactions of organicmatter and sulfur dioxide. At 500�C, organic matter breaksdown, but sulfate decomposition is not yet at peak activity.At 750�C, sulfate decomposition is maximal and is oxidiz-ing organic matter to carbon dioxide. At 1000�C, sulfatedecomposition is still occurring, though all organic matterhas been oxidized, and no further carbon dioxide can beproduced. The gas release profiles in multistep pyrolysis-FTIR of the organic-poor sample demonstrate its capabilityof isolating the release of gases from different sources withdifferent decomposition temperatures thereby providingguidance for strategies that avoid secondary reactions thatmay otherwise obscure scientific information.
During multistep pyrolysis-FTIR, the majority of miner-als released the bulk of their total water products at the500�C temperature step, making weathered rock and clays amost likely source. FlowMG1a, DryMJ1a, FlowMG2a, andFlowWG1a still produced significant quantities of carbondioxide at 1000�C (>1% wt). High-temperature carbon di-oxide release is a signature of certain carbonates (e.g., cal-cium carbonate), but in the acidic stream environmentcarbonates are unlikely to have formed, although it shouldbe noted that ankerite, a calcium-bearing carbonate, hasbeen observed to be precipitated by microbes in acidic en-vironments (Fernandez-Remolar et al., 2012) and producescarbon dioxide at temperatures >800�C (Meurant 1967).
4.5. Assessment of the triage process
Figure 4 illustrates an example application of the triageoperation on a subset of the samples used in this study,where resource limitations require that candidate samplesare eliminated at each phase. In analogy to a Mars samplereturn mission, the priority would be to detect evidence ofpast or present life (McLennan et al., 2012). To this end, thecorrectness of the sample ranking process was evidentduring the very first triage step using single-step pyrolysis-FTIR at 1000�C where the highest-priority samples werecorrectly ranked (Table 3). The pyrolysis-FTIR triage pro-cess clearly identified the biomass-rich FlowMG1a to be thehighest-priority sample and assigned the relatively barrenbank sediment FlowBS3 and deep core FlowMG1c to be thelowest-priority samples. It is notable that the scoring systemprioritized the four microbial mat samples, and Flow MG1a,
SAMPLE TRIAGE DURING MARS SAMPLE RETURN 567

FlowMJ1a, FlowMG2a, and DryMJ1a routinely occupy fourof the five highest positions. The next group of samplesfavored by the scoring system were those with mineralcomponents relatively high in goethite, namely, FlowMG1b,FlowMG2b, and FlowWG1a (Table 3). The identification ofthe goethite-rich samples as high priorities is in accord withrecently published data that reveal that goethite minerals de-rived from the humidity-assisted decomposition of jarositedisplay a high preservation potential for organic records (Lewiset al., 2018). The pyrolysis-FTIR triage process also providedrefinements to prioritizations during the second stage of tri-age using single-step pyrolysis-FTIR at 700�C. For example,FlowMJ1b was the lowest-ranked sample at 1000�C (Table 3),which was partly a result of having no detectable hydrocarbonsignal, yet was then revealed to have a tentative hydrocar-bon signal during the 700�C phase (Table 4) probably re-flecting the attenuating effect of sulfate decomposition productson organic responses at higher temperatures. In a Marscontext, the suspicion of organic signal attenuation wouldjustify further characterization by multistep pyrolysis, dur-ing which a diagnostic hydrocarbon signal would have beenobserved in the 500�C step (Table 5). False negatives are
outcomes that should be avoided in any Mars sample triageprocess, and it is notable that our triage process wouldrecognize the organic matter–bearing samples, that is, ourmethod has high sensitivity, because the potential presence oforganic compounds can be recognized through the simul-taneous releases of water and carbon dioxide.
The rapid analysis times involved in pyrolysis-FTIRmake this triage method appropriate for high numbers ofsamples. The phased approach allows discrimination of low-value samples early in the procedure, which in turn im-proves efficiency of mission resources.
4.6. Additional considerations
Pyrolysis-FTIR requires that samples are crushed anddelivered in a powdered form, a protocol common to pre-vious lander and rover missions to Mars with life-detectiongoals (e.g., Viking and Mars Science Laboratory). It shouldbe noted that the analog samples are not representative ofthe complete history of Mars but are relevant to the LateNoachian and Early Hesperian where valley networks andsulfate deposits indicate acidic surface waters.
FIG. 4. Example triage operation.
568 GORDON AND SEPHTON

5. Conclusions
The success of Mars Sample Return will depend on thequality of collected materials, so samples must be assessedand prioritized for return to Earth. The quantitative chemicalinformation produced by pyrolysis-FTIR is effective forranking candidate samples based on criteria relevant to thesearch for life on Mars, namely, the habitability of thesample environment, the presence of organic compounds,and the preservation potential of the sample for bio-signatures. A scoring system is developed based on thedetection of (i) organic signals, (ii) carbon dioxide, andwater and (iii) sulfur dioxide. The presence of each com-ponent is given a score of A, B, or C depending on whetherthe substance has been detected, tentatively detected, or notdetected. Complex organic matter in Tier 1 is indicated byA*. The pyrolysis-FTIR triage operation benefited from aphased approach, where single-step pyrolysis-FTIR at1000�C and single-step pyrolysis-FTIR at 700�C providesensitivity, with the former producing bulk signals forhabitability indicators and organic content across thebroadest range of potential sources and the latter being themost sensitive to detecting organic compounds, while mul-tistep pyrolysis-FTIR at 500�C, 750�C, and 1000�C and allthree phases in conjunction offer specificity through addedresolution.
Acknowledgments
This work was supported by UK Space Agency grant ST/N000560/1 to M.A.S. and a Science and Technology Fa-cilities Council studentship to P.R.G.
References
Allen, C.C., Morris, R.V., Jager, K.M., Golden, D.C., Lind-strom, D.J., and Lockwood, J.P. (1997) JSC Mars-1: martianregolith simulant [abstract 1797]. In 28th Lunar and PlanetaryScience Conference, Lunar and Planetary Institute, Houston.
Aubrey, A., Cleaves, H.J., Chalmers, J.H., Skelley, A.M.,Mathies, R.A., Grunthaner, F.J., Ehrenfreund, P., and Bada,J.L. (2006) Sulfate minerals and organic compounds on Mars.Geology 34:357–360.
Anderson, M.S., Andringa, J.M., Carlson, R.W., Conrad, P.,Hartford, W., Shafer, M., Soto, A., Tsapin, A.I., Dybwad, J.P.,and Wadsworth, W. (2005) Fourier transform infrared spec-troscopy for Mars science. Rev Sci Instruments 76:034101.
Bhattacharya, J.P., Payenberg, T.H.D., Lang, S.C., and Bourke,M. (2005) Dynamic river channels suggest a long-lived No-achian crater lake on Mars. Geophys Res Lett 32, doi:10.1029/2005GL022747.
Bibring, J-P., Langevin, Y., Mustard, J.F., Poulet, F., Arvidson,R., Gendrin, A., Gondet, B., Mangold, N., Pinet, P., Forget, F,Berthe, M., Bibring, J.P., Gendrin, A., Gomez, C., Gondet,B., Jouglet, D., Poulet, F., Soufflot, A., Vincendon, M.,Combes, M., Drossart, P., Encrenaz, T., Fouchet, T.,Merchiorri, R., Belluci, G., Altieri, F., Formisano, V., Ca-paccioni, F., Cerroni, P., Coradini, A., Fonti, S., Korablev, O.,Kottsov, V., Ignatiev, N., Moroz, V., Titov, D., Zasova, L.,Loiseau, D., Mangold, N., Pinet, P., Doute, S., Schmitt, B.,Sotin, C., Hauber, E., Hoffmann, H., Jaumann, R., Keller, U.,Arvidson, R., Mustard, J.F., Duxbury, T., Forget, F., andNeukum, G. (2006) Global mineralogical and aqueous Mars
history derived from OMEGA/Mars Express data. Science312:400–404.
Biemann, K., Oro, J., Toulmin, P., Orgel, L., Nier, A., Ander-son, D., Simmonds, P., Flory, D., Diaz, A., and Rushneck, D.(1976) Search for organic and volatile inorganic compoundsin two surface samples from the Chryse Planitia region ofMars. Science 194:72–76.
Bramson, A., Byrne, S., Sutton, S., Putzig, N., Martellato, E.,Cremonese, G., Plaut, J., and Holt, J. (2015) A study ofmartian mid-latitude ice using observations and modeling ofterraced craters [abstract 1565]. In 46th Lunar and PlanetaryScience Conference, Lunar and Planetary Institute, Houston.
Carr, M.H. (1996) Water on Mars, Oxford University Press,New York.
Dundas, C.M., McEwen, A.S., Chojnacki, M., Milazzo, M.P.,Byrne, S., McElwaine, J.N., and Urso, A (2017) Granularflows at recurring slope lineae on Mars indicate a limited rolefor liquid water. Nat Geosci 10:903–907.
Farmer, J.D. and Des Marais, D.J. (1999) Exploring for a recordof ancient martian life. J Geophys Res 104:26977–26996.
Fassett, C.I., Dickson, J.L., Head, J.W., Levy, J.S., andMarchant, D.R. (2010) Supraglacial and proglacial valleys onAmazonian Mars. Icarus 208:86–100.
Fernandez-Remolar, D.C., Morris, R.V., Gruener, J.E., Amils,R., and Knoll, A.H. (2005) The Rıo Tinto Basin, Spain:mineralogy, sedimentary geobiology, and implications forinterpretation of outcrop rocks at Meridiani Planum, Mars.Earth Planet Sci Lett 240:149–167.
Fernandez-Remolar, D.C., Preston, L.J., Sanchez-Roman, M.,Izawa, M.R.M., Huang, L., Southam, G., Banerjee, N.R.,Osinski, G.R., Flemming, R., Gomez-Ortız, D., Prieto Bal-lesteros, O., Rodrıguez, N., Amils, R., and Darby Dyar, M.(2012) Carbonate precipitation under bulk acidic conditionsas a potential biosignature for searching life on Mars. EarthPlanet Sci Lett 351–352:13–26.
Giese, R. and Datta, P. (1973) Hydroxyl orientation in kaolinite,dickite, and nacrite. Am Mineral 58:471–479.
Gordon, P.R. and Sephton, M.A. (2016a) Organic matter de-tection on Mars by pyrolysis-FTIR: an analysis of sensitivityand mineral matrix effects. Astrobiology 16:831–845.
Gordon, P.R. and Sephton, M.A. (2016b) Rapid habitabilityassessment of Mars samples by pyrolysis-FTIR. Planet SpaceSci 121:60–75.
Hoffman, J.H., Chaney, R.C., and Hammack, H. (2008) PhoenixMars Mission—The Thermal Evolved Gas Analyzer. J AmSoc Mass Spectrom 19:1377–1383.
Irwin, R.P., Howard, A.D., Craddock, R.A., and Moore, J.M.(2005) An intense terminal epoch of widespread fluvial ac-tivity on early Mars: 2. Increased runoff and paleolake de-velopment. J Geophys Res: Planets 110, doi:10.1029/2005JE002460.
Lewis, J.M.T., Watson, J.S., Najorka, J., Luong, D., andSephton, M.A. (2014) Sulfate minerals: a problem for thedetection of organic compounds on Mars? Astrobiology 15:247–258.
Lewis, J.M.T., Najorka, J., Watson, J.S., and Sephton, M.A.(2018) The search for Hesperian organic matter on Mars:pyrolysis studies of sediments rich in sulfur and iron. Astro-biology 18, doi:10.1089/ast.2017.1717.
Lewis, K.W., Aharonson, O., Grotzinger, J.P., Kirk, R.L.,McEwen, A.S., and Suer, T.A. (2008) Quasi-periodic beddingin the sedimentary rock record of Mars. Science 322:1532–1535.
SAMPLE TRIAGE DURING MARS SAMPLE RETURN 569

Mahaffy, P.R., Webster, C.R., Cabane, M., Conrad, P.G., Coll,P., Atreya, S.K., Arvey, R., Barciniak, M., Benna, M., Blea-cher, L., Brinckerhoff, W.B., Eigenbrode, J.L., Carignan, D.,Cascia, M., Chalmers, R.A., Dworkin, J.P., Errigo, T., Everson,P., Franz, H., Farley, R., Feng, S., Frazier, G., Freissinet, C.,Glavin, D.P., Harpold, D.N., Hawk, D., Holmes, V., Johnson,C.S., Jones, A., Jordan, P., Kellogg, J., Lewis, J., Lyness, E.,Malespin, C.A., Martin, D.K., Maurer, J., McAdam, A.C.,McLennan, D., Nolan, T.J., Noriega, M., Pavlov, A.A., Prats,B., Raaen, E., Sheinman, O., Sheppard, D., Smith, J., Stern,J.C., Tan, F., Trainer, M., Ming, D.W., Morris, R.V., Jones, J.,Gundersen, C., Steele, A., Wray, J., Botta, O., Leshin, L.A.,Owen, T., Battel, S., Jakosky, B.M., Manning, H., Squyres,S., Navarro-Gonzalez, R., McKay, C.P., Raulin, F., Sternberg,R., Buch, A., Sorensen, P., Kline-Schoder, R., Coscia, D.,Szopa, C., Teinturier, S., Baffes, C., Feldman, J., Flesch, G.,Forouhar, S., Garcia, R., Keymeulen, D., Woodward, S., Block,B.P., Arnett, K., Miller, R., Edmonson, C., Gorevan S., andMumm, E. (2012) The Sample Analysis at Mars Investigationand Instrument Suite. Space Sci Rev 170:401–478.
Malin, M.C. and Edgett, K.S. (2000) Sedimentary rocks of earlyMars. Science 290:1927–1937.
Malin, M.C. and Edgett, K.S. (2003) Evidence for persistentflow and aqueous sedimentation on early Mars. Science 302:1931–1934.
Marlow, J.J., Martins, Z., and Sephton, M.A. (2011) Organichost analogues and the search for life on Mars. InternationalJournal of Astrobiology 10:31–44.
McLennan, S.M., Sephton, M.A., Allen, C., Allwood, A.C.,Barbieri, R., Beaty, D.W., Boston, P., Carr, M., Grady, M.,Grant, J., Heber, V.S., Herd, C.D.K., Hofmann, B., King, P.,Mangold, N., Ori, G.G., Rossi, A.P., Raulin, F., Ruff, S.W.,Sherwood Lollar, B., Symes, S., and Wilson, M.G. (2012)Planning for Mars returned sample science: final report of theMSR End-to-End International Science Analysis Group(E2E-iSAG). Astrobiology 12:175–230.
Meurant, G. (1967) Carbonate Rocks, Elsevier Science, Am-sterdam.
Ojha, L., Wilhelm, M.B., Murchie, S.L., McEwen, A.S., Wray,J.J., Hanley, J., Masse, M., and Chojnacki, M. (2015) Spectral
evidence for hydrated salts in recurring slope lineae on Mars.Nat Geosci 8:829–832.
Owen, T. and Bar-Nun, A. (1995) Comets, impacts, and at-mospheres. Icarus 116:215–226.
Poulet, F., Bibring, J.P., Mustard, J.F., Gendrin, A., Mangold,N., Langevin, Y., Arvidson, R.E., Gondet, B., and Gomez, C.(2005) Phyllosilicates on Mars and implications for earlymartian climate. Nature 438:623–627.
Preston, L.J. and Dartnell, L.R. (2014) Planetary habitability:lessons learned from terrestrial analogues. InternationalJournal of Astrobiology 13:81–98.
Rodrıguez, J.A.P., Tanaka, K.L., Berman, D.C., and Kargel, J.S.(2010) Late Hesperian plains formation and degradation in alow sedimentation zone of the northern lowlands of Mars.Icarus 210:116–134.
Sephton, M.A. and Carter, J.N. (2015) The chances of detectinglife on Mars. Planet Space Sci 112:15–22.
Sephton, M.A., Court, R.W., Lewis, J.M., Wright, M.C., andGordon, P.R. (2013) Selecting samples for Mars sample re-turn: triage by pyrolysis–FTIR. Planet Space Sci 78:45–51.
Address correspondence to:Mark A. Sephton
Impacts and Astromaterials Research CentreDepartment of Earth Science and Engineering
Imperial College LondonLondon SW7 2AZ
UK
E-mail: [email protected]
Submitted 16 August 2017Accepted 29 November 2017
Abbreviations Used
ATR¼ attenuated total reflectanceFTIR¼ Fourier transform infrared
570 GORDON AND SEPHTON