
A mathematical model for the movement of food bolus of varying viscosities through the esophagus
11
A mathematical model for the movement of food bolus of varying viscosities through the esophagus Dharmendra Tripathi Department of Mathematics, Birla Institute of Technology and Science Pilani, Hyderabad Campus, Hyderabad 500078, India article info Article history: Received 9 December 2010 Received in revised form 28 February 2011 Accepted 28 March 2011 Available online 21 April 2011 Keywords: Mathematical model Variable viscosity Peristaltic wave Esophagus Mechanical efficiency Trapping abstract This mathematical model is designed to study the influence of viscosity on swallowing of food bolus through the esophagus. Food bolus is considered as viscous fluid with variable viscosity. Geometry of esophagus is assumed as finite length channel and flow is induced by peristaltic wave along the length of channel walls. The expressions for axial velocity, transverse velocity, pressure gradient, volume flow rate and stream function are obtained under the assumptions of long wavelength and low Reynolds number. The impacts of viscosity parameter on pressure distribution, local wall shear stress, mechanical efficiency and trapping are numerically discussed with the help of computational results. On the basis of presented study, it is revealed that swallowing of low viscous fluids through esophagus requires less effort in comparison to fluids of higher viscosity. This result is similar to the experimental result obtained by Raut et al. [1], Dodds [2] and Ren et al. [3]. It is further concluded that the pumping efficiency increases while size of trapped bolus reduces when viscosity of fluid is high. & 2011 Elsevier Ltd. All rights reserved. 1. Introduction Esophagus is a flexible muscular 18–26 cm long and 1.5–2.5 cm wide tube that spans from the mouth to the stomach. It is confined within two sphincters that work as an inlet and an outlet for food boluses and handle them with great control. The tube is collapsible and remains in the collapsed state until masticated food bolus knocks at the upper sphincter signaling the process to start. The nasal cavity is closed at that time. The esophagus gets activated and fully stretched; the sphincter slowly allows the bolus to pass into it. Once the bolus is inside the esophagus, the upper sphincter gets closed and the esophagus is almost totally occluded at the head of it. The wall at the tail of the bolus near the sphincter begins to contract and that at the head starts relaxing. This process continues till the bolus reaches the lower sphinc- ter, knocks at it and gets delivered to the stomach with subsequent closure of the lower sphincter. Muscles in the wall of the esophagus work in a coordinated manner to push food and liquids down into the stomach. This muscular movement is called peristalsis. Although peristalsis is well known mechanism for biol- ogists, investigation of it from mechanical point of view began very late. Latham [4] ignited the investigation by analytical and experimental approaches in his work. Shapiro et al. [5] theoretically examined the peristaltic flow of viscous fluid with constant viscosity induced by sinusoidal wall propagation. They performed the analysis under assumption of long wavelength and discussed the phenom- ena of reflux and trapping during peristalsis. Brasseur et al. [6] studied the effect of peripheral layer for Newtonian fluids with different viscosities on peristaltic pumping. Misra and Pandey [7,8] reported the influence of peripheral layer on peristaltic flow of power-law fluid and casson fluid with different viscosities. Viscosity is an important physical property of fluid, which plays a vital role during fluid flow. It describes a fluid’s internal resistance to flow and may be thought of Contents lists available at ScienceDirect journal homepage: www.elsevier.com/locate/actaastro Acta Astronautica 0094-5765/$ - see front matter & 2011 Elsevier Ltd. All rights reserved. doi:10.1016/j.actaastro.2011.03.017 E-mail address: [email protected] Acta Astronautica 69 (2011) 429–439
-
Upload
dharmendra-tripathi -
Category
Documents
-
view
212 -
download
0
Transcript of A mathematical model for the movement of food bolus of varying viscosities through the esophagus

Contents lists available at ScienceDirect
Acta Astronautica
Acta Astronautica 69 (2011) 429–439
0094-57
doi:10.1
E-m
journal homepage: www.elsevier.com/locate/actaastro
A mathematical model for the movement of food bolus of varyingviscosities through the esophagus
Dharmendra Tripathi
Department of Mathematics, Birla Institute of Technology and Science Pilani, Hyderabad Campus, Hyderabad 500078, India
a r t i c l e i n f o
Article history:
Received 9 December 2010
Received in revised form
28 February 2011
Accepted 28 March 2011Available online 21 April 2011
Keywords:
Mathematical model
Variable viscosity
Peristaltic wave
Esophagus
Mechanical efficiency
Trapping
65/$ - see front matter & 2011 Elsevier Ltd. A
016/j.actaastro.2011.03.017
ail address: [email protected]
a b s t r a c t
This mathematical model is designed to study the influence of viscosity on swallowing
of food bolus through the esophagus. Food bolus is considered as viscous fluid with
variable viscosity. Geometry of esophagus is assumed as finite length channel and flow
is induced by peristaltic wave along the length of channel walls. The expressions for
axial velocity, transverse velocity, pressure gradient, volume flow rate and stream
function are obtained under the assumptions of long wavelength and low Reynolds
number. The impacts of viscosity parameter on pressure distribution, local wall shear
stress, mechanical efficiency and trapping are numerically discussed with the help of
computational results. On the basis of presented study, it is revealed that swallowing
of low viscous fluids through esophagus requires less effort in comparison to fluids of
higher viscosity. This result is similar to the experimental result obtained by Raut et al. [1],
Dodds [2] and Ren et al. [3]. It is further concluded that the pumping efficiency
increases while size of trapped bolus reduces when viscosity of fluid is high.
& 2011 Elsevier Ltd. All rights reserved.
1. Introduction
Esophagus is a flexible muscular 18–26 cm long and1.5–2.5 cm wide tube that spans from the mouth to thestomach. It is confined within two sphincters that work asan inlet and an outlet for food boluses and handle themwith great control. The tube is collapsible and remains inthe collapsed state until masticated food bolus knocks atthe upper sphincter signaling the process to start. Thenasal cavity is closed at that time. The esophagus getsactivated and fully stretched; the sphincter slowly allowsthe bolus to pass into it. Once the bolus is inside theesophagus, the upper sphincter gets closed and theesophagus is almost totally occluded at the head of it.The wall at the tail of the bolus near the sphincter beginsto contract and that at the head starts relaxing. Thisprocess continues till the bolus reaches the lower sphinc-ter, knocks at it and gets delivered to the stomach with
ll rights reserved.
subsequent closure of the lower sphincter. Muscles in thewall of the esophagus work in a coordinated manner topush food and liquids down into the stomach. Thismuscular movement is called peristalsis.
Although peristalsis is well known mechanism for biol-ogists, investigation of it from mechanical point of viewbegan very late. Latham [4] ignited the investigation byanalytical and experimental approaches in his work. Shapiroet al. [5] theoretically examined the peristaltic flow ofviscous fluid with constant viscosity induced by sinusoidalwall propagation. They performed the analysis underassumption of long wavelength and discussed the phenom-ena of reflux and trapping during peristalsis. Brasseur et al.[6] studied the effect of peripheral layer for Newtonian fluidswith different viscosities on peristaltic pumping. Misra andPandey [7,8] reported the influence of peripheral layer onperistaltic flow of power-law fluid and casson fluid withdifferent viscosities.
Viscosity is an important physical property of fluid,which plays a vital role during fluid flow. It describes afluid’s internal resistance to flow and may be thought of

D. Tripathi / Acta Astronautica 69 (2011) 429–439430
as a measure of fluid friction. It deforms by either shearstress or tensile stress. It measures the thickness orinternal friction of fluids. Thus, water is ‘‘thin’’, having alower viscosity, while honey, fruits juice, mixed vegeta-bles soup, fruits jam and foods are ‘‘thick’’, having a higherviscosity. Seeing the importance of viscosity, severalworkers [9–17] studied the effect of variable viscositieson peristaltic flow of Newtonian and non-Newtonianfluids in a uniform/non-uniform channels/tubes. Theydiscussed the effect of magnetic field, endoscope andnon-Newtonian parameters on the flow pattern withvariable viscosities.
All of the investigations on peristaltic flow of New-tonian and non-Newtonian fluid with variable viscositieshave been studied for infinite length tube but fromphysiological point of view it is less suitable. Li andBrasseur [18] have studied the peristaltic flow of viscousfluid with constant viscosity through finite length tubeand they have discussed the importance of finite lengthtube and have compared their findings with that ofShapiro et al. [5]. They focused the study on both localand global dynamics. Its application is more suitable forphysiological flow in human body because most of thephysiological vessels are found to have finite length. Theissue of local dynamics such as spatial-temporal varia-tions in local stresses in terms of the motility and efficacyof the transport process was raised by Brasseur and Dodds[19]. They found close resemblance with the experimentalfindings of Dodds [2] and Ren et al. [3]. Misra and Pandey[20] who investigated similar phenomena for power-lawfluids came to similar conclusions, although they did notdiscuss the experimental findings. Pandey and Tripathi[21–25] have recently worked for magneto-hydrody-namics, Maxwell, Jeffrey, Casson and micro-polar fluids.Another experimental observation for swallowing of foodbolus with different viscosities has been observed by Rautet al. [1]. They found that amplitude of bolus pressure aswell as that of the pharyngeal clearing contractionwas increased within the hypo-pharynx with increasingviscosity of the food bolus. Keeping these facts intoconsideration, we intend to study the influence ofvariable viscosities on peristaltic flow of viscous fluids infinite length channel. This study mainly focuses on the
Fig. 1. Geometry of the peristaltic wav
swallowing of food bolus with different viscositiesthrough the esophagus.
2. Mathematical model
The wave propagating along the channel walls ismathematically represented (cf. Fig. 1) as
~hð ~x, ~tÞ ¼ a� ~f cos2 plð ~x�c~tÞ ð1Þ
where ~h, ~x, ~t , a, ~f, l and c represent the transversevibration of the wall, axial coordinate, time, half widthof the channel, amplitude of the wave, wavelength andwave-velocity, respectively.
The governing equations for incompressible viscousfluids with variable viscosities are given by
r @
@~tþ ~u
@
@ ~xþ ~v
@
@ ~Z
!~u ¼�
@ ~p
@ ~xþ2
@
@ ~x~mð ~ZÞ @
~u
@ ~x
!
þ@
@ ~Z~mð ~ZÞ @ ~u
@ ~Zþ@ ~v
@ ~x
!( )ð2Þ
r @
@~tþ ~u
@
@ ~xþ ~v
@
@ ~Z
!~v ¼�
@ ~p
@ ~Z þ2@
@ ~Z~mð ~ZÞ @
~v
@ ~Z
� �
þ@
@ ~x~mð ~ZÞ @ ~u
@ ~Zþ@ ~v
@ ~x
!( )ð3Þ
@ ~u
@ ~xþ@ ~v
@ ~Z ¼ 0 ð4Þ
where ~u, ~v, ~Z, r, ~p and ~mð ~ZÞ are the axial velocity,transverse velocity, transverse coordinate, fluid density,pressure and variable viscosity, respectively. The non-dimensional parameters are given by
x¼~xl , Z¼ ~Z
a , t¼ c~tl , u¼ ~u
c , v¼ ~vca , h¼
~ha , l¼
~ll ,
f¼~fa , p¼
~pa2
mcl , Q ¼~Q
ac , mðZÞ ¼ mðZÞm , d¼ a
l , Re¼ racm
9=;ð5Þ
where l, m, Q, d and Re are the length of channel, fluidviscosity, volume flow rate, wave number and Reynoldsnumber, respectively. Introducing the non-dimensionalparameters from Eq. (5) in Eqs. (1–4). Applying the
e propagating along the channel.

D. Tripathi / Acta Astronautica 69 (2011) 429–439 431
lubrication approximations (low Reynolds number andlarge wavelength), Eqs. (1–4) reduce to
hðx,tÞ ¼ 1�fcos2pðx�tÞ, ð6Þ
@p
@x¼
@
@Z mðZÞ @u
@Z
� �, ð7Þ
@p
@Z ¼ 0, ð8Þ
@u
@xþ@v
@Z ¼ 0: ð9Þ
These equations are solved subjected to following bound-ary conditions:
@u
@Z
����Z ¼ 0
¼ 0, u9Z ¼ h ¼ 0, v9Z ¼ 0 ¼ 0,
v9Z ¼ h ¼@h
@t, p9x ¼ 0 ¼ p0, p9x ¼ l ¼ pl: ð10Þ
Solving Eq. (7) using the first and second conditions ofEq. (10), the axial velocity is obtained as
u¼@p
@xZI1ðZÞ�hI1ðhÞ� I2ðZÞ�I2ðhÞ
� � ð11Þ
where I1(Z)¼R
(1/m(Z))dZ and I2(Z)¼R
I1(Z)dZ.
-4
-3
-2
-1
0
1
2
3
4
0 0.5 1 1.5 2
α = 0.1α = 1.0α = 2.0α = 5.0
α = 0.1α = 1.0α = 2.0α = 5.0
ξ
Δp
-4
-3
-2
-1
0
1
2
3
4
5
0 0.5 1 1.5 2
Δp
ξ
Fig. 2. Pressure vs. axial distance for a¼0.1, 1.0, 2.0 and 5.0, f¼0.9, l¼2.0 and
Dotted lines represent the position of food bolus and color solid lines show pr
Using the third condition of Eqs. (10) and (11) incontinuity Eq. (9), the transverse velocity is obtained as
v¼@p
@xZ @
@xðhI1ðhÞ�I2ðhÞÞ
� �
�@2p
@x2ðI3ðZÞ�I4ðZÞÞþZðI2ðhÞ�hI1ðhÞÞ� �
ð12Þ
where I3(Z)¼R Z
0 sI1(s)ds and I4(Z)¼R Z
0 I2(s)ds.Using the fourth condition of Eq. (10), Eq. (12) reduces
to
@h
@t¼@p
@xh
@
@xðhI1ðhÞ�I2ðhÞÞ
� �
�@2p
@x2ðI3ðhÞ�I4ðhÞÞþhðI2ðhÞ�hI1ðhÞÞ� �
ð13Þ
Integrating Eq. (13) from 0 to x, the pressure gradientof any points across the length of channel is obtained as
@p
@x¼
GðtÞþR x
0 ð@h=@tÞds
ðI4ðhÞ�I3ðhÞÞþhðhI1ðhÞ�I2ðhÞÞð14Þ
where G(t), is the arbitrary function of t, evaluated later.Further integrating Eq. (14) from 0 to x, the pressure
difference between inlet and any point across the channel
α = 0.1α = 1.0α = 2.0α = 5.0
α = 0.1α = 1.0α = 2.0α = 5.0
-5
-4
-3
-2
-1
0
1
2
3
4
5
0 0.5 1 1.5 2
Δp
ξ
-5
-4
-3
-2
-1
0
1
2
3
4
0 0.5 1 1.5 2
Δp
ξ
various instants (a) t¼0.0 and 1.0, (b) t¼0.25, (c) t¼0.5 and (d) t¼0.75.
essure along the length of channel.

D. Tripathi / Acta Astronautica 69 (2011) 429–439432
is obtained as
pðx,tÞ�pð0,tÞ ¼
Z x
0
GðtÞþR s
0ð@h=@tÞds1
ðI4ðhÞ�I3ðhÞÞþhðhI1ðhÞ�I2ðhÞÞds: ð15Þ
At x¼ l, the pressure difference between inlet andoutlet of the channel is
pl�p0 ¼
Z l
0
GðtÞþR x
0 ð@h=@tÞds
ðI4ðhÞ�I3ðhÞÞþhðhI1ðhÞ�I2ðhÞÞdx: ð16Þ
Table 1Pharyngeal pressures were recorded by Raut et al. [1] for 5 ml boluses of wate
Pharynx Consistency Bolus wa
6 cm above UOS Water 25.276.9
Pudding 30.176.5
Buttered bread 45.777.7
4 cm above UOS Water 8.3715
Pudding 27.9711
Buttered bread 28.974.6
2 cm above UOS Water 11.071.4
Pudding 27.476.8
Buttered bread 43.776.2
-4
-3
-2
-1
0
1
2
3
4
5
6
0 0.5 1 1.5 2
α = 0.1α = 1.0α = 2.0α = 5.0
α = 0.1α = 1.0α = 2.0α = 5.0
Δp
ξ
-4
-3
-2
-1
0
1
2
3
4
5
0 0.5 1 1.5 2
Δp
ξ
Fig. 3. Pressure vs. axial distance for a¼0.1, 1.0, 2.0, 5.0, f¼0.9, l¼1.8 and v
Dotted lines represent the position of food bolus and color solid lines show pr
Solving Eq. (16), the integrating constant G(t) isobtained as
GðtÞ ¼ðpl�p0Þ�
R l0
R x0 ð@h=@tÞds=ðI4ðhÞ�I3ðhÞÞþhðhI1ðhÞ�I2ðhÞÞ
� �dxR l
0ð1=ðI4ðhÞ�I3ðhÞÞþhðhI1ðhÞ�I2ðhÞÞÞdx:
ð17Þ
The instantaneous volume flow rate is defined as
Q ðx,tÞ ¼
Z h
0udZ
r, pudding and buttered bread using a manometer.
ve (mmHg) Pharyngeal clearing contraction (mmHg)
91.776.7
103.278.2n
n 113.377.2nnn
.5 105.9715.2
.9 107.9711.0
130.3714.7n
184.9713.9n 194.5714.8nnn 218.3713.9nn
α = 0.1α = 1.0α = 2.0α = 5.0
α = 0.1α = 1.0α = 2.0α = 5.0
-5
-4
-3
-2
-1
0
1
2
3
4
0 0.5 1 1.5 2
Δp
ξ
-7
-6
-5
-4
-3
-2
-1
0
1
2
0 0.5 1 1.5 2
Δp
ξ
arious instants (a) t¼0.0, and 1.0, (b) t¼0.25, (c) t¼0.5 and (d) t¼0.75.
essure along the length of channel.

D. Tripathi / Acta Astronautica 69 (2011) 429–439 433
which reduces to
Q ðx,tÞ ¼@p
@xI3ðhÞ�I4ðhÞ�hðhI1ðhÞ�I2ðhÞÞ
: ð18Þ
The averaged flow rate over a period in the laboratoryframe is given by
Q ¼
Z 1
0Q ðx,tÞdt¼
Z 1
0
@p
@xI3ðhÞ�I4ðhÞ�hðhI1ðhÞ�I2ðhÞÞ
ds:
ð19Þ
The averaged flow rate is expressed in flow rate inwave frame and flow rate in laboratory frame as
Q ¼ qþ1�f2¼ Q�hþ1�
f2: ð20Þ
Solving Eq. (18) and using Eq. (20), we get
@p
@x¼
Qþh�1þðf=2Þ
½I3ðhÞ�I4ðhÞ�hðhI1ðhÞ�I2ðhÞÞ�: ð21Þ
Integrating Eq. (21) from 0 to x, we get
pðxÞ�pð0Þ ¼
Z x
0
Qþh�1þðf=2Þ
½I3ðhÞ�I4ðhÞ�hðhI1ðhÞ�I2ðhÞÞ�ds: ð22Þ
The local wall shear stress is defined as
tw ¼@u
@Z
����Z ¼ h
ð23Þ
-10
-5
0
5
10
15
0 0.5 1 1.5 2
α = 0.1α = 1.0α = 2.0α = 5.0
α = 0.1α = 1.0α = 2.0α = 5.0
ξ
-10
-5
0
5
10
15
0 0.5 1 1.5 2
ξ
� w� w
Fig. 4. Local wall shear stress vs. axial distance for a¼0.1, 1.0, 2.0 and 5.0, f¼0
(d) t¼0.75. Dotted lines represent the position of food bolus and color solid lin
which reduces to
tw ¼h
mðhÞ@p
@x
which, in virtue of Eq. (14), further reduces to
tw ¼h
mðhÞGðtÞþ
R x0 ð@h=@tÞds
ðI4ðhÞ�I3ðhÞÞþhðhI1ðhÞ�I2ðhÞÞ
" #: ð24Þ
2.1. Mechanical efficiency
Mechanical efficiency is defined as the ratio betweenthe average rate per wavelength at which work is done bythe moving fluid against a pressure head and average atwhich the walls do work on the fluid, which is furtherderived in the form as
E¼QDp1
fðI1�Dp1Þð25Þ
where I1 ¼R 1
0 ð@p=@xÞcos2pxdx and Dp1 is the pressuredifference across one wavelength, which is given by
Dp1 ¼ p1�p0 ¼
Z 1
0
ðQþh�1þðf=2ÞÞ
½I3ðhÞ�I4ðhÞ�hðhI1ðhÞ�I2ðhÞÞ�dx: ð26Þ
α = 0.1α = 1.0α = 2.0α = 5.0
α = 0.1α = 1.0α = 2.0α = 5.0
-10
-5
0
5
10
15
0 0.5 1 1.5 2
ξ
-10
-5
0
5
10
15
0 0.5 1 1.5 2
ξ
� w� w
.9, l¼2.0 and various instants (a) t¼0.0 and 1.0, (b) t¼0.25, (c) t¼0.5 and
es show local wall stress along the length of channel.

D. Tripathi / Acta Astronautica 69 (2011) 429–439434
The maximum flow rate is obtained by substitutingDp1¼0 and Q ¼ Q0, we get
Q0 ¼ 1�f2�
R 10 ðh=½I3ðhÞ�I4ðhÞ�hðhI1ðhÞ�I2ðhÞÞ�ÞdxR 10 ð1=½I3ðhÞ�I4ðhÞ�hðhI1ðhÞ�I2ðhÞÞ�Þdx
: ð27Þ
2.2. Stream function
For two-dimensional case the dimensional form of thestream function in the wave frame is given by
d ~c ¼ ~Ud ~Y� ~V d ~X ð28Þ
where ~c, ~Y , ~X , ~U and ~V are stream function, axialand transverse coordinates and axial and transversevelocity-components, respectively. We use the followingtransformations between wave and laboratory frames:
~X ¼ ~x�c~t , ~Y ¼ ~Z, ~U ¼ ~u�c, ~V ¼ ~v, ~q ¼ ~Q�c ~h ð29Þ
where the left side parameters are in the wave frame andthe right side parameters are in the laboratory frame.Applying the transformations (29) in Eqs. (11) and (12),we obtain the stream function as
c¼ðQþh�1þðf=2ÞÞ½I3ðZÞ�I4ðZÞ�ZðhI1ðhÞ�I2ðhÞÞ�
½I3ðhÞ�I4ðhÞ�hðhI1ðhÞ�I2ðhÞÞ��Z:
ð30Þ
0
0.05
0.1
0.15
0 0.2 0.4
Q/Q0
E
α = 0.1α = 1.0α = 2.0α = 5.0
Fig. 6. Mechanical efficiency vs. ratio of averaged flow rate and maximum avera
2.0 and 5.0 and f¼0.6.
-4
-3
-2
-1
0
1
2
3
4
0 0.1 0
Q
Δp1
Fig. 5. Pressure vs. averaged flow rate. Color lines represent the pres
3. Numerical results and discussion
All the expressions are obtained in the close form of I1,I2, I3 and I4 and they are dependent upon the variableviscosity m(Z). Moreover, researches have been focused onthe fluids with the exponential viscosity variation; it isgiven in the following form (cf. [10,12–14]) as:
mðZÞ ¼ e�aZ ð31Þ
or
mðZÞ ¼ 1�aZ for a51
where a is the viscosity parameter.In present analysis, the numerical and computational
results are obtained by substituting the value of m(Z) fromEq. (31). We consider the case of free pumping. In such acase, the contribution of only peristaltic waves is takeninto consideration, i.e., initial pressure difference is sup-posed to be zero. We consider two waves in trainspropagating along the walls of the channel. In order toexamine the temporal effects of viscosity on the flowpattern, Fig. 2(a–d) is plotted between the pressuredifference (p(x,t)�p(0,t)) and the axial distance (x) atthe instants (t¼0.0, 0.25, 0.5, 0.75 and 1.0) for variousvalues of viscosity parameter (a¼0.1, 1, 2 and 5). InFig. 2a, at t¼0, it is observed that the pressure rises very
0.6 0.8 1
ged flow rate. Color lines represent the efficiency of pump for a¼0.1, 1.0,
.2 0.3 0.4
α = 0.1α = 1.0α = 2.0α = 5.0
sure at fixed flow rate for a¼0.1, 1.0, 2.0 and 5.0 and f¼0.6.

0 0.2 0.4 0.6 0.8 1-1
-0.5
0
0.5
1
0 0.2 0.4 0.6 0.8 1-1
-0.5
0
0.5
1
0 0.2 0.4 0.6 0.8 1-1
-0.5
0
0.5
1
0 0.2 0.4 0.6 0.8 1-1
-0.5
0
0.5
1
0 0.2 0.4 0.6 0.8 1
-1
-0.5
0
0.5
1
0 0.2 0.4 0.6 0.8 1-1
-0.5
0
0.5
1
0 0.2 0.4 0.6 0.8 1
-1
-0.5
0
0.5
1
0 0.2 0.4 0.6 0.8 1-1
-0.5
0
0.5
1
Fig. 7. Streamlines in the wave frame for various values of a and Q ¼ 0:5, f¼ 0:6 (a) a¼0.0, (b) a¼0.2, (c) a¼0.4, (d) a¼0.6, (e) a¼0.8, (f) a¼1.0,
(g) a¼5.0 and (h) a¼10.0.
D. Tripathi / Acta Astronautica 69 (2011) 429–439 435
D. Tripathi / Acta Astronautica 69 (2011) 429–439436
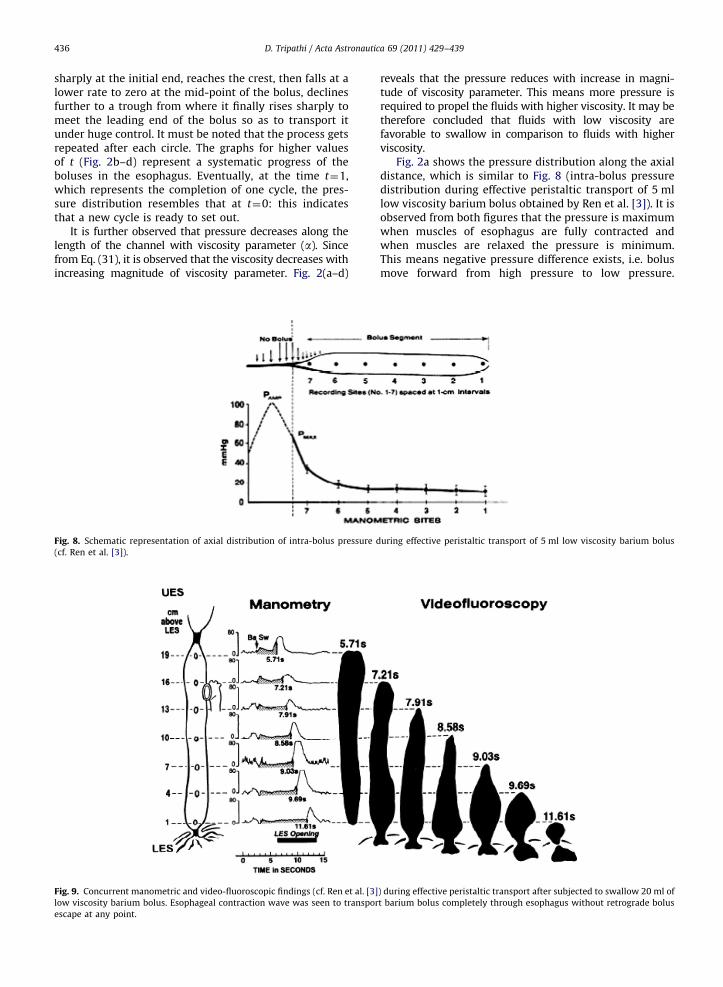
sharply at the initial end, reaches the crest, then falls at alower rate to zero at the mid-point of the bolus, declinesfurther to a trough from where it finally rises sharply tomeet the leading end of the bolus so as to transport itunder huge control. It must be noted that the process getsrepeated after each circle. The graphs for higher valuesof t (Fig. 2b–d) represent a systematic progress of theboluses in the esophagus. Eventually, at the time t¼1,which represents the completion of one cycle, the pres-sure distribution resembles that at t¼0: this indicatesthat a new cycle is ready to set out.
It is further observed that pressure decreases along thelength of the channel with viscosity parameter (a). Sincefrom Eq. (31), it is observed that the viscosity decreases withincreasing magnitude of viscosity parameter. Fig. 2(a–d)
Fig. 8. Schematic representation of axial distribution of intra-bolus pressure d
(cf. Ren et al. [3]).
Fig. 9. Concurrent manometric and video-fluoroscopic findings (cf. Ren et al. [3]
low viscosity barium bolus. Esophageal contraction wave was seen to transpor
escape at any point.
reveals that the pressure reduces with increase in magni-tude of viscosity parameter. This means more pressure isrequired to propel the fluids with higher viscosity. It may betherefore concluded that fluids with low viscosity arefavorable to swallow in comparison to fluids with higherviscosity.
Fig. 2a shows the pressure distribution along the axialdistance, which is similar to Fig. 8 (intra-bolus pressuredistribution during effective peristaltic transport of 5 mllow viscosity barium bolus obtained by Ren et al. [3]). It isobserved from both figures that the pressure is maximumwhen muscles of esophagus are fully contracted andwhen muscles are relaxed the pressure is minimum.This means negative pressure difference exists, i.e. bolusmove forward from high pressure to low pressure.
uring effective peristaltic transport of 5 ml low viscosity barium bolus
) during effective peristaltic transport after subjected to swallow 20 ml of
t barium bolus completely through esophagus without retrograde bolus

D. Tripathi / Acta Astronautica 69 (2011) 429–439 437
The concurrent esophageal video-fluoroscopic and intra-luminal manometric recordings in supine normal volun-teers using different bolus volumes and viscosities andabdominal compression are observed (cf. Figs. 9–11) byRen et al. [3]. They found that intra-bolus pressureincreased with bolus viscosity. This finding is also same
Fig. 10. Effective bolus transport during abdominal compression (cf. Ren et al. [
was 28 mmHg. In this example, 10 ml high viscosity barium bolus is complete
Fig. 11. Effect of esophageal location, bolus volume, and bolus viscosity on Pre
(LV). B: high viscosity (HV).
as our finding that the pressure is more for high viscousfood bolus. Another experimental observation for swal-lowing of food bolus with different viscosities has beendiscussed by Raut et al. [1]. They measured pressures offood bolus consistency on the pharyngeal wave duringswallowing using a four-sensor manometry probe in 22
3]). Intragastric pressure elicited by abdominal compression of 90 mmHg
ly transported through esophagus without retrograde escape.
ssure during effective bolus transport (cf. Ren et al. [3]). A: low viscosity

D. Tripathi / Acta Astronautica 69 (2011) 429–439438
healthy volunteers (cf. Table1). Pharyngeal pressureswere recorded for 5 ml boluses of water, pudding andbuttered bread using manometer. They found that ampli-tude of bolus pressure as well as that of the pharyngealclearing contraction was increased with increasing visc-osity of the food bolus, which again agrees with ourresults. Finally, we can say that this mathematical modelapproximately matches to experimental observations.
In Fig. 3(a–d), we consider the propagation of a non-integral number of waves in the train. As a special case,we take l¼1.8. It is observed that the peaks of pressure forthe two different types of boluses are identical in theintegral case while the peaks are different in the non-integral case. The effects of viscosity parameter on pres-sure in both cases are unaltered.
The influence of viscosity parameter on local wallshear stress (tw) along the length of the channel at variousinstants (t¼0.0, 0.25, 0.5, 0.75 and 1.0) are shown inFig. 4(a–d). It is found that the range between peak andtrough of local wall shear stress diminishes with increas-ing the magnitude of viscosity parameter.
A relation between pressure across one wavelength(Dp1) and averaged flow rate (Q) is shown to discuss theeffect of viscosity on the pressure. Fig. 5 exhibits a linearrelation between them. It is observed that an increase inthe flow rate reduces the pressure; thus maximum flowrate is achieved at zero pressure and vice-versa. Pressuredecreases with increase in the magnitude of viscosityparameter.
Fig. 6 is plotted for showing the mechanical efficiency(E) vs. the ratio of averaged flow rate to maximumaveraged flow rate (Q=Q0). There is a non-linear relationbetween them. First E rises with Q=Q0 from zero to themaximum value, it falls thereafter to zero. It reveals thatthe mechanical efficiency reduces with increasing themagnitude of viscosity parameter. It is physically inter-preted that mechanical efficiency is more for high viscousfluids.
Trapping is important phenomenon, which refers toclosed circulating streamlines that exist at very high flowrates and when occlusions are very large. The trappedregion moves with the wave-velocity. It has been studiedfor varying the magnitude of viscosity parameter. Stream-lines in wave frame are plotted to study the feature oftrapped bolus under the influence of viscosity. Fig. 7(a–h)reveals that the size of the trapped region increases withincrease in the viscosity parameter.
4. Conclusion
The effect of viscosity on the swallowing of food bolusthrough esophagus is discussed numerically. It is foundthat more pressure is required to swallow the foodbolus with higher viscosity. It is physically interpretedthat water (low viscous fluid) is easy to swallow incomparison with honey, fruit juice, mixed vegetablesoup, fruit jam and other foods (high viscous fluid). Ournumerical results are found to be approximately similarto experimental observations (intra-bolus pressureincreased with bolus volume, viscosity, and abdominalcompression) obtained by Ren et al. [3] and (amplitude of
bolus pressure as well as that of the pharyngeal clearingcontraction was increased with increasing viscosity of thefood bolus) obtained by Raut et al. [1]. Therefore, ourmodel is approximately suitable to study the effect ofviscosity on swallowing the food bolus through theesophagus.
It is found that the peaks of pressure are identical inthe integral case while the peaks are different in the non-integral case. It is also inferred that more pressuredifference is required for averaged flow rate if viscosityis more. It is further concluded that the pumping effi-ciency increases for fluids with higher viscosity. The sizeof trapped bolus reduces with higher viscosity.
References
[1] V.V. Raut, G.J. McKee, B.T. Johnston, Effect of bolus consistency onswallowing—does altering consistency help?, Eur Arch. Otorhino-laryngol. 258 (2001) 49–53.
[2] W.J. Dodds, Radiology of oesophagus, in: A.R. Margulis,H.J. Burhenne (Eds.), Alimentary Tract Radiology, 3rd ed., 1983,pp. 1529–1603.
[3] J. Ren, B.T. Massey, W.J. Dodds, M.K. Kern, J.G. Brasseur, R. Shaker,S.S. Harrington, W.J. Hogan, R.C. Arndorfer, Determinants of intra-bolus pressure during esophageal peristaltic bolus transport, Am. J.Physiol. 264 (1993) G407–G413.
[4] T.W. Latham, Fluid Motion in a Peristaltic Pump, M.S. Thesis, MIT,Cambridge, 1966.
[5] A.H. Shapiro, M.Y. Jafferin, S.L. Weinberg, Peristaltic pumping withlong wavelengths at low Reynolds number, J. Fluid Mech. 35 (1969)669–675.
[6] J.G. Brasseur, S. Corrsin, N.Q. Lu, The influence of peripheral layer ofdifferent viscosity on peristaltic pumping with Newtonian fluids, J.Fluid Mech. 174 (1987) 495–519.
[7] J.C. Misra, S.K. Pandey, Peristaltic flow of a multilayered powerlaw fluid through a cylindrical tube, Int. J. Eng. Sci. 39 (2001)387–402.
[8] J.C. Misra, S.K. Pandey, Peristaltic transport of blood in smallvessels: study of a mathematical model, Comput. Math. Appl. 43(2002) 1183–1193.
[9] A.E.H.A.E. Naby, A.E.M.E. Misery, I.I.E. Shamy, Hydromagnetic flowof fluid with variable viscosity in a uniform tube with peristalsis, J.Phys. A: Math. Gen. 36 (2003) 8535–8547.
[10] E.F. Elshehawey, Z.M. Gharsseldien, Peristaltic transport of threelayered flow with variable viscosity, Appl. Math. Comput. 153(2004) 417–432.
[11] A.E.H.A.E. Naby, A.E.M.E. Misery, I.I.E. Shamy, Effects of an endo-scope and fluid with variable viscosity on peristaltic motion, Appl.Math. Comput. 158 (2004) 497–511.
[12] T. Hayat, N. Ali, Effect of variable viscosity on the peristaltictransport of a Newtonian fluid in an asymmetric channel, Appl.Math. Modelling 32 (2008) 761–774.
[13] N. Ali, Q. Husain, T. Hayat, S. Asghar, Slip effects on the peristaltictransport of MHD fluid with variable viscosity, Phys. Lett. A 372(2008) 1477–1489.
[14] T. Hayat, E. Momoniat, F.M. Mahomed, Peristaltic MHD flow ofthird grade fluid with an endoscope and variable viscosity, J.Nonlinear Math. Phys. 15 (2008) 91–104.
[15] S. Nadeem, T. Hayat, N.S. Akbar, M.Y. Malik, On the influence ofheat transfer in peristalsis with variable viscosity, Int. J. Heat MassTransfer 52 (2009) 4722–4730.
[16] T. Hayat, F.M. Abbasi, Variable viscosity effects on the peristalticmotion of a third-order fluid, Int. J. Numer. Methods Fluidsdoi:10.1002/fld.2428.
[17] S.A. Sezer, A. Yildirim, A numerical treatment for the solution of thehydromagnetic peristaltic flow of a bio-fluid with variable viscosityin a circular cylindrical tube, Int. J. Numer. Methods Biomed. Eng.doi:10.1002/cnm.1398.
[18] M. Li, J.G. Brasseur, Non-steady peristaltic transport in finite lengthtubes, J. Fluid Mech. 248 (1993) 129–151.
[19] J.G. Brasseur, W.J. Dodds, Interpretation of intraluminal mano-metric measurements in terms of swallowing mechanics, Dyspha-gia 6 (1991) 100–119.

D. Tripathi / Acta Astronautica 69 (2011) 429–439 439
[20] J.C. Misra, S.K. Pandey, A mathematical model for oesophageal swallow-ing of a food bolus, Math. Comput. Model 33 (2001) 997–1009.
[21] S.K. Pandey, D. Tripathi, Influence of magnetic field on the peri-staltic flow of a viscous fluid through a finite-length cylindricaltube, Appl. Bionics Biomech. 7 (2010) 169–176.
[22] S.K. Pandey, D. Tripathi, Peristaltic flow characteristics of Maxwelland Magneto-hydrodynamic fluids in finite channels, J. Biol. Syst.18 (2010) 621–647.
[23] S.K. Pandey, D. Tripathi, Unsteady model of transportation of Jeffreyfluid by peristalsis, Int. J. Biomath. 3 (2010) 453–472.
[24] S.K. Pandey, D. Tripathi, Peristaltic transport of a casson fluid in afinite channel: application to flows of concentrated fluids inoesophagus, Int. J. Biomath. 3 (2010) 473–491.
[25] S.K. Pandey, D. Tripathi, A mathematical model for peristaltictransport of micro-polar fluids, Appl. Bionics Biomech., in press,doi:10.3233/ABB-2011-0003.


![Computers in Biology and Medicine - muyangamigo.github.io · piezoelectric pulse transducer to detect food bolus passage through the esophagus. In [17], Ertekin et al. used piezoelectric](https://static.fdocuments.net/doc/165x107/5e1ce8c282daf40376477ec4/computers-in-biology-and-medicine-piezoelectric-pulse-transducer-to-detect-food.jpg)


