Three dimensional, two phase flow mathematical model for PEM fuel cell. Part I. Model development

1
A Mathematical Model for Predicting the Life of PEM Fuel
Cell Membranes Subjected to Hydration Cycling
SF Burlatsky1 M Gummalla1 J ONeill4
VV Atrazhev23 AN Varyukhin3 DV Dmitriev23 NS Erikhman23
1 United Technologies Research Center 411 Silver Lane East Hartford CT 06108 USA
2 Russian Academy of Science Institute of Biochemical Physics Kosygin str 4 Moscow
119334 Russia
3 Science for Technology LLC Leninskiy pr-t 95 119313 Moscow Russia
4 UTC Power 195 Governors Highway South Windsor CT 06074 USA
Corresponding Author Phone 1 860-610-7383 Fax 1 860-660-8240 Email
gummalmutrcutccom
Abstract
Under typical PEM fuel cell operating conditions part of membrane electrode assembly
is subjected to humidity cycling due to variation of inlet gas RH andor flow rate Cyclic
membrane hydrationdehydration would cause cyclic swellingshrinking of the
unconstrained membrane In a constrained membrane it causes cyclic stress resulting in
mechanical failure in the area adjacent to the gas inlet A mathematical modeling
framework for prediction of the lifetime of a PEM FC membrane subjected to hydration
cycling is developed in this paper The model predicts membrane lifetime as a function
of RH cycling amplitude and membrane mechanical properties The modeling
framework consists of three model components a fuel cell RH distribution model a
2
hydrationdehydration induced stress model that predicts stress distribution in the
membrane and a damage accrual model that predicts membrane life-time Short
descriptions of the model components along with overall framework are presented in the
paper The model was used for lifetime prediction of a GORE-SELECT membrane
I Introduction
Mechanical degradation of PEM membrane can limit stack lifetime Operation of a fuel
cell under realistic load cycles results in both chemical and mechanical degradation of the
polymer electrolyte membrane Degradation of the membrane causes opening up of
pinholes or crazing of polymer [1 2 7] increasing gas-crossover and subsequently
resulting in catastrophic failures of the fuel cell stack
Understanding and modeling the mechanical degradation mechanism and kinetics enables
prediction of membrane lifetime as a function of PEM operational conditions and
optimization of membrane structure through the choice of reinforcement [4] the
membrane processing methods and the operating conditions The physics based model of
membrane mechanical degradation could guide the synthesis of new membranes with
tuned mechanical properties and enhanced life in a fuel cell
Hydration cycling is a primary cause of the mechanical degradation of a geometrically
constrained polymer which exhibits dimensional changes with varied water content A
simple way to impose mechanical damage to a geometrically constrained PEM
membrane is to subject it to humidity cycling At high RH the membrane absorbs water
and at low RH the membrane desorbs water Such RH cycling would result in swelling
3
and shrinking of an unconstrained polymer RH cycling of a constrained polymer causes
cyclic stress In PEM such geometrical constraints are imposed by bipolar plate ribs
through the gas diffusion layers (GDLs) catalyst layers adjacent to the membrane and at
the seals Moreover we hypothesize that internal stress in the membrane can be caused
by the difference in gas RH at the anode and cathode membrane surfaces that routinely
occurs at fuel cell operational conditions Cyclic stress in the membrane causes
irreversible elongation of the membrane [7] and subsequent formation of crazes and
cracks that causes gas crossover through the membrane and stack failure
The goal of this work is to develop a model that predicts membrane lifetime as a function
of fuel cell design and operating conditions and also of membrane transport and
mechanical properties Three components are needed to model the mechanical
degradation process under RH cycling These components are a fuel cell RH distribution
model a hydrationdehydration induced stress model and a damage accrual model see
Fig1 The fuel cell RH distribution model calculates RH distribution in fuel cell gas
channels as a function of operating conditions and time This distribution depends on
fuel cell design The stress model predicts the stress profile in the membrane for a given
time-dependent profile of RH at the membraneelectrode interfaces The damage accrual
model predicts the membrane lifetime for a given stress profile in the membrane The
latter two model components use the extended Eyring model of polymer viscoelastic
deformation The damage accrual model component predicts the membrane irreversible
elongation as a function of applied stress and time RH and temperature distribution in
gas channels and membrane hydration at steady-state conditions as a function of fuel cell
4
operating conditions were published and discussed in [8 9 10 11 12] Hence they are
not described further in this work and the focus is on other model components The main
features and limitations of the three novel modeling components are briefly discussed
below
Viscoelastic polymer deformation
A large number of models of polymer deformation are available in the literature The
linear theory of viscoelasticity was introduced by Boltzmann [13] many decades ago and
it provides the basis for all well-known constitutive models of linear viscoelasticity
(Maxwell model KelvinndashVoigt model Standard linear solid model and their
generalizations) These models utilize the analogy with mechanical systems consisting of
elastic springs and viscous dampers Models of linear viscoelasticity often fail when
either high deformation (gt10) or long-term behavior of polymers is studied Therefore
to predict membrane lifetime an approach is required which accounts for non-linear
effects of polymer viscoelasticity
There are several approaches for non-linear viscoelasticity modeling The empirical
approach uses correlations between time-dependent stress and strain [14 15 and 16] This
approach relies on numerous fitting parameters that are specific for a given polymer The
alternative approach is a semi-empirical [17 18] or purely mathematical [19]
generalization of Boltzmannrsquos linear theory The nonlinear time-dependent constitutive
model for prediction of the hygro-thermomechanical behavior of Nafion was proposed in
[20] and fitted to experimental data Neither approach accounts for the microscopic
physics of polymer deformation In contrast to the empirical and semi-empirical models
5
the molecular theory of non-linear viscoelasticity proposed by Eyring et al [34] is based
on a physical concept of polymer dynamics This model assumes that polymer
deformation occurs as a motion of polymer chain segments that overcome potential
barriers at the entanglement points This model predicts the (non-linear) dependence for
polymer elongation on applied constant stress In this paper the Eyring concept is
extended to predict stress relaxation in a constrained polymer
Hydrationdehydration stress model
The hydrationdehydration stress model calculates water distribution in the membrane as
a function of time and local stress in the membrane caused by changes in water content
The equilibrium water content of Nafion membranes as a function of gas RH was
experimentally studied in [26] The dynamics of water sorptiondesorption by Nafion
membranes and water transport through membranes were studied in [27 28 29] Nafion
demonstrates unusual water transport properties For example its water sorption time is
an order of magnitude larger than its water desorption time [27] Several mathematical
models of water transport in Nafion membranes are available in the literature [30 31 32
and 33] Currently models of ionomer water transport are based on the diffusion
equation and modeling efforts are focused on calculation of the water diffusion
coefficient as a function of membrane water content The ionomergas interfacial barrier
was hypothesized in [33] The model developed in [33] explains the peculiar kinetics of
water sorptiondesorption by the kinetics of water evaporationcondensation at the
ionomergas boundary In the current paper we assume thermodynamic equilibrium of
water in the membrane with vapor at the membrane interface taking advantage of the
low ratio of water sorptiondesorption time constant to the humidity cycling period
6
Water transport in the membrane bulk is treated as diffusion with the water diffusion
coefficient dependent on the membrane water content
The hydrationdehydration stress model assumes that the local stress in the membrane is
induced by competition between the membranersquos tendency to swell or shrink in response
to a change in hydration level and the geometrical constraints that prevent the membrane
from swelling or shrinking Unconstrained PFSA membranes are known to absorb water
and undergo dimensional changes [1] The dimensional changes can be controlled by the
choice of reinforcement [4] and the membrane processing methods Reinforced
membrane demonstrates approximately 4x lower dimensional change than that of non-
reinforced membrane under the same conditions Tang et al experimentally studied
mechanical properties and dimensional change of Nafion 111 membrane [1] and
reinforced Gore membrane [4] as a function of temperature and RH According to [1 4]
the membrane dimensional change is proportional to the change of RH in ambient air
Though the dependence of water content in the membrane on RH [36] is a nonlinear
function we linearized it in the water content interval from 3 to 12 to speed up the
calculations In the hydrationdehydration stress model we utilize a new non-linear
equation for polymer stresselongation that is predicted by the extended Eyring model
Taking advantage of this stresselongation equation along with the linear dependence of
the membrane swelling on water content we calculate the stress distribution induced by
cyclic hydrationdehydration The model parameters are obtained from experimental data
presented in [4 36]
7
Damage accrual model
The damage accrual model is based on experimental data for membrane failure under
cyclic stress and on our concept of polymer plastic deformation Tensile stress caused by
membrane dehydration in a constrained Nafion 111 membrane was studied
experimentally by Tang et al [7] Dependence of stress on dehydration level was
measured and the typical stress value was approximately 1MPa for a membrane that was
dehydrated from 100 RH to 60 RH Such stress is approximately an order of
magnitude lower than the tensile strength of a Nafion membrane Tang et al [7] have
experimentally shown that the amplitude of the cyclic stress that caused substantial
permanent elongation of Nafion 111 is 110 of the Nafion 111 tensile strength Nafion
membrane creep tests under constant load are reported in the work of Majsztrik et al [21]
In [21] the Nafion creep dynamics was experimentally studied as a function of the
temperature and the membrane hydration level The applied tensile stress was
approximately equal to 155 MPa That stress is also by approximately one order of
magnitude lower than the tensile strength of Nafion A strong dependence of Nafion
creep rate on the hydration level was observed in [21] At 8RH and gt60ordmC low water
contenthardens the Nafion membrane and decreases the rate of creep The creep rate of
dry Nafion dramatically increases at ~ 90ordmC which corresponds to the temperature of
Nafion α-relaxation detected in DMA tests in [22 23] At the same temperature the
creep rate of wet Nafion (RH gt 8) increases much more slowly than that of dry Nafion
Authors explain observed Nafion stiffening with RH increase by the increased
electrostatic interaction in ionic clusters composed of SO3H polar groups in the presence
of water molecules To develop the microscopic model that explains experimental data
8
on Nafion creep dynamics fundamental insights into the mechanism for polymer damage
accrual are needed
Kusoglu [5] showed through simulations that a hydro-thermal loading under fuel cell
operating conditions results in compressive stress in the polymer According to [5] the
stress level exceeds the yield strength causing permanent damage to the polymer
membrane The compressive stress causes extrusion of membrane materials from the
compressed areas such as the areas under the seals Apparently the membrane extrusion
does not cause the loss of membrane integrity We assume that the tensile stress in
membrane is much more damaging for membrane integrity because it causes formation
and propagation of cracks and crazes In the present work we focus on generation of
through-plane cracks in the membrane that result in gas crossover through the membrane
and dramatic performance loss
In summary membrane hydration and dehydration changes the local membrane water
content resulting in a stress cycle in the polymer membrane A correlation between
hydration level and stress cycling is needed Additionally to predict life of the
membrane a correlation between membrane macroscopic mechanical properties stress-
cycling and membrane damage accrual needs to be developed The overall model that
predicts membrane lifetime as a function of membrane mechanical properties and fuel
cell operating conditions could guide the synthesis of new membranes with tuned
mechanical properties and enhanced life in a fuel cell Development of such a modeling
9
framework to predict the life of a membrane subjected to hydration cycles is the focus of
this work
The rest of the paper is organized as follows The extended Eyring model of polymer
viscoelastic deformation is presented in Section II This model is used as a basis of the
membrane stress and damage accrual models rather than as a standalone framework
component A model that predicts stress in the membrane during RH cycling in gas
channels for given membrane mechanical properties is proposed in Section III Next a
mathematical model identifying the functional form that relates the stress cycle to
irreversible damage of the polymer is discussed in Section IV The accrual of such
irreversible damage results in subsequent polymer failure determining the membrane life
subjected to hydration cycling Input parameters of the model are summarized in Section
V Modeling results for a GORE-SELECT membrane and discussion of the results are
presented in Section VI Conclusions are presented in Section VII
II Extended Eyring model for polymer deformation
The time dependent response of the stress to applied strain that takes into account
viscoelastic relaxation in the polymer material is needed for two components of the
degradation model The model of polymer viscoelastic deformation utilized this paper is
based on the assumption that polymer deformation occurs through the transport of
polymer chains through entanglements The early Eyring model [34] is based on a
similar concept The Eyring model calculates the non-linear dependence of polymer
deformation on applied constant stress and is relevant to creep experiments In a creep
experiment a sample is subjected to constant stress lower than the yield stress while the
10
elongation is monitored In this section we briefly describe a new extended Eyring
model that calculates stress relaxation in a stretched constrained polymer under arbitrary
time-dependent controlled deformation
The concept used in the current model is summarized below Following [37] we model a
polymer as a set of entangled chains One chain wraps around another chain and turns
around at the entanglement point In the current model stress is transmitted from one
chain to another through the entanglements which secure the mechanical integrity of the
polymer A Chain Segment (CS) is defined as a fraction of the chain confined between
two subsequent entanglements The macroscopic deformation of the polymer is
calculated from the microscopic elongation of CSs driven by the changing distance
between entanglements The macroscopic stress is calculated from the microscopic
tension acting along the CSs This concept to a large extent is similar to the concept of
interconnected elastic springs in elasticity theory The CS is an analog of the spring the
entanglement is an analog of the point where the springs are attached to each other The
elastic deformation in the current polymer model is achieved through the elastic
deformation of individual CSs which is an analog of the elastic deformation of the
springs in elasticity theory The fundamental difference comes from the fact that the
chains can slip through entanglements changing the equilibrium length of CSs We
assume that slippage of the chain through entanglements causes irreversible elongation of
the polymer
11
To calculate the slip rate as a function of tensile force we consider the dynamics of CS at
the entanglement as indicated in Fig 2a In the absence of the tensile force F the
monomer adjacent to the entanglement is located in the local energy minimum between
two symmetric energy barriers U0 (Fig 2b) The chain slips through the entanglement
when the monomer overcomes one of the energy barriers
In a stressed polymer a tensile force F is induced by stress and acts on the chain (Fig
2a) disturbing the symmetry of the monomerrsquos potential energy well the right barrier
becomes lower by Fa and the left barrier becomes higher byFa where a is the
monomer length This results in preferable displacement of the monomer to the right ie
along the force direction Here we assume that the monomer motion is thermally induced
and assisted by the force F 0UFa ltlt The rate +V at which the monomer jumps to the
right is
minusminus=+
kT
FaUaV 00 exp
2ω
(1)
The rate of monomer displacement to the left minusV is
+minus=minus
kT
FaUaV 00 exp
2ω
(2)
Therefore the average rate of polymer transport through the entanglement is
=kT
FaaV sinhω (3)
Here ω is the frequency of thermally activated jumps of a monomer in the local minimum
in the entangled state
12
minus=kT
U00 expωω (4)
Equation (3) indicates non-linear dependence of the chain slip rate through the
entanglement on the tensile force of the chain Equation (3) describes the conventional
linear dependence of velocity on the force when 1ltltkT
Fa
FkT
aV
ω2
= (5)
Here kT
a ω2
is a mobility of the chain in the entanglement In the opposite limit 1gtgtkT
Fa
equation (3) describes an exponential dependence of velocity on the force
=kT
FaaV exp
2ω
(6)
In a future publication the exponential increase of the chain slip rate through
entanglements with increasing tensile force will be related to the shape of σ-ε curves
observed for polymer materials We speculate that the yield stress is related to crossover
of the chain slip rate from equation (5) to equation (6)
Following the above concept of polymer plastic deformation we express macroscopic
stress σ through microscopic tension force F and the rate of macroscopic deformation
dt
dε through the microscopic chain velocity V predicted by equation (3) The detailed
derivation will be published in a forthcoming paper The final microscopic equation that
relates polymer deformation ε with external stress σ is presented below
minus=
T
T
dt
dE
dt
d
σσ
τσεσ
sinh (7)
13
Here τ is the polymer relaxation time and εσ
partpart=E is Youngrsquos modulus for the polymer
relT V
kT=σ where Vrel is a typical volume of polymer matrix around the entanglement
disturbed by one elementary act of monomer transfer through the entanglement The first
term in right hand part of equation (7) is the rate of the stress change induced by polymer
deformation The second term is rate the plastic relaxation of the stress This term
represents an extension of Maxwellrsquos relaxation rate στ In the case of low stress
Tσσ ltlt hyperbolic sine sinh in the right hand side of equation (7) is expanded to
reproduce the well-known Maxwell equation for polymer viscoelastic deformation
[ ]τσεσ minus=minus
partpart
Et
(8)
The fundamental difference between equation (7) and the Maxwell equation (8) is in the
relaxation terms in the right hand sides of equations (7) and (8) At large stress Tσσ gtgt
the hyperbolic sine asymptotically approaches the exponent leading to a sharp increase
in the stress relaxation rate as the applied stress is increased The detailed derivation of
equation (7) and validation of the model presented above will be published later in a
separate paper
III Membrane Stress Model
In this section we present the model that calculates the stress induced by
hydrationdehydration cycling In a fuel cell stack the membrane electrode assembly
(MEA) is constrained between two bipolar plates (Fig 3a) The membrane can
neitherbend nor change length Fuel is supplied to the MEA through fuel gas channels
14
and oxidant is supplied through oxidant (air) channels as indicated schematically in
Figure 3
To illustrate the mechanism of membrane failure due to RH cycling in the gas channels
we consider the following experiment Initially wet fuel is fed into the anode gas
channel (top channel shown in Figure 3a) and wet air is fed into the cathode gas channel
(bottom channel shown in Figure 3a) Both sides of the membrane are equilibrated with
wet gas until the equilibrium water content λ0 is reached and all mechanical stresses in
the membrane relax to zero The cathode side of the membrane dehydrates and attempts
to shrink when feed gas (air) is switched from wet to dry in the cathode gas channel
Mechanical constraints which prevent the membrane from shrinking cause in-plane
tensile stress σyy in the membrane Tensile stress results in a crack formation on the RH
cycled side of the membrane (Fig 3b) Further propagation of the crack in the through-
plane direction causes membrane mechanical failure
To calculate water distribution in the membrane cross-section at a fixed coordinate y
along the air channel we use RH(yt) the relative humidity distribution function predicted
by the fuel cell model Here we assume that the equilibration time of water in the
membrane is much smaller than RH cycling period in the gas channels Therefore the
water at the membrane interfaces is in thermodynamic equilibrium with vapor in the gas
channels
( ) ( )( )( ) ( )( )tyRHtyLx
tyRHtyx
Aeqm
Ceq
0
λλλλ==
== (9)
15
Here x is the through-membrane coordinate λeq(RH) is the equilibrium water content in
the membrane (an experimentally measured function of RH) RHC is the gas RH in the
cathode gas channel and RHA is the gas RH in the anode gas channel In the current
paper we utilize the following conventional diffusion equation with a water content
dependent diffusion coefficient to calculate water profile in the membrane
( ) 0=
partpart
partpartminus
partpart
xD
xt
λλλ (10)
Here D(λ) is the experimentally measured water diffusion coefficient in the membrane
(see Fig7 in Section VI) Initial conditions for equation (10) can be chosen arbitrarily
because after several cycles the membrane evolves to a new quasi-equilibrium state
governed by cyclic conditions and the initial state becomes irrelevant We chose the
initial conditions ( ) 00 λλ =x Solution of equation (10) with the boundary conditions (9)
gives the water distribution in the membrane λ(xyt) Below we calculate the membrane
stress at the membrane boundary adjacent to the air inlet (fixed coordinate y) where RH
cycling and stress amplitudes are maximal and limit membrane lifetime We start with a
calculation of the linear elastic response of the membrane to small changes in λ and
subsequently model the more general viscoelastic case
The macroscopic state of the membrane is determined by two parameters the membrane
length L0 and water content λ0 We assume that at equilibrium the stress in the
membrane is equal to zero The stress in the membrane can be generated by deviation of
the membrane length from equilibrium 0LLL minus=∆ at constant water content Also the
stress can be generated by deviation of water content from equilibrium
16
( ) ( ) 0 λλλ minus=∆ txtx in the geometrically constrained membrane (at constant length)
By analogy with linear elasticity theory with thermal expansion we calculate the linear
response of the membrane stress to small deviation from equilibrium as follows
( )( )txE yyyy λαεσ ∆minus= (11)
Here 0LLyy ∆=ε and E is the Young modulus of the membrane Swelling coefficient α
determines the length change ∆y of unconstrained (zero σ) membrane caused by the
change of the membrane water content ∆λ λα∆=∆ yy In 1D approximation the local
stress in the membrane depends on the change of the local membrane hydration (λ(xt)-
λ0)
In the membrane stress can be induced by changes in deformation water content and
simultaneous plastic relaxation The total rate of the stress change is the sum of the stress
change rate caused by membrane deformation and the stress change rate caused by the
change of membrane water content
λε
σσσttdt
d yyyyyy
partpart
+part
part= (12)
According to equation (11) the rate of the stress change induced by the change of the rate
of deviation of water content in constrained system with constant deformation and
without plastic relaxation is
dt
dE
tyy λα
σ
ε
∆=part
part (12a)
The second term in equation (12) is presented by equation (7)
17
minus=
partpart
T
Tyyyy
dt
dE
t σσ
τσεσ
λλ
sinh (12b)
Substituting equations (12a) and (12b) into the right hand side of equation (12) we obtain
the equation for the total rate of stress change in the membrane
( ) ( ) ( ) ( )
minus∆+
partpart
=T
yyTyyyy tx
dt
txdE
t
txE
dt
txd
σσ
τσλα
εσ
λ
sinh
(13)
The first term in the right hand side of equation (13) is equal to zero in a constrained
membrane Local water content λ(xt) is calculated by equation (10) with boundary
conditions (9) Equation (13) relates the stress in the membrane with water content in the
membrane for arbitrary RH cycling protocol
Equation (13) was solved numerically with parameters specified in the Table 1 The
calculated stress as a function of time is presented in Figure 7 The results indicate that
the membrane stress becomes a periodic function of time after several cycles if RH is a
periodic function of time To derive an analytical equation for the periodic stress we
utilize the separation of slow variable method The plastic (irreversible) deformation of
the membrane during one cycle is small because the cycling period is much smaller than
the membrane relaxation time Tcyc ltlt τ Therefore we can consider the membrane as an
elastic media during one cycle However the membrane slowly approaches a new
equilibrium state during each cycle After a long time t gtgt τ the membrane reaches the
new state with new equilibrium water content ( )xλ During the cycle λ oscillates below
and above ( )xλ At ( )xλλ = the membrane is not stressed The in-plane stress in the
18
periodical regime is driven by the deviation of λ from ( )xλ and is calculated by
following equation
( ) ( ) ( ) ( )( )xtxtxEtxyy λλασ minusminus= (14)
The stress averaged over time in the periodic regime is equal to zero for any x
Averaging (14) over time and taking advantage of the condition ( ) 0 =tyy txσ we
obtain the following expression for ( )xλ
( ) ( ) ( )( )
t
t
txE
txtxEx
λλ = (15)
Substituting (15) into (14) we obtain the final equation for the stress under periodic RH
cycling
( ) ( ) ( ) ( ) ( )( )
minusminus=
t
tyy txE
txtxEtxtxEtx
λλασ (16)
Substituting ( )txλ calculated from equation (10) with boundary conditions (9) into
equation (16) we calculate cyclic stress in the membrane
IV Damage accrual model
In this section we describe the model that calculates the membrane lifetime as a function
of applied cyclic stress Using the membrane stress model presented in Section III we
calculate the stress profile in the membrane ( )txyy σ for a given water content λ(xt)
We predict the membrane lifetime as a function of membrane stress using the damage
accrual model
19
The typical stress in the membrane under fuel cell operating conditions is much smaller
than the membrane tensile strength Many RH cycles are required to cause substantial
membrane damage However with each cycle the cyclic stress causes small irreversible
elongation ie plastic deformation of the membrane Accumulation of irreversible
elongation in the membrane causes membrane damage after a large number of cycles
Tang et al [7] experimentally studied Nafion111 membrane irreversible elongation under
cyclic stress They observed that irreversible elongation is accumulated over a large
number of cycles and causes damage of the membrane even at relatively small
amplitudes of cyclic stress They also demonstrated that at relatively small stress
σlt4MPa the membrane elongation rate is a linear function of applied stress magnitude
At larger stress amplitudes of about σ=65MPa the elongation rate rapidly increases We
speculate that such nonlinear dependence of elongation rate on stress amplitude is caused
by exponential dependence of the stress relaxation rate on the stress magnitude predicted
by extended Eyring model presented in Section III
The elongation of the membrane subjected to step-like cyclic stress is a function of the
stress amplitude σ and the cycle period Tcyc Applying equation (7) to the membrane
elongation during constant stress hold in one cycle we obtain
=
T
cycT
E
T
σσ
τσ
ε sinh1 (17)
Only a small fraction γ of this elongation is irreversible ie leads to membrane damage
In the current work we assume that γ depends only on cyclic period Tcyc and is
20
independent of σ Also we do not account for self-acceleration of membrane damage ie
we assume that irreversible elongation is proportional to the number of cycles N The
equation for irreversible elongation of the membrane per N cycles is
( )
=
T
NNσσεσε sinh 0 (18)
Here ε0 is
( )τγσ
εE
TT cyccycT=0 (19)
The elongation as a function of the stress and the number of cycles ε(σN) was measured
experimentally using Dynamic Mechanical Analysis (DMA) equipment for two specific
values of stress amplitude Because ε0 is proportional to an unknown parameter γ and
inversely proportional to another unknown parameter τ the lumped parameter ε0 was
used for fitting The model parameters ε0 and σT were fitted to DMA data The
membrane elongation for arbitrary stress amplitude σ was calculated from equation (18)
To validate equation (18) elongation per one stress cycle ε1(σ) was calculated from
Tangs experimental data [7] for Nafion111 membrane and plotted as a function of
applied stress σ see Fig 4 It follows from (18) that
( ) ( )
==
TdN
Nd
σσεσεσε sinh
01 (20)
The experimental data are in good agreement with the prediction of equation (20) with
σT=1 MPa and ε0=37sdot10-6 (Fig 4)
21
Membrane failure occurs after a critical irreversible elongation (damage) εcrit is
accumulated The number of cycles to failure Ncrit is calculated from the following
condition
( ) critcritN εσε =1 (21)
We assume that εcrit does not depend on stress amplitude and frequency and can be
measured once at a specific stress in a DMA test The number of cycles to failure NDMA
in out-off-cell tests is calculated by equation
( )Tcrit
NN
σσsinh0= (22)
( )cyccycT
critcrit
TT
EN
γστε
εε ==
00 (23)
We use N0 as a lumped fitting parameter obtained from a DMA test To obtain the values
of N0 and σT we performed stress cycling for two stress amplitudes σ and fitted the
experimental number of cycles to failure Ncrit by equation (22) Equation (22) predicts
membrane lifetime in a DMA test with arbitrary stress amplitude σ using the obtained
values of N0 and σT from experimental data Analytical dependence of these parameters
on temperature and RH will be published later
Fuel cell conditions under RH cycling differ from DMA test conditions because in DMA
testing the stress is uniformly distributed through the membrane cross-section while in
the cell the stress in the membrane changes substantially from the anode to the cathode
side We incorporated calibration parameter β into the current version of the model in
order to use equation (22) for in-cell membrane lifetime prediction This parameter is
used for renormalization of stress The membrane damage in DMA testing with stress
22
amplitude σ is equivalent to membrane damage in a fuel cell stack when the membrane is
subjected to RH cycling that cause a stress amplitude of βσ
To obtain the calibration parameter β we performed a single RH cycling experiment in a
fuel cell up to membrane failure for particular conditions and measured the experimental
membrane lifetime Ncell Using the membrane stress model we calculated the stress
amplitude σmax for these particular conditions Parameter β is calculated from the
following equation
( )Tcell
NN
σβσ max
0
sinh= (24)
Using the parameters N0 and σT obtained from fitting DMA data by equation (22) and
the parameter β obtained from the in-cell test we predict the in-cell membrane lifetime
under arbitrary RH cycling conditions
V Model parameters
In this section we present input model parameter values and experimental data for a
GORE-SELECTreg membrane in a PRIMEAreg MEA In RH cycling experiments
hydrogen with 100 RH was fed to the anode channel Air fed to the cathode channel
was cycled from RHmax to RHmin with equal time intervals Experimental conditions are
summarized in Table 1 Mechanical properties of GORE-SELECT membranes were
obtained from available literature and summarized in Table 1 DMA tests required for
model calibration were also performed
23
VI Model results
In this section we report the result of modeling of GORE-SELECT membrane damage
and lifetime under in-cell RH cycling conditions The model components ie fuel cell
model membrane stress model and stress accrual model were incorporated into the
MATLAB code The model parameters and test conditions are summarized in Section V
The relative humidity variation in the cathode gas channel during the cycle was
calculated from the fuel cell model and used as the input for the membrane stress model
The calculated relative humidity variation is shown in Fig6 The function with fast
exponential relaxation was used instead of step-wise function for better convergence of
the numerical solution The calculated dependence of λ on time at three points across
the membrane (at the cathode side at the middle of the membrane and at the anode side)
is also shown in Fig6 This dependence is calculated from water diffusion equation in
the membrane (10) with boundary conditions (9) and initial condition ( ) 110 =xλ
Figure 9 indicates that the membrane water content λ(t) follows the humidity cycle RH(t)
There is no time lag because water diffusion time in the membrane sD
htdif 20
2
asymp= is
much smaller than cycling period Tcyc=30s Here h=18 microm is membrane thickness and
D=0510-6 cm2s is the average water diffusion coefficient in the membrane
Water content in the membrane )( txλ is utilized in the membrane stress model to
predict the stress )( txσ distribution in the membrane The model prediction of the
stress in the membrane by equation (13) as a function of time is shown in Fig7 at the
24
cathode and anode sides of the membrane The membrane reaches quasi-steady state
regime after t gtgt τ and stress becomes a periodic function of time oscillating around the
equilibrium value The model prediction for the stress in the periodic regime as a
function of time calculated by equation (16) is shown in Fig8 Maximal stress is
imposed in the region with maximal humidity variation ie at the cathode side of the
membrane At the anode side of the membrane the stress is equal to zero because there is
no humidity cycling One can see that the stress calculated by equation (13) at large time
is in good agreement with the periodic stress shown in Fig8 calculated analytically from
equation (16)
Figures 7 and 8 indicate that after time t larger than relaxation time τ the stress at the
cathode sides oscillates around the equilibrium stress 0=eqσ The membrane at the
cathode side is subjected to tensile stress when ( ) ( )00 =lt xt λλ and to compressive
stress when ( ) ( )00 =gt xt λλ
The maximal value of the stress calculated by the membrane stress model is used in the
damage accrual model to predict membrane lifetime by equation (24) As discussed in
Section IV this equation contains three unknown parameters σT N0 and β Parameters
σT and N0 are calculated by fitting UTC POWER DMA data by equation (22)
Calibration parameter β is calculated from an in-cell lifetime experiment under specific
RH cycling conditions The in-cell membrane stress was calculated by the membrane
stress model
25
Using the model parameters calculated from DMA testing and in-cell RH cycling we
predicted GORE-SELECT membrane lifetime under arbitrary RH cycling conditions
Predicted membrane lifetime (number of cycles to failure) as a function of minimal RH in
the cathode gas channel RHmin is plotted in Fig 9 The anode gas humidity was
assumed to be 100 The maximal RH in the cathode gas channel RHmax of 100 was
also assumed At high RH cycling amplitude (low RHmin) the model predicts exponential
decrease of membrane lifetime with increase of RH cycling amplitude Stress amplitude
is approximately proportional to RH cycling amplitude and the number of cycles to
failure depends exponentially on the stress for large stress according to equation (22)
This results in exponential dependence of the membrane lifetime on RH cycling
amplitude for large values of amplitude (small value of RHmin)
VII Conclusions
A modeling framework was developed that predicts the lifetime of PEM fuel cell
membranes subjected to hydration cycling The developed model predicts membrane
lifetime as a function of RH cycling amplitude and membrane mechanical properties
Membrane failure in the fuel cell is caused by damage accumulation under cyclic stress in
the membrane subjected to cyclic hydrationdehydration A fuel cell membrane is
typically subjected to hydrationdehydration under fuel cell conditions One side of the
membrane dehydrates and attempts to shrink when the feed gas (air) is switched from wet
to dry in the cathode gas channel Mechanical constraints imposed by bipolar plates
prevent the membrane from shrinking This causes in-plane tensile stress in the
membrane Tensile stress causes a crack formation at RH cycled side of the membrane
26
(Fig 3) Further propagation of the crack in the through-plane direction causes
membrane mechanical failure
The modeling framework consists of three components a model of RH distribution in gas
channels a membrane stress model and a damage accrual model Several models of RH
distribution in gas channels are available in literature [8 9 10 11 and 12] and we do not
discuss this model component in the current paper In the current version of the model
we assume equilibrium of water in the membrane with the vapor at the membranegas
interface and use the conventional diffusion equation for calculation of water content in
the membrane bulk with the water diffusion coefficient dependent on water content D(λ)
The membrane stress model calculates the stress in the membrane caused by membrane
cyclic swellingshrinking under RH cycling conditions The local stress in the membrane
is caused by the change in the local hydration level The damage accrual model predicts
the number of cycles to failure for the membrane under applied cyclic stress The input
for the damage accrual model is a maximal stress in the membrane calculated by the
membrane stress model and experimental membrane lifetimes in DMA tests for two
cycling amplitudes The current version of the model also contains one calibration
parameter obtained from an in-cell RH cycling experiment with specific RH cycling
conditions
The model was utilized for in-cell lifetime predictions of GORE-SELECT membranes
The membrane mechanical properties and swelling coefficient were obtained from the
literature DMA testing and in-cell RH cycling were carried out at UTC Power After
27
calibration the model predicts membrane lifetime in fuel cells under arbitrary RH cycling
conditions The calculated membrane lifetime (number of cycles to failure) as a function
of minimal RH in cathode gas channel RHmin is plotted in Fig 9 At high RH cycling
amplitude (low RHmin) the model predicts exponential decrease of membrane lifetime
with increase of RH cycling amplitude Stress amplitude is approximately proportional
to RH cycling amplitude and the number of cycles to failure depends exponentially on
stress for large stress magnitude according to equation (22) This results in exponential
dependence of membrane lifetime on RH cycling amplitude for large values of amplitude
(small value of RHmin)
Acknowledgement
This work was supported by the US Department of Energy under the grant DE-PS36-
08GO98009
References
1 Ho Lee Taehee Kim Woojong Sim Saehoon Kim Byungki Ahn Taewon Lim
and Kwonpil Park Korean J Chem Eng 28(2) 487-491 (2011)
2 Xinyu Huang Roham Solasi Yue Zou Matthew Feshler Kenneth Reifsnider
David Condit Sergei Burlatsky Thomas Madden Journal of Polymer Science
Part B 44 (16) p 2346ndash2357 (2006)
3 Yaliang Tang Anette M Karlsson Michael H Santare Michael Gilbert Simon
Cleghorn William B Johnson Materials Science and Engineering A 425 (2006)
297ndash304
28
4 Yaliang Tang Ahmet Kusoglu Anette M Karlsson Michael H Santare Simon
Cleghorn William B Johnson Journal of Power Sources 175 (2008) 817ndash825
5 A Kusoglu A M Karlsson M H Santare S Cleghorn W B Johnson Journal
of Power Sources 161 987-996 (2006)
6 A Kusoglu A M Karlsson M H Santare Simon Cleghorn W B Johnson
Journal of Power Sources 170 345-358 (2007)
7 Haolin Tang Shen Peikang San Ping Jiang Fang Wang Mu Pan Journal of
Power Sources 170 (2007) 85ndash92
8 T F Fuller and J Newman J Electrochem Soc 140 (5) 1218-1225 (1993)
9 T V Nguyen and R E White J Electrochem Soc 140 (8) 2178-2186 (1993)
10 J S Yi and T V Nguyen J Electrochem Soc 145 (4) 1149-1159 (1998)
11 T E Springer T A Zawodzinski and S Gottesfeld J Electrochem Soc 138 (8)
2334-2342 (1991)
12 A Z Weber R M Darling and J Newman J Electrochem Soc 151 (10)
A1715-A1727 (2004)
13 L Boltzmann Pogg Ann u Chem 7 624 (1876)
14 S Turner Polymer Eng a Sci 6 306 (1966)
15 W N Findley and G Khosla J Appl Phys 26 821 (1955)
16 K van Holde J Polymer Sci 24 417 (1957)
17 T L Smith Trans Soc Rheol 6 61 (1962)
18 H Leaderman Trans Soc Rheol 6 361 (1962)
19 I M Ward and E T Onat J Mech Phys Solids 11 217 (1963)
29
20 Roham Solasi Yue Zou Xinyu Huang Kenneth Reifsnider Mech Time-Depend
Mater 12 15ndash30 (2008)
21 Paul W Majsztrik Andrew B Bocarsly and Jay B Benziger Macromolecules
41 9849-9862 (2008)
22 F Bauer S Denneler M Willert-Porada Journal of Polymer Science Part B
Polymer Physics Vol 43 786ndash795 (2005)
23 Kirt A Page Kevin M Cable and Robert B Moore Macromolecules 2005 38
6472-6484
24 Gierke T D Munn G E Wilson F C J Polym Sci Polym Phys Ed 1981 19
1687ndash1704
25 Hsu W Y Gierke T D J Membrane Sci 1983 13 307ndash326
26 Thomas A Zawodzinski Thomas E Spriner John Davey Roger Jestel Cruz
Lopez Judith Valerio and Shimshon Gottesfeld J Electrochem Soc 140 (7)
1981-1985 (1993)
27 Paul W Majsztrik M Barclay Satterfield Andrew B Bocarsly Jay B Benziger
J Membrane Sci 301 (2007) 93ndash106
28 T Takamatsu M Hashiyama A Eisenberg J Appl Polym Sci 24 (11) (1979)
2199ndash2220
29 DR Morris XD Sun J Appl Polym Sci 50 (8) (1993) 1445ndash1452
30 Shanhai Ge Xuguang Li Baolian Yi and I-Ming Hsing J Electrochem Soc
152 (6) A1149-A1157 (2005)
31 Adam Z Weber and John Newman J Electrochem Soc 151 (2) A311-A325
(2004)
30
32 Adam Z Weber and John Newman Chem Rev 2004 104 4679-4726
33 Timothy J Silverman Jeremy P Meyers and Joseph J Beaman J Electrochem
Soc 157 (10) B1376-B1381 (2010)
34 Halsey G White HJ Eyring H Text Res J 1945 v 15 p 295
35 M Gummalla VV Atrazhev AN Varyukhin and SF Burlatsky To be
published
36 P Choi and R Datta J Electrochem Soc 150 E601 (2003)
37 P de Gennes Scaling Concepts in Polymer Physics Cornell University Press
List of Tables
Table 1 Model parameters and experimental conditions
Parameter Description ValueSource
Operational conditions
Tcyc RH cycling time period 30 sec
RHmax Maximum relative humidity in cathode channel 100
RHmin Minimum relative humidity in cathode channel 10
T Cell temperature 78ordmC
Membrane properties
E(RHT) Youngrsquos modulus of the membrane [4]
)(aλ Membrane water content as a function of vapor
activity [mol H2Omol SO3] [36]
)(λD Diffusion coefficient of water in the membrane Fig5
31
α Dimension change coefficient 0004 (data from [4])
Tσ Fitting parameter (internal data fit to Eq 27) 17 MPa
0N Fitting parameter (internal data fit to Eq 27) 12middot106
β DMA to in-cell calibration parameter 23
Figure Captions
Figure 1 Schematic diagram showing the components of the model framework to predict
mechanical life of the membrane undergoing hydration cycles
Figure 2 (a) Polymer chain segment constrained by one entanglement and subjected to
the external force F (b) Potential energy of monomer in entanglement before applying
the force (in the left hand side of the Fig 2b) and after applying the force (in the right
hand side of the Fig 2b)
Figure 3 Schematic figure of membrane in fuel cell (counter-flow configuration)
constrained between two bi-polar plates (a) and crack formation (b) The wet fuel exits
from the anode gas channel (top channel) Initially wet air is fed into cathode gas
channel (bottom channel) When cathode side feed gas (air) is switched from wet to dry
cathode side of the membrane dehydrates and attempts to shrink The anode side of the
membrane remains wet and swollen
Figure 4 Fitting Tangs experimental data [7] (triangles) by equation (22) (solid line)
Fitting parameters values are σT=1 MPa and ε0=37sdot10-6
32
Figure 5 Dependence of diffusion coefficient in Nafion membrane on water content λ
(UTRC internal experimental data) There are not available data in range from 52=λ
to 15=λ so linear approximation is used in this region
Figure 6 Model prediction of dependence of RH on time and λ on time at the anode side
at the middle of the membrane and at the cathode side
Figure 7 Model prediction of stress as a function of time under RH cycling at the cathode
and at the anode sides of membrane
Figure 8 Model prediction of stress in quasi-steady-state regime at the cathode side at
the middle of the membrane and at the anode side
Figure 9 Calculated membrane lifetime (the number of cycles to failure) as a function of
minimal RH at the cathode side of membrane Anode side of membrane maintains 100
RH
33
Figures
Fuel cell RH distribution model
Operating conditionsinlet RH inlet Tcycling period
hydrationdehydration induced stress model
σ(t)Damage accrual model
Membrane Mechanical Degradation Model
Membrane propertiesE(RHT) ε∆λ DMA
ε(σNcycT) εcrit
Mechanical life-time
Fuel cell stack design
λ(t)
Figure 1
34
Figure 2
35
Figure 3
σ yy a)
b)
Crack formation
bi - polar plate
bi - polar plate
dry region
stress
y
x
σ yy a)
b)
Crack formation
bi - polar plate
bi - polar plate
dry air
wet fuel
σ yy a)
b)
Crack formation
bi - polar plate
bi - polar plate
dry region
stress
y
x
σ yy a)
b)
Crack formation
bi - polar plate
bi - polar plate
dry air
wet fuel
36
0
50
100
150
200
250
0 1 2 3 4 5 6 7
dud
N
Stress (MPa)
Figure 4
37
0
2
4
6
8
10
12
14
16
0 25 5 75 10 125 15
D1
0^-6
cm
^2s
λ
Figure 5
38
0
3
6
9
12
15
0 5 10 15 20 25 30 35 time s
000
2000
4000
6000
8000
10000
x=0 (Cathode side) x=h2 x=h (Anode side) RH
λ RH
Figure 6
39
-15
-1
-05
0
05
1
15
2
25
0 50 100 150 200 250 300
Time t
Str
ess
MP
a
x=0 (Cathode side)
x=h (Anode side)
Figure 7
40
-15
-1
-05
0
05
1
15
0 5 10 15 20 25 30 35
time s
Str
ess
MP
a
x=0 (Cathode side)x=h2x=h (Anode side)
a)
Figure 8
41
Life-time cycles
100E+05
100E+06
100E+07
100E+08
100E+09
0 02 04 06 08 1RH min
Figure 9

2
hydrationdehydration induced stress model that predicts stress distribution in the
membrane and a damage accrual model that predicts membrane life-time Short
descriptions of the model components along with overall framework are presented in the
paper The model was used for lifetime prediction of a GORE-SELECT membrane
I Introduction
Mechanical degradation of PEM membrane can limit stack lifetime Operation of a fuel
cell under realistic load cycles results in both chemical and mechanical degradation of the
polymer electrolyte membrane Degradation of the membrane causes opening up of
pinholes or crazing of polymer [1 2 7] increasing gas-crossover and subsequently
resulting in catastrophic failures of the fuel cell stack
Understanding and modeling the mechanical degradation mechanism and kinetics enables
prediction of membrane lifetime as a function of PEM operational conditions and
optimization of membrane structure through the choice of reinforcement [4] the
membrane processing methods and the operating conditions The physics based model of
membrane mechanical degradation could guide the synthesis of new membranes with
tuned mechanical properties and enhanced life in a fuel cell
Hydration cycling is a primary cause of the mechanical degradation of a geometrically
constrained polymer which exhibits dimensional changes with varied water content A
simple way to impose mechanical damage to a geometrically constrained PEM
membrane is to subject it to humidity cycling At high RH the membrane absorbs water
and at low RH the membrane desorbs water Such RH cycling would result in swelling
3
and shrinking of an unconstrained polymer RH cycling of a constrained polymer causes
cyclic stress In PEM such geometrical constraints are imposed by bipolar plate ribs
through the gas diffusion layers (GDLs) catalyst layers adjacent to the membrane and at
the seals Moreover we hypothesize that internal stress in the membrane can be caused
by the difference in gas RH at the anode and cathode membrane surfaces that routinely
occurs at fuel cell operational conditions Cyclic stress in the membrane causes
irreversible elongation of the membrane [7] and subsequent formation of crazes and
cracks that causes gas crossover through the membrane and stack failure
The goal of this work is to develop a model that predicts membrane lifetime as a function
of fuel cell design and operating conditions and also of membrane transport and
mechanical properties Three components are needed to model the mechanical
degradation process under RH cycling These components are a fuel cell RH distribution
model a hydrationdehydration induced stress model and a damage accrual model see
Fig1 The fuel cell RH distribution model calculates RH distribution in fuel cell gas
channels as a function of operating conditions and time This distribution depends on
fuel cell design The stress model predicts the stress profile in the membrane for a given
time-dependent profile of RH at the membraneelectrode interfaces The damage accrual
model predicts the membrane lifetime for a given stress profile in the membrane The
latter two model components use the extended Eyring model of polymer viscoelastic
deformation The damage accrual model component predicts the membrane irreversible
elongation as a function of applied stress and time RH and temperature distribution in
gas channels and membrane hydration at steady-state conditions as a function of fuel cell
4
operating conditions were published and discussed in [8 9 10 11 12] Hence they are
not described further in this work and the focus is on other model components The main
features and limitations of the three novel modeling components are briefly discussed
below
Viscoelastic polymer deformation
A large number of models of polymer deformation are available in the literature The
linear theory of viscoelasticity was introduced by Boltzmann [13] many decades ago and
it provides the basis for all well-known constitutive models of linear viscoelasticity
(Maxwell model KelvinndashVoigt model Standard linear solid model and their
generalizations) These models utilize the analogy with mechanical systems consisting of
elastic springs and viscous dampers Models of linear viscoelasticity often fail when
either high deformation (gt10) or long-term behavior of polymers is studied Therefore
to predict membrane lifetime an approach is required which accounts for non-linear
effects of polymer viscoelasticity
There are several approaches for non-linear viscoelasticity modeling The empirical
approach uses correlations between time-dependent stress and strain [14 15 and 16] This
approach relies on numerous fitting parameters that are specific for a given polymer The
alternative approach is a semi-empirical [17 18] or purely mathematical [19]
generalization of Boltzmannrsquos linear theory The nonlinear time-dependent constitutive
model for prediction of the hygro-thermomechanical behavior of Nafion was proposed in
[20] and fitted to experimental data Neither approach accounts for the microscopic
physics of polymer deformation In contrast to the empirical and semi-empirical models
5
the molecular theory of non-linear viscoelasticity proposed by Eyring et al [34] is based
on a physical concept of polymer dynamics This model assumes that polymer
deformation occurs as a motion of polymer chain segments that overcome potential
barriers at the entanglement points This model predicts the (non-linear) dependence for
polymer elongation on applied constant stress In this paper the Eyring concept is
extended to predict stress relaxation in a constrained polymer
Hydrationdehydration stress model
The hydrationdehydration stress model calculates water distribution in the membrane as
a function of time and local stress in the membrane caused by changes in water content
The equilibrium water content of Nafion membranes as a function of gas RH was
experimentally studied in [26] The dynamics of water sorptiondesorption by Nafion
membranes and water transport through membranes were studied in [27 28 29] Nafion
demonstrates unusual water transport properties For example its water sorption time is
an order of magnitude larger than its water desorption time [27] Several mathematical
models of water transport in Nafion membranes are available in the literature [30 31 32
and 33] Currently models of ionomer water transport are based on the diffusion
equation and modeling efforts are focused on calculation of the water diffusion
coefficient as a function of membrane water content The ionomergas interfacial barrier
was hypothesized in [33] The model developed in [33] explains the peculiar kinetics of
water sorptiondesorption by the kinetics of water evaporationcondensation at the
ionomergas boundary In the current paper we assume thermodynamic equilibrium of
water in the membrane with vapor at the membrane interface taking advantage of the
low ratio of water sorptiondesorption time constant to the humidity cycling period
6
Water transport in the membrane bulk is treated as diffusion with the water diffusion
coefficient dependent on the membrane water content
The hydrationdehydration stress model assumes that the local stress in the membrane is
induced by competition between the membranersquos tendency to swell or shrink in response
to a change in hydration level and the geometrical constraints that prevent the membrane
from swelling or shrinking Unconstrained PFSA membranes are known to absorb water
and undergo dimensional changes [1] The dimensional changes can be controlled by the
choice of reinforcement [4] and the membrane processing methods Reinforced
membrane demonstrates approximately 4x lower dimensional change than that of non-
reinforced membrane under the same conditions Tang et al experimentally studied
mechanical properties and dimensional change of Nafion 111 membrane [1] and
reinforced Gore membrane [4] as a function of temperature and RH According to [1 4]
the membrane dimensional change is proportional to the change of RH in ambient air
Though the dependence of water content in the membrane on RH [36] is a nonlinear
function we linearized it in the water content interval from 3 to 12 to speed up the
calculations In the hydrationdehydration stress model we utilize a new non-linear
equation for polymer stresselongation that is predicted by the extended Eyring model
Taking advantage of this stresselongation equation along with the linear dependence of
the membrane swelling on water content we calculate the stress distribution induced by
cyclic hydrationdehydration The model parameters are obtained from experimental data
presented in [4 36]
7
Damage accrual model
The damage accrual model is based on experimental data for membrane failure under
cyclic stress and on our concept of polymer plastic deformation Tensile stress caused by
membrane dehydration in a constrained Nafion 111 membrane was studied
experimentally by Tang et al [7] Dependence of stress on dehydration level was
measured and the typical stress value was approximately 1MPa for a membrane that was
dehydrated from 100 RH to 60 RH Such stress is approximately an order of
magnitude lower than the tensile strength of a Nafion membrane Tang et al [7] have
experimentally shown that the amplitude of the cyclic stress that caused substantial
permanent elongation of Nafion 111 is 110 of the Nafion 111 tensile strength Nafion
membrane creep tests under constant load are reported in the work of Majsztrik et al [21]
In [21] the Nafion creep dynamics was experimentally studied as a function of the
temperature and the membrane hydration level The applied tensile stress was
approximately equal to 155 MPa That stress is also by approximately one order of
magnitude lower than the tensile strength of Nafion A strong dependence of Nafion
creep rate on the hydration level was observed in [21] At 8RH and gt60ordmC low water
contenthardens the Nafion membrane and decreases the rate of creep The creep rate of
dry Nafion dramatically increases at ~ 90ordmC which corresponds to the temperature of
Nafion α-relaxation detected in DMA tests in [22 23] At the same temperature the
creep rate of wet Nafion (RH gt 8) increases much more slowly than that of dry Nafion
Authors explain observed Nafion stiffening with RH increase by the increased
electrostatic interaction in ionic clusters composed of SO3H polar groups in the presence
of water molecules To develop the microscopic model that explains experimental data
8
on Nafion creep dynamics fundamental insights into the mechanism for polymer damage
accrual are needed
Kusoglu [5] showed through simulations that a hydro-thermal loading under fuel cell
operating conditions results in compressive stress in the polymer According to [5] the
stress level exceeds the yield strength causing permanent damage to the polymer
membrane The compressive stress causes extrusion of membrane materials from the
compressed areas such as the areas under the seals Apparently the membrane extrusion
does not cause the loss of membrane integrity We assume that the tensile stress in
membrane is much more damaging for membrane integrity because it causes formation
and propagation of cracks and crazes In the present work we focus on generation of
through-plane cracks in the membrane that result in gas crossover through the membrane
and dramatic performance loss
In summary membrane hydration and dehydration changes the local membrane water
content resulting in a stress cycle in the polymer membrane A correlation between
hydration level and stress cycling is needed Additionally to predict life of the
membrane a correlation between membrane macroscopic mechanical properties stress-
cycling and membrane damage accrual needs to be developed The overall model that
predicts membrane lifetime as a function of membrane mechanical properties and fuel
cell operating conditions could guide the synthesis of new membranes with tuned
mechanical properties and enhanced life in a fuel cell Development of such a modeling
9
framework to predict the life of a membrane subjected to hydration cycles is the focus of
this work
The rest of the paper is organized as follows The extended Eyring model of polymer
viscoelastic deformation is presented in Section II This model is used as a basis of the
membrane stress and damage accrual models rather than as a standalone framework
component A model that predicts stress in the membrane during RH cycling in gas
channels for given membrane mechanical properties is proposed in Section III Next a
mathematical model identifying the functional form that relates the stress cycle to
irreversible damage of the polymer is discussed in Section IV The accrual of such
irreversible damage results in subsequent polymer failure determining the membrane life
subjected to hydration cycling Input parameters of the model are summarized in Section
V Modeling results for a GORE-SELECT membrane and discussion of the results are
presented in Section VI Conclusions are presented in Section VII
II Extended Eyring model for polymer deformation
The time dependent response of the stress to applied strain that takes into account
viscoelastic relaxation in the polymer material is needed for two components of the
degradation model The model of polymer viscoelastic deformation utilized this paper is
based on the assumption that polymer deformation occurs through the transport of
polymer chains through entanglements The early Eyring model [34] is based on a
similar concept The Eyring model calculates the non-linear dependence of polymer
deformation on applied constant stress and is relevant to creep experiments In a creep
experiment a sample is subjected to constant stress lower than the yield stress while the
10
elongation is monitored In this section we briefly describe a new extended Eyring
model that calculates stress relaxation in a stretched constrained polymer under arbitrary
time-dependent controlled deformation
The concept used in the current model is summarized below Following [37] we model a
polymer as a set of entangled chains One chain wraps around another chain and turns
around at the entanglement point In the current model stress is transmitted from one
chain to another through the entanglements which secure the mechanical integrity of the
polymer A Chain Segment (CS) is defined as a fraction of the chain confined between
two subsequent entanglements The macroscopic deformation of the polymer is
calculated from the microscopic elongation of CSs driven by the changing distance
between entanglements The macroscopic stress is calculated from the microscopic
tension acting along the CSs This concept to a large extent is similar to the concept of
interconnected elastic springs in elasticity theory The CS is an analog of the spring the
entanglement is an analog of the point where the springs are attached to each other The
elastic deformation in the current polymer model is achieved through the elastic
deformation of individual CSs which is an analog of the elastic deformation of the
springs in elasticity theory The fundamental difference comes from the fact that the
chains can slip through entanglements changing the equilibrium length of CSs We
assume that slippage of the chain through entanglements causes irreversible elongation of
the polymer
11
To calculate the slip rate as a function of tensile force we consider the dynamics of CS at
the entanglement as indicated in Fig 2a In the absence of the tensile force F the
monomer adjacent to the entanglement is located in the local energy minimum between
two symmetric energy barriers U0 (Fig 2b) The chain slips through the entanglement
when the monomer overcomes one of the energy barriers
In a stressed polymer a tensile force F is induced by stress and acts on the chain (Fig
2a) disturbing the symmetry of the monomerrsquos potential energy well the right barrier
becomes lower by Fa and the left barrier becomes higher byFa where a is the
monomer length This results in preferable displacement of the monomer to the right ie
along the force direction Here we assume that the monomer motion is thermally induced
and assisted by the force F 0UFa ltlt The rate +V at which the monomer jumps to the
right is
minusminus=+
kT
FaUaV 00 exp
2ω
(1)
The rate of monomer displacement to the left minusV is
+minus=minus
kT
FaUaV 00 exp
2ω
(2)
Therefore the average rate of polymer transport through the entanglement is
=kT
FaaV sinhω (3)
Here ω is the frequency of thermally activated jumps of a monomer in the local minimum
in the entangled state
12
minus=kT
U00 expωω (4)
Equation (3) indicates non-linear dependence of the chain slip rate through the
entanglement on the tensile force of the chain Equation (3) describes the conventional
linear dependence of velocity on the force when 1ltltkT
Fa
FkT
aV
ω2
= (5)
Here kT
a ω2
is a mobility of the chain in the entanglement In the opposite limit 1gtgtkT
Fa
equation (3) describes an exponential dependence of velocity on the force
=kT
FaaV exp
2ω
(6)
In a future publication the exponential increase of the chain slip rate through
entanglements with increasing tensile force will be related to the shape of σ-ε curves
observed for polymer materials We speculate that the yield stress is related to crossover
of the chain slip rate from equation (5) to equation (6)
Following the above concept of polymer plastic deformation we express macroscopic
stress σ through microscopic tension force F and the rate of macroscopic deformation
dt
dε through the microscopic chain velocity V predicted by equation (3) The detailed
derivation will be published in a forthcoming paper The final microscopic equation that
relates polymer deformation ε with external stress σ is presented below
minus=
T
T
dt
dE
dt
d
σσ
τσεσ
sinh (7)
13
Here τ is the polymer relaxation time and εσ
partpart=E is Youngrsquos modulus for the polymer
relT V
kT=σ where Vrel is a typical volume of polymer matrix around the entanglement
disturbed by one elementary act of monomer transfer through the entanglement The first
term in right hand part of equation (7) is the rate of the stress change induced by polymer
deformation The second term is rate the plastic relaxation of the stress This term
represents an extension of Maxwellrsquos relaxation rate στ In the case of low stress
Tσσ ltlt hyperbolic sine sinh in the right hand side of equation (7) is expanded to
reproduce the well-known Maxwell equation for polymer viscoelastic deformation
[ ]τσεσ minus=minus
partpart
Et
(8)
The fundamental difference between equation (7) and the Maxwell equation (8) is in the
relaxation terms in the right hand sides of equations (7) and (8) At large stress Tσσ gtgt
the hyperbolic sine asymptotically approaches the exponent leading to a sharp increase
in the stress relaxation rate as the applied stress is increased The detailed derivation of
equation (7) and validation of the model presented above will be published later in a
separate paper
III Membrane Stress Model
In this section we present the model that calculates the stress induced by
hydrationdehydration cycling In a fuel cell stack the membrane electrode assembly
(MEA) is constrained between two bipolar plates (Fig 3a) The membrane can
neitherbend nor change length Fuel is supplied to the MEA through fuel gas channels
14
and oxidant is supplied through oxidant (air) channels as indicated schematically in
Figure 3
To illustrate the mechanism of membrane failure due to RH cycling in the gas channels
we consider the following experiment Initially wet fuel is fed into the anode gas
channel (top channel shown in Figure 3a) and wet air is fed into the cathode gas channel
(bottom channel shown in Figure 3a) Both sides of the membrane are equilibrated with
wet gas until the equilibrium water content λ0 is reached and all mechanical stresses in
the membrane relax to zero The cathode side of the membrane dehydrates and attempts
to shrink when feed gas (air) is switched from wet to dry in the cathode gas channel
Mechanical constraints which prevent the membrane from shrinking cause in-plane
tensile stress σyy in the membrane Tensile stress results in a crack formation on the RH
cycled side of the membrane (Fig 3b) Further propagation of the crack in the through-
plane direction causes membrane mechanical failure
To calculate water distribution in the membrane cross-section at a fixed coordinate y
along the air channel we use RH(yt) the relative humidity distribution function predicted
by the fuel cell model Here we assume that the equilibration time of water in the
membrane is much smaller than RH cycling period in the gas channels Therefore the
water at the membrane interfaces is in thermodynamic equilibrium with vapor in the gas
channels
( ) ( )( )( ) ( )( )tyRHtyLx
tyRHtyx
Aeqm
Ceq
0
λλλλ==
== (9)
15
Here x is the through-membrane coordinate λeq(RH) is the equilibrium water content in
the membrane (an experimentally measured function of RH) RHC is the gas RH in the
cathode gas channel and RHA is the gas RH in the anode gas channel In the current
paper we utilize the following conventional diffusion equation with a water content
dependent diffusion coefficient to calculate water profile in the membrane
( ) 0=
partpart
partpartminus
partpart
xD
xt
λλλ (10)
Here D(λ) is the experimentally measured water diffusion coefficient in the membrane
(see Fig7 in Section VI) Initial conditions for equation (10) can be chosen arbitrarily
because after several cycles the membrane evolves to a new quasi-equilibrium state
governed by cyclic conditions and the initial state becomes irrelevant We chose the
initial conditions ( ) 00 λλ =x Solution of equation (10) with the boundary conditions (9)
gives the water distribution in the membrane λ(xyt) Below we calculate the membrane
stress at the membrane boundary adjacent to the air inlet (fixed coordinate y) where RH
cycling and stress amplitudes are maximal and limit membrane lifetime We start with a
calculation of the linear elastic response of the membrane to small changes in λ and
subsequently model the more general viscoelastic case
The macroscopic state of the membrane is determined by two parameters the membrane
length L0 and water content λ0 We assume that at equilibrium the stress in the
membrane is equal to zero The stress in the membrane can be generated by deviation of
the membrane length from equilibrium 0LLL minus=∆ at constant water content Also the
stress can be generated by deviation of water content from equilibrium
16
( ) ( ) 0 λλλ minus=∆ txtx in the geometrically constrained membrane (at constant length)
By analogy with linear elasticity theory with thermal expansion we calculate the linear
response of the membrane stress to small deviation from equilibrium as follows
( )( )txE yyyy λαεσ ∆minus= (11)
Here 0LLyy ∆=ε and E is the Young modulus of the membrane Swelling coefficient α
determines the length change ∆y of unconstrained (zero σ) membrane caused by the
change of the membrane water content ∆λ λα∆=∆ yy In 1D approximation the local
stress in the membrane depends on the change of the local membrane hydration (λ(xt)-
λ0)
In the membrane stress can be induced by changes in deformation water content and
simultaneous plastic relaxation The total rate of the stress change is the sum of the stress
change rate caused by membrane deformation and the stress change rate caused by the
change of membrane water content
λε
σσσttdt
d yyyyyy
partpart
+part
part= (12)
According to equation (11) the rate of the stress change induced by the change of the rate
of deviation of water content in constrained system with constant deformation and
without plastic relaxation is
dt
dE
tyy λα
σ
ε
∆=part
part (12a)
The second term in equation (12) is presented by equation (7)
17
minus=
partpart
T
Tyyyy
dt
dE
t σσ
τσεσ
λλ
sinh (12b)
Substituting equations (12a) and (12b) into the right hand side of equation (12) we obtain
the equation for the total rate of stress change in the membrane
( ) ( ) ( ) ( )
minus∆+
partpart
=T
yyTyyyy tx
dt
txdE
t
txE
dt
txd
σσ
τσλα
εσ
λ
sinh
(13)
The first term in the right hand side of equation (13) is equal to zero in a constrained
membrane Local water content λ(xt) is calculated by equation (10) with boundary
conditions (9) Equation (13) relates the stress in the membrane with water content in the
membrane for arbitrary RH cycling protocol
Equation (13) was solved numerically with parameters specified in the Table 1 The
calculated stress as a function of time is presented in Figure 7 The results indicate that
the membrane stress becomes a periodic function of time after several cycles if RH is a
periodic function of time To derive an analytical equation for the periodic stress we
utilize the separation of slow variable method The plastic (irreversible) deformation of
the membrane during one cycle is small because the cycling period is much smaller than
the membrane relaxation time Tcyc ltlt τ Therefore we can consider the membrane as an
elastic media during one cycle However the membrane slowly approaches a new
equilibrium state during each cycle After a long time t gtgt τ the membrane reaches the
new state with new equilibrium water content ( )xλ During the cycle λ oscillates below
and above ( )xλ At ( )xλλ = the membrane is not stressed The in-plane stress in the
18
periodical regime is driven by the deviation of λ from ( )xλ and is calculated by
following equation
( ) ( ) ( ) ( )( )xtxtxEtxyy λλασ minusminus= (14)
The stress averaged over time in the periodic regime is equal to zero for any x
Averaging (14) over time and taking advantage of the condition ( ) 0 =tyy txσ we
obtain the following expression for ( )xλ
( ) ( ) ( )( )
t
t
txE
txtxEx
λλ = (15)
Substituting (15) into (14) we obtain the final equation for the stress under periodic RH
cycling
( ) ( ) ( ) ( ) ( )( )
minusminus=
t
tyy txE
txtxEtxtxEtx
λλασ (16)
Substituting ( )txλ calculated from equation (10) with boundary conditions (9) into
equation (16) we calculate cyclic stress in the membrane
IV Damage accrual model
In this section we describe the model that calculates the membrane lifetime as a function
of applied cyclic stress Using the membrane stress model presented in Section III we
calculate the stress profile in the membrane ( )txyy σ for a given water content λ(xt)
We predict the membrane lifetime as a function of membrane stress using the damage
accrual model
19
The typical stress in the membrane under fuel cell operating conditions is much smaller
than the membrane tensile strength Many RH cycles are required to cause substantial
membrane damage However with each cycle the cyclic stress causes small irreversible
elongation ie plastic deformation of the membrane Accumulation of irreversible
elongation in the membrane causes membrane damage after a large number of cycles
Tang et al [7] experimentally studied Nafion111 membrane irreversible elongation under
cyclic stress They observed that irreversible elongation is accumulated over a large
number of cycles and causes damage of the membrane even at relatively small
amplitudes of cyclic stress They also demonstrated that at relatively small stress
σlt4MPa the membrane elongation rate is a linear function of applied stress magnitude
At larger stress amplitudes of about σ=65MPa the elongation rate rapidly increases We
speculate that such nonlinear dependence of elongation rate on stress amplitude is caused
by exponential dependence of the stress relaxation rate on the stress magnitude predicted
by extended Eyring model presented in Section III
The elongation of the membrane subjected to step-like cyclic stress is a function of the
stress amplitude σ and the cycle period Tcyc Applying equation (7) to the membrane
elongation during constant stress hold in one cycle we obtain
=
T
cycT
E
T
σσ
τσ
ε sinh1 (17)
Only a small fraction γ of this elongation is irreversible ie leads to membrane damage
In the current work we assume that γ depends only on cyclic period Tcyc and is
20
independent of σ Also we do not account for self-acceleration of membrane damage ie
we assume that irreversible elongation is proportional to the number of cycles N The
equation for irreversible elongation of the membrane per N cycles is
( )
=
T
NNσσεσε sinh 0 (18)
Here ε0 is
( )τγσ
εE
TT cyccycT=0 (19)
The elongation as a function of the stress and the number of cycles ε(σN) was measured
experimentally using Dynamic Mechanical Analysis (DMA) equipment for two specific
values of stress amplitude Because ε0 is proportional to an unknown parameter γ and
inversely proportional to another unknown parameter τ the lumped parameter ε0 was
used for fitting The model parameters ε0 and σT were fitted to DMA data The
membrane elongation for arbitrary stress amplitude σ was calculated from equation (18)
To validate equation (18) elongation per one stress cycle ε1(σ) was calculated from
Tangs experimental data [7] for Nafion111 membrane and plotted as a function of
applied stress σ see Fig 4 It follows from (18) that
( ) ( )
==
TdN
Nd
σσεσεσε sinh
01 (20)
The experimental data are in good agreement with the prediction of equation (20) with
σT=1 MPa and ε0=37sdot10-6 (Fig 4)
21
Membrane failure occurs after a critical irreversible elongation (damage) εcrit is
accumulated The number of cycles to failure Ncrit is calculated from the following
condition
( ) critcritN εσε =1 (21)
We assume that εcrit does not depend on stress amplitude and frequency and can be
measured once at a specific stress in a DMA test The number of cycles to failure NDMA
in out-off-cell tests is calculated by equation
( )Tcrit
NN
σσsinh0= (22)
( )cyccycT
critcrit
TT
EN
γστε
εε ==
00 (23)
We use N0 as a lumped fitting parameter obtained from a DMA test To obtain the values
of N0 and σT we performed stress cycling for two stress amplitudes σ and fitted the
experimental number of cycles to failure Ncrit by equation (22) Equation (22) predicts
membrane lifetime in a DMA test with arbitrary stress amplitude σ using the obtained
values of N0 and σT from experimental data Analytical dependence of these parameters
on temperature and RH will be published later
Fuel cell conditions under RH cycling differ from DMA test conditions because in DMA
testing the stress is uniformly distributed through the membrane cross-section while in
the cell the stress in the membrane changes substantially from the anode to the cathode
side We incorporated calibration parameter β into the current version of the model in
order to use equation (22) for in-cell membrane lifetime prediction This parameter is
used for renormalization of stress The membrane damage in DMA testing with stress
22
amplitude σ is equivalent to membrane damage in a fuel cell stack when the membrane is
subjected to RH cycling that cause a stress amplitude of βσ
To obtain the calibration parameter β we performed a single RH cycling experiment in a
fuel cell up to membrane failure for particular conditions and measured the experimental
membrane lifetime Ncell Using the membrane stress model we calculated the stress
amplitude σmax for these particular conditions Parameter β is calculated from the
following equation
( )Tcell
NN
σβσ max
0
sinh= (24)
Using the parameters N0 and σT obtained from fitting DMA data by equation (22) and
the parameter β obtained from the in-cell test we predict the in-cell membrane lifetime
under arbitrary RH cycling conditions
V Model parameters
In this section we present input model parameter values and experimental data for a
GORE-SELECTreg membrane in a PRIMEAreg MEA In RH cycling experiments
hydrogen with 100 RH was fed to the anode channel Air fed to the cathode channel
was cycled from RHmax to RHmin with equal time intervals Experimental conditions are
summarized in Table 1 Mechanical properties of GORE-SELECT membranes were
obtained from available literature and summarized in Table 1 DMA tests required for
model calibration were also performed
23
VI Model results
In this section we report the result of modeling of GORE-SELECT membrane damage
and lifetime under in-cell RH cycling conditions The model components ie fuel cell
model membrane stress model and stress accrual model were incorporated into the
MATLAB code The model parameters and test conditions are summarized in Section V
The relative humidity variation in the cathode gas channel during the cycle was
calculated from the fuel cell model and used as the input for the membrane stress model
The calculated relative humidity variation is shown in Fig6 The function with fast
exponential relaxation was used instead of step-wise function for better convergence of
the numerical solution The calculated dependence of λ on time at three points across
the membrane (at the cathode side at the middle of the membrane and at the anode side)
is also shown in Fig6 This dependence is calculated from water diffusion equation in
the membrane (10) with boundary conditions (9) and initial condition ( ) 110 =xλ
Figure 9 indicates that the membrane water content λ(t) follows the humidity cycle RH(t)
There is no time lag because water diffusion time in the membrane sD
htdif 20
2
asymp= is
much smaller than cycling period Tcyc=30s Here h=18 microm is membrane thickness and
D=0510-6 cm2s is the average water diffusion coefficient in the membrane
Water content in the membrane )( txλ is utilized in the membrane stress model to
predict the stress )( txσ distribution in the membrane The model prediction of the
stress in the membrane by equation (13) as a function of time is shown in Fig7 at the
24
cathode and anode sides of the membrane The membrane reaches quasi-steady state
regime after t gtgt τ and stress becomes a periodic function of time oscillating around the
equilibrium value The model prediction for the stress in the periodic regime as a
function of time calculated by equation (16) is shown in Fig8 Maximal stress is
imposed in the region with maximal humidity variation ie at the cathode side of the
membrane At the anode side of the membrane the stress is equal to zero because there is
no humidity cycling One can see that the stress calculated by equation (13) at large time
is in good agreement with the periodic stress shown in Fig8 calculated analytically from
equation (16)
Figures 7 and 8 indicate that after time t larger than relaxation time τ the stress at the
cathode sides oscillates around the equilibrium stress 0=eqσ The membrane at the
cathode side is subjected to tensile stress when ( ) ( )00 =lt xt λλ and to compressive
stress when ( ) ( )00 =gt xt λλ
The maximal value of the stress calculated by the membrane stress model is used in the
damage accrual model to predict membrane lifetime by equation (24) As discussed in
Section IV this equation contains three unknown parameters σT N0 and β Parameters
σT and N0 are calculated by fitting UTC POWER DMA data by equation (22)
Calibration parameter β is calculated from an in-cell lifetime experiment under specific
RH cycling conditions The in-cell membrane stress was calculated by the membrane
stress model
25
Using the model parameters calculated from DMA testing and in-cell RH cycling we
predicted GORE-SELECT membrane lifetime under arbitrary RH cycling conditions
Predicted membrane lifetime (number of cycles to failure) as a function of minimal RH in
the cathode gas channel RHmin is plotted in Fig 9 The anode gas humidity was
assumed to be 100 The maximal RH in the cathode gas channel RHmax of 100 was
also assumed At high RH cycling amplitude (low RHmin) the model predicts exponential
decrease of membrane lifetime with increase of RH cycling amplitude Stress amplitude
is approximately proportional to RH cycling amplitude and the number of cycles to
failure depends exponentially on the stress for large stress according to equation (22)
This results in exponential dependence of the membrane lifetime on RH cycling
amplitude for large values of amplitude (small value of RHmin)
VII Conclusions
A modeling framework was developed that predicts the lifetime of PEM fuel cell
membranes subjected to hydration cycling The developed model predicts membrane
lifetime as a function of RH cycling amplitude and membrane mechanical properties
Membrane failure in the fuel cell is caused by damage accumulation under cyclic stress in
the membrane subjected to cyclic hydrationdehydration A fuel cell membrane is
typically subjected to hydrationdehydration under fuel cell conditions One side of the
membrane dehydrates and attempts to shrink when the feed gas (air) is switched from wet
to dry in the cathode gas channel Mechanical constraints imposed by bipolar plates
prevent the membrane from shrinking This causes in-plane tensile stress in the
membrane Tensile stress causes a crack formation at RH cycled side of the membrane
26
(Fig 3) Further propagation of the crack in the through-plane direction causes
membrane mechanical failure
The modeling framework consists of three components a model of RH distribution in gas
channels a membrane stress model and a damage accrual model Several models of RH
distribution in gas channels are available in literature [8 9 10 11 and 12] and we do not
discuss this model component in the current paper In the current version of the model
we assume equilibrium of water in the membrane with the vapor at the membranegas
interface and use the conventional diffusion equation for calculation of water content in
the membrane bulk with the water diffusion coefficient dependent on water content D(λ)
The membrane stress model calculates the stress in the membrane caused by membrane
cyclic swellingshrinking under RH cycling conditions The local stress in the membrane
is caused by the change in the local hydration level The damage accrual model predicts
the number of cycles to failure for the membrane under applied cyclic stress The input
for the damage accrual model is a maximal stress in the membrane calculated by the
membrane stress model and experimental membrane lifetimes in DMA tests for two
cycling amplitudes The current version of the model also contains one calibration
parameter obtained from an in-cell RH cycling experiment with specific RH cycling
conditions
The model was utilized for in-cell lifetime predictions of GORE-SELECT membranes
The membrane mechanical properties and swelling coefficient were obtained from the
literature DMA testing and in-cell RH cycling were carried out at UTC Power After
27
calibration the model predicts membrane lifetime in fuel cells under arbitrary RH cycling
conditions The calculated membrane lifetime (number of cycles to failure) as a function
of minimal RH in cathode gas channel RHmin is plotted in Fig 9 At high RH cycling
amplitude (low RHmin) the model predicts exponential decrease of membrane lifetime
with increase of RH cycling amplitude Stress amplitude is approximately proportional
to RH cycling amplitude and the number of cycles to failure depends exponentially on
stress for large stress magnitude according to equation (22) This results in exponential
dependence of membrane lifetime on RH cycling amplitude for large values of amplitude
(small value of RHmin)
Acknowledgement
This work was supported by the US Department of Energy under the grant DE-PS36-
08GO98009
References
1 Ho Lee Taehee Kim Woojong Sim Saehoon Kim Byungki Ahn Taewon Lim
and Kwonpil Park Korean J Chem Eng 28(2) 487-491 (2011)
2 Xinyu Huang Roham Solasi Yue Zou Matthew Feshler Kenneth Reifsnider
David Condit Sergei Burlatsky Thomas Madden Journal of Polymer Science
Part B 44 (16) p 2346ndash2357 (2006)
3 Yaliang Tang Anette M Karlsson Michael H Santare Michael Gilbert Simon
Cleghorn William B Johnson Materials Science and Engineering A 425 (2006)
297ndash304
28
4 Yaliang Tang Ahmet Kusoglu Anette M Karlsson Michael H Santare Simon
Cleghorn William B Johnson Journal of Power Sources 175 (2008) 817ndash825
5 A Kusoglu A M Karlsson M H Santare S Cleghorn W B Johnson Journal
of Power Sources 161 987-996 (2006)
6 A Kusoglu A M Karlsson M H Santare Simon Cleghorn W B Johnson
Journal of Power Sources 170 345-358 (2007)
7 Haolin Tang Shen Peikang San Ping Jiang Fang Wang Mu Pan Journal of
Power Sources 170 (2007) 85ndash92
8 T F Fuller and J Newman J Electrochem Soc 140 (5) 1218-1225 (1993)
9 T V Nguyen and R E White J Electrochem Soc 140 (8) 2178-2186 (1993)
10 J S Yi and T V Nguyen J Electrochem Soc 145 (4) 1149-1159 (1998)
11 T E Springer T A Zawodzinski and S Gottesfeld J Electrochem Soc 138 (8)
2334-2342 (1991)
12 A Z Weber R M Darling and J Newman J Electrochem Soc 151 (10)
A1715-A1727 (2004)
13 L Boltzmann Pogg Ann u Chem 7 624 (1876)
14 S Turner Polymer Eng a Sci 6 306 (1966)
15 W N Findley and G Khosla J Appl Phys 26 821 (1955)
16 K van Holde J Polymer Sci 24 417 (1957)
17 T L Smith Trans Soc Rheol 6 61 (1962)
18 H Leaderman Trans Soc Rheol 6 361 (1962)
19 I M Ward and E T Onat J Mech Phys Solids 11 217 (1963)
29
20 Roham Solasi Yue Zou Xinyu Huang Kenneth Reifsnider Mech Time-Depend
Mater 12 15ndash30 (2008)
21 Paul W Majsztrik Andrew B Bocarsly and Jay B Benziger Macromolecules
41 9849-9862 (2008)
22 F Bauer S Denneler M Willert-Porada Journal of Polymer Science Part B
Polymer Physics Vol 43 786ndash795 (2005)
23 Kirt A Page Kevin M Cable and Robert B Moore Macromolecules 2005 38
6472-6484
24 Gierke T D Munn G E Wilson F C J Polym Sci Polym Phys Ed 1981 19
1687ndash1704
25 Hsu W Y Gierke T D J Membrane Sci 1983 13 307ndash326
26 Thomas A Zawodzinski Thomas E Spriner John Davey Roger Jestel Cruz
Lopez Judith Valerio and Shimshon Gottesfeld J Electrochem Soc 140 (7)
1981-1985 (1993)
27 Paul W Majsztrik M Barclay Satterfield Andrew B Bocarsly Jay B Benziger
J Membrane Sci 301 (2007) 93ndash106
28 T Takamatsu M Hashiyama A Eisenberg J Appl Polym Sci 24 (11) (1979)
2199ndash2220
29 DR Morris XD Sun J Appl Polym Sci 50 (8) (1993) 1445ndash1452
30 Shanhai Ge Xuguang Li Baolian Yi and I-Ming Hsing J Electrochem Soc
152 (6) A1149-A1157 (2005)
31 Adam Z Weber and John Newman J Electrochem Soc 151 (2) A311-A325
(2004)
30
32 Adam Z Weber and John Newman Chem Rev 2004 104 4679-4726
33 Timothy J Silverman Jeremy P Meyers and Joseph J Beaman J Electrochem
Soc 157 (10) B1376-B1381 (2010)
34 Halsey G White HJ Eyring H Text Res J 1945 v 15 p 295
35 M Gummalla VV Atrazhev AN Varyukhin and SF Burlatsky To be
published
36 P Choi and R Datta J Electrochem Soc 150 E601 (2003)
37 P de Gennes Scaling Concepts in Polymer Physics Cornell University Press
List of Tables
Table 1 Model parameters and experimental conditions
Parameter Description ValueSource
Operational conditions
Tcyc RH cycling time period 30 sec
RHmax Maximum relative humidity in cathode channel 100
RHmin Minimum relative humidity in cathode channel 10
T Cell temperature 78ordmC
Membrane properties
E(RHT) Youngrsquos modulus of the membrane [4]
)(aλ Membrane water content as a function of vapor
activity [mol H2Omol SO3] [36]
)(λD Diffusion coefficient of water in the membrane Fig5
31
α Dimension change coefficient 0004 (data from [4])
Tσ Fitting parameter (internal data fit to Eq 27) 17 MPa
0N Fitting parameter (internal data fit to Eq 27) 12middot106
β DMA to in-cell calibration parameter 23
Figure Captions
Figure 1 Schematic diagram showing the components of the model framework to predict
mechanical life of the membrane undergoing hydration cycles
Figure 2 (a) Polymer chain segment constrained by one entanglement and subjected to
the external force F (b) Potential energy of monomer in entanglement before applying
the force (in the left hand side of the Fig 2b) and after applying the force (in the right
hand side of the Fig 2b)
Figure 3 Schematic figure of membrane in fuel cell (counter-flow configuration)
constrained between two bi-polar plates (a) and crack formation (b) The wet fuel exits
from the anode gas channel (top channel) Initially wet air is fed into cathode gas
channel (bottom channel) When cathode side feed gas (air) is switched from wet to dry
cathode side of the membrane dehydrates and attempts to shrink The anode side of the
membrane remains wet and swollen
Figure 4 Fitting Tangs experimental data [7] (triangles) by equation (22) (solid line)
Fitting parameters values are σT=1 MPa and ε0=37sdot10-6
32
Figure 5 Dependence of diffusion coefficient in Nafion membrane on water content λ
(UTRC internal experimental data) There are not available data in range from 52=λ
to 15=λ so linear approximation is used in this region
Figure 6 Model prediction of dependence of RH on time and λ on time at the anode side
at the middle of the membrane and at the cathode side
Figure 7 Model prediction of stress as a function of time under RH cycling at the cathode
and at the anode sides of membrane
Figure 8 Model prediction of stress in quasi-steady-state regime at the cathode side at
the middle of the membrane and at the anode side
Figure 9 Calculated membrane lifetime (the number of cycles to failure) as a function of
minimal RH at the cathode side of membrane Anode side of membrane maintains 100
RH
33
Figures
Fuel cell RH distribution model
Operating conditionsinlet RH inlet Tcycling period
hydrationdehydration induced stress model
σ(t)Damage accrual model
Membrane Mechanical Degradation Model
Membrane propertiesE(RHT) ε∆λ DMA
ε(σNcycT) εcrit
Mechanical life-time
Fuel cell stack design
λ(t)
Figure 1
34
Figure 2
35
Figure 3
σ yy a)
b)
Crack formation
bi - polar plate
bi - polar plate
dry region
stress
y
x
σ yy a)
b)
Crack formation
bi - polar plate
bi - polar plate
dry air
wet fuel
σ yy a)
b)
Crack formation
bi - polar plate
bi - polar plate
dry region
stress
y
x
σ yy a)
b)
Crack formation
bi - polar plate
bi - polar plate
dry air
wet fuel
36
0
50
100
150
200
250
0 1 2 3 4 5 6 7
dud
N
Stress (MPa)
Figure 4
37
0
2
4
6
8
10
12
14
16
0 25 5 75 10 125 15
D1
0^-6
cm
^2s
λ
Figure 5
38
0
3
6
9
12
15
0 5 10 15 20 25 30 35 time s
000
2000
4000
6000
8000
10000
x=0 (Cathode side) x=h2 x=h (Anode side) RH
λ RH
Figure 6
39
-15
-1
-05
0
05
1
15
2
25
0 50 100 150 200 250 300
Time t
Str
ess
MP
a
x=0 (Cathode side)
x=h (Anode side)
Figure 7
40
-15
-1
-05
0
05
1
15
0 5 10 15 20 25 30 35
time s
Str
ess
MP
a
x=0 (Cathode side)x=h2x=h (Anode side)
a)
Figure 8
41
Life-time cycles
100E+05
100E+06
100E+07
100E+08
100E+09
0 02 04 06 08 1RH min
Figure 9

3
and shrinking of an unconstrained polymer RH cycling of a constrained polymer causes
cyclic stress In PEM such geometrical constraints are imposed by bipolar plate ribs
through the gas diffusion layers (GDLs) catalyst layers adjacent to the membrane and at
the seals Moreover we hypothesize that internal stress in the membrane can be caused
by the difference in gas RH at the anode and cathode membrane surfaces that routinely
occurs at fuel cell operational conditions Cyclic stress in the membrane causes
irreversible elongation of the membrane [7] and subsequent formation of crazes and
cracks that causes gas crossover through the membrane and stack failure
The goal of this work is to develop a model that predicts membrane lifetime as a function
of fuel cell design and operating conditions and also of membrane transport and
mechanical properties Three components are needed to model the mechanical
degradation process under RH cycling These components are a fuel cell RH distribution
model a hydrationdehydration induced stress model and a damage accrual model see
Fig1 The fuel cell RH distribution model calculates RH distribution in fuel cell gas
channels as a function of operating conditions and time This distribution depends on
fuel cell design The stress model predicts the stress profile in the membrane for a given
time-dependent profile of RH at the membraneelectrode interfaces The damage accrual
model predicts the membrane lifetime for a given stress profile in the membrane The
latter two model components use the extended Eyring model of polymer viscoelastic
deformation The damage accrual model component predicts the membrane irreversible
elongation as a function of applied stress and time RH and temperature distribution in
gas channels and membrane hydration at steady-state conditions as a function of fuel cell
4
operating conditions were published and discussed in [8 9 10 11 12] Hence they are
not described further in this work and the focus is on other model components The main
features and limitations of the three novel modeling components are briefly discussed
below
Viscoelastic polymer deformation
A large number of models of polymer deformation are available in the literature The
linear theory of viscoelasticity was introduced by Boltzmann [13] many decades ago and
it provides the basis for all well-known constitutive models of linear viscoelasticity
(Maxwell model KelvinndashVoigt model Standard linear solid model and their
generalizations) These models utilize the analogy with mechanical systems consisting of
elastic springs and viscous dampers Models of linear viscoelasticity often fail when
either high deformation (gt10) or long-term behavior of polymers is studied Therefore
to predict membrane lifetime an approach is required which accounts for non-linear
effects of polymer viscoelasticity
There are several approaches for non-linear viscoelasticity modeling The empirical
approach uses correlations between time-dependent stress and strain [14 15 and 16] This
approach relies on numerous fitting parameters that are specific for a given polymer The
alternative approach is a semi-empirical [17 18] or purely mathematical [19]
generalization of Boltzmannrsquos linear theory The nonlinear time-dependent constitutive
model for prediction of the hygro-thermomechanical behavior of Nafion was proposed in
[20] and fitted to experimental data Neither approach accounts for the microscopic
physics of polymer deformation In contrast to the empirical and semi-empirical models
5
the molecular theory of non-linear viscoelasticity proposed by Eyring et al [34] is based
on a physical concept of polymer dynamics This model assumes that polymer
deformation occurs as a motion of polymer chain segments that overcome potential
barriers at the entanglement points This model predicts the (non-linear) dependence for
polymer elongation on applied constant stress In this paper the Eyring concept is
extended to predict stress relaxation in a constrained polymer
Hydrationdehydration stress model
The hydrationdehydration stress model calculates water distribution in the membrane as
a function of time and local stress in the membrane caused by changes in water content
The equilibrium water content of Nafion membranes as a function of gas RH was
experimentally studied in [26] The dynamics of water sorptiondesorption by Nafion
membranes and water transport through membranes were studied in [27 28 29] Nafion
demonstrates unusual water transport properties For example its water sorption time is
an order of magnitude larger than its water desorption time [27] Several mathematical
models of water transport in Nafion membranes are available in the literature [30 31 32
and 33] Currently models of ionomer water transport are based on the diffusion
equation and modeling efforts are focused on calculation of the water diffusion
coefficient as a function of membrane water content The ionomergas interfacial barrier
was hypothesized in [33] The model developed in [33] explains the peculiar kinetics of
water sorptiondesorption by the kinetics of water evaporationcondensation at the
ionomergas boundary In the current paper we assume thermodynamic equilibrium of
water in the membrane with vapor at the membrane interface taking advantage of the
low ratio of water sorptiondesorption time constant to the humidity cycling period
6
Water transport in the membrane bulk is treated as diffusion with the water diffusion
coefficient dependent on the membrane water content
The hydrationdehydration stress model assumes that the local stress in the membrane is
induced by competition between the membranersquos tendency to swell or shrink in response
to a change in hydration level and the geometrical constraints that prevent the membrane
from swelling or shrinking Unconstrained PFSA membranes are known to absorb water
and undergo dimensional changes [1] The dimensional changes can be controlled by the
choice of reinforcement [4] and the membrane processing methods Reinforced
membrane demonstrates approximately 4x lower dimensional change than that of non-
reinforced membrane under the same conditions Tang et al experimentally studied
mechanical properties and dimensional change of Nafion 111 membrane [1] and
reinforced Gore membrane [4] as a function of temperature and RH According to [1 4]
the membrane dimensional change is proportional to the change of RH in ambient air
Though the dependence of water content in the membrane on RH [36] is a nonlinear
function we linearized it in the water content interval from 3 to 12 to speed up the
calculations In the hydrationdehydration stress model we utilize a new non-linear
equation for polymer stresselongation that is predicted by the extended Eyring model
Taking advantage of this stresselongation equation along with the linear dependence of
the membrane swelling on water content we calculate the stress distribution induced by
cyclic hydrationdehydration The model parameters are obtained from experimental data
presented in [4 36]
7
Damage accrual model
The damage accrual model is based on experimental data for membrane failure under
cyclic stress and on our concept of polymer plastic deformation Tensile stress caused by
membrane dehydration in a constrained Nafion 111 membrane was studied
experimentally by Tang et al [7] Dependence of stress on dehydration level was
measured and the typical stress value was approximately 1MPa for a membrane that was
dehydrated from 100 RH to 60 RH Such stress is approximately an order of
magnitude lower than the tensile strength of a Nafion membrane Tang et al [7] have
experimentally shown that the amplitude of the cyclic stress that caused substantial
permanent elongation of Nafion 111 is 110 of the Nafion 111 tensile strength Nafion
membrane creep tests under constant load are reported in the work of Majsztrik et al [21]
In [21] the Nafion creep dynamics was experimentally studied as a function of the
temperature and the membrane hydration level The applied tensile stress was
approximately equal to 155 MPa That stress is also by approximately one order of
magnitude lower than the tensile strength of Nafion A strong dependence of Nafion
creep rate on the hydration level was observed in [21] At 8RH and gt60ordmC low water
contenthardens the Nafion membrane and decreases the rate of creep The creep rate of
dry Nafion dramatically increases at ~ 90ordmC which corresponds to the temperature of
Nafion α-relaxation detected in DMA tests in [22 23] At the same temperature the
creep rate of wet Nafion (RH gt 8) increases much more slowly than that of dry Nafion
Authors explain observed Nafion stiffening with RH increase by the increased
electrostatic interaction in ionic clusters composed of SO3H polar groups in the presence
of water molecules To develop the microscopic model that explains experimental data
8
on Nafion creep dynamics fundamental insights into the mechanism for polymer damage
accrual are needed
Kusoglu [5] showed through simulations that a hydro-thermal loading under fuel cell
operating conditions results in compressive stress in the polymer According to [5] the
stress level exceeds the yield strength causing permanent damage to the polymer
membrane The compressive stress causes extrusion of membrane materials from the
compressed areas such as the areas under the seals Apparently the membrane extrusion
does not cause the loss of membrane integrity We assume that the tensile stress in
membrane is much more damaging for membrane integrity because it causes formation
and propagation of cracks and crazes In the present work we focus on generation of
through-plane cracks in the membrane that result in gas crossover through the membrane
and dramatic performance loss
In summary membrane hydration and dehydration changes the local membrane water
content resulting in a stress cycle in the polymer membrane A correlation between
hydration level and stress cycling is needed Additionally to predict life of the
membrane a correlation between membrane macroscopic mechanical properties stress-
cycling and membrane damage accrual needs to be developed The overall model that
predicts membrane lifetime as a function of membrane mechanical properties and fuel
cell operating conditions could guide the synthesis of new membranes with tuned
mechanical properties and enhanced life in a fuel cell Development of such a modeling
9
framework to predict the life of a membrane subjected to hydration cycles is the focus of
this work
The rest of the paper is organized as follows The extended Eyring model of polymer
viscoelastic deformation is presented in Section II This model is used as a basis of the
membrane stress and damage accrual models rather than as a standalone framework
component A model that predicts stress in the membrane during RH cycling in gas
channels for given membrane mechanical properties is proposed in Section III Next a
mathematical model identifying the functional form that relates the stress cycle to
irreversible damage of the polymer is discussed in Section IV The accrual of such
irreversible damage results in subsequent polymer failure determining the membrane life
subjected to hydration cycling Input parameters of the model are summarized in Section
V Modeling results for a GORE-SELECT membrane and discussion of the results are
presented in Section VI Conclusions are presented in Section VII
II Extended Eyring model for polymer deformation
The time dependent response of the stress to applied strain that takes into account
viscoelastic relaxation in the polymer material is needed for two components of the
degradation model The model of polymer viscoelastic deformation utilized this paper is
based on the assumption that polymer deformation occurs through the transport of
polymer chains through entanglements The early Eyring model [34] is based on a
similar concept The Eyring model calculates the non-linear dependence of polymer
deformation on applied constant stress and is relevant to creep experiments In a creep
experiment a sample is subjected to constant stress lower than the yield stress while the
10
elongation is monitored In this section we briefly describe a new extended Eyring
model that calculates stress relaxation in a stretched constrained polymer under arbitrary
time-dependent controlled deformation
The concept used in the current model is summarized below Following [37] we model a
polymer as a set of entangled chains One chain wraps around another chain and turns
around at the entanglement point In the current model stress is transmitted from one
chain to another through the entanglements which secure the mechanical integrity of the
polymer A Chain Segment (CS) is defined as a fraction of the chain confined between
two subsequent entanglements The macroscopic deformation of the polymer is
calculated from the microscopic elongation of CSs driven by the changing distance
between entanglements The macroscopic stress is calculated from the microscopic
tension acting along the CSs This concept to a large extent is similar to the concept of
interconnected elastic springs in elasticity theory The CS is an analog of the spring the
entanglement is an analog of the point where the springs are attached to each other The
elastic deformation in the current polymer model is achieved through the elastic
deformation of individual CSs which is an analog of the elastic deformation of the
springs in elasticity theory The fundamental difference comes from the fact that the
chains can slip through entanglements changing the equilibrium length of CSs We
assume that slippage of the chain through entanglements causes irreversible elongation of
the polymer
11
To calculate the slip rate as a function of tensile force we consider the dynamics of CS at
the entanglement as indicated in Fig 2a In the absence of the tensile force F the
monomer adjacent to the entanglement is located in the local energy minimum between
two symmetric energy barriers U0 (Fig 2b) The chain slips through the entanglement
when the monomer overcomes one of the energy barriers
In a stressed polymer a tensile force F is induced by stress and acts on the chain (Fig
2a) disturbing the symmetry of the monomerrsquos potential energy well the right barrier
becomes lower by Fa and the left barrier becomes higher byFa where a is the
monomer length This results in preferable displacement of the monomer to the right ie
along the force direction Here we assume that the monomer motion is thermally induced
and assisted by the force F 0UFa ltlt The rate +V at which the monomer jumps to the
right is
minusminus=+
kT
FaUaV 00 exp
2ω
(1)
The rate of monomer displacement to the left minusV is
+minus=minus
kT
FaUaV 00 exp
2ω
(2)
Therefore the average rate of polymer transport through the entanglement is
=kT
FaaV sinhω (3)
Here ω is the frequency of thermally activated jumps of a monomer in the local minimum
in the entangled state
12
minus=kT
U00 expωω (4)
Equation (3) indicates non-linear dependence of the chain slip rate through the
entanglement on the tensile force of the chain Equation (3) describes the conventional
linear dependence of velocity on the force when 1ltltkT
Fa
FkT
aV
ω2
= (5)
Here kT
a ω2
is a mobility of the chain in the entanglement In the opposite limit 1gtgtkT
Fa
equation (3) describes an exponential dependence of velocity on the force
=kT
FaaV exp
2ω
(6)
In a future publication the exponential increase of the chain slip rate through
entanglements with increasing tensile force will be related to the shape of σ-ε curves
observed for polymer materials We speculate that the yield stress is related to crossover
of the chain slip rate from equation (5) to equation (6)
Following the above concept of polymer plastic deformation we express macroscopic
stress σ through microscopic tension force F and the rate of macroscopic deformation
dt
dε through the microscopic chain velocity V predicted by equation (3) The detailed
derivation will be published in a forthcoming paper The final microscopic equation that
relates polymer deformation ε with external stress σ is presented below
minus=
T
T
dt
dE
dt
d
σσ
τσεσ
sinh (7)
13
Here τ is the polymer relaxation time and εσ
partpart=E is Youngrsquos modulus for the polymer
relT V
kT=σ where Vrel is a typical volume of polymer matrix around the entanglement
disturbed by one elementary act of monomer transfer through the entanglement The first
term in right hand part of equation (7) is the rate of the stress change induced by polymer
deformation The second term is rate the plastic relaxation of the stress This term
represents an extension of Maxwellrsquos relaxation rate στ In the case of low stress
Tσσ ltlt hyperbolic sine sinh in the right hand side of equation (7) is expanded to
reproduce the well-known Maxwell equation for polymer viscoelastic deformation
[ ]τσεσ minus=minus
partpart
Et
(8)
The fundamental difference between equation (7) and the Maxwell equation (8) is in the
relaxation terms in the right hand sides of equations (7) and (8) At large stress Tσσ gtgt
the hyperbolic sine asymptotically approaches the exponent leading to a sharp increase
in the stress relaxation rate as the applied stress is increased The detailed derivation of
equation (7) and validation of the model presented above will be published later in a
separate paper
III Membrane Stress Model
In this section we present the model that calculates the stress induced by
hydrationdehydration cycling In a fuel cell stack the membrane electrode assembly
(MEA) is constrained between two bipolar plates (Fig 3a) The membrane can
neitherbend nor change length Fuel is supplied to the MEA through fuel gas channels
14
and oxidant is supplied through oxidant (air) channels as indicated schematically in
Figure 3
To illustrate the mechanism of membrane failure due to RH cycling in the gas channels
we consider the following experiment Initially wet fuel is fed into the anode gas
channel (top channel shown in Figure 3a) and wet air is fed into the cathode gas channel
(bottom channel shown in Figure 3a) Both sides of the membrane are equilibrated with
wet gas until the equilibrium water content λ0 is reached and all mechanical stresses in
the membrane relax to zero The cathode side of the membrane dehydrates and attempts
to shrink when feed gas (air) is switched from wet to dry in the cathode gas channel
Mechanical constraints which prevent the membrane from shrinking cause in-plane
tensile stress σyy in the membrane Tensile stress results in a crack formation on the RH
cycled side of the membrane (Fig 3b) Further propagation of the crack in the through-
plane direction causes membrane mechanical failure
To calculate water distribution in the membrane cross-section at a fixed coordinate y
along the air channel we use RH(yt) the relative humidity distribution function predicted
by the fuel cell model Here we assume that the equilibration time of water in the
membrane is much smaller than RH cycling period in the gas channels Therefore the
water at the membrane interfaces is in thermodynamic equilibrium with vapor in the gas
channels
( ) ( )( )( ) ( )( )tyRHtyLx
tyRHtyx
Aeqm
Ceq
0
λλλλ==
== (9)
15
Here x is the through-membrane coordinate λeq(RH) is the equilibrium water content in
the membrane (an experimentally measured function of RH) RHC is the gas RH in the
cathode gas channel and RHA is the gas RH in the anode gas channel In the current
paper we utilize the following conventional diffusion equation with a water content
dependent diffusion coefficient to calculate water profile in the membrane
( ) 0=
partpart
partpartminus
partpart
xD
xt
λλλ (10)
Here D(λ) is the experimentally measured water diffusion coefficient in the membrane
(see Fig7 in Section VI) Initial conditions for equation (10) can be chosen arbitrarily
because after several cycles the membrane evolves to a new quasi-equilibrium state
governed by cyclic conditions and the initial state becomes irrelevant We chose the
initial conditions ( ) 00 λλ =x Solution of equation (10) with the boundary conditions (9)
gives the water distribution in the membrane λ(xyt) Below we calculate the membrane
stress at the membrane boundary adjacent to the air inlet (fixed coordinate y) where RH
cycling and stress amplitudes are maximal and limit membrane lifetime We start with a
calculation of the linear elastic response of the membrane to small changes in λ and
subsequently model the more general viscoelastic case
The macroscopic state of the membrane is determined by two parameters the membrane
length L0 and water content λ0 We assume that at equilibrium the stress in the
membrane is equal to zero The stress in the membrane can be generated by deviation of
the membrane length from equilibrium 0LLL minus=∆ at constant water content Also the
stress can be generated by deviation of water content from equilibrium
16
( ) ( ) 0 λλλ minus=∆ txtx in the geometrically constrained membrane (at constant length)
By analogy with linear elasticity theory with thermal expansion we calculate the linear
response of the membrane stress to small deviation from equilibrium as follows
( )( )txE yyyy λαεσ ∆minus= (11)
Here 0LLyy ∆=ε and E is the Young modulus of the membrane Swelling coefficient α
determines the length change ∆y of unconstrained (zero σ) membrane caused by the
change of the membrane water content ∆λ λα∆=∆ yy In 1D approximation the local
stress in the membrane depends on the change of the local membrane hydration (λ(xt)-
λ0)
In the membrane stress can be induced by changes in deformation water content and
simultaneous plastic relaxation The total rate of the stress change is the sum of the stress
change rate caused by membrane deformation and the stress change rate caused by the
change of membrane water content
λε
σσσttdt
d yyyyyy
partpart
+part
part= (12)
According to equation (11) the rate of the stress change induced by the change of the rate
of deviation of water content in constrained system with constant deformation and
without plastic relaxation is
dt
dE
tyy λα
σ
ε
∆=part
part (12a)
The second term in equation (12) is presented by equation (7)
17
minus=
partpart
T
Tyyyy
dt
dE
t σσ
τσεσ
λλ
sinh (12b)
Substituting equations (12a) and (12b) into the right hand side of equation (12) we obtain
the equation for the total rate of stress change in the membrane
( ) ( ) ( ) ( )
minus∆+
partpart
=T
yyTyyyy tx
dt
txdE
t
txE
dt
txd
σσ
τσλα
εσ
λ
sinh
(13)
The first term in the right hand side of equation (13) is equal to zero in a constrained
membrane Local water content λ(xt) is calculated by equation (10) with boundary
conditions (9) Equation (13) relates the stress in the membrane with water content in the
membrane for arbitrary RH cycling protocol
Equation (13) was solved numerically with parameters specified in the Table 1 The
calculated stress as a function of time is presented in Figure 7 The results indicate that
the membrane stress becomes a periodic function of time after several cycles if RH is a
periodic function of time To derive an analytical equation for the periodic stress we
utilize the separation of slow variable method The plastic (irreversible) deformation of
the membrane during one cycle is small because the cycling period is much smaller than
the membrane relaxation time Tcyc ltlt τ Therefore we can consider the membrane as an
elastic media during one cycle However the membrane slowly approaches a new
equilibrium state during each cycle After a long time t gtgt τ the membrane reaches the
new state with new equilibrium water content ( )xλ During the cycle λ oscillates below
and above ( )xλ At ( )xλλ = the membrane is not stressed The in-plane stress in the
18
periodical regime is driven by the deviation of λ from ( )xλ and is calculated by
following equation
( ) ( ) ( ) ( )( )xtxtxEtxyy λλασ minusminus= (14)
The stress averaged over time in the periodic regime is equal to zero for any x
Averaging (14) over time and taking advantage of the condition ( ) 0 =tyy txσ we
obtain the following expression for ( )xλ
( ) ( ) ( )( )
t
t
txE
txtxEx
λλ = (15)
Substituting (15) into (14) we obtain the final equation for the stress under periodic RH
cycling
( ) ( ) ( ) ( ) ( )( )
minusminus=
t
tyy txE
txtxEtxtxEtx
λλασ (16)
Substituting ( )txλ calculated from equation (10) with boundary conditions (9) into
equation (16) we calculate cyclic stress in the membrane
IV Damage accrual model
In this section we describe the model that calculates the membrane lifetime as a function
of applied cyclic stress Using the membrane stress model presented in Section III we
calculate the stress profile in the membrane ( )txyy σ for a given water content λ(xt)
We predict the membrane lifetime as a function of membrane stress using the damage
accrual model
19
The typical stress in the membrane under fuel cell operating conditions is much smaller
than the membrane tensile strength Many RH cycles are required to cause substantial
membrane damage However with each cycle the cyclic stress causes small irreversible
elongation ie plastic deformation of the membrane Accumulation of irreversible
elongation in the membrane causes membrane damage after a large number of cycles
Tang et al [7] experimentally studied Nafion111 membrane irreversible elongation under
cyclic stress They observed that irreversible elongation is accumulated over a large
number of cycles and causes damage of the membrane even at relatively small
amplitudes of cyclic stress They also demonstrated that at relatively small stress
σlt4MPa the membrane elongation rate is a linear function of applied stress magnitude
At larger stress amplitudes of about σ=65MPa the elongation rate rapidly increases We
speculate that such nonlinear dependence of elongation rate on stress amplitude is caused
by exponential dependence of the stress relaxation rate on the stress magnitude predicted
by extended Eyring model presented in Section III
The elongation of the membrane subjected to step-like cyclic stress is a function of the
stress amplitude σ and the cycle period Tcyc Applying equation (7) to the membrane
elongation during constant stress hold in one cycle we obtain
=
T
cycT
E
T
σσ
τσ
ε sinh1 (17)
Only a small fraction γ of this elongation is irreversible ie leads to membrane damage
In the current work we assume that γ depends only on cyclic period Tcyc and is
20
independent of σ Also we do not account for self-acceleration of membrane damage ie
we assume that irreversible elongation is proportional to the number of cycles N The
equation for irreversible elongation of the membrane per N cycles is
( )
=
T
NNσσεσε sinh 0 (18)
Here ε0 is
( )τγσ
εE
TT cyccycT=0 (19)
The elongation as a function of the stress and the number of cycles ε(σN) was measured
experimentally using Dynamic Mechanical Analysis (DMA) equipment for two specific
values of stress amplitude Because ε0 is proportional to an unknown parameter γ and
inversely proportional to another unknown parameter τ the lumped parameter ε0 was
used for fitting The model parameters ε0 and σT were fitted to DMA data The
membrane elongation for arbitrary stress amplitude σ was calculated from equation (18)
To validate equation (18) elongation per one stress cycle ε1(σ) was calculated from
Tangs experimental data [7] for Nafion111 membrane and plotted as a function of
applied stress σ see Fig 4 It follows from (18) that
( ) ( )
==
TdN
Nd
σσεσεσε sinh
01 (20)
The experimental data are in good agreement with the prediction of equation (20) with
σT=1 MPa and ε0=37sdot10-6 (Fig 4)
21
Membrane failure occurs after a critical irreversible elongation (damage) εcrit is
accumulated The number of cycles to failure Ncrit is calculated from the following
condition
( ) critcritN εσε =1 (21)
We assume that εcrit does not depend on stress amplitude and frequency and can be
measured once at a specific stress in a DMA test The number of cycles to failure NDMA
in out-off-cell tests is calculated by equation
( )Tcrit
NN
σσsinh0= (22)
( )cyccycT
critcrit
TT
EN
γστε
εε ==
00 (23)
We use N0 as a lumped fitting parameter obtained from a DMA test To obtain the values
of N0 and σT we performed stress cycling for two stress amplitudes σ and fitted the
experimental number of cycles to failure Ncrit by equation (22) Equation (22) predicts
membrane lifetime in a DMA test with arbitrary stress amplitude σ using the obtained
values of N0 and σT from experimental data Analytical dependence of these parameters
on temperature and RH will be published later
Fuel cell conditions under RH cycling differ from DMA test conditions because in DMA
testing the stress is uniformly distributed through the membrane cross-section while in
the cell the stress in the membrane changes substantially from the anode to the cathode
side We incorporated calibration parameter β into the current version of the model in
order to use equation (22) for in-cell membrane lifetime prediction This parameter is
used for renormalization of stress The membrane damage in DMA testing with stress
22
amplitude σ is equivalent to membrane damage in a fuel cell stack when the membrane is
subjected to RH cycling that cause a stress amplitude of βσ
To obtain the calibration parameter β we performed a single RH cycling experiment in a
fuel cell up to membrane failure for particular conditions and measured the experimental
membrane lifetime Ncell Using the membrane stress model we calculated the stress
amplitude σmax for these particular conditions Parameter β is calculated from the
following equation
( )Tcell
NN
σβσ max
0
sinh= (24)
Using the parameters N0 and σT obtained from fitting DMA data by equation (22) and
the parameter β obtained from the in-cell test we predict the in-cell membrane lifetime
under arbitrary RH cycling conditions
V Model parameters
In this section we present input model parameter values and experimental data for a
GORE-SELECTreg membrane in a PRIMEAreg MEA In RH cycling experiments
hydrogen with 100 RH was fed to the anode channel Air fed to the cathode channel
was cycled from RHmax to RHmin with equal time intervals Experimental conditions are
summarized in Table 1 Mechanical properties of GORE-SELECT membranes were
obtained from available literature and summarized in Table 1 DMA tests required for
model calibration were also performed
23
VI Model results
In this section we report the result of modeling of GORE-SELECT membrane damage
and lifetime under in-cell RH cycling conditions The model components ie fuel cell
model membrane stress model and stress accrual model were incorporated into the
MATLAB code The model parameters and test conditions are summarized in Section V
The relative humidity variation in the cathode gas channel during the cycle was
calculated from the fuel cell model and used as the input for the membrane stress model
The calculated relative humidity variation is shown in Fig6 The function with fast
exponential relaxation was used instead of step-wise function for better convergence of
the numerical solution The calculated dependence of λ on time at three points across
the membrane (at the cathode side at the middle of the membrane and at the anode side)
is also shown in Fig6 This dependence is calculated from water diffusion equation in
the membrane (10) with boundary conditions (9) and initial condition ( ) 110 =xλ
Figure 9 indicates that the membrane water content λ(t) follows the humidity cycle RH(t)
There is no time lag because water diffusion time in the membrane sD
htdif 20
2
asymp= is
much smaller than cycling period Tcyc=30s Here h=18 microm is membrane thickness and
D=0510-6 cm2s is the average water diffusion coefficient in the membrane
Water content in the membrane )( txλ is utilized in the membrane stress model to
predict the stress )( txσ distribution in the membrane The model prediction of the
stress in the membrane by equation (13) as a function of time is shown in Fig7 at the
24
cathode and anode sides of the membrane The membrane reaches quasi-steady state
regime after t gtgt τ and stress becomes a periodic function of time oscillating around the
equilibrium value The model prediction for the stress in the periodic regime as a
function of time calculated by equation (16) is shown in Fig8 Maximal stress is
imposed in the region with maximal humidity variation ie at the cathode side of the
membrane At the anode side of the membrane the stress is equal to zero because there is
no humidity cycling One can see that the stress calculated by equation (13) at large time
is in good agreement with the periodic stress shown in Fig8 calculated analytically from
equation (16)
Figures 7 and 8 indicate that after time t larger than relaxation time τ the stress at the
cathode sides oscillates around the equilibrium stress 0=eqσ The membrane at the
cathode side is subjected to tensile stress when ( ) ( )00 =lt xt λλ and to compressive
stress when ( ) ( )00 =gt xt λλ
The maximal value of the stress calculated by the membrane stress model is used in the
damage accrual model to predict membrane lifetime by equation (24) As discussed in
Section IV this equation contains three unknown parameters σT N0 and β Parameters
σT and N0 are calculated by fitting UTC POWER DMA data by equation (22)
Calibration parameter β is calculated from an in-cell lifetime experiment under specific
RH cycling conditions The in-cell membrane stress was calculated by the membrane
stress model
25
Using the model parameters calculated from DMA testing and in-cell RH cycling we
predicted GORE-SELECT membrane lifetime under arbitrary RH cycling conditions
Predicted membrane lifetime (number of cycles to failure) as a function of minimal RH in
the cathode gas channel RHmin is plotted in Fig 9 The anode gas humidity was
assumed to be 100 The maximal RH in the cathode gas channel RHmax of 100 was
also assumed At high RH cycling amplitude (low RHmin) the model predicts exponential
decrease of membrane lifetime with increase of RH cycling amplitude Stress amplitude
is approximately proportional to RH cycling amplitude and the number of cycles to
failure depends exponentially on the stress for large stress according to equation (22)
This results in exponential dependence of the membrane lifetime on RH cycling
amplitude for large values of amplitude (small value of RHmin)
VII Conclusions
A modeling framework was developed that predicts the lifetime of PEM fuel cell
membranes subjected to hydration cycling The developed model predicts membrane
lifetime as a function of RH cycling amplitude and membrane mechanical properties
Membrane failure in the fuel cell is caused by damage accumulation under cyclic stress in
the membrane subjected to cyclic hydrationdehydration A fuel cell membrane is
typically subjected to hydrationdehydration under fuel cell conditions One side of the
membrane dehydrates and attempts to shrink when the feed gas (air) is switched from wet
to dry in the cathode gas channel Mechanical constraints imposed by bipolar plates
prevent the membrane from shrinking This causes in-plane tensile stress in the
membrane Tensile stress causes a crack formation at RH cycled side of the membrane
26
(Fig 3) Further propagation of the crack in the through-plane direction causes
membrane mechanical failure
The modeling framework consists of three components a model of RH distribution in gas
channels a membrane stress model and a damage accrual model Several models of RH
distribution in gas channels are available in literature [8 9 10 11 and 12] and we do not
discuss this model component in the current paper In the current version of the model
we assume equilibrium of water in the membrane with the vapor at the membranegas
interface and use the conventional diffusion equation for calculation of water content in
the membrane bulk with the water diffusion coefficient dependent on water content D(λ)
The membrane stress model calculates the stress in the membrane caused by membrane
cyclic swellingshrinking under RH cycling conditions The local stress in the membrane
is caused by the change in the local hydration level The damage accrual model predicts
the number of cycles to failure for the membrane under applied cyclic stress The input
for the damage accrual model is a maximal stress in the membrane calculated by the
membrane stress model and experimental membrane lifetimes in DMA tests for two
cycling amplitudes The current version of the model also contains one calibration
parameter obtained from an in-cell RH cycling experiment with specific RH cycling
conditions
The model was utilized for in-cell lifetime predictions of GORE-SELECT membranes
The membrane mechanical properties and swelling coefficient were obtained from the
literature DMA testing and in-cell RH cycling were carried out at UTC Power After
27
calibration the model predicts membrane lifetime in fuel cells under arbitrary RH cycling
conditions The calculated membrane lifetime (number of cycles to failure) as a function
of minimal RH in cathode gas channel RHmin is plotted in Fig 9 At high RH cycling
amplitude (low RHmin) the model predicts exponential decrease of membrane lifetime
with increase of RH cycling amplitude Stress amplitude is approximately proportional
to RH cycling amplitude and the number of cycles to failure depends exponentially on
stress for large stress magnitude according to equation (22) This results in exponential
dependence of membrane lifetime on RH cycling amplitude for large values of amplitude
(small value of RHmin)
Acknowledgement
This work was supported by the US Department of Energy under the grant DE-PS36-
08GO98009
References
1 Ho Lee Taehee Kim Woojong Sim Saehoon Kim Byungki Ahn Taewon Lim
and Kwonpil Park Korean J Chem Eng 28(2) 487-491 (2011)
2 Xinyu Huang Roham Solasi Yue Zou Matthew Feshler Kenneth Reifsnider
David Condit Sergei Burlatsky Thomas Madden Journal of Polymer Science
Part B 44 (16) p 2346ndash2357 (2006)
3 Yaliang Tang Anette M Karlsson Michael H Santare Michael Gilbert Simon
Cleghorn William B Johnson Materials Science and Engineering A 425 (2006)
297ndash304
28
4 Yaliang Tang Ahmet Kusoglu Anette M Karlsson Michael H Santare Simon
Cleghorn William B Johnson Journal of Power Sources 175 (2008) 817ndash825
5 A Kusoglu A M Karlsson M H Santare S Cleghorn W B Johnson Journal
of Power Sources 161 987-996 (2006)
6 A Kusoglu A M Karlsson M H Santare Simon Cleghorn W B Johnson
Journal of Power Sources 170 345-358 (2007)
7 Haolin Tang Shen Peikang San Ping Jiang Fang Wang Mu Pan Journal of
Power Sources 170 (2007) 85ndash92
8 T F Fuller and J Newman J Electrochem Soc 140 (5) 1218-1225 (1993)
9 T V Nguyen and R E White J Electrochem Soc 140 (8) 2178-2186 (1993)
10 J S Yi and T V Nguyen J Electrochem Soc 145 (4) 1149-1159 (1998)
11 T E Springer T A Zawodzinski and S Gottesfeld J Electrochem Soc 138 (8)
2334-2342 (1991)
12 A Z Weber R M Darling and J Newman J Electrochem Soc 151 (10)
A1715-A1727 (2004)
13 L Boltzmann Pogg Ann u Chem 7 624 (1876)
14 S Turner Polymer Eng a Sci 6 306 (1966)
15 W N Findley and G Khosla J Appl Phys 26 821 (1955)
16 K van Holde J Polymer Sci 24 417 (1957)
17 T L Smith Trans Soc Rheol 6 61 (1962)
18 H Leaderman Trans Soc Rheol 6 361 (1962)
19 I M Ward and E T Onat J Mech Phys Solids 11 217 (1963)
29
20 Roham Solasi Yue Zou Xinyu Huang Kenneth Reifsnider Mech Time-Depend
Mater 12 15ndash30 (2008)
21 Paul W Majsztrik Andrew B Bocarsly and Jay B Benziger Macromolecules
41 9849-9862 (2008)
22 F Bauer S Denneler M Willert-Porada Journal of Polymer Science Part B
Polymer Physics Vol 43 786ndash795 (2005)
23 Kirt A Page Kevin M Cable and Robert B Moore Macromolecules 2005 38
6472-6484
24 Gierke T D Munn G E Wilson F C J Polym Sci Polym Phys Ed 1981 19
1687ndash1704
25 Hsu W Y Gierke T D J Membrane Sci 1983 13 307ndash326
26 Thomas A Zawodzinski Thomas E Spriner John Davey Roger Jestel Cruz
Lopez Judith Valerio and Shimshon Gottesfeld J Electrochem Soc 140 (7)
1981-1985 (1993)
27 Paul W Majsztrik M Barclay Satterfield Andrew B Bocarsly Jay B Benziger
J Membrane Sci 301 (2007) 93ndash106
28 T Takamatsu M Hashiyama A Eisenberg J Appl Polym Sci 24 (11) (1979)
2199ndash2220
29 DR Morris XD Sun J Appl Polym Sci 50 (8) (1993) 1445ndash1452
30 Shanhai Ge Xuguang Li Baolian Yi and I-Ming Hsing J Electrochem Soc
152 (6) A1149-A1157 (2005)
31 Adam Z Weber and John Newman J Electrochem Soc 151 (2) A311-A325
(2004)
30
32 Adam Z Weber and John Newman Chem Rev 2004 104 4679-4726
33 Timothy J Silverman Jeremy P Meyers and Joseph J Beaman J Electrochem
Soc 157 (10) B1376-B1381 (2010)
34 Halsey G White HJ Eyring H Text Res J 1945 v 15 p 295
35 M Gummalla VV Atrazhev AN Varyukhin and SF Burlatsky To be
published
36 P Choi and R Datta J Electrochem Soc 150 E601 (2003)
37 P de Gennes Scaling Concepts in Polymer Physics Cornell University Press
List of Tables
Table 1 Model parameters and experimental conditions
Parameter Description ValueSource
Operational conditions
Tcyc RH cycling time period 30 sec
RHmax Maximum relative humidity in cathode channel 100
RHmin Minimum relative humidity in cathode channel 10
T Cell temperature 78ordmC
Membrane properties
E(RHT) Youngrsquos modulus of the membrane [4]
)(aλ Membrane water content as a function of vapor
activity [mol H2Omol SO3] [36]
)(λD Diffusion coefficient of water in the membrane Fig5
31
α Dimension change coefficient 0004 (data from [4])
Tσ Fitting parameter (internal data fit to Eq 27) 17 MPa
0N Fitting parameter (internal data fit to Eq 27) 12middot106
β DMA to in-cell calibration parameter 23
Figure Captions
Figure 1 Schematic diagram showing the components of the model framework to predict
mechanical life of the membrane undergoing hydration cycles
Figure 2 (a) Polymer chain segment constrained by one entanglement and subjected to
the external force F (b) Potential energy of monomer in entanglement before applying
the force (in the left hand side of the Fig 2b) and after applying the force (in the right
hand side of the Fig 2b)
Figure 3 Schematic figure of membrane in fuel cell (counter-flow configuration)
constrained between two bi-polar plates (a) and crack formation (b) The wet fuel exits
from the anode gas channel (top channel) Initially wet air is fed into cathode gas
channel (bottom channel) When cathode side feed gas (air) is switched from wet to dry
cathode side of the membrane dehydrates and attempts to shrink The anode side of the
membrane remains wet and swollen
Figure 4 Fitting Tangs experimental data [7] (triangles) by equation (22) (solid line)
Fitting parameters values are σT=1 MPa and ε0=37sdot10-6
32
Figure 5 Dependence of diffusion coefficient in Nafion membrane on water content λ
(UTRC internal experimental data) There are not available data in range from 52=λ
to 15=λ so linear approximation is used in this region
Figure 6 Model prediction of dependence of RH on time and λ on time at the anode side
at the middle of the membrane and at the cathode side
Figure 7 Model prediction of stress as a function of time under RH cycling at the cathode
and at the anode sides of membrane
Figure 8 Model prediction of stress in quasi-steady-state regime at the cathode side at
the middle of the membrane and at the anode side
Figure 9 Calculated membrane lifetime (the number of cycles to failure) as a function of
minimal RH at the cathode side of membrane Anode side of membrane maintains 100
RH
33
Figures
Fuel cell RH distribution model
Operating conditionsinlet RH inlet Tcycling period
hydrationdehydration induced stress model
σ(t)Damage accrual model
Membrane Mechanical Degradation Model
Membrane propertiesE(RHT) ε∆λ DMA
ε(σNcycT) εcrit
Mechanical life-time
Fuel cell stack design
λ(t)
Figure 1
34
Figure 2
35
Figure 3
σ yy a)
b)
Crack formation
bi - polar plate
bi - polar plate
dry region
stress
y
x
σ yy a)
b)
Crack formation
bi - polar plate
bi - polar plate
dry air
wet fuel
σ yy a)
b)
Crack formation
bi - polar plate
bi - polar plate
dry region
stress
y
x
σ yy a)
b)
Crack formation
bi - polar plate
bi - polar plate
dry air
wet fuel
36
0
50
100
150
200
250
0 1 2 3 4 5 6 7
dud
N
Stress (MPa)
Figure 4
37
0
2
4
6
8
10
12
14
16
0 25 5 75 10 125 15
D1
0^-6
cm
^2s
λ
Figure 5
38
0
3
6
9
12
15
0 5 10 15 20 25 30 35 time s
000
2000
4000
6000
8000
10000
x=0 (Cathode side) x=h2 x=h (Anode side) RH
λ RH
Figure 6
39
-15
-1
-05
0
05
1
15
2
25
0 50 100 150 200 250 300
Time t
Str
ess
MP
a
x=0 (Cathode side)
x=h (Anode side)
Figure 7
40
-15
-1
-05
0
05
1
15
0 5 10 15 20 25 30 35
time s
Str
ess
MP
a
x=0 (Cathode side)x=h2x=h (Anode side)
a)
Figure 8
41
Life-time cycles
100E+05
100E+06
100E+07
100E+08
100E+09
0 02 04 06 08 1RH min
Figure 9

4
operating conditions were published and discussed in [8 9 10 11 12] Hence they are
not described further in this work and the focus is on other model components The main
features and limitations of the three novel modeling components are briefly discussed
below
Viscoelastic polymer deformation
A large number of models of polymer deformation are available in the literature The
linear theory of viscoelasticity was introduced by Boltzmann [13] many decades ago and
it provides the basis for all well-known constitutive models of linear viscoelasticity
(Maxwell model KelvinndashVoigt model Standard linear solid model and their
generalizations) These models utilize the analogy with mechanical systems consisting of
elastic springs and viscous dampers Models of linear viscoelasticity often fail when
either high deformation (gt10) or long-term behavior of polymers is studied Therefore
to predict membrane lifetime an approach is required which accounts for non-linear
effects of polymer viscoelasticity
There are several approaches for non-linear viscoelasticity modeling The empirical
approach uses correlations between time-dependent stress and strain [14 15 and 16] This
approach relies on numerous fitting parameters that are specific for a given polymer The
alternative approach is a semi-empirical [17 18] or purely mathematical [19]
generalization of Boltzmannrsquos linear theory The nonlinear time-dependent constitutive
model for prediction of the hygro-thermomechanical behavior of Nafion was proposed in
[20] and fitted to experimental data Neither approach accounts for the microscopic
physics of polymer deformation In contrast to the empirical and semi-empirical models
5
the molecular theory of non-linear viscoelasticity proposed by Eyring et al [34] is based
on a physical concept of polymer dynamics This model assumes that polymer
deformation occurs as a motion of polymer chain segments that overcome potential
barriers at the entanglement points This model predicts the (non-linear) dependence for
polymer elongation on applied constant stress In this paper the Eyring concept is
extended to predict stress relaxation in a constrained polymer
Hydrationdehydration stress model
The hydrationdehydration stress model calculates water distribution in the membrane as
a function of time and local stress in the membrane caused by changes in water content
The equilibrium water content of Nafion membranes as a function of gas RH was
experimentally studied in [26] The dynamics of water sorptiondesorption by Nafion
membranes and water transport through membranes were studied in [27 28 29] Nafion
demonstrates unusual water transport properties For example its water sorption time is
an order of magnitude larger than its water desorption time [27] Several mathematical
models of water transport in Nafion membranes are available in the literature [30 31 32
and 33] Currently models of ionomer water transport are based on the diffusion
equation and modeling efforts are focused on calculation of the water diffusion
coefficient as a function of membrane water content The ionomergas interfacial barrier
was hypothesized in [33] The model developed in [33] explains the peculiar kinetics of
water sorptiondesorption by the kinetics of water evaporationcondensation at the
ionomergas boundary In the current paper we assume thermodynamic equilibrium of
water in the membrane with vapor at the membrane interface taking advantage of the
low ratio of water sorptiondesorption time constant to the humidity cycling period
6
Water transport in the membrane bulk is treated as diffusion with the water diffusion
coefficient dependent on the membrane water content
The hydrationdehydration stress model assumes that the local stress in the membrane is
induced by competition between the membranersquos tendency to swell or shrink in response
to a change in hydration level and the geometrical constraints that prevent the membrane
from swelling or shrinking Unconstrained PFSA membranes are known to absorb water
and undergo dimensional changes [1] The dimensional changes can be controlled by the
choice of reinforcement [4] and the membrane processing methods Reinforced
membrane demonstrates approximately 4x lower dimensional change than that of non-
reinforced membrane under the same conditions Tang et al experimentally studied
mechanical properties and dimensional change of Nafion 111 membrane [1] and
reinforced Gore membrane [4] as a function of temperature and RH According to [1 4]
the membrane dimensional change is proportional to the change of RH in ambient air
Though the dependence of water content in the membrane on RH [36] is a nonlinear
function we linearized it in the water content interval from 3 to 12 to speed up the
calculations In the hydrationdehydration stress model we utilize a new non-linear
equation for polymer stresselongation that is predicted by the extended Eyring model
Taking advantage of this stresselongation equation along with the linear dependence of
the membrane swelling on water content we calculate the stress distribution induced by
cyclic hydrationdehydration The model parameters are obtained from experimental data
presented in [4 36]
7
Damage accrual model
The damage accrual model is based on experimental data for membrane failure under
cyclic stress and on our concept of polymer plastic deformation Tensile stress caused by
membrane dehydration in a constrained Nafion 111 membrane was studied
experimentally by Tang et al [7] Dependence of stress on dehydration level was
measured and the typical stress value was approximately 1MPa for a membrane that was
dehydrated from 100 RH to 60 RH Such stress is approximately an order of
magnitude lower than the tensile strength of a Nafion membrane Tang et al [7] have
experimentally shown that the amplitude of the cyclic stress that caused substantial
permanent elongation of Nafion 111 is 110 of the Nafion 111 tensile strength Nafion
membrane creep tests under constant load are reported in the work of Majsztrik et al [21]
In [21] the Nafion creep dynamics was experimentally studied as a function of the
temperature and the membrane hydration level The applied tensile stress was
approximately equal to 155 MPa That stress is also by approximately one order of
magnitude lower than the tensile strength of Nafion A strong dependence of Nafion
creep rate on the hydration level was observed in [21] At 8RH and gt60ordmC low water
contenthardens the Nafion membrane and decreases the rate of creep The creep rate of
dry Nafion dramatically increases at ~ 90ordmC which corresponds to the temperature of
Nafion α-relaxation detected in DMA tests in [22 23] At the same temperature the
creep rate of wet Nafion (RH gt 8) increases much more slowly than that of dry Nafion
Authors explain observed Nafion stiffening with RH increase by the increased
electrostatic interaction in ionic clusters composed of SO3H polar groups in the presence
of water molecules To develop the microscopic model that explains experimental data
8
on Nafion creep dynamics fundamental insights into the mechanism for polymer damage
accrual are needed
Kusoglu [5] showed through simulations that a hydro-thermal loading under fuel cell
operating conditions results in compressive stress in the polymer According to [5] the
stress level exceeds the yield strength causing permanent damage to the polymer
membrane The compressive stress causes extrusion of membrane materials from the
compressed areas such as the areas under the seals Apparently the membrane extrusion
does not cause the loss of membrane integrity We assume that the tensile stress in
membrane is much more damaging for membrane integrity because it causes formation
and propagation of cracks and crazes In the present work we focus on generation of
through-plane cracks in the membrane that result in gas crossover through the membrane
and dramatic performance loss
In summary membrane hydration and dehydration changes the local membrane water
content resulting in a stress cycle in the polymer membrane A correlation between
hydration level and stress cycling is needed Additionally to predict life of the
membrane a correlation between membrane macroscopic mechanical properties stress-
cycling and membrane damage accrual needs to be developed The overall model that
predicts membrane lifetime as a function of membrane mechanical properties and fuel
cell operating conditions could guide the synthesis of new membranes with tuned
mechanical properties and enhanced life in a fuel cell Development of such a modeling
9
framework to predict the life of a membrane subjected to hydration cycles is the focus of
this work
The rest of the paper is organized as follows The extended Eyring model of polymer
viscoelastic deformation is presented in Section II This model is used as a basis of the
membrane stress and damage accrual models rather than as a standalone framework
component A model that predicts stress in the membrane during RH cycling in gas
channels for given membrane mechanical properties is proposed in Section III Next a
mathematical model identifying the functional form that relates the stress cycle to
irreversible damage of the polymer is discussed in Section IV The accrual of such
irreversible damage results in subsequent polymer failure determining the membrane life
subjected to hydration cycling Input parameters of the model are summarized in Section
V Modeling results for a GORE-SELECT membrane and discussion of the results are
presented in Section VI Conclusions are presented in Section VII
II Extended Eyring model for polymer deformation
The time dependent response of the stress to applied strain that takes into account
viscoelastic relaxation in the polymer material is needed for two components of the
degradation model The model of polymer viscoelastic deformation utilized this paper is
based on the assumption that polymer deformation occurs through the transport of
polymer chains through entanglements The early Eyring model [34] is based on a
similar concept The Eyring model calculates the non-linear dependence of polymer
deformation on applied constant stress and is relevant to creep experiments In a creep
experiment a sample is subjected to constant stress lower than the yield stress while the
10
elongation is monitored In this section we briefly describe a new extended Eyring
model that calculates stress relaxation in a stretched constrained polymer under arbitrary
time-dependent controlled deformation
The concept used in the current model is summarized below Following [37] we model a
polymer as a set of entangled chains One chain wraps around another chain and turns
around at the entanglement point In the current model stress is transmitted from one
chain to another through the entanglements which secure the mechanical integrity of the
polymer A Chain Segment (CS) is defined as a fraction of the chain confined between
two subsequent entanglements The macroscopic deformation of the polymer is
calculated from the microscopic elongation of CSs driven by the changing distance
between entanglements The macroscopic stress is calculated from the microscopic
tension acting along the CSs This concept to a large extent is similar to the concept of
interconnected elastic springs in elasticity theory The CS is an analog of the spring the
entanglement is an analog of the point where the springs are attached to each other The
elastic deformation in the current polymer model is achieved through the elastic
deformation of individual CSs which is an analog of the elastic deformation of the
springs in elasticity theory The fundamental difference comes from the fact that the
chains can slip through entanglements changing the equilibrium length of CSs We
assume that slippage of the chain through entanglements causes irreversible elongation of
the polymer
11
To calculate the slip rate as a function of tensile force we consider the dynamics of CS at
the entanglement as indicated in Fig 2a In the absence of the tensile force F the
monomer adjacent to the entanglement is located in the local energy minimum between
two symmetric energy barriers U0 (Fig 2b) The chain slips through the entanglement
when the monomer overcomes one of the energy barriers
In a stressed polymer a tensile force F is induced by stress and acts on the chain (Fig
2a) disturbing the symmetry of the monomerrsquos potential energy well the right barrier
becomes lower by Fa and the left barrier becomes higher byFa where a is the
monomer length This results in preferable displacement of the monomer to the right ie
along the force direction Here we assume that the monomer motion is thermally induced
and assisted by the force F 0UFa ltlt The rate +V at which the monomer jumps to the
right is
minusminus=+
kT
FaUaV 00 exp
2ω
(1)
The rate of monomer displacement to the left minusV is
+minus=minus
kT
FaUaV 00 exp
2ω
(2)
Therefore the average rate of polymer transport through the entanglement is
=kT
FaaV sinhω (3)
Here ω is the frequency of thermally activated jumps of a monomer in the local minimum
in the entangled state
12
minus=kT
U00 expωω (4)
Equation (3) indicates non-linear dependence of the chain slip rate through the
entanglement on the tensile force of the chain Equation (3) describes the conventional
linear dependence of velocity on the force when 1ltltkT
Fa
FkT
aV
ω2
= (5)
Here kT
a ω2
is a mobility of the chain in the entanglement In the opposite limit 1gtgtkT
Fa
equation (3) describes an exponential dependence of velocity on the force
=kT
FaaV exp
2ω
(6)
In a future publication the exponential increase of the chain slip rate through
entanglements with increasing tensile force will be related to the shape of σ-ε curves
observed for polymer materials We speculate that the yield stress is related to crossover
of the chain slip rate from equation (5) to equation (6)
Following the above concept of polymer plastic deformation we express macroscopic
stress σ through microscopic tension force F and the rate of macroscopic deformation
dt
dε through the microscopic chain velocity V predicted by equation (3) The detailed
derivation will be published in a forthcoming paper The final microscopic equation that
relates polymer deformation ε with external stress σ is presented below
minus=
T
T
dt
dE
dt
d
σσ
τσεσ
sinh (7)
13
Here τ is the polymer relaxation time and εσ
partpart=E is Youngrsquos modulus for the polymer
relT V
kT=σ where Vrel is a typical volume of polymer matrix around the entanglement
disturbed by one elementary act of monomer transfer through the entanglement The first
term in right hand part of equation (7) is the rate of the stress change induced by polymer
deformation The second term is rate the plastic relaxation of the stress This term
represents an extension of Maxwellrsquos relaxation rate στ In the case of low stress
Tσσ ltlt hyperbolic sine sinh in the right hand side of equation (7) is expanded to
reproduce the well-known Maxwell equation for polymer viscoelastic deformation
[ ]τσεσ minus=minus
partpart
Et
(8)
The fundamental difference between equation (7) and the Maxwell equation (8) is in the
relaxation terms in the right hand sides of equations (7) and (8) At large stress Tσσ gtgt
the hyperbolic sine asymptotically approaches the exponent leading to a sharp increase
in the stress relaxation rate as the applied stress is increased The detailed derivation of
equation (7) and validation of the model presented above will be published later in a
separate paper
III Membrane Stress Model
In this section we present the model that calculates the stress induced by
hydrationdehydration cycling In a fuel cell stack the membrane electrode assembly
(MEA) is constrained between two bipolar plates (Fig 3a) The membrane can
neitherbend nor change length Fuel is supplied to the MEA through fuel gas channels
14
and oxidant is supplied through oxidant (air) channels as indicated schematically in
Figure 3
To illustrate the mechanism of membrane failure due to RH cycling in the gas channels
we consider the following experiment Initially wet fuel is fed into the anode gas
channel (top channel shown in Figure 3a) and wet air is fed into the cathode gas channel
(bottom channel shown in Figure 3a) Both sides of the membrane are equilibrated with
wet gas until the equilibrium water content λ0 is reached and all mechanical stresses in
the membrane relax to zero The cathode side of the membrane dehydrates and attempts
to shrink when feed gas (air) is switched from wet to dry in the cathode gas channel
Mechanical constraints which prevent the membrane from shrinking cause in-plane
tensile stress σyy in the membrane Tensile stress results in a crack formation on the RH
cycled side of the membrane (Fig 3b) Further propagation of the crack in the through-
plane direction causes membrane mechanical failure
To calculate water distribution in the membrane cross-section at a fixed coordinate y
along the air channel we use RH(yt) the relative humidity distribution function predicted
by the fuel cell model Here we assume that the equilibration time of water in the
membrane is much smaller than RH cycling period in the gas channels Therefore the
water at the membrane interfaces is in thermodynamic equilibrium with vapor in the gas
channels
( ) ( )( )( ) ( )( )tyRHtyLx
tyRHtyx
Aeqm
Ceq
0
λλλλ==
== (9)
15
Here x is the through-membrane coordinate λeq(RH) is the equilibrium water content in
the membrane (an experimentally measured function of RH) RHC is the gas RH in the
cathode gas channel and RHA is the gas RH in the anode gas channel In the current
paper we utilize the following conventional diffusion equation with a water content
dependent diffusion coefficient to calculate water profile in the membrane
( ) 0=
partpart
partpartminus
partpart
xD
xt
λλλ (10)
Here D(λ) is the experimentally measured water diffusion coefficient in the membrane
(see Fig7 in Section VI) Initial conditions for equation (10) can be chosen arbitrarily
because after several cycles the membrane evolves to a new quasi-equilibrium state
governed by cyclic conditions and the initial state becomes irrelevant We chose the
initial conditions ( ) 00 λλ =x Solution of equation (10) with the boundary conditions (9)
gives the water distribution in the membrane λ(xyt) Below we calculate the membrane
stress at the membrane boundary adjacent to the air inlet (fixed coordinate y) where RH
cycling and stress amplitudes are maximal and limit membrane lifetime We start with a
calculation of the linear elastic response of the membrane to small changes in λ and
subsequently model the more general viscoelastic case
The macroscopic state of the membrane is determined by two parameters the membrane
length L0 and water content λ0 We assume that at equilibrium the stress in the
membrane is equal to zero The stress in the membrane can be generated by deviation of
the membrane length from equilibrium 0LLL minus=∆ at constant water content Also the
stress can be generated by deviation of water content from equilibrium
16
( ) ( ) 0 λλλ minus=∆ txtx in the geometrically constrained membrane (at constant length)
By analogy with linear elasticity theory with thermal expansion we calculate the linear
response of the membrane stress to small deviation from equilibrium as follows
( )( )txE yyyy λαεσ ∆minus= (11)
Here 0LLyy ∆=ε and E is the Young modulus of the membrane Swelling coefficient α
determines the length change ∆y of unconstrained (zero σ) membrane caused by the
change of the membrane water content ∆λ λα∆=∆ yy In 1D approximation the local
stress in the membrane depends on the change of the local membrane hydration (λ(xt)-
λ0)
In the membrane stress can be induced by changes in deformation water content and
simultaneous plastic relaxation The total rate of the stress change is the sum of the stress
change rate caused by membrane deformation and the stress change rate caused by the
change of membrane water content
λε
σσσttdt
d yyyyyy
partpart
+part
part= (12)
According to equation (11) the rate of the stress change induced by the change of the rate
of deviation of water content in constrained system with constant deformation and
without plastic relaxation is
dt
dE
tyy λα
σ
ε
∆=part
part (12a)
The second term in equation (12) is presented by equation (7)
17
minus=
partpart
T
Tyyyy
dt
dE
t σσ
τσεσ
λλ
sinh (12b)
Substituting equations (12a) and (12b) into the right hand side of equation (12) we obtain
the equation for the total rate of stress change in the membrane
( ) ( ) ( ) ( )
minus∆+
partpart
=T
yyTyyyy tx
dt
txdE
t
txE
dt
txd
σσ
τσλα
εσ
λ
sinh
(13)
The first term in the right hand side of equation (13) is equal to zero in a constrained
membrane Local water content λ(xt) is calculated by equation (10) with boundary
conditions (9) Equation (13) relates the stress in the membrane with water content in the
membrane for arbitrary RH cycling protocol
Equation (13) was solved numerically with parameters specified in the Table 1 The
calculated stress as a function of time is presented in Figure 7 The results indicate that
the membrane stress becomes a periodic function of time after several cycles if RH is a
periodic function of time To derive an analytical equation for the periodic stress we
utilize the separation of slow variable method The plastic (irreversible) deformation of
the membrane during one cycle is small because the cycling period is much smaller than
the membrane relaxation time Tcyc ltlt τ Therefore we can consider the membrane as an
elastic media during one cycle However the membrane slowly approaches a new
equilibrium state during each cycle After a long time t gtgt τ the membrane reaches the
new state with new equilibrium water content ( )xλ During the cycle λ oscillates below
and above ( )xλ At ( )xλλ = the membrane is not stressed The in-plane stress in the
18
periodical regime is driven by the deviation of λ from ( )xλ and is calculated by
following equation
( ) ( ) ( ) ( )( )xtxtxEtxyy λλασ minusminus= (14)
The stress averaged over time in the periodic regime is equal to zero for any x
Averaging (14) over time and taking advantage of the condition ( ) 0 =tyy txσ we
obtain the following expression for ( )xλ
( ) ( ) ( )( )
t
t
txE
txtxEx
λλ = (15)
Substituting (15) into (14) we obtain the final equation for the stress under periodic RH
cycling
( ) ( ) ( ) ( ) ( )( )
minusminus=
t
tyy txE
txtxEtxtxEtx
λλασ (16)
Substituting ( )txλ calculated from equation (10) with boundary conditions (9) into
equation (16) we calculate cyclic stress in the membrane
IV Damage accrual model
In this section we describe the model that calculates the membrane lifetime as a function
of applied cyclic stress Using the membrane stress model presented in Section III we
calculate the stress profile in the membrane ( )txyy σ for a given water content λ(xt)
We predict the membrane lifetime as a function of membrane stress using the damage
accrual model
19
The typical stress in the membrane under fuel cell operating conditions is much smaller
than the membrane tensile strength Many RH cycles are required to cause substantial
membrane damage However with each cycle the cyclic stress causes small irreversible
elongation ie plastic deformation of the membrane Accumulation of irreversible
elongation in the membrane causes membrane damage after a large number of cycles
Tang et al [7] experimentally studied Nafion111 membrane irreversible elongation under
cyclic stress They observed that irreversible elongation is accumulated over a large
number of cycles and causes damage of the membrane even at relatively small
amplitudes of cyclic stress They also demonstrated that at relatively small stress
σlt4MPa the membrane elongation rate is a linear function of applied stress magnitude
At larger stress amplitudes of about σ=65MPa the elongation rate rapidly increases We
speculate that such nonlinear dependence of elongation rate on stress amplitude is caused
by exponential dependence of the stress relaxation rate on the stress magnitude predicted
by extended Eyring model presented in Section III
The elongation of the membrane subjected to step-like cyclic stress is a function of the
stress amplitude σ and the cycle period Tcyc Applying equation (7) to the membrane
elongation during constant stress hold in one cycle we obtain
=
T
cycT
E
T
σσ
τσ
ε sinh1 (17)
Only a small fraction γ of this elongation is irreversible ie leads to membrane damage
In the current work we assume that γ depends only on cyclic period Tcyc and is
20
independent of σ Also we do not account for self-acceleration of membrane damage ie
we assume that irreversible elongation is proportional to the number of cycles N The
equation for irreversible elongation of the membrane per N cycles is
( )
=
T
NNσσεσε sinh 0 (18)
Here ε0 is
( )τγσ
εE
TT cyccycT=0 (19)
The elongation as a function of the stress and the number of cycles ε(σN) was measured
experimentally using Dynamic Mechanical Analysis (DMA) equipment for two specific
values of stress amplitude Because ε0 is proportional to an unknown parameter γ and
inversely proportional to another unknown parameter τ the lumped parameter ε0 was
used for fitting The model parameters ε0 and σT were fitted to DMA data The
membrane elongation for arbitrary stress amplitude σ was calculated from equation (18)
To validate equation (18) elongation per one stress cycle ε1(σ) was calculated from
Tangs experimental data [7] for Nafion111 membrane and plotted as a function of
applied stress σ see Fig 4 It follows from (18) that
( ) ( )
==
TdN
Nd
σσεσεσε sinh
01 (20)
The experimental data are in good agreement with the prediction of equation (20) with
σT=1 MPa and ε0=37sdot10-6 (Fig 4)
21
Membrane failure occurs after a critical irreversible elongation (damage) εcrit is
accumulated The number of cycles to failure Ncrit is calculated from the following
condition
( ) critcritN εσε =1 (21)
We assume that εcrit does not depend on stress amplitude and frequency and can be
measured once at a specific stress in a DMA test The number of cycles to failure NDMA
in out-off-cell tests is calculated by equation
( )Tcrit
NN
σσsinh0= (22)
( )cyccycT
critcrit
TT
EN
γστε
εε ==
00 (23)
We use N0 as a lumped fitting parameter obtained from a DMA test To obtain the values
of N0 and σT we performed stress cycling for two stress amplitudes σ and fitted the
experimental number of cycles to failure Ncrit by equation (22) Equation (22) predicts
membrane lifetime in a DMA test with arbitrary stress amplitude σ using the obtained
values of N0 and σT from experimental data Analytical dependence of these parameters
on temperature and RH will be published later
Fuel cell conditions under RH cycling differ from DMA test conditions because in DMA
testing the stress is uniformly distributed through the membrane cross-section while in
the cell the stress in the membrane changes substantially from the anode to the cathode
side We incorporated calibration parameter β into the current version of the model in
order to use equation (22) for in-cell membrane lifetime prediction This parameter is
used for renormalization of stress The membrane damage in DMA testing with stress
22
amplitude σ is equivalent to membrane damage in a fuel cell stack when the membrane is
subjected to RH cycling that cause a stress amplitude of βσ
To obtain the calibration parameter β we performed a single RH cycling experiment in a
fuel cell up to membrane failure for particular conditions and measured the experimental
membrane lifetime Ncell Using the membrane stress model we calculated the stress
amplitude σmax for these particular conditions Parameter β is calculated from the
following equation
( )Tcell
NN
σβσ max
0
sinh= (24)
Using the parameters N0 and σT obtained from fitting DMA data by equation (22) and
the parameter β obtained from the in-cell test we predict the in-cell membrane lifetime
under arbitrary RH cycling conditions
V Model parameters
In this section we present input model parameter values and experimental data for a
GORE-SELECTreg membrane in a PRIMEAreg MEA In RH cycling experiments
hydrogen with 100 RH was fed to the anode channel Air fed to the cathode channel
was cycled from RHmax to RHmin with equal time intervals Experimental conditions are
summarized in Table 1 Mechanical properties of GORE-SELECT membranes were
obtained from available literature and summarized in Table 1 DMA tests required for
model calibration were also performed
23
VI Model results
In this section we report the result of modeling of GORE-SELECT membrane damage
and lifetime under in-cell RH cycling conditions The model components ie fuel cell
model membrane stress model and stress accrual model were incorporated into the
MATLAB code The model parameters and test conditions are summarized in Section V
The relative humidity variation in the cathode gas channel during the cycle was
calculated from the fuel cell model and used as the input for the membrane stress model
The calculated relative humidity variation is shown in Fig6 The function with fast
exponential relaxation was used instead of step-wise function for better convergence of
the numerical solution The calculated dependence of λ on time at three points across
the membrane (at the cathode side at the middle of the membrane and at the anode side)
is also shown in Fig6 This dependence is calculated from water diffusion equation in
the membrane (10) with boundary conditions (9) and initial condition ( ) 110 =xλ
Figure 9 indicates that the membrane water content λ(t) follows the humidity cycle RH(t)
There is no time lag because water diffusion time in the membrane sD
htdif 20
2
asymp= is
much smaller than cycling period Tcyc=30s Here h=18 microm is membrane thickness and
D=0510-6 cm2s is the average water diffusion coefficient in the membrane
Water content in the membrane )( txλ is utilized in the membrane stress model to
predict the stress )( txσ distribution in the membrane The model prediction of the
stress in the membrane by equation (13) as a function of time is shown in Fig7 at the
24
cathode and anode sides of the membrane The membrane reaches quasi-steady state
regime after t gtgt τ and stress becomes a periodic function of time oscillating around the
equilibrium value The model prediction for the stress in the periodic regime as a
function of time calculated by equation (16) is shown in Fig8 Maximal stress is
imposed in the region with maximal humidity variation ie at the cathode side of the
membrane At the anode side of the membrane the stress is equal to zero because there is
no humidity cycling One can see that the stress calculated by equation (13) at large time
is in good agreement with the periodic stress shown in Fig8 calculated analytically from
equation (16)
Figures 7 and 8 indicate that after time t larger than relaxation time τ the stress at the
cathode sides oscillates around the equilibrium stress 0=eqσ The membrane at the
cathode side is subjected to tensile stress when ( ) ( )00 =lt xt λλ and to compressive
stress when ( ) ( )00 =gt xt λλ
The maximal value of the stress calculated by the membrane stress model is used in the
damage accrual model to predict membrane lifetime by equation (24) As discussed in
Section IV this equation contains three unknown parameters σT N0 and β Parameters
σT and N0 are calculated by fitting UTC POWER DMA data by equation (22)
Calibration parameter β is calculated from an in-cell lifetime experiment under specific
RH cycling conditions The in-cell membrane stress was calculated by the membrane
stress model
25
Using the model parameters calculated from DMA testing and in-cell RH cycling we
predicted GORE-SELECT membrane lifetime under arbitrary RH cycling conditions
Predicted membrane lifetime (number of cycles to failure) as a function of minimal RH in
the cathode gas channel RHmin is plotted in Fig 9 The anode gas humidity was
assumed to be 100 The maximal RH in the cathode gas channel RHmax of 100 was
also assumed At high RH cycling amplitude (low RHmin) the model predicts exponential
decrease of membrane lifetime with increase of RH cycling amplitude Stress amplitude
is approximately proportional to RH cycling amplitude and the number of cycles to
failure depends exponentially on the stress for large stress according to equation (22)
This results in exponential dependence of the membrane lifetime on RH cycling
amplitude for large values of amplitude (small value of RHmin)
VII Conclusions
A modeling framework was developed that predicts the lifetime of PEM fuel cell
membranes subjected to hydration cycling The developed model predicts membrane
lifetime as a function of RH cycling amplitude and membrane mechanical properties
Membrane failure in the fuel cell is caused by damage accumulation under cyclic stress in
the membrane subjected to cyclic hydrationdehydration A fuel cell membrane is
typically subjected to hydrationdehydration under fuel cell conditions One side of the
membrane dehydrates and attempts to shrink when the feed gas (air) is switched from wet
to dry in the cathode gas channel Mechanical constraints imposed by bipolar plates
prevent the membrane from shrinking This causes in-plane tensile stress in the
membrane Tensile stress causes a crack formation at RH cycled side of the membrane
26
(Fig 3) Further propagation of the crack in the through-plane direction causes
membrane mechanical failure
The modeling framework consists of three components a model of RH distribution in gas
channels a membrane stress model and a damage accrual model Several models of RH
distribution in gas channels are available in literature [8 9 10 11 and 12] and we do not
discuss this model component in the current paper In the current version of the model
we assume equilibrium of water in the membrane with the vapor at the membranegas
interface and use the conventional diffusion equation for calculation of water content in
the membrane bulk with the water diffusion coefficient dependent on water content D(λ)
The membrane stress model calculates the stress in the membrane caused by membrane
cyclic swellingshrinking under RH cycling conditions The local stress in the membrane
is caused by the change in the local hydration level The damage accrual model predicts
the number of cycles to failure for the membrane under applied cyclic stress The input
for the damage accrual model is a maximal stress in the membrane calculated by the
membrane stress model and experimental membrane lifetimes in DMA tests for two
cycling amplitudes The current version of the model also contains one calibration
parameter obtained from an in-cell RH cycling experiment with specific RH cycling
conditions
The model was utilized for in-cell lifetime predictions of GORE-SELECT membranes
The membrane mechanical properties and swelling coefficient were obtained from the
literature DMA testing and in-cell RH cycling were carried out at UTC Power After
27
calibration the model predicts membrane lifetime in fuel cells under arbitrary RH cycling
conditions The calculated membrane lifetime (number of cycles to failure) as a function
of minimal RH in cathode gas channel RHmin is plotted in Fig 9 At high RH cycling
amplitude (low RHmin) the model predicts exponential decrease of membrane lifetime
with increase of RH cycling amplitude Stress amplitude is approximately proportional
to RH cycling amplitude and the number of cycles to failure depends exponentially on
stress for large stress magnitude according to equation (22) This results in exponential
dependence of membrane lifetime on RH cycling amplitude for large values of amplitude
(small value of RHmin)
Acknowledgement
This work was supported by the US Department of Energy under the grant DE-PS36-
08GO98009
References
1 Ho Lee Taehee Kim Woojong Sim Saehoon Kim Byungki Ahn Taewon Lim
and Kwonpil Park Korean J Chem Eng 28(2) 487-491 (2011)
2 Xinyu Huang Roham Solasi Yue Zou Matthew Feshler Kenneth Reifsnider
David Condit Sergei Burlatsky Thomas Madden Journal of Polymer Science
Part B 44 (16) p 2346ndash2357 (2006)
3 Yaliang Tang Anette M Karlsson Michael H Santare Michael Gilbert Simon
Cleghorn William B Johnson Materials Science and Engineering A 425 (2006)
297ndash304
28
4 Yaliang Tang Ahmet Kusoglu Anette M Karlsson Michael H Santare Simon
Cleghorn William B Johnson Journal of Power Sources 175 (2008) 817ndash825
5 A Kusoglu A M Karlsson M H Santare S Cleghorn W B Johnson Journal
of Power Sources 161 987-996 (2006)
6 A Kusoglu A M Karlsson M H Santare Simon Cleghorn W B Johnson
Journal of Power Sources 170 345-358 (2007)
7 Haolin Tang Shen Peikang San Ping Jiang Fang Wang Mu Pan Journal of
Power Sources 170 (2007) 85ndash92
8 T F Fuller and J Newman J Electrochem Soc 140 (5) 1218-1225 (1993)
9 T V Nguyen and R E White J Electrochem Soc 140 (8) 2178-2186 (1993)
10 J S Yi and T V Nguyen J Electrochem Soc 145 (4) 1149-1159 (1998)
11 T E Springer T A Zawodzinski and S Gottesfeld J Electrochem Soc 138 (8)
2334-2342 (1991)
12 A Z Weber R M Darling and J Newman J Electrochem Soc 151 (10)
A1715-A1727 (2004)
13 L Boltzmann Pogg Ann u Chem 7 624 (1876)
14 S Turner Polymer Eng a Sci 6 306 (1966)
15 W N Findley and G Khosla J Appl Phys 26 821 (1955)
16 K van Holde J Polymer Sci 24 417 (1957)
17 T L Smith Trans Soc Rheol 6 61 (1962)
18 H Leaderman Trans Soc Rheol 6 361 (1962)
19 I M Ward and E T Onat J Mech Phys Solids 11 217 (1963)
29
20 Roham Solasi Yue Zou Xinyu Huang Kenneth Reifsnider Mech Time-Depend
Mater 12 15ndash30 (2008)
21 Paul W Majsztrik Andrew B Bocarsly and Jay B Benziger Macromolecules
41 9849-9862 (2008)
22 F Bauer S Denneler M Willert-Porada Journal of Polymer Science Part B
Polymer Physics Vol 43 786ndash795 (2005)
23 Kirt A Page Kevin M Cable and Robert B Moore Macromolecules 2005 38
6472-6484
24 Gierke T D Munn G E Wilson F C J Polym Sci Polym Phys Ed 1981 19
1687ndash1704
25 Hsu W Y Gierke T D J Membrane Sci 1983 13 307ndash326
26 Thomas A Zawodzinski Thomas E Spriner John Davey Roger Jestel Cruz
Lopez Judith Valerio and Shimshon Gottesfeld J Electrochem Soc 140 (7)
1981-1985 (1993)
27 Paul W Majsztrik M Barclay Satterfield Andrew B Bocarsly Jay B Benziger
J Membrane Sci 301 (2007) 93ndash106
28 T Takamatsu M Hashiyama A Eisenberg J Appl Polym Sci 24 (11) (1979)
2199ndash2220
29 DR Morris XD Sun J Appl Polym Sci 50 (8) (1993) 1445ndash1452
30 Shanhai Ge Xuguang Li Baolian Yi and I-Ming Hsing J Electrochem Soc
152 (6) A1149-A1157 (2005)
31 Adam Z Weber and John Newman J Electrochem Soc 151 (2) A311-A325
(2004)
30
32 Adam Z Weber and John Newman Chem Rev 2004 104 4679-4726
33 Timothy J Silverman Jeremy P Meyers and Joseph J Beaman J Electrochem
Soc 157 (10) B1376-B1381 (2010)
34 Halsey G White HJ Eyring H Text Res J 1945 v 15 p 295
35 M Gummalla VV Atrazhev AN Varyukhin and SF Burlatsky To be
published
36 P Choi and R Datta J Electrochem Soc 150 E601 (2003)
37 P de Gennes Scaling Concepts in Polymer Physics Cornell University Press
List of Tables
Table 1 Model parameters and experimental conditions
Parameter Description ValueSource
Operational conditions
Tcyc RH cycling time period 30 sec
RHmax Maximum relative humidity in cathode channel 100
RHmin Minimum relative humidity in cathode channel 10
T Cell temperature 78ordmC
Membrane properties
E(RHT) Youngrsquos modulus of the membrane [4]
)(aλ Membrane water content as a function of vapor
activity [mol H2Omol SO3] [36]
)(λD Diffusion coefficient of water in the membrane Fig5
31
α Dimension change coefficient 0004 (data from [4])
Tσ Fitting parameter (internal data fit to Eq 27) 17 MPa
0N Fitting parameter (internal data fit to Eq 27) 12middot106
β DMA to in-cell calibration parameter 23
Figure Captions
Figure 1 Schematic diagram showing the components of the model framework to predict
mechanical life of the membrane undergoing hydration cycles
Figure 2 (a) Polymer chain segment constrained by one entanglement and subjected to
the external force F (b) Potential energy of monomer in entanglement before applying
the force (in the left hand side of the Fig 2b) and after applying the force (in the right
hand side of the Fig 2b)
Figure 3 Schematic figure of membrane in fuel cell (counter-flow configuration)
constrained between two bi-polar plates (a) and crack formation (b) The wet fuel exits
from the anode gas channel (top channel) Initially wet air is fed into cathode gas
channel (bottom channel) When cathode side feed gas (air) is switched from wet to dry
cathode side of the membrane dehydrates and attempts to shrink The anode side of the
membrane remains wet and swollen
Figure 4 Fitting Tangs experimental data [7] (triangles) by equation (22) (solid line)
Fitting parameters values are σT=1 MPa and ε0=37sdot10-6
32
Figure 5 Dependence of diffusion coefficient in Nafion membrane on water content λ
(UTRC internal experimental data) There are not available data in range from 52=λ
to 15=λ so linear approximation is used in this region
Figure 6 Model prediction of dependence of RH on time and λ on time at the anode side
at the middle of the membrane and at the cathode side
Figure 7 Model prediction of stress as a function of time under RH cycling at the cathode
and at the anode sides of membrane
Figure 8 Model prediction of stress in quasi-steady-state regime at the cathode side at
the middle of the membrane and at the anode side
Figure 9 Calculated membrane lifetime (the number of cycles to failure) as a function of
minimal RH at the cathode side of membrane Anode side of membrane maintains 100
RH
33
Figures
Fuel cell RH distribution model
Operating conditionsinlet RH inlet Tcycling period
hydrationdehydration induced stress model
σ(t)Damage accrual model
Membrane Mechanical Degradation Model
Membrane propertiesE(RHT) ε∆λ DMA
ε(σNcycT) εcrit
Mechanical life-time
Fuel cell stack design
λ(t)
Figure 1
34
Figure 2
35
Figure 3
σ yy a)
b)
Crack formation
bi - polar plate
bi - polar plate
dry region
stress
y
x
σ yy a)
b)
Crack formation
bi - polar plate
bi - polar plate
dry air
wet fuel
σ yy a)
b)
Crack formation
bi - polar plate
bi - polar plate
dry region
stress
y
x
σ yy a)
b)
Crack formation
bi - polar plate
bi - polar plate
dry air
wet fuel
36
0
50
100
150
200
250
0 1 2 3 4 5 6 7
dud
N
Stress (MPa)
Figure 4
37
0
2
4
6
8
10
12
14
16
0 25 5 75 10 125 15
D1
0^-6
cm
^2s
λ
Figure 5
38
0
3
6
9
12
15
0 5 10 15 20 25 30 35 time s
000
2000
4000
6000
8000
10000
x=0 (Cathode side) x=h2 x=h (Anode side) RH
λ RH
Figure 6
39
-15
-1
-05
0
05
1
15
2
25
0 50 100 150 200 250 300
Time t
Str
ess
MP
a
x=0 (Cathode side)
x=h (Anode side)
Figure 7
40
-15
-1
-05
0
05
1
15
0 5 10 15 20 25 30 35
time s
Str
ess
MP
a
x=0 (Cathode side)x=h2x=h (Anode side)
a)
Figure 8
41
Life-time cycles
100E+05
100E+06
100E+07
100E+08
100E+09
0 02 04 06 08 1RH min
Figure 9
6
Water transport in the membrane bulk is treated as diffusion with the water diffusion
coefficient dependent on the membrane water content
The hydrationdehydration stress model assumes that the local stress in the membrane is
induced by competition between the membranersquos tendency to swell or shrink in response
to a change in hydration level and the geometrical constraints that prevent the membrane
from swelling or shrinking Unconstrained PFSA membranes are known to absorb water
and undergo dimensional changes [1] The dimensional changes can be controlled by the
choice of reinforcement [4] and the membrane processing methods Reinforced
membrane demonstrates approximately 4x lower dimensional change than that of non-
reinforced membrane under the same conditions Tang et al experimentally studied
mechanical properties and dimensional change of Nafion 111 membrane [1] and
reinforced Gore membrane [4] as a function of temperature and RH According to [1 4]
the membrane dimensional change is proportional to the change of RH in ambient air
Though the dependence of water content in the membrane on RH [36] is a nonlinear
function we linearized it in the water content interval from 3 to 12 to speed up the
calculations In the hydrationdehydration stress model we utilize a new non-linear
equation for polymer stresselongation that is predicted by the extended Eyring model
Taking advantage of this stresselongation equation along with the linear dependence of
the membrane swelling on water content we calculate the stress distribution induced by
cyclic hydrationdehydration The model parameters are obtained from experimental data
presented in [4 36]
7
Damage accrual model
The damage accrual model is based on experimental data for membrane failure under
cyclic stress and on our concept of polymer plastic deformation Tensile stress caused by
membrane dehydration in a constrained Nafion 111 membrane was studied
experimentally by Tang et al [7] Dependence of stress on dehydration level was
measured and the typical stress value was approximately 1MPa for a membrane that was
dehydrated from 100 RH to 60 RH Such stress is approximately an order of
magnitude lower than the tensile strength of a Nafion membrane Tang et al [7] have
experimentally shown that the amplitude of the cyclic stress that caused substantial
permanent elongation of Nafion 111 is 110 of the Nafion 111 tensile strength Nafion
membrane creep tests under constant load are reported in the work of Majsztrik et al [21]
In [21] the Nafion creep dynamics was experimentally studied as a function of the
temperature and the membrane hydration level The applied tensile stress was
approximately equal to 155 MPa That stress is also by approximately one order of
magnitude lower than the tensile strength of Nafion A strong dependence of Nafion
creep rate on the hydration level was observed in [21] At 8RH and gt60ordmC low water
contenthardens the Nafion membrane and decreases the rate of creep The creep rate of
dry Nafion dramatically increases at ~ 90ordmC which corresponds to the temperature of
Nafion α-relaxation detected in DMA tests in [22 23] At the same temperature the
creep rate of wet Nafion (RH gt 8) increases much more slowly than that of dry Nafion
Authors explain observed Nafion stiffening with RH increase by the increased
electrostatic interaction in ionic clusters composed of SO3H polar groups in the presence
of water molecules To develop the microscopic model that explains experimental data
8
on Nafion creep dynamics fundamental insights into the mechanism for polymer damage
accrual are needed
Kusoglu [5] showed through simulations that a hydro-thermal loading under fuel cell
operating conditions results in compressive stress in the polymer According to [5] the
stress level exceeds the yield strength causing permanent damage to the polymer
membrane The compressive stress causes extrusion of membrane materials from the
compressed areas such as the areas under the seals Apparently the membrane extrusion
does not cause the loss of membrane integrity We assume that the tensile stress in
membrane is much more damaging for membrane integrity because it causes formation
and propagation of cracks and crazes In the present work we focus on generation of
through-plane cracks in the membrane that result in gas crossover through the membrane
and dramatic performance loss
In summary membrane hydration and dehydration changes the local membrane water
content resulting in a stress cycle in the polymer membrane A correlation between
hydration level and stress cycling is needed Additionally to predict life of the
membrane a correlation between membrane macroscopic mechanical properties stress-
cycling and membrane damage accrual needs to be developed The overall model that
predicts membrane lifetime as a function of membrane mechanical properties and fuel
cell operating conditions could guide the synthesis of new membranes with tuned
mechanical properties and enhanced life in a fuel cell Development of such a modeling
9
framework to predict the life of a membrane subjected to hydration cycles is the focus of
this work
The rest of the paper is organized as follows The extended Eyring model of polymer
viscoelastic deformation is presented in Section II This model is used as a basis of the
membrane stress and damage accrual models rather than as a standalone framework
component A model that predicts stress in the membrane during RH cycling in gas
channels for given membrane mechanical properties is proposed in Section III Next a
mathematical model identifying the functional form that relates the stress cycle to
irreversible damage of the polymer is discussed in Section IV The accrual of such
irreversible damage results in subsequent polymer failure determining the membrane life
subjected to hydration cycling Input parameters of the model are summarized in Section
V Modeling results for a GORE-SELECT membrane and discussion of the results are
presented in Section VI Conclusions are presented in Section VII
II Extended Eyring model for polymer deformation
The time dependent response of the stress to applied strain that takes into account
viscoelastic relaxation in the polymer material is needed for two components of the
degradation model The model of polymer viscoelastic deformation utilized this paper is
based on the assumption that polymer deformation occurs through the transport of
polymer chains through entanglements The early Eyring model [34] is based on a
similar concept The Eyring model calculates the non-linear dependence of polymer
deformation on applied constant stress and is relevant to creep experiments In a creep
experiment a sample is subjected to constant stress lower than the yield stress while the
10
elongation is monitored In this section we briefly describe a new extended Eyring
model that calculates stress relaxation in a stretched constrained polymer under arbitrary
time-dependent controlled deformation
The concept used in the current model is summarized below Following [37] we model a
polymer as a set of entangled chains One chain wraps around another chain and turns
around at the entanglement point In the current model stress is transmitted from one
chain to another through the entanglements which secure the mechanical integrity of the
polymer A Chain Segment (CS) is defined as a fraction of the chain confined between
two subsequent entanglements The macroscopic deformation of the polymer is
calculated from the microscopic elongation of CSs driven by the changing distance
between entanglements The macroscopic stress is calculated from the microscopic
tension acting along the CSs This concept to a large extent is similar to the concept of
interconnected elastic springs in elasticity theory The CS is an analog of the spring the
entanglement is an analog of the point where the springs are attached to each other The
elastic deformation in the current polymer model is achieved through the elastic
deformation of individual CSs which is an analog of the elastic deformation of the
springs in elasticity theory The fundamental difference comes from the fact that the
chains can slip through entanglements changing the equilibrium length of CSs We
assume that slippage of the chain through entanglements causes irreversible elongation of
the polymer
11
To calculate the slip rate as a function of tensile force we consider the dynamics of CS at
the entanglement as indicated in Fig 2a In the absence of the tensile force F the
monomer adjacent to the entanglement is located in the local energy minimum between
two symmetric energy barriers U0 (Fig 2b) The chain slips through the entanglement
when the monomer overcomes one of the energy barriers
In a stressed polymer a tensile force F is induced by stress and acts on the chain (Fig
2a) disturbing the symmetry of the monomerrsquos potential energy well the right barrier
becomes lower by Fa and the left barrier becomes higher byFa where a is the
monomer length This results in preferable displacement of the monomer to the right ie
along the force direction Here we assume that the monomer motion is thermally induced
and assisted by the force F 0UFa ltlt The rate +V at which the monomer jumps to the
right is
minusminus=+
kT
FaUaV 00 exp
2ω
(1)
The rate of monomer displacement to the left minusV is
+minus=minus
kT
FaUaV 00 exp
2ω
(2)
Therefore the average rate of polymer transport through the entanglement is
=kT
FaaV sinhω (3)
Here ω is the frequency of thermally activated jumps of a monomer in the local minimum
in the entangled state
12
minus=kT
U00 expωω (4)
Equation (3) indicates non-linear dependence of the chain slip rate through the
entanglement on the tensile force of the chain Equation (3) describes the conventional
linear dependence of velocity on the force when 1ltltkT
Fa
FkT
aV
ω2
= (5)
Here kT
a ω2
is a mobility of the chain in the entanglement In the opposite limit 1gtgtkT
Fa
equation (3) describes an exponential dependence of velocity on the force
=kT
FaaV exp
2ω
(6)
In a future publication the exponential increase of the chain slip rate through
entanglements with increasing tensile force will be related to the shape of σ-ε curves
observed for polymer materials We speculate that the yield stress is related to crossover
of the chain slip rate from equation (5) to equation (6)
Following the above concept of polymer plastic deformation we express macroscopic
stress σ through microscopic tension force F and the rate of macroscopic deformation
dt
dε through the microscopic chain velocity V predicted by equation (3) The detailed
derivation will be published in a forthcoming paper The final microscopic equation that
relates polymer deformation ε with external stress σ is presented below
minus=
T
T
dt
dE
dt
d
σσ
τσεσ
sinh (7)
13
Here τ is the polymer relaxation time and εσ
partpart=E is Youngrsquos modulus for the polymer
relT V
kT=σ where Vrel is a typical volume of polymer matrix around the entanglement
disturbed by one elementary act of monomer transfer through the entanglement The first
term in right hand part of equation (7) is the rate of the stress change induced by polymer
deformation The second term is rate the plastic relaxation of the stress This term
represents an extension of Maxwellrsquos relaxation rate στ In the case of low stress
Tσσ ltlt hyperbolic sine sinh in the right hand side of equation (7) is expanded to
reproduce the well-known Maxwell equation for polymer viscoelastic deformation
[ ]τσεσ minus=minus
partpart
Et
(8)
The fundamental difference between equation (7) and the Maxwell equation (8) is in the
relaxation terms in the right hand sides of equations (7) and (8) At large stress Tσσ gtgt
the hyperbolic sine asymptotically approaches the exponent leading to a sharp increase
in the stress relaxation rate as the applied stress is increased The detailed derivation of
equation (7) and validation of the model presented above will be published later in a
separate paper
III Membrane Stress Model
In this section we present the model that calculates the stress induced by
hydrationdehydration cycling In a fuel cell stack the membrane electrode assembly
(MEA) is constrained between two bipolar plates (Fig 3a) The membrane can
neitherbend nor change length Fuel is supplied to the MEA through fuel gas channels
14
and oxidant is supplied through oxidant (air) channels as indicated schematically in
Figure 3
To illustrate the mechanism of membrane failure due to RH cycling in the gas channels
we consider the following experiment Initially wet fuel is fed into the anode gas
channel (top channel shown in Figure 3a) and wet air is fed into the cathode gas channel
(bottom channel shown in Figure 3a) Both sides of the membrane are equilibrated with
wet gas until the equilibrium water content λ0 is reached and all mechanical stresses in
the membrane relax to zero The cathode side of the membrane dehydrates and attempts
to shrink when feed gas (air) is switched from wet to dry in the cathode gas channel
Mechanical constraints which prevent the membrane from shrinking cause in-plane
tensile stress σyy in the membrane Tensile stress results in a crack formation on the RH
cycled side of the membrane (Fig 3b) Further propagation of the crack in the through-
plane direction causes membrane mechanical failure
To calculate water distribution in the membrane cross-section at a fixed coordinate y
along the air channel we use RH(yt) the relative humidity distribution function predicted
by the fuel cell model Here we assume that the equilibration time of water in the
membrane is much smaller than RH cycling period in the gas channels Therefore the
water at the membrane interfaces is in thermodynamic equilibrium with vapor in the gas
channels
( ) ( )( )( ) ( )( )tyRHtyLx
tyRHtyx
Aeqm
Ceq
0
λλλλ==
== (9)
15
Here x is the through-membrane coordinate λeq(RH) is the equilibrium water content in
the membrane (an experimentally measured function of RH) RHC is the gas RH in the
cathode gas channel and RHA is the gas RH in the anode gas channel In the current
paper we utilize the following conventional diffusion equation with a water content
dependent diffusion coefficient to calculate water profile in the membrane
( ) 0=
partpart
partpartminus
partpart
xD
xt
λλλ (10)
Here D(λ) is the experimentally measured water diffusion coefficient in the membrane
(see Fig7 in Section VI) Initial conditions for equation (10) can be chosen arbitrarily
because after several cycles the membrane evolves to a new quasi-equilibrium state
governed by cyclic conditions and the initial state becomes irrelevant We chose the
initial conditions ( ) 00 λλ =x Solution of equation (10) with the boundary conditions (9)
gives the water distribution in the membrane λ(xyt) Below we calculate the membrane
stress at the membrane boundary adjacent to the air inlet (fixed coordinate y) where RH
cycling and stress amplitudes are maximal and limit membrane lifetime We start with a
calculation of the linear elastic response of the membrane to small changes in λ and
subsequently model the more general viscoelastic case
The macroscopic state of the membrane is determined by two parameters the membrane
length L0 and water content λ0 We assume that at equilibrium the stress in the
membrane is equal to zero The stress in the membrane can be generated by deviation of
the membrane length from equilibrium 0LLL minus=∆ at constant water content Also the
stress can be generated by deviation of water content from equilibrium
16
( ) ( ) 0 λλλ minus=∆ txtx in the geometrically constrained membrane (at constant length)
By analogy with linear elasticity theory with thermal expansion we calculate the linear
response of the membrane stress to small deviation from equilibrium as follows
( )( )txE yyyy λαεσ ∆minus= (11)
Here 0LLyy ∆=ε and E is the Young modulus of the membrane Swelling coefficient α
determines the length change ∆y of unconstrained (zero σ) membrane caused by the
change of the membrane water content ∆λ λα∆=∆ yy In 1D approximation the local
stress in the membrane depends on the change of the local membrane hydration (λ(xt)-
λ0)
In the membrane stress can be induced by changes in deformation water content and
simultaneous plastic relaxation The total rate of the stress change is the sum of the stress
change rate caused by membrane deformation and the stress change rate caused by the
change of membrane water content
λε
σσσttdt
d yyyyyy
partpart
+part
part= (12)
According to equation (11) the rate of the stress change induced by the change of the rate
of deviation of water content in constrained system with constant deformation and
without plastic relaxation is
dt
dE
tyy λα
σ
ε
∆=part
part (12a)
The second term in equation (12) is presented by equation (7)
17
minus=
partpart
T
Tyyyy
dt
dE
t σσ
τσεσ
λλ
sinh (12b)
Substituting equations (12a) and (12b) into the right hand side of equation (12) we obtain
the equation for the total rate of stress change in the membrane
( ) ( ) ( ) ( )
minus∆+
partpart
=T
yyTyyyy tx
dt
txdE
t
txE
dt
txd
σσ
τσλα
εσ
λ
sinh
(13)
The first term in the right hand side of equation (13) is equal to zero in a constrained
membrane Local water content λ(xt) is calculated by equation (10) with boundary
conditions (9) Equation (13) relates the stress in the membrane with water content in the
membrane for arbitrary RH cycling protocol
Equation (13) was solved numerically with parameters specified in the Table 1 The
calculated stress as a function of time is presented in Figure 7 The results indicate that
the membrane stress becomes a periodic function of time after several cycles if RH is a
periodic function of time To derive an analytical equation for the periodic stress we
utilize the separation of slow variable method The plastic (irreversible) deformation of
the membrane during one cycle is small because the cycling period is much smaller than
the membrane relaxation time Tcyc ltlt τ Therefore we can consider the membrane as an
elastic media during one cycle However the membrane slowly approaches a new
equilibrium state during each cycle After a long time t gtgt τ the membrane reaches the
new state with new equilibrium water content ( )xλ During the cycle λ oscillates below
and above ( )xλ At ( )xλλ = the membrane is not stressed The in-plane stress in the
18
periodical regime is driven by the deviation of λ from ( )xλ and is calculated by
following equation
( ) ( ) ( ) ( )( )xtxtxEtxyy λλασ minusminus= (14)
The stress averaged over time in the periodic regime is equal to zero for any x
Averaging (14) over time and taking advantage of the condition ( ) 0 =tyy txσ we
obtain the following expression for ( )xλ
( ) ( ) ( )( )
t
t
txE
txtxEx
λλ = (15)
Substituting (15) into (14) we obtain the final equation for the stress under periodic RH
cycling
( ) ( ) ( ) ( ) ( )( )
minusminus=
t
tyy txE
txtxEtxtxEtx
λλασ (16)
Substituting ( )txλ calculated from equation (10) with boundary conditions (9) into
equation (16) we calculate cyclic stress in the membrane
IV Damage accrual model
In this section we describe the model that calculates the membrane lifetime as a function
of applied cyclic stress Using the membrane stress model presented in Section III we
calculate the stress profile in the membrane ( )txyy σ for a given water content λ(xt)
We predict the membrane lifetime as a function of membrane stress using the damage
accrual model
19
The typical stress in the membrane under fuel cell operating conditions is much smaller
than the membrane tensile strength Many RH cycles are required to cause substantial
membrane damage However with each cycle the cyclic stress causes small irreversible
elongation ie plastic deformation of the membrane Accumulation of irreversible
elongation in the membrane causes membrane damage after a large number of cycles
Tang et al [7] experimentally studied Nafion111 membrane irreversible elongation under
cyclic stress They observed that irreversible elongation is accumulated over a large
number of cycles and causes damage of the membrane even at relatively small
amplitudes of cyclic stress They also demonstrated that at relatively small stress
σlt4MPa the membrane elongation rate is a linear function of applied stress magnitude
At larger stress amplitudes of about σ=65MPa the elongation rate rapidly increases We
speculate that such nonlinear dependence of elongation rate on stress amplitude is caused
by exponential dependence of the stress relaxation rate on the stress magnitude predicted
by extended Eyring model presented in Section III
The elongation of the membrane subjected to step-like cyclic stress is a function of the
stress amplitude σ and the cycle period Tcyc Applying equation (7) to the membrane
elongation during constant stress hold in one cycle we obtain
=
T
cycT
E
T
σσ
τσ
ε sinh1 (17)
Only a small fraction γ of this elongation is irreversible ie leads to membrane damage
In the current work we assume that γ depends only on cyclic period Tcyc and is
20
independent of σ Also we do not account for self-acceleration of membrane damage ie
we assume that irreversible elongation is proportional to the number of cycles N The
equation for irreversible elongation of the membrane per N cycles is
( )
=
T
NNσσεσε sinh 0 (18)
Here ε0 is
( )τγσ
εE
TT cyccycT=0 (19)
The elongation as a function of the stress and the number of cycles ε(σN) was measured
experimentally using Dynamic Mechanical Analysis (DMA) equipment for two specific
values of stress amplitude Because ε0 is proportional to an unknown parameter γ and
inversely proportional to another unknown parameter τ the lumped parameter ε0 was
used for fitting The model parameters ε0 and σT were fitted to DMA data The
membrane elongation for arbitrary stress amplitude σ was calculated from equation (18)
To validate equation (18) elongation per one stress cycle ε1(σ) was calculated from
Tangs experimental data [7] for Nafion111 membrane and plotted as a function of
applied stress σ see Fig 4 It follows from (18) that
( ) ( )
==
TdN
Nd
σσεσεσε sinh
01 (20)
The experimental data are in good agreement with the prediction of equation (20) with
σT=1 MPa and ε0=37sdot10-6 (Fig 4)
21
Membrane failure occurs after a critical irreversible elongation (damage) εcrit is
accumulated The number of cycles to failure Ncrit is calculated from the following
condition
( ) critcritN εσε =1 (21)
We assume that εcrit does not depend on stress amplitude and frequency and can be
measured once at a specific stress in a DMA test The number of cycles to failure NDMA
in out-off-cell tests is calculated by equation
( )Tcrit
NN
σσsinh0= (22)
( )cyccycT
critcrit
TT
EN
γστε
εε ==
00 (23)
We use N0 as a lumped fitting parameter obtained from a DMA test To obtain the values
of N0 and σT we performed stress cycling for two stress amplitudes σ and fitted the
experimental number of cycles to failure Ncrit by equation (22) Equation (22) predicts
membrane lifetime in a DMA test with arbitrary stress amplitude σ using the obtained
values of N0 and σT from experimental data Analytical dependence of these parameters
on temperature and RH will be published later
Fuel cell conditions under RH cycling differ from DMA test conditions because in DMA
testing the stress is uniformly distributed through the membrane cross-section while in
the cell the stress in the membrane changes substantially from the anode to the cathode
side We incorporated calibration parameter β into the current version of the model in
order to use equation (22) for in-cell membrane lifetime prediction This parameter is
used for renormalization of stress The membrane damage in DMA testing with stress
22
amplitude σ is equivalent to membrane damage in a fuel cell stack when the membrane is
subjected to RH cycling that cause a stress amplitude of βσ
To obtain the calibration parameter β we performed a single RH cycling experiment in a
fuel cell up to membrane failure for particular conditions and measured the experimental
membrane lifetime Ncell Using the membrane stress model we calculated the stress
amplitude σmax for these particular conditions Parameter β is calculated from the
following equation
( )Tcell
NN
σβσ max
0
sinh= (24)
Using the parameters N0 and σT obtained from fitting DMA data by equation (22) and
the parameter β obtained from the in-cell test we predict the in-cell membrane lifetime
under arbitrary RH cycling conditions
V Model parameters
In this section we present input model parameter values and experimental data for a
GORE-SELECTreg membrane in a PRIMEAreg MEA In RH cycling experiments
hydrogen with 100 RH was fed to the anode channel Air fed to the cathode channel
was cycled from RHmax to RHmin with equal time intervals Experimental conditions are
summarized in Table 1 Mechanical properties of GORE-SELECT membranes were
obtained from available literature and summarized in Table 1 DMA tests required for
model calibration were also performed
23
VI Model results
In this section we report the result of modeling of GORE-SELECT membrane damage
and lifetime under in-cell RH cycling conditions The model components ie fuel cell
model membrane stress model and stress accrual model were incorporated into the
MATLAB code The model parameters and test conditions are summarized in Section V
The relative humidity variation in the cathode gas channel during the cycle was
calculated from the fuel cell model and used as the input for the membrane stress model
The calculated relative humidity variation is shown in Fig6 The function with fast
exponential relaxation was used instead of step-wise function for better convergence of
the numerical solution The calculated dependence of λ on time at three points across
the membrane (at the cathode side at the middle of the membrane and at the anode side)
is also shown in Fig6 This dependence is calculated from water diffusion equation in
the membrane (10) with boundary conditions (9) and initial condition ( ) 110 =xλ
Figure 9 indicates that the membrane water content λ(t) follows the humidity cycle RH(t)
There is no time lag because water diffusion time in the membrane sD
htdif 20
2
asymp= is
much smaller than cycling period Tcyc=30s Here h=18 microm is membrane thickness and
D=0510-6 cm2s is the average water diffusion coefficient in the membrane
Water content in the membrane )( txλ is utilized in the membrane stress model to
predict the stress )( txσ distribution in the membrane The model prediction of the
stress in the membrane by equation (13) as a function of time is shown in Fig7 at the
24
cathode and anode sides of the membrane The membrane reaches quasi-steady state
regime after t gtgt τ and stress becomes a periodic function of time oscillating around the
equilibrium value The model prediction for the stress in the periodic regime as a
function of time calculated by equation (16) is shown in Fig8 Maximal stress is
imposed in the region with maximal humidity variation ie at the cathode side of the
membrane At the anode side of the membrane the stress is equal to zero because there is
no humidity cycling One can see that the stress calculated by equation (13) at large time
is in good agreement with the periodic stress shown in Fig8 calculated analytically from
equation (16)
Figures 7 and 8 indicate that after time t larger than relaxation time τ the stress at the
cathode sides oscillates around the equilibrium stress 0=eqσ The membrane at the
cathode side is subjected to tensile stress when ( ) ( )00 =lt xt λλ and to compressive
stress when ( ) ( )00 =gt xt λλ
The maximal value of the stress calculated by the membrane stress model is used in the
damage accrual model to predict membrane lifetime by equation (24) As discussed in
Section IV this equation contains three unknown parameters σT N0 and β Parameters
σT and N0 are calculated by fitting UTC POWER DMA data by equation (22)
Calibration parameter β is calculated from an in-cell lifetime experiment under specific
RH cycling conditions The in-cell membrane stress was calculated by the membrane
stress model
25
Using the model parameters calculated from DMA testing and in-cell RH cycling we
predicted GORE-SELECT membrane lifetime under arbitrary RH cycling conditions
Predicted membrane lifetime (number of cycles to failure) as a function of minimal RH in
the cathode gas channel RHmin is plotted in Fig 9 The anode gas humidity was
assumed to be 100 The maximal RH in the cathode gas channel RHmax of 100 was
also assumed At high RH cycling amplitude (low RHmin) the model predicts exponential
decrease of membrane lifetime with increase of RH cycling amplitude Stress amplitude
is approximately proportional to RH cycling amplitude and the number of cycles to
failure depends exponentially on the stress for large stress according to equation (22)
This results in exponential dependence of the membrane lifetime on RH cycling
amplitude for large values of amplitude (small value of RHmin)
VII Conclusions
A modeling framework was developed that predicts the lifetime of PEM fuel cell
membranes subjected to hydration cycling The developed model predicts membrane
lifetime as a function of RH cycling amplitude and membrane mechanical properties
Membrane failure in the fuel cell is caused by damage accumulation under cyclic stress in
the membrane subjected to cyclic hydrationdehydration A fuel cell membrane is
typically subjected to hydrationdehydration under fuel cell conditions One side of the
membrane dehydrates and attempts to shrink when the feed gas (air) is switched from wet
to dry in the cathode gas channel Mechanical constraints imposed by bipolar plates
prevent the membrane from shrinking This causes in-plane tensile stress in the
membrane Tensile stress causes a crack formation at RH cycled side of the membrane
26
(Fig 3) Further propagation of the crack in the through-plane direction causes
membrane mechanical failure
The modeling framework consists of three components a model of RH distribution in gas
channels a membrane stress model and a damage accrual model Several models of RH
distribution in gas channels are available in literature [8 9 10 11 and 12] and we do not
discuss this model component in the current paper In the current version of the model
we assume equilibrium of water in the membrane with the vapor at the membranegas
interface and use the conventional diffusion equation for calculation of water content in
the membrane bulk with the water diffusion coefficient dependent on water content D(λ)
The membrane stress model calculates the stress in the membrane caused by membrane
cyclic swellingshrinking under RH cycling conditions The local stress in the membrane
is caused by the change in the local hydration level The damage accrual model predicts
the number of cycles to failure for the membrane under applied cyclic stress The input
for the damage accrual model is a maximal stress in the membrane calculated by the
membrane stress model and experimental membrane lifetimes in DMA tests for two
cycling amplitudes The current version of the model also contains one calibration
parameter obtained from an in-cell RH cycling experiment with specific RH cycling
conditions
The model was utilized for in-cell lifetime predictions of GORE-SELECT membranes
The membrane mechanical properties and swelling coefficient were obtained from the
literature DMA testing and in-cell RH cycling were carried out at UTC Power After
27
calibration the model predicts membrane lifetime in fuel cells under arbitrary RH cycling
conditions The calculated membrane lifetime (number of cycles to failure) as a function
of minimal RH in cathode gas channel RHmin is plotted in Fig 9 At high RH cycling
amplitude (low RHmin) the model predicts exponential decrease of membrane lifetime
with increase of RH cycling amplitude Stress amplitude is approximately proportional
to RH cycling amplitude and the number of cycles to failure depends exponentially on
stress for large stress magnitude according to equation (22) This results in exponential
dependence of membrane lifetime on RH cycling amplitude for large values of amplitude
(small value of RHmin)
Acknowledgement
This work was supported by the US Department of Energy under the grant DE-PS36-
08GO98009
References
1 Ho Lee Taehee Kim Woojong Sim Saehoon Kim Byungki Ahn Taewon Lim
and Kwonpil Park Korean J Chem Eng 28(2) 487-491 (2011)
2 Xinyu Huang Roham Solasi Yue Zou Matthew Feshler Kenneth Reifsnider
David Condit Sergei Burlatsky Thomas Madden Journal of Polymer Science
Part B 44 (16) p 2346ndash2357 (2006)
3 Yaliang Tang Anette M Karlsson Michael H Santare Michael Gilbert Simon
Cleghorn William B Johnson Materials Science and Engineering A 425 (2006)
297ndash304
28
4 Yaliang Tang Ahmet Kusoglu Anette M Karlsson Michael H Santare Simon
Cleghorn William B Johnson Journal of Power Sources 175 (2008) 817ndash825
5 A Kusoglu A M Karlsson M H Santare S Cleghorn W B Johnson Journal
of Power Sources 161 987-996 (2006)
6 A Kusoglu A M Karlsson M H Santare Simon Cleghorn W B Johnson
Journal of Power Sources 170 345-358 (2007)
7 Haolin Tang Shen Peikang San Ping Jiang Fang Wang Mu Pan Journal of
Power Sources 170 (2007) 85ndash92
8 T F Fuller and J Newman J Electrochem Soc 140 (5) 1218-1225 (1993)
9 T V Nguyen and R E White J Electrochem Soc 140 (8) 2178-2186 (1993)
10 J S Yi and T V Nguyen J Electrochem Soc 145 (4) 1149-1159 (1998)
11 T E Springer T A Zawodzinski and S Gottesfeld J Electrochem Soc 138 (8)
2334-2342 (1991)
12 A Z Weber R M Darling and J Newman J Electrochem Soc 151 (10)
A1715-A1727 (2004)
13 L Boltzmann Pogg Ann u Chem 7 624 (1876)
14 S Turner Polymer Eng a Sci 6 306 (1966)
15 W N Findley and G Khosla J Appl Phys 26 821 (1955)
16 K van Holde J Polymer Sci 24 417 (1957)
17 T L Smith Trans Soc Rheol 6 61 (1962)
18 H Leaderman Trans Soc Rheol 6 361 (1962)
19 I M Ward and E T Onat J Mech Phys Solids 11 217 (1963)
29
20 Roham Solasi Yue Zou Xinyu Huang Kenneth Reifsnider Mech Time-Depend
Mater 12 15ndash30 (2008)
21 Paul W Majsztrik Andrew B Bocarsly and Jay B Benziger Macromolecules
41 9849-9862 (2008)
22 F Bauer S Denneler M Willert-Porada Journal of Polymer Science Part B
Polymer Physics Vol 43 786ndash795 (2005)
23 Kirt A Page Kevin M Cable and Robert B Moore Macromolecules 2005 38
6472-6484
24 Gierke T D Munn G E Wilson F C J Polym Sci Polym Phys Ed 1981 19
1687ndash1704
25 Hsu W Y Gierke T D J Membrane Sci 1983 13 307ndash326
26 Thomas A Zawodzinski Thomas E Spriner John Davey Roger Jestel Cruz
Lopez Judith Valerio and Shimshon Gottesfeld J Electrochem Soc 140 (7)
1981-1985 (1993)
27 Paul W Majsztrik M Barclay Satterfield Andrew B Bocarsly Jay B Benziger
J Membrane Sci 301 (2007) 93ndash106
28 T Takamatsu M Hashiyama A Eisenberg J Appl Polym Sci 24 (11) (1979)
2199ndash2220
29 DR Morris XD Sun J Appl Polym Sci 50 (8) (1993) 1445ndash1452
30 Shanhai Ge Xuguang Li Baolian Yi and I-Ming Hsing J Electrochem Soc
152 (6) A1149-A1157 (2005)
31 Adam Z Weber and John Newman J Electrochem Soc 151 (2) A311-A325
(2004)
30
32 Adam Z Weber and John Newman Chem Rev 2004 104 4679-4726
33 Timothy J Silverman Jeremy P Meyers and Joseph J Beaman J Electrochem
Soc 157 (10) B1376-B1381 (2010)
34 Halsey G White HJ Eyring H Text Res J 1945 v 15 p 295
35 M Gummalla VV Atrazhev AN Varyukhin and SF Burlatsky To be
published
36 P Choi and R Datta J Electrochem Soc 150 E601 (2003)
37 P de Gennes Scaling Concepts in Polymer Physics Cornell University Press
List of Tables
Table 1 Model parameters and experimental conditions
Parameter Description ValueSource
Operational conditions
Tcyc RH cycling time period 30 sec
RHmax Maximum relative humidity in cathode channel 100
RHmin Minimum relative humidity in cathode channel 10
T Cell temperature 78ordmC
Membrane properties
E(RHT) Youngrsquos modulus of the membrane [4]
)(aλ Membrane water content as a function of vapor
activity [mol H2Omol SO3] [36]
)(λD Diffusion coefficient of water in the membrane Fig5
31
α Dimension change coefficient 0004 (data from [4])
Tσ Fitting parameter (internal data fit to Eq 27) 17 MPa
0N Fitting parameter (internal data fit to Eq 27) 12middot106
β DMA to in-cell calibration parameter 23
Figure Captions
Figure 1 Schematic diagram showing the components of the model framework to predict
mechanical life of the membrane undergoing hydration cycles
Figure 2 (a) Polymer chain segment constrained by one entanglement and subjected to
the external force F (b) Potential energy of monomer in entanglement before applying
the force (in the left hand side of the Fig 2b) and after applying the force (in the right
hand side of the Fig 2b)
Figure 3 Schematic figure of membrane in fuel cell (counter-flow configuration)
constrained between two bi-polar plates (a) and crack formation (b) The wet fuel exits
from the anode gas channel (top channel) Initially wet air is fed into cathode gas
channel (bottom channel) When cathode side feed gas (air) is switched from wet to dry
cathode side of the membrane dehydrates and attempts to shrink The anode side of the
membrane remains wet and swollen
Figure 4 Fitting Tangs experimental data [7] (triangles) by equation (22) (solid line)
Fitting parameters values are σT=1 MPa and ε0=37sdot10-6
32
Figure 5 Dependence of diffusion coefficient in Nafion membrane on water content λ
(UTRC internal experimental data) There are not available data in range from 52=λ
to 15=λ so linear approximation is used in this region
Figure 6 Model prediction of dependence of RH on time and λ on time at the anode side
at the middle of the membrane and at the cathode side
Figure 7 Model prediction of stress as a function of time under RH cycling at the cathode
and at the anode sides of membrane
Figure 8 Model prediction of stress in quasi-steady-state regime at the cathode side at
the middle of the membrane and at the anode side
Figure 9 Calculated membrane lifetime (the number of cycles to failure) as a function of
minimal RH at the cathode side of membrane Anode side of membrane maintains 100
RH
33
Figures
Fuel cell RH distribution model
Operating conditionsinlet RH inlet Tcycling period
hydrationdehydration induced stress model
σ(t)Damage accrual model
Membrane Mechanical Degradation Model
Membrane propertiesE(RHT) ε∆λ DMA
ε(σNcycT) εcrit
Mechanical life-time
Fuel cell stack design
λ(t)
Figure 1
34
Figure 2
35
Figure 3
σ yy a)
b)
Crack formation
bi - polar plate
bi - polar plate
dry region
stress
y
x
σ yy a)
b)
Crack formation
bi - polar plate
bi - polar plate
dry air
wet fuel
σ yy a)
b)
Crack formation
bi - polar plate
bi - polar plate
dry region
stress
y
x
σ yy a)
b)
Crack formation
bi - polar plate
bi - polar plate
dry air
wet fuel
36
0
50
100
150
200
250
0 1 2 3 4 5 6 7
dud
N
Stress (MPa)
Figure 4
37
0
2
4
6
8
10
12
14
16
0 25 5 75 10 125 15
D1
0^-6
cm
^2s
λ
Figure 5
38
0
3
6
9
12
15
0 5 10 15 20 25 30 35 time s
000
2000
4000
6000
8000
10000
x=0 (Cathode side) x=h2 x=h (Anode side) RH
λ RH
Figure 6
39
-15
-1
-05
0
05
1
15
2
25
0 50 100 150 200 250 300
Time t
Str
ess
MP
a
x=0 (Cathode side)
x=h (Anode side)
Figure 7
40
-15
-1
-05
0
05
1
15
0 5 10 15 20 25 30 35
time s
Str
ess
MP
a
x=0 (Cathode side)x=h2x=h (Anode side)
a)
Figure 8
41
Life-time cycles
100E+05
100E+06
100E+07
100E+08
100E+09
0 02 04 06 08 1RH min
Figure 9

8
on Nafion creep dynamics fundamental insights into the mechanism for polymer damage
accrual are needed
Kusoglu [5] showed through simulations that a hydro-thermal loading under fuel cell
operating conditions results in compressive stress in the polymer According to [5] the
stress level exceeds the yield strength causing permanent damage to the polymer
membrane The compressive stress causes extrusion of membrane materials from the
compressed areas such as the areas under the seals Apparently the membrane extrusion
does not cause the loss of membrane integrity We assume that the tensile stress in
membrane is much more damaging for membrane integrity because it causes formation
and propagation of cracks and crazes In the present work we focus on generation of
through-plane cracks in the membrane that result in gas crossover through the membrane
and dramatic performance loss
In summary membrane hydration and dehydration changes the local membrane water
content resulting in a stress cycle in the polymer membrane A correlation between
hydration level and stress cycling is needed Additionally to predict life of the
membrane a correlation between membrane macroscopic mechanical properties stress-
cycling and membrane damage accrual needs to be developed The overall model that
predicts membrane lifetime as a function of membrane mechanical properties and fuel
cell operating conditions could guide the synthesis of new membranes with tuned
mechanical properties and enhanced life in a fuel cell Development of such a modeling
9
framework to predict the life of a membrane subjected to hydration cycles is the focus of
this work
The rest of the paper is organized as follows The extended Eyring model of polymer
viscoelastic deformation is presented in Section II This model is used as a basis of the
membrane stress and damage accrual models rather than as a standalone framework
component A model that predicts stress in the membrane during RH cycling in gas
channels for given membrane mechanical properties is proposed in Section III Next a
mathematical model identifying the functional form that relates the stress cycle to
irreversible damage of the polymer is discussed in Section IV The accrual of such
irreversible damage results in subsequent polymer failure determining the membrane life
subjected to hydration cycling Input parameters of the model are summarized in Section
V Modeling results for a GORE-SELECT membrane and discussion of the results are
presented in Section VI Conclusions are presented in Section VII
II Extended Eyring model for polymer deformation
The time dependent response of the stress to applied strain that takes into account
viscoelastic relaxation in the polymer material is needed for two components of the
degradation model The model of polymer viscoelastic deformation utilized this paper is
based on the assumption that polymer deformation occurs through the transport of
polymer chains through entanglements The early Eyring model [34] is based on a
similar concept The Eyring model calculates the non-linear dependence of polymer
deformation on applied constant stress and is relevant to creep experiments In a creep
experiment a sample is subjected to constant stress lower than the yield stress while the
10
elongation is monitored In this section we briefly describe a new extended Eyring
model that calculates stress relaxation in a stretched constrained polymer under arbitrary
time-dependent controlled deformation
The concept used in the current model is summarized below Following [37] we model a
polymer as a set of entangled chains One chain wraps around another chain and turns
around at the entanglement point In the current model stress is transmitted from one
chain to another through the entanglements which secure the mechanical integrity of the
polymer A Chain Segment (CS) is defined as a fraction of the chain confined between
two subsequent entanglements The macroscopic deformation of the polymer is
calculated from the microscopic elongation of CSs driven by the changing distance
between entanglements The macroscopic stress is calculated from the microscopic
tension acting along the CSs This concept to a large extent is similar to the concept of
interconnected elastic springs in elasticity theory The CS is an analog of the spring the
entanglement is an analog of the point where the springs are attached to each other The
elastic deformation in the current polymer model is achieved through the elastic
deformation of individual CSs which is an analog of the elastic deformation of the
springs in elasticity theory The fundamental difference comes from the fact that the
chains can slip through entanglements changing the equilibrium length of CSs We
assume that slippage of the chain through entanglements causes irreversible elongation of
the polymer
11
To calculate the slip rate as a function of tensile force we consider the dynamics of CS at
the entanglement as indicated in Fig 2a In the absence of the tensile force F the
monomer adjacent to the entanglement is located in the local energy minimum between
two symmetric energy barriers U0 (Fig 2b) The chain slips through the entanglement
when the monomer overcomes one of the energy barriers
In a stressed polymer a tensile force F is induced by stress and acts on the chain (Fig
2a) disturbing the symmetry of the monomerrsquos potential energy well the right barrier
becomes lower by Fa and the left barrier becomes higher byFa where a is the
monomer length This results in preferable displacement of the monomer to the right ie
along the force direction Here we assume that the monomer motion is thermally induced
and assisted by the force F 0UFa ltlt The rate +V at which the monomer jumps to the
right is
minusminus=+
kT
FaUaV 00 exp
2ω
(1)
The rate of monomer displacement to the left minusV is
+minus=minus
kT
FaUaV 00 exp
2ω
(2)
Therefore the average rate of polymer transport through the entanglement is
=kT
FaaV sinhω (3)
Here ω is the frequency of thermally activated jumps of a monomer in the local minimum
in the entangled state
12
minus=kT
U00 expωω (4)
Equation (3) indicates non-linear dependence of the chain slip rate through the
entanglement on the tensile force of the chain Equation (3) describes the conventional
linear dependence of velocity on the force when 1ltltkT
Fa
FkT
aV
ω2
= (5)
Here kT
a ω2
is a mobility of the chain in the entanglement In the opposite limit 1gtgtkT
Fa
equation (3) describes an exponential dependence of velocity on the force
=kT
FaaV exp
2ω
(6)
In a future publication the exponential increase of the chain slip rate through
entanglements with increasing tensile force will be related to the shape of σ-ε curves
observed for polymer materials We speculate that the yield stress is related to crossover
of the chain slip rate from equation (5) to equation (6)
Following the above concept of polymer plastic deformation we express macroscopic
stress σ through microscopic tension force F and the rate of macroscopic deformation
dt
dε through the microscopic chain velocity V predicted by equation (3) The detailed
derivation will be published in a forthcoming paper The final microscopic equation that
relates polymer deformation ε with external stress σ is presented below
minus=
T
T
dt
dE
dt
d
σσ
τσεσ
sinh (7)
13
Here τ is the polymer relaxation time and εσ
partpart=E is Youngrsquos modulus for the polymer
relT V
kT=σ where Vrel is a typical volume of polymer matrix around the entanglement
disturbed by one elementary act of monomer transfer through the entanglement The first
term in right hand part of equation (7) is the rate of the stress change induced by polymer
deformation The second term is rate the plastic relaxation of the stress This term
represents an extension of Maxwellrsquos relaxation rate στ In the case of low stress
Tσσ ltlt hyperbolic sine sinh in the right hand side of equation (7) is expanded to
reproduce the well-known Maxwell equation for polymer viscoelastic deformation
[ ]τσεσ minus=minus
partpart
Et
(8)
The fundamental difference between equation (7) and the Maxwell equation (8) is in the
relaxation terms in the right hand sides of equations (7) and (8) At large stress Tσσ gtgt
the hyperbolic sine asymptotically approaches the exponent leading to a sharp increase
in the stress relaxation rate as the applied stress is increased The detailed derivation of
equation (7) and validation of the model presented above will be published later in a
separate paper
III Membrane Stress Model
In this section we present the model that calculates the stress induced by
hydrationdehydration cycling In a fuel cell stack the membrane electrode assembly
(MEA) is constrained between two bipolar plates (Fig 3a) The membrane can
neitherbend nor change length Fuel is supplied to the MEA through fuel gas channels
14
and oxidant is supplied through oxidant (air) channels as indicated schematically in
Figure 3
To illustrate the mechanism of membrane failure due to RH cycling in the gas channels
we consider the following experiment Initially wet fuel is fed into the anode gas
channel (top channel shown in Figure 3a) and wet air is fed into the cathode gas channel
(bottom channel shown in Figure 3a) Both sides of the membrane are equilibrated with
wet gas until the equilibrium water content λ0 is reached and all mechanical stresses in
the membrane relax to zero The cathode side of the membrane dehydrates and attempts
to shrink when feed gas (air) is switched from wet to dry in the cathode gas channel
Mechanical constraints which prevent the membrane from shrinking cause in-plane
tensile stress σyy in the membrane Tensile stress results in a crack formation on the RH
cycled side of the membrane (Fig 3b) Further propagation of the crack in the through-
plane direction causes membrane mechanical failure
To calculate water distribution in the membrane cross-section at a fixed coordinate y
along the air channel we use RH(yt) the relative humidity distribution function predicted
by the fuel cell model Here we assume that the equilibration time of water in the
membrane is much smaller than RH cycling period in the gas channels Therefore the
water at the membrane interfaces is in thermodynamic equilibrium with vapor in the gas
channels
( ) ( )( )( ) ( )( )tyRHtyLx
tyRHtyx
Aeqm
Ceq
0
λλλλ==
== (9)
15
Here x is the through-membrane coordinate λeq(RH) is the equilibrium water content in
the membrane (an experimentally measured function of RH) RHC is the gas RH in the
cathode gas channel and RHA is the gas RH in the anode gas channel In the current
paper we utilize the following conventional diffusion equation with a water content
dependent diffusion coefficient to calculate water profile in the membrane
( ) 0=
partpart
partpartminus
partpart
xD
xt
λλλ (10)
Here D(λ) is the experimentally measured water diffusion coefficient in the membrane
(see Fig7 in Section VI) Initial conditions for equation (10) can be chosen arbitrarily
because after several cycles the membrane evolves to a new quasi-equilibrium state
governed by cyclic conditions and the initial state becomes irrelevant We chose the
initial conditions ( ) 00 λλ =x Solution of equation (10) with the boundary conditions (9)
gives the water distribution in the membrane λ(xyt) Below we calculate the membrane
stress at the membrane boundary adjacent to the air inlet (fixed coordinate y) where RH
cycling and stress amplitudes are maximal and limit membrane lifetime We start with a
calculation of the linear elastic response of the membrane to small changes in λ and
subsequently model the more general viscoelastic case
The macroscopic state of the membrane is determined by two parameters the membrane
length L0 and water content λ0 We assume that at equilibrium the stress in the
membrane is equal to zero The stress in the membrane can be generated by deviation of
the membrane length from equilibrium 0LLL minus=∆ at constant water content Also the
stress can be generated by deviation of water content from equilibrium
16
( ) ( ) 0 λλλ minus=∆ txtx in the geometrically constrained membrane (at constant length)
By analogy with linear elasticity theory with thermal expansion we calculate the linear
response of the membrane stress to small deviation from equilibrium as follows
( )( )txE yyyy λαεσ ∆minus= (11)
Here 0LLyy ∆=ε and E is the Young modulus of the membrane Swelling coefficient α
determines the length change ∆y of unconstrained (zero σ) membrane caused by the
change of the membrane water content ∆λ λα∆=∆ yy In 1D approximation the local
stress in the membrane depends on the change of the local membrane hydration (λ(xt)-
λ0)
In the membrane stress can be induced by changes in deformation water content and
simultaneous plastic relaxation The total rate of the stress change is the sum of the stress
change rate caused by membrane deformation and the stress change rate caused by the
change of membrane water content
λε
σσσttdt
d yyyyyy
partpart
+part
part= (12)
According to equation (11) the rate of the stress change induced by the change of the rate
of deviation of water content in constrained system with constant deformation and
without plastic relaxation is
dt
dE
tyy λα
σ
ε
∆=part
part (12a)
The second term in equation (12) is presented by equation (7)
17
minus=
partpart
T
Tyyyy
dt
dE
t σσ
τσεσ
λλ
sinh (12b)
Substituting equations (12a) and (12b) into the right hand side of equation (12) we obtain
the equation for the total rate of stress change in the membrane
( ) ( ) ( ) ( )
minus∆+
partpart
=T
yyTyyyy tx
dt
txdE
t
txE
dt
txd
σσ
τσλα
εσ
λ
sinh
(13)
The first term in the right hand side of equation (13) is equal to zero in a constrained
membrane Local water content λ(xt) is calculated by equation (10) with boundary
conditions (9) Equation (13) relates the stress in the membrane with water content in the
membrane for arbitrary RH cycling protocol
Equation (13) was solved numerically with parameters specified in the Table 1 The
calculated stress as a function of time is presented in Figure 7 The results indicate that
the membrane stress becomes a periodic function of time after several cycles if RH is a
periodic function of time To derive an analytical equation for the periodic stress we
utilize the separation of slow variable method The plastic (irreversible) deformation of
the membrane during one cycle is small because the cycling period is much smaller than
the membrane relaxation time Tcyc ltlt τ Therefore we can consider the membrane as an
elastic media during one cycle However the membrane slowly approaches a new
equilibrium state during each cycle After a long time t gtgt τ the membrane reaches the
new state with new equilibrium water content ( )xλ During the cycle λ oscillates below
and above ( )xλ At ( )xλλ = the membrane is not stressed The in-plane stress in the
18
periodical regime is driven by the deviation of λ from ( )xλ and is calculated by
following equation
( ) ( ) ( ) ( )( )xtxtxEtxyy λλασ minusminus= (14)
The stress averaged over time in the periodic regime is equal to zero for any x
Averaging (14) over time and taking advantage of the condition ( ) 0 =tyy txσ we
obtain the following expression for ( )xλ
( ) ( ) ( )( )
t
t
txE
txtxEx
λλ = (15)
Substituting (15) into (14) we obtain the final equation for the stress under periodic RH
cycling
( ) ( ) ( ) ( ) ( )( )
minusminus=
t
tyy txE
txtxEtxtxEtx
λλασ (16)
Substituting ( )txλ calculated from equation (10) with boundary conditions (9) into
equation (16) we calculate cyclic stress in the membrane
IV Damage accrual model
In this section we describe the model that calculates the membrane lifetime as a function
of applied cyclic stress Using the membrane stress model presented in Section III we
calculate the stress profile in the membrane ( )txyy σ for a given water content λ(xt)
We predict the membrane lifetime as a function of membrane stress using the damage
accrual model
19
The typical stress in the membrane under fuel cell operating conditions is much smaller
than the membrane tensile strength Many RH cycles are required to cause substantial
membrane damage However with each cycle the cyclic stress causes small irreversible
elongation ie plastic deformation of the membrane Accumulation of irreversible
elongation in the membrane causes membrane damage after a large number of cycles
Tang et al [7] experimentally studied Nafion111 membrane irreversible elongation under
cyclic stress They observed that irreversible elongation is accumulated over a large
number of cycles and causes damage of the membrane even at relatively small
amplitudes of cyclic stress They also demonstrated that at relatively small stress
σlt4MPa the membrane elongation rate is a linear function of applied stress magnitude
At larger stress amplitudes of about σ=65MPa the elongation rate rapidly increases We
speculate that such nonlinear dependence of elongation rate on stress amplitude is caused
by exponential dependence of the stress relaxation rate on the stress magnitude predicted
by extended Eyring model presented in Section III
The elongation of the membrane subjected to step-like cyclic stress is a function of the
stress amplitude σ and the cycle period Tcyc Applying equation (7) to the membrane
elongation during constant stress hold in one cycle we obtain
=
T
cycT
E
T
σσ
τσ
ε sinh1 (17)
Only a small fraction γ of this elongation is irreversible ie leads to membrane damage
In the current work we assume that γ depends only on cyclic period Tcyc and is
20
independent of σ Also we do not account for self-acceleration of membrane damage ie
we assume that irreversible elongation is proportional to the number of cycles N The
equation for irreversible elongation of the membrane per N cycles is
( )
=
T
NNσσεσε sinh 0 (18)
Here ε0 is
( )τγσ
εE
TT cyccycT=0 (19)
The elongation as a function of the stress and the number of cycles ε(σN) was measured
experimentally using Dynamic Mechanical Analysis (DMA) equipment for two specific
values of stress amplitude Because ε0 is proportional to an unknown parameter γ and
inversely proportional to another unknown parameter τ the lumped parameter ε0 was
used for fitting The model parameters ε0 and σT were fitted to DMA data The
membrane elongation for arbitrary stress amplitude σ was calculated from equation (18)
To validate equation (18) elongation per one stress cycle ε1(σ) was calculated from
Tangs experimental data [7] for Nafion111 membrane and plotted as a function of
applied stress σ see Fig 4 It follows from (18) that
( ) ( )
==
TdN
Nd
σσεσεσε sinh
01 (20)
The experimental data are in good agreement with the prediction of equation (20) with
σT=1 MPa and ε0=37sdot10-6 (Fig 4)
21
Membrane failure occurs after a critical irreversible elongation (damage) εcrit is
accumulated The number of cycles to failure Ncrit is calculated from the following
condition
( ) critcritN εσε =1 (21)
We assume that εcrit does not depend on stress amplitude and frequency and can be
measured once at a specific stress in a DMA test The number of cycles to failure NDMA
in out-off-cell tests is calculated by equation
( )Tcrit
NN
σσsinh0= (22)
( )cyccycT
critcrit
TT
EN
γστε
εε ==
00 (23)
We use N0 as a lumped fitting parameter obtained from a DMA test To obtain the values
of N0 and σT we performed stress cycling for two stress amplitudes σ and fitted the
experimental number of cycles to failure Ncrit by equation (22) Equation (22) predicts
membrane lifetime in a DMA test with arbitrary stress amplitude σ using the obtained
values of N0 and σT from experimental data Analytical dependence of these parameters
on temperature and RH will be published later
Fuel cell conditions under RH cycling differ from DMA test conditions because in DMA
testing the stress is uniformly distributed through the membrane cross-section while in
the cell the stress in the membrane changes substantially from the anode to the cathode
side We incorporated calibration parameter β into the current version of the model in
order to use equation (22) for in-cell membrane lifetime prediction This parameter is
used for renormalization of stress The membrane damage in DMA testing with stress
22
amplitude σ is equivalent to membrane damage in a fuel cell stack when the membrane is
subjected to RH cycling that cause a stress amplitude of βσ
To obtain the calibration parameter β we performed a single RH cycling experiment in a
fuel cell up to membrane failure for particular conditions and measured the experimental
membrane lifetime Ncell Using the membrane stress model we calculated the stress
amplitude σmax for these particular conditions Parameter β is calculated from the
following equation
( )Tcell
NN
σβσ max
0
sinh= (24)
Using the parameters N0 and σT obtained from fitting DMA data by equation (22) and
the parameter β obtained from the in-cell test we predict the in-cell membrane lifetime
under arbitrary RH cycling conditions
V Model parameters
In this section we present input model parameter values and experimental data for a
GORE-SELECTreg membrane in a PRIMEAreg MEA In RH cycling experiments
hydrogen with 100 RH was fed to the anode channel Air fed to the cathode channel
was cycled from RHmax to RHmin with equal time intervals Experimental conditions are
summarized in Table 1 Mechanical properties of GORE-SELECT membranes were
obtained from available literature and summarized in Table 1 DMA tests required for
model calibration were also performed
23
VI Model results
In this section we report the result of modeling of GORE-SELECT membrane damage
and lifetime under in-cell RH cycling conditions The model components ie fuel cell
model membrane stress model and stress accrual model were incorporated into the
MATLAB code The model parameters and test conditions are summarized in Section V
The relative humidity variation in the cathode gas channel during the cycle was
calculated from the fuel cell model and used as the input for the membrane stress model
The calculated relative humidity variation is shown in Fig6 The function with fast
exponential relaxation was used instead of step-wise function for better convergence of
the numerical solution The calculated dependence of λ on time at three points across
the membrane (at the cathode side at the middle of the membrane and at the anode side)
is also shown in Fig6 This dependence is calculated from water diffusion equation in
the membrane (10) with boundary conditions (9) and initial condition ( ) 110 =xλ
Figure 9 indicates that the membrane water content λ(t) follows the humidity cycle RH(t)
There is no time lag because water diffusion time in the membrane sD
htdif 20
2
asymp= is
much smaller than cycling period Tcyc=30s Here h=18 microm is membrane thickness and
D=0510-6 cm2s is the average water diffusion coefficient in the membrane
Water content in the membrane )( txλ is utilized in the membrane stress model to
predict the stress )( txσ distribution in the membrane The model prediction of the
stress in the membrane by equation (13) as a function of time is shown in Fig7 at the
24
cathode and anode sides of the membrane The membrane reaches quasi-steady state
regime after t gtgt τ and stress becomes a periodic function of time oscillating around the
equilibrium value The model prediction for the stress in the periodic regime as a
function of time calculated by equation (16) is shown in Fig8 Maximal stress is
imposed in the region with maximal humidity variation ie at the cathode side of the
membrane At the anode side of the membrane the stress is equal to zero because there is
no humidity cycling One can see that the stress calculated by equation (13) at large time
is in good agreement with the periodic stress shown in Fig8 calculated analytically from
equation (16)
Figures 7 and 8 indicate that after time t larger than relaxation time τ the stress at the
cathode sides oscillates around the equilibrium stress 0=eqσ The membrane at the
cathode side is subjected to tensile stress when ( ) ( )00 =lt xt λλ and to compressive
stress when ( ) ( )00 =gt xt λλ
The maximal value of the stress calculated by the membrane stress model is used in the
damage accrual model to predict membrane lifetime by equation (24) As discussed in
Section IV this equation contains three unknown parameters σT N0 and β Parameters
σT and N0 are calculated by fitting UTC POWER DMA data by equation (22)
Calibration parameter β is calculated from an in-cell lifetime experiment under specific
RH cycling conditions The in-cell membrane stress was calculated by the membrane
stress model
25
Using the model parameters calculated from DMA testing and in-cell RH cycling we
predicted GORE-SELECT membrane lifetime under arbitrary RH cycling conditions
Predicted membrane lifetime (number of cycles to failure) as a function of minimal RH in
the cathode gas channel RHmin is plotted in Fig 9 The anode gas humidity was
assumed to be 100 The maximal RH in the cathode gas channel RHmax of 100 was
also assumed At high RH cycling amplitude (low RHmin) the model predicts exponential
decrease of membrane lifetime with increase of RH cycling amplitude Stress amplitude
is approximately proportional to RH cycling amplitude and the number of cycles to
failure depends exponentially on the stress for large stress according to equation (22)
This results in exponential dependence of the membrane lifetime on RH cycling
amplitude for large values of amplitude (small value of RHmin)
VII Conclusions
A modeling framework was developed that predicts the lifetime of PEM fuel cell
membranes subjected to hydration cycling The developed model predicts membrane
lifetime as a function of RH cycling amplitude and membrane mechanical properties
Membrane failure in the fuel cell is caused by damage accumulation under cyclic stress in
the membrane subjected to cyclic hydrationdehydration A fuel cell membrane is
typically subjected to hydrationdehydration under fuel cell conditions One side of the
membrane dehydrates and attempts to shrink when the feed gas (air) is switched from wet
to dry in the cathode gas channel Mechanical constraints imposed by bipolar plates
prevent the membrane from shrinking This causes in-plane tensile stress in the
membrane Tensile stress causes a crack formation at RH cycled side of the membrane
26
(Fig 3) Further propagation of the crack in the through-plane direction causes
membrane mechanical failure
The modeling framework consists of three components a model of RH distribution in gas
channels a membrane stress model and a damage accrual model Several models of RH
distribution in gas channels are available in literature [8 9 10 11 and 12] and we do not
discuss this model component in the current paper In the current version of the model
we assume equilibrium of water in the membrane with the vapor at the membranegas
interface and use the conventional diffusion equation for calculation of water content in
the membrane bulk with the water diffusion coefficient dependent on water content D(λ)
The membrane stress model calculates the stress in the membrane caused by membrane
cyclic swellingshrinking under RH cycling conditions The local stress in the membrane
is caused by the change in the local hydration level The damage accrual model predicts
the number of cycles to failure for the membrane under applied cyclic stress The input
for the damage accrual model is a maximal stress in the membrane calculated by the
membrane stress model and experimental membrane lifetimes in DMA tests for two
cycling amplitudes The current version of the model also contains one calibration
parameter obtained from an in-cell RH cycling experiment with specific RH cycling
conditions
The model was utilized for in-cell lifetime predictions of GORE-SELECT membranes
The membrane mechanical properties and swelling coefficient were obtained from the
literature DMA testing and in-cell RH cycling were carried out at UTC Power After
27
calibration the model predicts membrane lifetime in fuel cells under arbitrary RH cycling
conditions The calculated membrane lifetime (number of cycles to failure) as a function
of minimal RH in cathode gas channel RHmin is plotted in Fig 9 At high RH cycling
amplitude (low RHmin) the model predicts exponential decrease of membrane lifetime
with increase of RH cycling amplitude Stress amplitude is approximately proportional
to RH cycling amplitude and the number of cycles to failure depends exponentially on
stress for large stress magnitude according to equation (22) This results in exponential
dependence of membrane lifetime on RH cycling amplitude for large values of amplitude
(small value of RHmin)
Acknowledgement
This work was supported by the US Department of Energy under the grant DE-PS36-
08GO98009
References
1 Ho Lee Taehee Kim Woojong Sim Saehoon Kim Byungki Ahn Taewon Lim
and Kwonpil Park Korean J Chem Eng 28(2) 487-491 (2011)
2 Xinyu Huang Roham Solasi Yue Zou Matthew Feshler Kenneth Reifsnider
David Condit Sergei Burlatsky Thomas Madden Journal of Polymer Science
Part B 44 (16) p 2346ndash2357 (2006)
3 Yaliang Tang Anette M Karlsson Michael H Santare Michael Gilbert Simon
Cleghorn William B Johnson Materials Science and Engineering A 425 (2006)
297ndash304
28
4 Yaliang Tang Ahmet Kusoglu Anette M Karlsson Michael H Santare Simon
Cleghorn William B Johnson Journal of Power Sources 175 (2008) 817ndash825
5 A Kusoglu A M Karlsson M H Santare S Cleghorn W B Johnson Journal
of Power Sources 161 987-996 (2006)
6 A Kusoglu A M Karlsson M H Santare Simon Cleghorn W B Johnson
Journal of Power Sources 170 345-358 (2007)
7 Haolin Tang Shen Peikang San Ping Jiang Fang Wang Mu Pan Journal of
Power Sources 170 (2007) 85ndash92
8 T F Fuller and J Newman J Electrochem Soc 140 (5) 1218-1225 (1993)
9 T V Nguyen and R E White J Electrochem Soc 140 (8) 2178-2186 (1993)
10 J S Yi and T V Nguyen J Electrochem Soc 145 (4) 1149-1159 (1998)
11 T E Springer T A Zawodzinski and S Gottesfeld J Electrochem Soc 138 (8)
2334-2342 (1991)
12 A Z Weber R M Darling and J Newman J Electrochem Soc 151 (10)
A1715-A1727 (2004)
13 L Boltzmann Pogg Ann u Chem 7 624 (1876)
14 S Turner Polymer Eng a Sci 6 306 (1966)
15 W N Findley and G Khosla J Appl Phys 26 821 (1955)
16 K van Holde J Polymer Sci 24 417 (1957)
17 T L Smith Trans Soc Rheol 6 61 (1962)
18 H Leaderman Trans Soc Rheol 6 361 (1962)
19 I M Ward and E T Onat J Mech Phys Solids 11 217 (1963)
29
20 Roham Solasi Yue Zou Xinyu Huang Kenneth Reifsnider Mech Time-Depend
Mater 12 15ndash30 (2008)
21 Paul W Majsztrik Andrew B Bocarsly and Jay B Benziger Macromolecules
41 9849-9862 (2008)
22 F Bauer S Denneler M Willert-Porada Journal of Polymer Science Part B
Polymer Physics Vol 43 786ndash795 (2005)
23 Kirt A Page Kevin M Cable and Robert B Moore Macromolecules 2005 38
6472-6484
24 Gierke T D Munn G E Wilson F C J Polym Sci Polym Phys Ed 1981 19
1687ndash1704
25 Hsu W Y Gierke T D J Membrane Sci 1983 13 307ndash326
26 Thomas A Zawodzinski Thomas E Spriner John Davey Roger Jestel Cruz
Lopez Judith Valerio and Shimshon Gottesfeld J Electrochem Soc 140 (7)
1981-1985 (1993)
27 Paul W Majsztrik M Barclay Satterfield Andrew B Bocarsly Jay B Benziger
J Membrane Sci 301 (2007) 93ndash106
28 T Takamatsu M Hashiyama A Eisenberg J Appl Polym Sci 24 (11) (1979)
2199ndash2220
29 DR Morris XD Sun J Appl Polym Sci 50 (8) (1993) 1445ndash1452
30 Shanhai Ge Xuguang Li Baolian Yi and I-Ming Hsing J Electrochem Soc
152 (6) A1149-A1157 (2005)
31 Adam Z Weber and John Newman J Electrochem Soc 151 (2) A311-A325
(2004)
30
32 Adam Z Weber and John Newman Chem Rev 2004 104 4679-4726
33 Timothy J Silverman Jeremy P Meyers and Joseph J Beaman J Electrochem
Soc 157 (10) B1376-B1381 (2010)
34 Halsey G White HJ Eyring H Text Res J 1945 v 15 p 295
35 M Gummalla VV Atrazhev AN Varyukhin and SF Burlatsky To be
published
36 P Choi and R Datta J Electrochem Soc 150 E601 (2003)
37 P de Gennes Scaling Concepts in Polymer Physics Cornell University Press
List of Tables
Table 1 Model parameters and experimental conditions
Parameter Description ValueSource
Operational conditions
Tcyc RH cycling time period 30 sec
RHmax Maximum relative humidity in cathode channel 100
RHmin Minimum relative humidity in cathode channel 10
T Cell temperature 78ordmC
Membrane properties
E(RHT) Youngrsquos modulus of the membrane [4]
)(aλ Membrane water content as a function of vapor
activity [mol H2Omol SO3] [36]
)(λD Diffusion coefficient of water in the membrane Fig5
31
α Dimension change coefficient 0004 (data from [4])
Tσ Fitting parameter (internal data fit to Eq 27) 17 MPa
0N Fitting parameter (internal data fit to Eq 27) 12middot106
β DMA to in-cell calibration parameter 23
Figure Captions
Figure 1 Schematic diagram showing the components of the model framework to predict
mechanical life of the membrane undergoing hydration cycles
Figure 2 (a) Polymer chain segment constrained by one entanglement and subjected to
the external force F (b) Potential energy of monomer in entanglement before applying
the force (in the left hand side of the Fig 2b) and after applying the force (in the right
hand side of the Fig 2b)
Figure 3 Schematic figure of membrane in fuel cell (counter-flow configuration)
constrained between two bi-polar plates (a) and crack formation (b) The wet fuel exits
from the anode gas channel (top channel) Initially wet air is fed into cathode gas
channel (bottom channel) When cathode side feed gas (air) is switched from wet to dry
cathode side of the membrane dehydrates and attempts to shrink The anode side of the
membrane remains wet and swollen
Figure 4 Fitting Tangs experimental data [7] (triangles) by equation (22) (solid line)
Fitting parameters values are σT=1 MPa and ε0=37sdot10-6
32
Figure 5 Dependence of diffusion coefficient in Nafion membrane on water content λ
(UTRC internal experimental data) There are not available data in range from 52=λ
to 15=λ so linear approximation is used in this region
Figure 6 Model prediction of dependence of RH on time and λ on time at the anode side
at the middle of the membrane and at the cathode side
Figure 7 Model prediction of stress as a function of time under RH cycling at the cathode
and at the anode sides of membrane
Figure 8 Model prediction of stress in quasi-steady-state regime at the cathode side at
the middle of the membrane and at the anode side
Figure 9 Calculated membrane lifetime (the number of cycles to failure) as a function of
minimal RH at the cathode side of membrane Anode side of membrane maintains 100
RH
33
Figures
Fuel cell RH distribution model
Operating conditionsinlet RH inlet Tcycling period
hydrationdehydration induced stress model
σ(t)Damage accrual model
Membrane Mechanical Degradation Model
Membrane propertiesE(RHT) ε∆λ DMA
ε(σNcycT) εcrit
Mechanical life-time
Fuel cell stack design
λ(t)
Figure 1
34
Figure 2
35
Figure 3
σ yy a)
b)
Crack formation
bi - polar plate
bi - polar plate
dry region
stress
y
x
σ yy a)
b)
Crack formation
bi - polar plate
bi - polar plate
dry air
wet fuel
σ yy a)
b)
Crack formation
bi - polar plate
bi - polar plate
dry region
stress
y
x
σ yy a)
b)
Crack formation
bi - polar plate
bi - polar plate
dry air
wet fuel
36
0
50
100
150
200
250
0 1 2 3 4 5 6 7
dud
N
Stress (MPa)
Figure 4
37
0
2
4
6
8
10
12
14
16
0 25 5 75 10 125 15
D1
0^-6
cm
^2s
λ
Figure 5
38
0
3
6
9
12
15
0 5 10 15 20 25 30 35 time s
000
2000
4000
6000
8000
10000
x=0 (Cathode side) x=h2 x=h (Anode side) RH
λ RH
Figure 6
39
-15
-1
-05
0
05
1
15
2
25
0 50 100 150 200 250 300
Time t
Str
ess
MP
a
x=0 (Cathode side)
x=h (Anode side)
Figure 7
40
-15
-1
-05
0
05
1
15
0 5 10 15 20 25 30 35
time s
Str
ess
MP
a
x=0 (Cathode side)x=h2x=h (Anode side)
a)
Figure 8
41
Life-time cycles
100E+05
100E+06
100E+07
100E+08
100E+09
0 02 04 06 08 1RH min
Figure 9

9
framework to predict the life of a membrane subjected to hydration cycles is the focus of
this work
The rest of the paper is organized as follows The extended Eyring model of polymer
viscoelastic deformation is presented in Section II This model is used as a basis of the
membrane stress and damage accrual models rather than as a standalone framework
component A model that predicts stress in the membrane during RH cycling in gas
channels for given membrane mechanical properties is proposed in Section III Next a
mathematical model identifying the functional form that relates the stress cycle to
irreversible damage of the polymer is discussed in Section IV The accrual of such
irreversible damage results in subsequent polymer failure determining the membrane life
subjected to hydration cycling Input parameters of the model are summarized in Section
V Modeling results for a GORE-SELECT membrane and discussion of the results are
presented in Section VI Conclusions are presented in Section VII
II Extended Eyring model for polymer deformation
The time dependent response of the stress to applied strain that takes into account
viscoelastic relaxation in the polymer material is needed for two components of the
degradation model The model of polymer viscoelastic deformation utilized this paper is
based on the assumption that polymer deformation occurs through the transport of
polymer chains through entanglements The early Eyring model [34] is based on a
similar concept The Eyring model calculates the non-linear dependence of polymer
deformation on applied constant stress and is relevant to creep experiments In a creep
experiment a sample is subjected to constant stress lower than the yield stress while the
10
elongation is monitored In this section we briefly describe a new extended Eyring
model that calculates stress relaxation in a stretched constrained polymer under arbitrary
time-dependent controlled deformation
The concept used in the current model is summarized below Following [37] we model a
polymer as a set of entangled chains One chain wraps around another chain and turns
around at the entanglement point In the current model stress is transmitted from one
chain to another through the entanglements which secure the mechanical integrity of the
polymer A Chain Segment (CS) is defined as a fraction of the chain confined between
two subsequent entanglements The macroscopic deformation of the polymer is
calculated from the microscopic elongation of CSs driven by the changing distance
between entanglements The macroscopic stress is calculated from the microscopic
tension acting along the CSs This concept to a large extent is similar to the concept of
interconnected elastic springs in elasticity theory The CS is an analog of the spring the
entanglement is an analog of the point where the springs are attached to each other The
elastic deformation in the current polymer model is achieved through the elastic
deformation of individual CSs which is an analog of the elastic deformation of the
springs in elasticity theory The fundamental difference comes from the fact that the
chains can slip through entanglements changing the equilibrium length of CSs We
assume that slippage of the chain through entanglements causes irreversible elongation of
the polymer
11
To calculate the slip rate as a function of tensile force we consider the dynamics of CS at
the entanglement as indicated in Fig 2a In the absence of the tensile force F the
monomer adjacent to the entanglement is located in the local energy minimum between
two symmetric energy barriers U0 (Fig 2b) The chain slips through the entanglement
when the monomer overcomes one of the energy barriers
In a stressed polymer a tensile force F is induced by stress and acts on the chain (Fig
2a) disturbing the symmetry of the monomerrsquos potential energy well the right barrier
becomes lower by Fa and the left barrier becomes higher byFa where a is the
monomer length This results in preferable displacement of the monomer to the right ie
along the force direction Here we assume that the monomer motion is thermally induced
and assisted by the force F 0UFa ltlt The rate +V at which the monomer jumps to the
right is
minusminus=+
kT
FaUaV 00 exp
2ω
(1)
The rate of monomer displacement to the left minusV is
+minus=minus
kT
FaUaV 00 exp
2ω
(2)
Therefore the average rate of polymer transport through the entanglement is
=kT
FaaV sinhω (3)
Here ω is the frequency of thermally activated jumps of a monomer in the local minimum
in the entangled state
12
minus=kT
U00 expωω (4)
Equation (3) indicates non-linear dependence of the chain slip rate through the
entanglement on the tensile force of the chain Equation (3) describes the conventional
linear dependence of velocity on the force when 1ltltkT
Fa
FkT
aV
ω2
= (5)
Here kT
a ω2
is a mobility of the chain in the entanglement In the opposite limit 1gtgtkT
Fa
equation (3) describes an exponential dependence of velocity on the force
=kT
FaaV exp
2ω
(6)
In a future publication the exponential increase of the chain slip rate through
entanglements with increasing tensile force will be related to the shape of σ-ε curves
observed for polymer materials We speculate that the yield stress is related to crossover
of the chain slip rate from equation (5) to equation (6)
Following the above concept of polymer plastic deformation we express macroscopic
stress σ through microscopic tension force F and the rate of macroscopic deformation
dt
dε through the microscopic chain velocity V predicted by equation (3) The detailed
derivation will be published in a forthcoming paper The final microscopic equation that
relates polymer deformation ε with external stress σ is presented below
minus=
T
T
dt
dE
dt
d
σσ
τσεσ
sinh (7)
13
Here τ is the polymer relaxation time and εσ
partpart=E is Youngrsquos modulus for the polymer
relT V
kT=σ where Vrel is a typical volume of polymer matrix around the entanglement
disturbed by one elementary act of monomer transfer through the entanglement The first
term in right hand part of equation (7) is the rate of the stress change induced by polymer
deformation The second term is rate the plastic relaxation of the stress This term
represents an extension of Maxwellrsquos relaxation rate στ In the case of low stress
Tσσ ltlt hyperbolic sine sinh in the right hand side of equation (7) is expanded to
reproduce the well-known Maxwell equation for polymer viscoelastic deformation
[ ]τσεσ minus=minus
partpart
Et
(8)
The fundamental difference between equation (7) and the Maxwell equation (8) is in the
relaxation terms in the right hand sides of equations (7) and (8) At large stress Tσσ gtgt
the hyperbolic sine asymptotically approaches the exponent leading to a sharp increase
in the stress relaxation rate as the applied stress is increased The detailed derivation of
equation (7) and validation of the model presented above will be published later in a
separate paper
III Membrane Stress Model
In this section we present the model that calculates the stress induced by
hydrationdehydration cycling In a fuel cell stack the membrane electrode assembly
(MEA) is constrained between two bipolar plates (Fig 3a) The membrane can
neitherbend nor change length Fuel is supplied to the MEA through fuel gas channels
14
and oxidant is supplied through oxidant (air) channels as indicated schematically in
Figure 3
To illustrate the mechanism of membrane failure due to RH cycling in the gas channels
we consider the following experiment Initially wet fuel is fed into the anode gas
channel (top channel shown in Figure 3a) and wet air is fed into the cathode gas channel
(bottom channel shown in Figure 3a) Both sides of the membrane are equilibrated with
wet gas until the equilibrium water content λ0 is reached and all mechanical stresses in
the membrane relax to zero The cathode side of the membrane dehydrates and attempts
to shrink when feed gas (air) is switched from wet to dry in the cathode gas channel
Mechanical constraints which prevent the membrane from shrinking cause in-plane
tensile stress σyy in the membrane Tensile stress results in a crack formation on the RH
cycled side of the membrane (Fig 3b) Further propagation of the crack in the through-
plane direction causes membrane mechanical failure
To calculate water distribution in the membrane cross-section at a fixed coordinate y
along the air channel we use RH(yt) the relative humidity distribution function predicted
by the fuel cell model Here we assume that the equilibration time of water in the
membrane is much smaller than RH cycling period in the gas channels Therefore the
water at the membrane interfaces is in thermodynamic equilibrium with vapor in the gas
channels
( ) ( )( )( ) ( )( )tyRHtyLx
tyRHtyx
Aeqm
Ceq
0
λλλλ==
== (9)
15
Here x is the through-membrane coordinate λeq(RH) is the equilibrium water content in
the membrane (an experimentally measured function of RH) RHC is the gas RH in the
cathode gas channel and RHA is the gas RH in the anode gas channel In the current
paper we utilize the following conventional diffusion equation with a water content
dependent diffusion coefficient to calculate water profile in the membrane
( ) 0=
partpart
partpartminus
partpart
xD
xt
λλλ (10)
Here D(λ) is the experimentally measured water diffusion coefficient in the membrane
(see Fig7 in Section VI) Initial conditions for equation (10) can be chosen arbitrarily
because after several cycles the membrane evolves to a new quasi-equilibrium state
governed by cyclic conditions and the initial state becomes irrelevant We chose the
initial conditions ( ) 00 λλ =x Solution of equation (10) with the boundary conditions (9)
gives the water distribution in the membrane λ(xyt) Below we calculate the membrane
stress at the membrane boundary adjacent to the air inlet (fixed coordinate y) where RH
cycling and stress amplitudes are maximal and limit membrane lifetime We start with a
calculation of the linear elastic response of the membrane to small changes in λ and
subsequently model the more general viscoelastic case
The macroscopic state of the membrane is determined by two parameters the membrane
length L0 and water content λ0 We assume that at equilibrium the stress in the
membrane is equal to zero The stress in the membrane can be generated by deviation of
the membrane length from equilibrium 0LLL minus=∆ at constant water content Also the
stress can be generated by deviation of water content from equilibrium
16
( ) ( ) 0 λλλ minus=∆ txtx in the geometrically constrained membrane (at constant length)
By analogy with linear elasticity theory with thermal expansion we calculate the linear
response of the membrane stress to small deviation from equilibrium as follows
( )( )txE yyyy λαεσ ∆minus= (11)
Here 0LLyy ∆=ε and E is the Young modulus of the membrane Swelling coefficient α
determines the length change ∆y of unconstrained (zero σ) membrane caused by the
change of the membrane water content ∆λ λα∆=∆ yy In 1D approximation the local
stress in the membrane depends on the change of the local membrane hydration (λ(xt)-
λ0)
In the membrane stress can be induced by changes in deformation water content and
simultaneous plastic relaxation The total rate of the stress change is the sum of the stress
change rate caused by membrane deformation and the stress change rate caused by the
change of membrane water content
λε
σσσttdt
d yyyyyy
partpart
+part
part= (12)
According to equation (11) the rate of the stress change induced by the change of the rate
of deviation of water content in constrained system with constant deformation and
without plastic relaxation is
dt
dE
tyy λα
σ
ε
∆=part
part (12a)
The second term in equation (12) is presented by equation (7)
17
minus=
partpart
T
Tyyyy
dt
dE
t σσ
τσεσ
λλ
sinh (12b)
Substituting equations (12a) and (12b) into the right hand side of equation (12) we obtain
the equation for the total rate of stress change in the membrane
( ) ( ) ( ) ( )
minus∆+
partpart
=T
yyTyyyy tx
dt
txdE
t
txE
dt
txd
σσ
τσλα
εσ
λ
sinh
(13)
The first term in the right hand side of equation (13) is equal to zero in a constrained
membrane Local water content λ(xt) is calculated by equation (10) with boundary
conditions (9) Equation (13) relates the stress in the membrane with water content in the
membrane for arbitrary RH cycling protocol
Equation (13) was solved numerically with parameters specified in the Table 1 The
calculated stress as a function of time is presented in Figure 7 The results indicate that
the membrane stress becomes a periodic function of time after several cycles if RH is a
periodic function of time To derive an analytical equation for the periodic stress we
utilize the separation of slow variable method The plastic (irreversible) deformation of
the membrane during one cycle is small because the cycling period is much smaller than
the membrane relaxation time Tcyc ltlt τ Therefore we can consider the membrane as an
elastic media during one cycle However the membrane slowly approaches a new
equilibrium state during each cycle After a long time t gtgt τ the membrane reaches the
new state with new equilibrium water content ( )xλ During the cycle λ oscillates below
and above ( )xλ At ( )xλλ = the membrane is not stressed The in-plane stress in the
18
periodical regime is driven by the deviation of λ from ( )xλ and is calculated by
following equation
( ) ( ) ( ) ( )( )xtxtxEtxyy λλασ minusminus= (14)
The stress averaged over time in the periodic regime is equal to zero for any x
Averaging (14) over time and taking advantage of the condition ( ) 0 =tyy txσ we
obtain the following expression for ( )xλ
( ) ( ) ( )( )
t
t
txE
txtxEx
λλ = (15)
Substituting (15) into (14) we obtain the final equation for the stress under periodic RH
cycling
( ) ( ) ( ) ( ) ( )( )
minusminus=
t
tyy txE
txtxEtxtxEtx
λλασ (16)
Substituting ( )txλ calculated from equation (10) with boundary conditions (9) into
equation (16) we calculate cyclic stress in the membrane
IV Damage accrual model
In this section we describe the model that calculates the membrane lifetime as a function
of applied cyclic stress Using the membrane stress model presented in Section III we
calculate the stress profile in the membrane ( )txyy σ for a given water content λ(xt)
We predict the membrane lifetime as a function of membrane stress using the damage
accrual model
19
The typical stress in the membrane under fuel cell operating conditions is much smaller
than the membrane tensile strength Many RH cycles are required to cause substantial
membrane damage However with each cycle the cyclic stress causes small irreversible
elongation ie plastic deformation of the membrane Accumulation of irreversible
elongation in the membrane causes membrane damage after a large number of cycles
Tang et al [7] experimentally studied Nafion111 membrane irreversible elongation under
cyclic stress They observed that irreversible elongation is accumulated over a large
number of cycles and causes damage of the membrane even at relatively small
amplitudes of cyclic stress They also demonstrated that at relatively small stress
σlt4MPa the membrane elongation rate is a linear function of applied stress magnitude
At larger stress amplitudes of about σ=65MPa the elongation rate rapidly increases We
speculate that such nonlinear dependence of elongation rate on stress amplitude is caused
by exponential dependence of the stress relaxation rate on the stress magnitude predicted
by extended Eyring model presented in Section III
The elongation of the membrane subjected to step-like cyclic stress is a function of the
stress amplitude σ and the cycle period Tcyc Applying equation (7) to the membrane
elongation during constant stress hold in one cycle we obtain
=
T
cycT
E
T
σσ
τσ
ε sinh1 (17)
Only a small fraction γ of this elongation is irreversible ie leads to membrane damage
In the current work we assume that γ depends only on cyclic period Tcyc and is
20
independent of σ Also we do not account for self-acceleration of membrane damage ie
we assume that irreversible elongation is proportional to the number of cycles N The
equation for irreversible elongation of the membrane per N cycles is
( )
=
T
NNσσεσε sinh 0 (18)
Here ε0 is
( )τγσ
εE
TT cyccycT=0 (19)
The elongation as a function of the stress and the number of cycles ε(σN) was measured
experimentally using Dynamic Mechanical Analysis (DMA) equipment for two specific
values of stress amplitude Because ε0 is proportional to an unknown parameter γ and
inversely proportional to another unknown parameter τ the lumped parameter ε0 was
used for fitting The model parameters ε0 and σT were fitted to DMA data The
membrane elongation for arbitrary stress amplitude σ was calculated from equation (18)
To validate equation (18) elongation per one stress cycle ε1(σ) was calculated from
Tangs experimental data [7] for Nafion111 membrane and plotted as a function of
applied stress σ see Fig 4 It follows from (18) that
( ) ( )
==
TdN
Nd
σσεσεσε sinh
01 (20)
The experimental data are in good agreement with the prediction of equation (20) with
σT=1 MPa and ε0=37sdot10-6 (Fig 4)
21
Membrane failure occurs after a critical irreversible elongation (damage) εcrit is
accumulated The number of cycles to failure Ncrit is calculated from the following
condition
( ) critcritN εσε =1 (21)
We assume that εcrit does not depend on stress amplitude and frequency and can be
measured once at a specific stress in a DMA test The number of cycles to failure NDMA
in out-off-cell tests is calculated by equation
( )Tcrit
NN
σσsinh0= (22)
( )cyccycT
critcrit
TT
EN
γστε
εε ==
00 (23)
We use N0 as a lumped fitting parameter obtained from a DMA test To obtain the values
of N0 and σT we performed stress cycling for two stress amplitudes σ and fitted the
experimental number of cycles to failure Ncrit by equation (22) Equation (22) predicts
membrane lifetime in a DMA test with arbitrary stress amplitude σ using the obtained
values of N0 and σT from experimental data Analytical dependence of these parameters
on temperature and RH will be published later
Fuel cell conditions under RH cycling differ from DMA test conditions because in DMA
testing the stress is uniformly distributed through the membrane cross-section while in
the cell the stress in the membrane changes substantially from the anode to the cathode
side We incorporated calibration parameter β into the current version of the model in
order to use equation (22) for in-cell membrane lifetime prediction This parameter is
used for renormalization of stress The membrane damage in DMA testing with stress
22
amplitude σ is equivalent to membrane damage in a fuel cell stack when the membrane is
subjected to RH cycling that cause a stress amplitude of βσ
To obtain the calibration parameter β we performed a single RH cycling experiment in a
fuel cell up to membrane failure for particular conditions and measured the experimental
membrane lifetime Ncell Using the membrane stress model we calculated the stress
amplitude σmax for these particular conditions Parameter β is calculated from the
following equation
( )Tcell
NN
σβσ max
0
sinh= (24)
Using the parameters N0 and σT obtained from fitting DMA data by equation (22) and
the parameter β obtained from the in-cell test we predict the in-cell membrane lifetime
under arbitrary RH cycling conditions
V Model parameters
In this section we present input model parameter values and experimental data for a
GORE-SELECTreg membrane in a PRIMEAreg MEA In RH cycling experiments
hydrogen with 100 RH was fed to the anode channel Air fed to the cathode channel
was cycled from RHmax to RHmin with equal time intervals Experimental conditions are
summarized in Table 1 Mechanical properties of GORE-SELECT membranes were
obtained from available literature and summarized in Table 1 DMA tests required for
model calibration were also performed
23
VI Model results
In this section we report the result of modeling of GORE-SELECT membrane damage
and lifetime under in-cell RH cycling conditions The model components ie fuel cell
model membrane stress model and stress accrual model were incorporated into the
MATLAB code The model parameters and test conditions are summarized in Section V
The relative humidity variation in the cathode gas channel during the cycle was
calculated from the fuel cell model and used as the input for the membrane stress model
The calculated relative humidity variation is shown in Fig6 The function with fast
exponential relaxation was used instead of step-wise function for better convergence of
the numerical solution The calculated dependence of λ on time at three points across
the membrane (at the cathode side at the middle of the membrane and at the anode side)
is also shown in Fig6 This dependence is calculated from water diffusion equation in
the membrane (10) with boundary conditions (9) and initial condition ( ) 110 =xλ
Figure 9 indicates that the membrane water content λ(t) follows the humidity cycle RH(t)
There is no time lag because water diffusion time in the membrane sD
htdif 20
2
asymp= is
much smaller than cycling period Tcyc=30s Here h=18 microm is membrane thickness and
D=0510-6 cm2s is the average water diffusion coefficient in the membrane
Water content in the membrane )( txλ is utilized in the membrane stress model to
predict the stress )( txσ distribution in the membrane The model prediction of the
stress in the membrane by equation (13) as a function of time is shown in Fig7 at the
24
cathode and anode sides of the membrane The membrane reaches quasi-steady state
regime after t gtgt τ and stress becomes a periodic function of time oscillating around the
equilibrium value The model prediction for the stress in the periodic regime as a
function of time calculated by equation (16) is shown in Fig8 Maximal stress is
imposed in the region with maximal humidity variation ie at the cathode side of the
membrane At the anode side of the membrane the stress is equal to zero because there is
no humidity cycling One can see that the stress calculated by equation (13) at large time
is in good agreement with the periodic stress shown in Fig8 calculated analytically from
equation (16)
Figures 7 and 8 indicate that after time t larger than relaxation time τ the stress at the
cathode sides oscillates around the equilibrium stress 0=eqσ The membrane at the
cathode side is subjected to tensile stress when ( ) ( )00 =lt xt λλ and to compressive
stress when ( ) ( )00 =gt xt λλ
The maximal value of the stress calculated by the membrane stress model is used in the
damage accrual model to predict membrane lifetime by equation (24) As discussed in
Section IV this equation contains three unknown parameters σT N0 and β Parameters
σT and N0 are calculated by fitting UTC POWER DMA data by equation (22)
Calibration parameter β is calculated from an in-cell lifetime experiment under specific
RH cycling conditions The in-cell membrane stress was calculated by the membrane
stress model
25
Using the model parameters calculated from DMA testing and in-cell RH cycling we
predicted GORE-SELECT membrane lifetime under arbitrary RH cycling conditions
Predicted membrane lifetime (number of cycles to failure) as a function of minimal RH in
the cathode gas channel RHmin is plotted in Fig 9 The anode gas humidity was
assumed to be 100 The maximal RH in the cathode gas channel RHmax of 100 was
also assumed At high RH cycling amplitude (low RHmin) the model predicts exponential
decrease of membrane lifetime with increase of RH cycling amplitude Stress amplitude
is approximately proportional to RH cycling amplitude and the number of cycles to
failure depends exponentially on the stress for large stress according to equation (22)
This results in exponential dependence of the membrane lifetime on RH cycling
amplitude for large values of amplitude (small value of RHmin)
VII Conclusions
A modeling framework was developed that predicts the lifetime of PEM fuel cell
membranes subjected to hydration cycling The developed model predicts membrane
lifetime as a function of RH cycling amplitude and membrane mechanical properties
Membrane failure in the fuel cell is caused by damage accumulation under cyclic stress in
the membrane subjected to cyclic hydrationdehydration A fuel cell membrane is
typically subjected to hydrationdehydration under fuel cell conditions One side of the
membrane dehydrates and attempts to shrink when the feed gas (air) is switched from wet
to dry in the cathode gas channel Mechanical constraints imposed by bipolar plates
prevent the membrane from shrinking This causes in-plane tensile stress in the
membrane Tensile stress causes a crack formation at RH cycled side of the membrane
26
(Fig 3) Further propagation of the crack in the through-plane direction causes
membrane mechanical failure
The modeling framework consists of three components a model of RH distribution in gas
channels a membrane stress model and a damage accrual model Several models of RH
distribution in gas channels are available in literature [8 9 10 11 and 12] and we do not
discuss this model component in the current paper In the current version of the model
we assume equilibrium of water in the membrane with the vapor at the membranegas
interface and use the conventional diffusion equation for calculation of water content in
the membrane bulk with the water diffusion coefficient dependent on water content D(λ)
The membrane stress model calculates the stress in the membrane caused by membrane
cyclic swellingshrinking under RH cycling conditions The local stress in the membrane
is caused by the change in the local hydration level The damage accrual model predicts
the number of cycles to failure for the membrane under applied cyclic stress The input
for the damage accrual model is a maximal stress in the membrane calculated by the
membrane stress model and experimental membrane lifetimes in DMA tests for two
cycling amplitudes The current version of the model also contains one calibration
parameter obtained from an in-cell RH cycling experiment with specific RH cycling
conditions
The model was utilized for in-cell lifetime predictions of GORE-SELECT membranes
The membrane mechanical properties and swelling coefficient were obtained from the
literature DMA testing and in-cell RH cycling were carried out at UTC Power After
27
calibration the model predicts membrane lifetime in fuel cells under arbitrary RH cycling
conditions The calculated membrane lifetime (number of cycles to failure) as a function
of minimal RH in cathode gas channel RHmin is plotted in Fig 9 At high RH cycling
amplitude (low RHmin) the model predicts exponential decrease of membrane lifetime
with increase of RH cycling amplitude Stress amplitude is approximately proportional
to RH cycling amplitude and the number of cycles to failure depends exponentially on
stress for large stress magnitude according to equation (22) This results in exponential
dependence of membrane lifetime on RH cycling amplitude for large values of amplitude
(small value of RHmin)
Acknowledgement
This work was supported by the US Department of Energy under the grant DE-PS36-
08GO98009
References
1 Ho Lee Taehee Kim Woojong Sim Saehoon Kim Byungki Ahn Taewon Lim
and Kwonpil Park Korean J Chem Eng 28(2) 487-491 (2011)
2 Xinyu Huang Roham Solasi Yue Zou Matthew Feshler Kenneth Reifsnider
David Condit Sergei Burlatsky Thomas Madden Journal of Polymer Science
Part B 44 (16) p 2346ndash2357 (2006)
3 Yaliang Tang Anette M Karlsson Michael H Santare Michael Gilbert Simon
Cleghorn William B Johnson Materials Science and Engineering A 425 (2006)
297ndash304
28
4 Yaliang Tang Ahmet Kusoglu Anette M Karlsson Michael H Santare Simon
Cleghorn William B Johnson Journal of Power Sources 175 (2008) 817ndash825
5 A Kusoglu A M Karlsson M H Santare S Cleghorn W B Johnson Journal
of Power Sources 161 987-996 (2006)
6 A Kusoglu A M Karlsson M H Santare Simon Cleghorn W B Johnson
Journal of Power Sources 170 345-358 (2007)
7 Haolin Tang Shen Peikang San Ping Jiang Fang Wang Mu Pan Journal of
Power Sources 170 (2007) 85ndash92
8 T F Fuller and J Newman J Electrochem Soc 140 (5) 1218-1225 (1993)
9 T V Nguyen and R E White J Electrochem Soc 140 (8) 2178-2186 (1993)
10 J S Yi and T V Nguyen J Electrochem Soc 145 (4) 1149-1159 (1998)
11 T E Springer T A Zawodzinski and S Gottesfeld J Electrochem Soc 138 (8)
2334-2342 (1991)
12 A Z Weber R M Darling and J Newman J Electrochem Soc 151 (10)
A1715-A1727 (2004)
13 L Boltzmann Pogg Ann u Chem 7 624 (1876)
14 S Turner Polymer Eng a Sci 6 306 (1966)
15 W N Findley and G Khosla J Appl Phys 26 821 (1955)
16 K van Holde J Polymer Sci 24 417 (1957)
17 T L Smith Trans Soc Rheol 6 61 (1962)
18 H Leaderman Trans Soc Rheol 6 361 (1962)
19 I M Ward and E T Onat J Mech Phys Solids 11 217 (1963)
29
20 Roham Solasi Yue Zou Xinyu Huang Kenneth Reifsnider Mech Time-Depend
Mater 12 15ndash30 (2008)
21 Paul W Majsztrik Andrew B Bocarsly and Jay B Benziger Macromolecules
41 9849-9862 (2008)
22 F Bauer S Denneler M Willert-Porada Journal of Polymer Science Part B
Polymer Physics Vol 43 786ndash795 (2005)
23 Kirt A Page Kevin M Cable and Robert B Moore Macromolecules 2005 38
6472-6484
24 Gierke T D Munn G E Wilson F C J Polym Sci Polym Phys Ed 1981 19
1687ndash1704
25 Hsu W Y Gierke T D J Membrane Sci 1983 13 307ndash326
26 Thomas A Zawodzinski Thomas E Spriner John Davey Roger Jestel Cruz
Lopez Judith Valerio and Shimshon Gottesfeld J Electrochem Soc 140 (7)
1981-1985 (1993)
27 Paul W Majsztrik M Barclay Satterfield Andrew B Bocarsly Jay B Benziger
J Membrane Sci 301 (2007) 93ndash106
28 T Takamatsu M Hashiyama A Eisenberg J Appl Polym Sci 24 (11) (1979)
2199ndash2220
29 DR Morris XD Sun J Appl Polym Sci 50 (8) (1993) 1445ndash1452
30 Shanhai Ge Xuguang Li Baolian Yi and I-Ming Hsing J Electrochem Soc
152 (6) A1149-A1157 (2005)
31 Adam Z Weber and John Newman J Electrochem Soc 151 (2) A311-A325
(2004)
30
32 Adam Z Weber and John Newman Chem Rev 2004 104 4679-4726
33 Timothy J Silverman Jeremy P Meyers and Joseph J Beaman J Electrochem
Soc 157 (10) B1376-B1381 (2010)
34 Halsey G White HJ Eyring H Text Res J 1945 v 15 p 295
35 M Gummalla VV Atrazhev AN Varyukhin and SF Burlatsky To be
published
36 P Choi and R Datta J Electrochem Soc 150 E601 (2003)
37 P de Gennes Scaling Concepts in Polymer Physics Cornell University Press
List of Tables
Table 1 Model parameters and experimental conditions
Parameter Description ValueSource
Operational conditions
Tcyc RH cycling time period 30 sec
RHmax Maximum relative humidity in cathode channel 100
RHmin Minimum relative humidity in cathode channel 10
T Cell temperature 78ordmC
Membrane properties
E(RHT) Youngrsquos modulus of the membrane [4]
)(aλ Membrane water content as a function of vapor
activity [mol H2Omol SO3] [36]
)(λD Diffusion coefficient of water in the membrane Fig5
31
α Dimension change coefficient 0004 (data from [4])
Tσ Fitting parameter (internal data fit to Eq 27) 17 MPa
0N Fitting parameter (internal data fit to Eq 27) 12middot106
β DMA to in-cell calibration parameter 23
Figure Captions
Figure 1 Schematic diagram showing the components of the model framework to predict
mechanical life of the membrane undergoing hydration cycles
Figure 2 (a) Polymer chain segment constrained by one entanglement and subjected to
the external force F (b) Potential energy of monomer in entanglement before applying
the force (in the left hand side of the Fig 2b) and after applying the force (in the right
hand side of the Fig 2b)
Figure 3 Schematic figure of membrane in fuel cell (counter-flow configuration)
constrained between two bi-polar plates (a) and crack formation (b) The wet fuel exits
from the anode gas channel (top channel) Initially wet air is fed into cathode gas
channel (bottom channel) When cathode side feed gas (air) is switched from wet to dry
cathode side of the membrane dehydrates and attempts to shrink The anode side of the
membrane remains wet and swollen
Figure 4 Fitting Tangs experimental data [7] (triangles) by equation (22) (solid line)
Fitting parameters values are σT=1 MPa and ε0=37sdot10-6
32
Figure 5 Dependence of diffusion coefficient in Nafion membrane on water content λ
(UTRC internal experimental data) There are not available data in range from 52=λ
to 15=λ so linear approximation is used in this region
Figure 6 Model prediction of dependence of RH on time and λ on time at the anode side
at the middle of the membrane and at the cathode side
Figure 7 Model prediction of stress as a function of time under RH cycling at the cathode
and at the anode sides of membrane
Figure 8 Model prediction of stress in quasi-steady-state regime at the cathode side at
the middle of the membrane and at the anode side
Figure 9 Calculated membrane lifetime (the number of cycles to failure) as a function of
minimal RH at the cathode side of membrane Anode side of membrane maintains 100
RH
33
Figures
Fuel cell RH distribution model
Operating conditionsinlet RH inlet Tcycling period
hydrationdehydration induced stress model
σ(t)Damage accrual model
Membrane Mechanical Degradation Model
Membrane propertiesE(RHT) ε∆λ DMA
ε(σNcycT) εcrit
Mechanical life-time
Fuel cell stack design
λ(t)
Figure 1
34
Figure 2
35
Figure 3
σ yy a)
b)
Crack formation
bi - polar plate
bi - polar plate
dry region
stress
y
x
σ yy a)
b)
Crack formation
bi - polar plate
bi - polar plate
dry air
wet fuel
σ yy a)
b)
Crack formation
bi - polar plate
bi - polar plate
dry region
stress
y
x
σ yy a)
b)
Crack formation
bi - polar plate
bi - polar plate
dry air
wet fuel
36
0
50
100
150
200
250
0 1 2 3 4 5 6 7
dud
N
Stress (MPa)
Figure 4
37
0
2
4
6
8
10
12
14
16
0 25 5 75 10 125 15
D1
0^-6
cm
^2s
λ
Figure 5
38
0
3
6
9
12
15
0 5 10 15 20 25 30 35 time s
000
2000
4000
6000
8000
10000
x=0 (Cathode side) x=h2 x=h (Anode side) RH
λ RH
Figure 6
39
-15
-1
-05
0
05
1
15
2
25
0 50 100 150 200 250 300
Time t
Str
ess
MP
a
x=0 (Cathode side)
x=h (Anode side)
Figure 7
40
-15
-1
-05
0
05
1
15
0 5 10 15 20 25 30 35
time s
Str
ess
MP
a
x=0 (Cathode side)x=h2x=h (Anode side)
a)
Figure 8
41
Life-time cycles
100E+05
100E+06
100E+07
100E+08
100E+09
0 02 04 06 08 1RH min
Figure 9

10
elongation is monitored In this section we briefly describe a new extended Eyring
model that calculates stress relaxation in a stretched constrained polymer under arbitrary
time-dependent controlled deformation
The concept used in the current model is summarized below Following [37] we model a
polymer as a set of entangled chains One chain wraps around another chain and turns
around at the entanglement point In the current model stress is transmitted from one
chain to another through the entanglements which secure the mechanical integrity of the
polymer A Chain Segment (CS) is defined as a fraction of the chain confined between
two subsequent entanglements The macroscopic deformation of the polymer is
calculated from the microscopic elongation of CSs driven by the changing distance
between entanglements The macroscopic stress is calculated from the microscopic
tension acting along the CSs This concept to a large extent is similar to the concept of
interconnected elastic springs in elasticity theory The CS is an analog of the spring the
entanglement is an analog of the point where the springs are attached to each other The
elastic deformation in the current polymer model is achieved through the elastic
deformation of individual CSs which is an analog of the elastic deformation of the
springs in elasticity theory The fundamental difference comes from the fact that the
chains can slip through entanglements changing the equilibrium length of CSs We
assume that slippage of the chain through entanglements causes irreversible elongation of
the polymer
11
To calculate the slip rate as a function of tensile force we consider the dynamics of CS at
the entanglement as indicated in Fig 2a In the absence of the tensile force F the
monomer adjacent to the entanglement is located in the local energy minimum between
two symmetric energy barriers U0 (Fig 2b) The chain slips through the entanglement
when the monomer overcomes one of the energy barriers
In a stressed polymer a tensile force F is induced by stress and acts on the chain (Fig
2a) disturbing the symmetry of the monomerrsquos potential energy well the right barrier
becomes lower by Fa and the left barrier becomes higher byFa where a is the
monomer length This results in preferable displacement of the monomer to the right ie
along the force direction Here we assume that the monomer motion is thermally induced
and assisted by the force F 0UFa ltlt The rate +V at which the monomer jumps to the
right is
minusminus=+
kT
FaUaV 00 exp
2ω
(1)
The rate of monomer displacement to the left minusV is
+minus=minus
kT
FaUaV 00 exp
2ω
(2)
Therefore the average rate of polymer transport through the entanglement is
=kT
FaaV sinhω (3)
Here ω is the frequency of thermally activated jumps of a monomer in the local minimum
in the entangled state
12
minus=kT
U00 expωω (4)
Equation (3) indicates non-linear dependence of the chain slip rate through the
entanglement on the tensile force of the chain Equation (3) describes the conventional
linear dependence of velocity on the force when 1ltltkT
Fa
FkT
aV
ω2
= (5)
Here kT
a ω2
is a mobility of the chain in the entanglement In the opposite limit 1gtgtkT
Fa
equation (3) describes an exponential dependence of velocity on the force
=kT
FaaV exp
2ω
(6)
In a future publication the exponential increase of the chain slip rate through
entanglements with increasing tensile force will be related to the shape of σ-ε curves
observed for polymer materials We speculate that the yield stress is related to crossover
of the chain slip rate from equation (5) to equation (6)
Following the above concept of polymer plastic deformation we express macroscopic
stress σ through microscopic tension force F and the rate of macroscopic deformation
dt
dε through the microscopic chain velocity V predicted by equation (3) The detailed
derivation will be published in a forthcoming paper The final microscopic equation that
relates polymer deformation ε with external stress σ is presented below
minus=
T
T
dt
dE
dt
d
σσ
τσεσ
sinh (7)
13
Here τ is the polymer relaxation time and εσ
partpart=E is Youngrsquos modulus for the polymer
relT V
kT=σ where Vrel is a typical volume of polymer matrix around the entanglement
disturbed by one elementary act of monomer transfer through the entanglement The first
term in right hand part of equation (7) is the rate of the stress change induced by polymer
deformation The second term is rate the plastic relaxation of the stress This term
represents an extension of Maxwellrsquos relaxation rate στ In the case of low stress
Tσσ ltlt hyperbolic sine sinh in the right hand side of equation (7) is expanded to
reproduce the well-known Maxwell equation for polymer viscoelastic deformation
[ ]τσεσ minus=minus
partpart
Et
(8)
The fundamental difference between equation (7) and the Maxwell equation (8) is in the
relaxation terms in the right hand sides of equations (7) and (8) At large stress Tσσ gtgt
the hyperbolic sine asymptotically approaches the exponent leading to a sharp increase
in the stress relaxation rate as the applied stress is increased The detailed derivation of
equation (7) and validation of the model presented above will be published later in a
separate paper
III Membrane Stress Model
In this section we present the model that calculates the stress induced by
hydrationdehydration cycling In a fuel cell stack the membrane electrode assembly
(MEA) is constrained between two bipolar plates (Fig 3a) The membrane can
neitherbend nor change length Fuel is supplied to the MEA through fuel gas channels
14
and oxidant is supplied through oxidant (air) channels as indicated schematically in
Figure 3
To illustrate the mechanism of membrane failure due to RH cycling in the gas channels
we consider the following experiment Initially wet fuel is fed into the anode gas
channel (top channel shown in Figure 3a) and wet air is fed into the cathode gas channel
(bottom channel shown in Figure 3a) Both sides of the membrane are equilibrated with
wet gas until the equilibrium water content λ0 is reached and all mechanical stresses in
the membrane relax to zero The cathode side of the membrane dehydrates and attempts
to shrink when feed gas (air) is switched from wet to dry in the cathode gas channel
Mechanical constraints which prevent the membrane from shrinking cause in-plane
tensile stress σyy in the membrane Tensile stress results in a crack formation on the RH
cycled side of the membrane (Fig 3b) Further propagation of the crack in the through-
plane direction causes membrane mechanical failure
To calculate water distribution in the membrane cross-section at a fixed coordinate y
along the air channel we use RH(yt) the relative humidity distribution function predicted
by the fuel cell model Here we assume that the equilibration time of water in the
membrane is much smaller than RH cycling period in the gas channels Therefore the
water at the membrane interfaces is in thermodynamic equilibrium with vapor in the gas
channels
( ) ( )( )( ) ( )( )tyRHtyLx
tyRHtyx
Aeqm
Ceq
0
λλλλ==
== (9)
15
Here x is the through-membrane coordinate λeq(RH) is the equilibrium water content in
the membrane (an experimentally measured function of RH) RHC is the gas RH in the
cathode gas channel and RHA is the gas RH in the anode gas channel In the current
paper we utilize the following conventional diffusion equation with a water content
dependent diffusion coefficient to calculate water profile in the membrane
( ) 0=
partpart
partpartminus
partpart
xD
xt
λλλ (10)
Here D(λ) is the experimentally measured water diffusion coefficient in the membrane
(see Fig7 in Section VI) Initial conditions for equation (10) can be chosen arbitrarily
because after several cycles the membrane evolves to a new quasi-equilibrium state
governed by cyclic conditions and the initial state becomes irrelevant We chose the
initial conditions ( ) 00 λλ =x Solution of equation (10) with the boundary conditions (9)
gives the water distribution in the membrane λ(xyt) Below we calculate the membrane
stress at the membrane boundary adjacent to the air inlet (fixed coordinate y) where RH
cycling and stress amplitudes are maximal and limit membrane lifetime We start with a
calculation of the linear elastic response of the membrane to small changes in λ and
subsequently model the more general viscoelastic case
The macroscopic state of the membrane is determined by two parameters the membrane
length L0 and water content λ0 We assume that at equilibrium the stress in the
membrane is equal to zero The stress in the membrane can be generated by deviation of
the membrane length from equilibrium 0LLL minus=∆ at constant water content Also the
stress can be generated by deviation of water content from equilibrium
16
( ) ( ) 0 λλλ minus=∆ txtx in the geometrically constrained membrane (at constant length)
By analogy with linear elasticity theory with thermal expansion we calculate the linear
response of the membrane stress to small deviation from equilibrium as follows
( )( )txE yyyy λαεσ ∆minus= (11)
Here 0LLyy ∆=ε and E is the Young modulus of the membrane Swelling coefficient α
determines the length change ∆y of unconstrained (zero σ) membrane caused by the
change of the membrane water content ∆λ λα∆=∆ yy In 1D approximation the local
stress in the membrane depends on the change of the local membrane hydration (λ(xt)-
λ0)
In the membrane stress can be induced by changes in deformation water content and
simultaneous plastic relaxation The total rate of the stress change is the sum of the stress
change rate caused by membrane deformation and the stress change rate caused by the
change of membrane water content
λε
σσσttdt
d yyyyyy
partpart
+part
part= (12)
According to equation (11) the rate of the stress change induced by the change of the rate
of deviation of water content in constrained system with constant deformation and
without plastic relaxation is
dt
dE
tyy λα
σ
ε
∆=part
part (12a)
The second term in equation (12) is presented by equation (7)
17
minus=
partpart
T
Tyyyy
dt
dE
t σσ
τσεσ
λλ
sinh (12b)
Substituting equations (12a) and (12b) into the right hand side of equation (12) we obtain
the equation for the total rate of stress change in the membrane
( ) ( ) ( ) ( )
minus∆+
partpart
=T
yyTyyyy tx
dt
txdE
t
txE
dt
txd
σσ
τσλα
εσ
λ
sinh
(13)
The first term in the right hand side of equation (13) is equal to zero in a constrained
membrane Local water content λ(xt) is calculated by equation (10) with boundary
conditions (9) Equation (13) relates the stress in the membrane with water content in the
membrane for arbitrary RH cycling protocol
Equation (13) was solved numerically with parameters specified in the Table 1 The
calculated stress as a function of time is presented in Figure 7 The results indicate that
the membrane stress becomes a periodic function of time after several cycles if RH is a
periodic function of time To derive an analytical equation for the periodic stress we
utilize the separation of slow variable method The plastic (irreversible) deformation of
the membrane during one cycle is small because the cycling period is much smaller than
the membrane relaxation time Tcyc ltlt τ Therefore we can consider the membrane as an
elastic media during one cycle However the membrane slowly approaches a new
equilibrium state during each cycle After a long time t gtgt τ the membrane reaches the
new state with new equilibrium water content ( )xλ During the cycle λ oscillates below
and above ( )xλ At ( )xλλ = the membrane is not stressed The in-plane stress in the
18
periodical regime is driven by the deviation of λ from ( )xλ and is calculated by
following equation
( ) ( ) ( ) ( )( )xtxtxEtxyy λλασ minusminus= (14)
The stress averaged over time in the periodic regime is equal to zero for any x
Averaging (14) over time and taking advantage of the condition ( ) 0 =tyy txσ we
obtain the following expression for ( )xλ
( ) ( ) ( )( )
t
t
txE
txtxEx
λλ = (15)
Substituting (15) into (14) we obtain the final equation for the stress under periodic RH
cycling
( ) ( ) ( ) ( ) ( )( )
minusminus=
t
tyy txE
txtxEtxtxEtx
λλασ (16)
Substituting ( )txλ calculated from equation (10) with boundary conditions (9) into
equation (16) we calculate cyclic stress in the membrane
IV Damage accrual model
In this section we describe the model that calculates the membrane lifetime as a function
of applied cyclic stress Using the membrane stress model presented in Section III we
calculate the stress profile in the membrane ( )txyy σ for a given water content λ(xt)
We predict the membrane lifetime as a function of membrane stress using the damage
accrual model
19
The typical stress in the membrane under fuel cell operating conditions is much smaller
than the membrane tensile strength Many RH cycles are required to cause substantial
membrane damage However with each cycle the cyclic stress causes small irreversible
elongation ie plastic deformation of the membrane Accumulation of irreversible
elongation in the membrane causes membrane damage after a large number of cycles
Tang et al [7] experimentally studied Nafion111 membrane irreversible elongation under
cyclic stress They observed that irreversible elongation is accumulated over a large
number of cycles and causes damage of the membrane even at relatively small
amplitudes of cyclic stress They also demonstrated that at relatively small stress
σlt4MPa the membrane elongation rate is a linear function of applied stress magnitude
At larger stress amplitudes of about σ=65MPa the elongation rate rapidly increases We
speculate that such nonlinear dependence of elongation rate on stress amplitude is caused
by exponential dependence of the stress relaxation rate on the stress magnitude predicted
by extended Eyring model presented in Section III
The elongation of the membrane subjected to step-like cyclic stress is a function of the
stress amplitude σ and the cycle period Tcyc Applying equation (7) to the membrane
elongation during constant stress hold in one cycle we obtain
=
T
cycT
E
T
σσ
τσ
ε sinh1 (17)
Only a small fraction γ of this elongation is irreversible ie leads to membrane damage
In the current work we assume that γ depends only on cyclic period Tcyc and is
20
independent of σ Also we do not account for self-acceleration of membrane damage ie
we assume that irreversible elongation is proportional to the number of cycles N The
equation for irreversible elongation of the membrane per N cycles is
( )
=
T
NNσσεσε sinh 0 (18)
Here ε0 is
( )τγσ
εE
TT cyccycT=0 (19)
The elongation as a function of the stress and the number of cycles ε(σN) was measured
experimentally using Dynamic Mechanical Analysis (DMA) equipment for two specific
values of stress amplitude Because ε0 is proportional to an unknown parameter γ and
inversely proportional to another unknown parameter τ the lumped parameter ε0 was
used for fitting The model parameters ε0 and σT were fitted to DMA data The
membrane elongation for arbitrary stress amplitude σ was calculated from equation (18)
To validate equation (18) elongation per one stress cycle ε1(σ) was calculated from
Tangs experimental data [7] for Nafion111 membrane and plotted as a function of
applied stress σ see Fig 4 It follows from (18) that
( ) ( )
==
TdN
Nd
σσεσεσε sinh
01 (20)
The experimental data are in good agreement with the prediction of equation (20) with
σT=1 MPa and ε0=37sdot10-6 (Fig 4)
21
Membrane failure occurs after a critical irreversible elongation (damage) εcrit is
accumulated The number of cycles to failure Ncrit is calculated from the following
condition
( ) critcritN εσε =1 (21)
We assume that εcrit does not depend on stress amplitude and frequency and can be
measured once at a specific stress in a DMA test The number of cycles to failure NDMA
in out-off-cell tests is calculated by equation
( )Tcrit
NN
σσsinh0= (22)
( )cyccycT
critcrit
TT
EN
γστε
εε ==
00 (23)
We use N0 as a lumped fitting parameter obtained from a DMA test To obtain the values
of N0 and σT we performed stress cycling for two stress amplitudes σ and fitted the
experimental number of cycles to failure Ncrit by equation (22) Equation (22) predicts
membrane lifetime in a DMA test with arbitrary stress amplitude σ using the obtained
values of N0 and σT from experimental data Analytical dependence of these parameters
on temperature and RH will be published later
Fuel cell conditions under RH cycling differ from DMA test conditions because in DMA
testing the stress is uniformly distributed through the membrane cross-section while in
the cell the stress in the membrane changes substantially from the anode to the cathode
side We incorporated calibration parameter β into the current version of the model in
order to use equation (22) for in-cell membrane lifetime prediction This parameter is
used for renormalization of stress The membrane damage in DMA testing with stress
22
amplitude σ is equivalent to membrane damage in a fuel cell stack when the membrane is
subjected to RH cycling that cause a stress amplitude of βσ
To obtain the calibration parameter β we performed a single RH cycling experiment in a
fuel cell up to membrane failure for particular conditions and measured the experimental
membrane lifetime Ncell Using the membrane stress model we calculated the stress
amplitude σmax for these particular conditions Parameter β is calculated from the
following equation
( )Tcell
NN
σβσ max
0
sinh= (24)
Using the parameters N0 and σT obtained from fitting DMA data by equation (22) and
the parameter β obtained from the in-cell test we predict the in-cell membrane lifetime
under arbitrary RH cycling conditions
V Model parameters
In this section we present input model parameter values and experimental data for a
GORE-SELECTreg membrane in a PRIMEAreg MEA In RH cycling experiments
hydrogen with 100 RH was fed to the anode channel Air fed to the cathode channel
was cycled from RHmax to RHmin with equal time intervals Experimental conditions are
summarized in Table 1 Mechanical properties of GORE-SELECT membranes were
obtained from available literature and summarized in Table 1 DMA tests required for
model calibration were also performed
23
VI Model results
In this section we report the result of modeling of GORE-SELECT membrane damage
and lifetime under in-cell RH cycling conditions The model components ie fuel cell
model membrane stress model and stress accrual model were incorporated into the
MATLAB code The model parameters and test conditions are summarized in Section V
The relative humidity variation in the cathode gas channel during the cycle was
calculated from the fuel cell model and used as the input for the membrane stress model
The calculated relative humidity variation is shown in Fig6 The function with fast
exponential relaxation was used instead of step-wise function for better convergence of
the numerical solution The calculated dependence of λ on time at three points across
the membrane (at the cathode side at the middle of the membrane and at the anode side)
is also shown in Fig6 This dependence is calculated from water diffusion equation in
the membrane (10) with boundary conditions (9) and initial condition ( ) 110 =xλ
Figure 9 indicates that the membrane water content λ(t) follows the humidity cycle RH(t)
There is no time lag because water diffusion time in the membrane sD
htdif 20
2
asymp= is
much smaller than cycling period Tcyc=30s Here h=18 microm is membrane thickness and
D=0510-6 cm2s is the average water diffusion coefficient in the membrane
Water content in the membrane )( txλ is utilized in the membrane stress model to
predict the stress )( txσ distribution in the membrane The model prediction of the
stress in the membrane by equation (13) as a function of time is shown in Fig7 at the
24
cathode and anode sides of the membrane The membrane reaches quasi-steady state
regime after t gtgt τ and stress becomes a periodic function of time oscillating around the
equilibrium value The model prediction for the stress in the periodic regime as a
function of time calculated by equation (16) is shown in Fig8 Maximal stress is
imposed in the region with maximal humidity variation ie at the cathode side of the
membrane At the anode side of the membrane the stress is equal to zero because there is
no humidity cycling One can see that the stress calculated by equation (13) at large time
is in good agreement with the periodic stress shown in Fig8 calculated analytically from
equation (16)
Figures 7 and 8 indicate that after time t larger than relaxation time τ the stress at the
cathode sides oscillates around the equilibrium stress 0=eqσ The membrane at the
cathode side is subjected to tensile stress when ( ) ( )00 =lt xt λλ and to compressive
stress when ( ) ( )00 =gt xt λλ
The maximal value of the stress calculated by the membrane stress model is used in the
damage accrual model to predict membrane lifetime by equation (24) As discussed in
Section IV this equation contains three unknown parameters σT N0 and β Parameters
σT and N0 are calculated by fitting UTC POWER DMA data by equation (22)
Calibration parameter β is calculated from an in-cell lifetime experiment under specific
RH cycling conditions The in-cell membrane stress was calculated by the membrane
stress model
25
Using the model parameters calculated from DMA testing and in-cell RH cycling we
predicted GORE-SELECT membrane lifetime under arbitrary RH cycling conditions
Predicted membrane lifetime (number of cycles to failure) as a function of minimal RH in
the cathode gas channel RHmin is plotted in Fig 9 The anode gas humidity was
assumed to be 100 The maximal RH in the cathode gas channel RHmax of 100 was
also assumed At high RH cycling amplitude (low RHmin) the model predicts exponential
decrease of membrane lifetime with increase of RH cycling amplitude Stress amplitude
is approximately proportional to RH cycling amplitude and the number of cycles to
failure depends exponentially on the stress for large stress according to equation (22)
This results in exponential dependence of the membrane lifetime on RH cycling
amplitude for large values of amplitude (small value of RHmin)
VII Conclusions
A modeling framework was developed that predicts the lifetime of PEM fuel cell
membranes subjected to hydration cycling The developed model predicts membrane
lifetime as a function of RH cycling amplitude and membrane mechanical properties
Membrane failure in the fuel cell is caused by damage accumulation under cyclic stress in
the membrane subjected to cyclic hydrationdehydration A fuel cell membrane is
typically subjected to hydrationdehydration under fuel cell conditions One side of the
membrane dehydrates and attempts to shrink when the feed gas (air) is switched from wet
to dry in the cathode gas channel Mechanical constraints imposed by bipolar plates
prevent the membrane from shrinking This causes in-plane tensile stress in the
membrane Tensile stress causes a crack formation at RH cycled side of the membrane
26
(Fig 3) Further propagation of the crack in the through-plane direction causes
membrane mechanical failure
The modeling framework consists of three components a model of RH distribution in gas
channels a membrane stress model and a damage accrual model Several models of RH
distribution in gas channels are available in literature [8 9 10 11 and 12] and we do not
discuss this model component in the current paper In the current version of the model
we assume equilibrium of water in the membrane with the vapor at the membranegas
interface and use the conventional diffusion equation for calculation of water content in
the membrane bulk with the water diffusion coefficient dependent on water content D(λ)
The membrane stress model calculates the stress in the membrane caused by membrane
cyclic swellingshrinking under RH cycling conditions The local stress in the membrane
is caused by the change in the local hydration level The damage accrual model predicts
the number of cycles to failure for the membrane under applied cyclic stress The input
for the damage accrual model is a maximal stress in the membrane calculated by the
membrane stress model and experimental membrane lifetimes in DMA tests for two
cycling amplitudes The current version of the model also contains one calibration
parameter obtained from an in-cell RH cycling experiment with specific RH cycling
conditions
The model was utilized for in-cell lifetime predictions of GORE-SELECT membranes
The membrane mechanical properties and swelling coefficient were obtained from the
literature DMA testing and in-cell RH cycling were carried out at UTC Power After
27
calibration the model predicts membrane lifetime in fuel cells under arbitrary RH cycling
conditions The calculated membrane lifetime (number of cycles to failure) as a function
of minimal RH in cathode gas channel RHmin is plotted in Fig 9 At high RH cycling
amplitude (low RHmin) the model predicts exponential decrease of membrane lifetime
with increase of RH cycling amplitude Stress amplitude is approximately proportional
to RH cycling amplitude and the number of cycles to failure depends exponentially on
stress for large stress magnitude according to equation (22) This results in exponential
dependence of membrane lifetime on RH cycling amplitude for large values of amplitude
(small value of RHmin)
Acknowledgement
This work was supported by the US Department of Energy under the grant DE-PS36-
08GO98009
References
1 Ho Lee Taehee Kim Woojong Sim Saehoon Kim Byungki Ahn Taewon Lim
and Kwonpil Park Korean J Chem Eng 28(2) 487-491 (2011)
2 Xinyu Huang Roham Solasi Yue Zou Matthew Feshler Kenneth Reifsnider
David Condit Sergei Burlatsky Thomas Madden Journal of Polymer Science
Part B 44 (16) p 2346ndash2357 (2006)
3 Yaliang Tang Anette M Karlsson Michael H Santare Michael Gilbert Simon
Cleghorn William B Johnson Materials Science and Engineering A 425 (2006)
297ndash304
28
4 Yaliang Tang Ahmet Kusoglu Anette M Karlsson Michael H Santare Simon
Cleghorn William B Johnson Journal of Power Sources 175 (2008) 817ndash825
5 A Kusoglu A M Karlsson M H Santare S Cleghorn W B Johnson Journal
of Power Sources 161 987-996 (2006)
6 A Kusoglu A M Karlsson M H Santare Simon Cleghorn W B Johnson
Journal of Power Sources 170 345-358 (2007)
7 Haolin Tang Shen Peikang San Ping Jiang Fang Wang Mu Pan Journal of
Power Sources 170 (2007) 85ndash92
8 T F Fuller and J Newman J Electrochem Soc 140 (5) 1218-1225 (1993)
9 T V Nguyen and R E White J Electrochem Soc 140 (8) 2178-2186 (1993)
10 J S Yi and T V Nguyen J Electrochem Soc 145 (4) 1149-1159 (1998)
11 T E Springer T A Zawodzinski and S Gottesfeld J Electrochem Soc 138 (8)
2334-2342 (1991)
12 A Z Weber R M Darling and J Newman J Electrochem Soc 151 (10)
A1715-A1727 (2004)
13 L Boltzmann Pogg Ann u Chem 7 624 (1876)
14 S Turner Polymer Eng a Sci 6 306 (1966)
15 W N Findley and G Khosla J Appl Phys 26 821 (1955)
16 K van Holde J Polymer Sci 24 417 (1957)
17 T L Smith Trans Soc Rheol 6 61 (1962)
18 H Leaderman Trans Soc Rheol 6 361 (1962)
19 I M Ward and E T Onat J Mech Phys Solids 11 217 (1963)
29
20 Roham Solasi Yue Zou Xinyu Huang Kenneth Reifsnider Mech Time-Depend
Mater 12 15ndash30 (2008)
21 Paul W Majsztrik Andrew B Bocarsly and Jay B Benziger Macromolecules
41 9849-9862 (2008)
22 F Bauer S Denneler M Willert-Porada Journal of Polymer Science Part B
Polymer Physics Vol 43 786ndash795 (2005)
23 Kirt A Page Kevin M Cable and Robert B Moore Macromolecules 2005 38
6472-6484
24 Gierke T D Munn G E Wilson F C J Polym Sci Polym Phys Ed 1981 19
1687ndash1704
25 Hsu W Y Gierke T D J Membrane Sci 1983 13 307ndash326
26 Thomas A Zawodzinski Thomas E Spriner John Davey Roger Jestel Cruz
Lopez Judith Valerio and Shimshon Gottesfeld J Electrochem Soc 140 (7)
1981-1985 (1993)
27 Paul W Majsztrik M Barclay Satterfield Andrew B Bocarsly Jay B Benziger
J Membrane Sci 301 (2007) 93ndash106
28 T Takamatsu M Hashiyama A Eisenberg J Appl Polym Sci 24 (11) (1979)
2199ndash2220
29 DR Morris XD Sun J Appl Polym Sci 50 (8) (1993) 1445ndash1452
30 Shanhai Ge Xuguang Li Baolian Yi and I-Ming Hsing J Electrochem Soc
152 (6) A1149-A1157 (2005)
31 Adam Z Weber and John Newman J Electrochem Soc 151 (2) A311-A325
(2004)
30
32 Adam Z Weber and John Newman Chem Rev 2004 104 4679-4726
33 Timothy J Silverman Jeremy P Meyers and Joseph J Beaman J Electrochem
Soc 157 (10) B1376-B1381 (2010)
34 Halsey G White HJ Eyring H Text Res J 1945 v 15 p 295
35 M Gummalla VV Atrazhev AN Varyukhin and SF Burlatsky To be
published
36 P Choi and R Datta J Electrochem Soc 150 E601 (2003)
37 P de Gennes Scaling Concepts in Polymer Physics Cornell University Press
List of Tables
Table 1 Model parameters and experimental conditions
Parameter Description ValueSource
Operational conditions
Tcyc RH cycling time period 30 sec
RHmax Maximum relative humidity in cathode channel 100
RHmin Minimum relative humidity in cathode channel 10
T Cell temperature 78ordmC
Membrane properties
E(RHT) Youngrsquos modulus of the membrane [4]
)(aλ Membrane water content as a function of vapor
activity [mol H2Omol SO3] [36]
)(λD Diffusion coefficient of water in the membrane Fig5
31
α Dimension change coefficient 0004 (data from [4])
Tσ Fitting parameter (internal data fit to Eq 27) 17 MPa
0N Fitting parameter (internal data fit to Eq 27) 12middot106
β DMA to in-cell calibration parameter 23
Figure Captions
Figure 1 Schematic diagram showing the components of the model framework to predict
mechanical life of the membrane undergoing hydration cycles
Figure 2 (a) Polymer chain segment constrained by one entanglement and subjected to
the external force F (b) Potential energy of monomer in entanglement before applying
the force (in the left hand side of the Fig 2b) and after applying the force (in the right
hand side of the Fig 2b)
Figure 3 Schematic figure of membrane in fuel cell (counter-flow configuration)
constrained between two bi-polar plates (a) and crack formation (b) The wet fuel exits
from the anode gas channel (top channel) Initially wet air is fed into cathode gas
channel (bottom channel) When cathode side feed gas (air) is switched from wet to dry
cathode side of the membrane dehydrates and attempts to shrink The anode side of the
membrane remains wet and swollen
Figure 4 Fitting Tangs experimental data [7] (triangles) by equation (22) (solid line)
Fitting parameters values are σT=1 MPa and ε0=37sdot10-6
32
Figure 5 Dependence of diffusion coefficient in Nafion membrane on water content λ
(UTRC internal experimental data) There are not available data in range from 52=λ
to 15=λ so linear approximation is used in this region
Figure 6 Model prediction of dependence of RH on time and λ on time at the anode side
at the middle of the membrane and at the cathode side
Figure 7 Model prediction of stress as a function of time under RH cycling at the cathode
and at the anode sides of membrane
Figure 8 Model prediction of stress in quasi-steady-state regime at the cathode side at
the middle of the membrane and at the anode side
Figure 9 Calculated membrane lifetime (the number of cycles to failure) as a function of
minimal RH at the cathode side of membrane Anode side of membrane maintains 100
RH
33
Figures
Fuel cell RH distribution model
Operating conditionsinlet RH inlet Tcycling period
hydrationdehydration induced stress model
σ(t)Damage accrual model
Membrane Mechanical Degradation Model
Membrane propertiesE(RHT) ε∆λ DMA
ε(σNcycT) εcrit
Mechanical life-time
Fuel cell stack design
λ(t)
Figure 1
34
Figure 2
35
Figure 3
σ yy a)
b)
Crack formation
bi - polar plate
bi - polar plate
dry region
stress
y
x
σ yy a)
b)
Crack formation
bi - polar plate
bi - polar plate
dry air
wet fuel
σ yy a)
b)
Crack formation
bi - polar plate
bi - polar plate
dry region
stress
y
x
σ yy a)
b)
Crack formation
bi - polar plate
bi - polar plate
dry air
wet fuel
36
0
50
100
150
200
250
0 1 2 3 4 5 6 7
dud
N
Stress (MPa)
Figure 4
37
0
2
4
6
8
10
12
14
16
0 25 5 75 10 125 15
D1
0^-6
cm
^2s
λ
Figure 5
38
0
3
6
9
12
15
0 5 10 15 20 25 30 35 time s
000
2000
4000
6000
8000
10000
x=0 (Cathode side) x=h2 x=h (Anode side) RH
λ RH
Figure 6
39
-15
-1
-05
0
05
1
15
2
25
0 50 100 150 200 250 300
Time t
Str
ess
MP
a
x=0 (Cathode side)
x=h (Anode side)
Figure 7
40
-15
-1
-05
0
05
1
15
0 5 10 15 20 25 30 35
time s
Str
ess
MP
a
x=0 (Cathode side)x=h2x=h (Anode side)
a)
Figure 8
41
Life-time cycles
100E+05
100E+06
100E+07
100E+08
100E+09
0 02 04 06 08 1RH min
Figure 9

12
minus=kT
U00 expωω (4)
Equation (3) indicates non-linear dependence of the chain slip rate through the
entanglement on the tensile force of the chain Equation (3) describes the conventional
linear dependence of velocity on the force when 1ltltkT
Fa
FkT
aV
ω2
= (5)
Here kT
a ω2
is a mobility of the chain in the entanglement In the opposite limit 1gtgtkT
Fa
equation (3) describes an exponential dependence of velocity on the force
=kT
FaaV exp
2ω
(6)
In a future publication the exponential increase of the chain slip rate through
entanglements with increasing tensile force will be related to the shape of σ-ε curves
observed for polymer materials We speculate that the yield stress is related to crossover
of the chain slip rate from equation (5) to equation (6)
Following the above concept of polymer plastic deformation we express macroscopic
stress σ through microscopic tension force F and the rate of macroscopic deformation
dt
dε through the microscopic chain velocity V predicted by equation (3) The detailed
derivation will be published in a forthcoming paper The final microscopic equation that
relates polymer deformation ε with external stress σ is presented below
minus=
T
T
dt
dE
dt
d
σσ
τσεσ
sinh (7)
13
Here τ is the polymer relaxation time and εσ
partpart=E is Youngrsquos modulus for the polymer
relT V
kT=σ where Vrel is a typical volume of polymer matrix around the entanglement
disturbed by one elementary act of monomer transfer through the entanglement The first
term in right hand part of equation (7) is the rate of the stress change induced by polymer
deformation The second term is rate the plastic relaxation of the stress This term
represents an extension of Maxwellrsquos relaxation rate στ In the case of low stress
Tσσ ltlt hyperbolic sine sinh in the right hand side of equation (7) is expanded to
reproduce the well-known Maxwell equation for polymer viscoelastic deformation
[ ]τσεσ minus=minus
partpart
Et
(8)
The fundamental difference between equation (7) and the Maxwell equation (8) is in the
relaxation terms in the right hand sides of equations (7) and (8) At large stress Tσσ gtgt
the hyperbolic sine asymptotically approaches the exponent leading to a sharp increase
in the stress relaxation rate as the applied stress is increased The detailed derivation of
equation (7) and validation of the model presented above will be published later in a
separate paper
III Membrane Stress Model
In this section we present the model that calculates the stress induced by
hydrationdehydration cycling In a fuel cell stack the membrane electrode assembly
(MEA) is constrained between two bipolar plates (Fig 3a) The membrane can
neitherbend nor change length Fuel is supplied to the MEA through fuel gas channels
14
and oxidant is supplied through oxidant (air) channels as indicated schematically in
Figure 3
To illustrate the mechanism of membrane failure due to RH cycling in the gas channels
we consider the following experiment Initially wet fuel is fed into the anode gas
channel (top channel shown in Figure 3a) and wet air is fed into the cathode gas channel
(bottom channel shown in Figure 3a) Both sides of the membrane are equilibrated with
wet gas until the equilibrium water content λ0 is reached and all mechanical stresses in
the membrane relax to zero The cathode side of the membrane dehydrates and attempts
to shrink when feed gas (air) is switched from wet to dry in the cathode gas channel
Mechanical constraints which prevent the membrane from shrinking cause in-plane
tensile stress σyy in the membrane Tensile stress results in a crack formation on the RH
cycled side of the membrane (Fig 3b) Further propagation of the crack in the through-
plane direction causes membrane mechanical failure
To calculate water distribution in the membrane cross-section at a fixed coordinate y
along the air channel we use RH(yt) the relative humidity distribution function predicted
by the fuel cell model Here we assume that the equilibration time of water in the
membrane is much smaller than RH cycling period in the gas channels Therefore the
water at the membrane interfaces is in thermodynamic equilibrium with vapor in the gas
channels
( ) ( )( )( ) ( )( )tyRHtyLx
tyRHtyx
Aeqm
Ceq
0
λλλλ==
== (9)
15
Here x is the through-membrane coordinate λeq(RH) is the equilibrium water content in
the membrane (an experimentally measured function of RH) RHC is the gas RH in the
cathode gas channel and RHA is the gas RH in the anode gas channel In the current
paper we utilize the following conventional diffusion equation with a water content
dependent diffusion coefficient to calculate water profile in the membrane
( ) 0=
partpart
partpartminus
partpart
xD
xt
λλλ (10)
Here D(λ) is the experimentally measured water diffusion coefficient in the membrane
(see Fig7 in Section VI) Initial conditions for equation (10) can be chosen arbitrarily
because after several cycles the membrane evolves to a new quasi-equilibrium state
governed by cyclic conditions and the initial state becomes irrelevant We chose the
initial conditions ( ) 00 λλ =x Solution of equation (10) with the boundary conditions (9)
gives the water distribution in the membrane λ(xyt) Below we calculate the membrane
stress at the membrane boundary adjacent to the air inlet (fixed coordinate y) where RH
cycling and stress amplitudes are maximal and limit membrane lifetime We start with a
calculation of the linear elastic response of the membrane to small changes in λ and
subsequently model the more general viscoelastic case
The macroscopic state of the membrane is determined by two parameters the membrane
length L0 and water content λ0 We assume that at equilibrium the stress in the
membrane is equal to zero The stress in the membrane can be generated by deviation of
the membrane length from equilibrium 0LLL minus=∆ at constant water content Also the
stress can be generated by deviation of water content from equilibrium
16
( ) ( ) 0 λλλ minus=∆ txtx in the geometrically constrained membrane (at constant length)
By analogy with linear elasticity theory with thermal expansion we calculate the linear
response of the membrane stress to small deviation from equilibrium as follows
( )( )txE yyyy λαεσ ∆minus= (11)
Here 0LLyy ∆=ε and E is the Young modulus of the membrane Swelling coefficient α
determines the length change ∆y of unconstrained (zero σ) membrane caused by the
change of the membrane water content ∆λ λα∆=∆ yy In 1D approximation the local
stress in the membrane depends on the change of the local membrane hydration (λ(xt)-
λ0)
In the membrane stress can be induced by changes in deformation water content and
simultaneous plastic relaxation The total rate of the stress change is the sum of the stress
change rate caused by membrane deformation and the stress change rate caused by the
change of membrane water content
λε
σσσttdt
d yyyyyy
partpart
+part
part= (12)
According to equation (11) the rate of the stress change induced by the change of the rate
of deviation of water content in constrained system with constant deformation and
without plastic relaxation is
dt
dE
tyy λα
σ
ε
∆=part
part (12a)
The second term in equation (12) is presented by equation (7)
17
minus=
partpart
T
Tyyyy
dt
dE
t σσ
τσεσ
λλ
sinh (12b)
Substituting equations (12a) and (12b) into the right hand side of equation (12) we obtain
the equation for the total rate of stress change in the membrane
( ) ( ) ( ) ( )
minus∆+
partpart
=T
yyTyyyy tx
dt
txdE
t
txE
dt
txd
σσ
τσλα
εσ
λ
sinh
(13)
The first term in the right hand side of equation (13) is equal to zero in a constrained
membrane Local water content λ(xt) is calculated by equation (10) with boundary
conditions (9) Equation (13) relates the stress in the membrane with water content in the
membrane for arbitrary RH cycling protocol
Equation (13) was solved numerically with parameters specified in the Table 1 The
calculated stress as a function of time is presented in Figure 7 The results indicate that
the membrane stress becomes a periodic function of time after several cycles if RH is a
periodic function of time To derive an analytical equation for the periodic stress we
utilize the separation of slow variable method The plastic (irreversible) deformation of
the membrane during one cycle is small because the cycling period is much smaller than
the membrane relaxation time Tcyc ltlt τ Therefore we can consider the membrane as an
elastic media during one cycle However the membrane slowly approaches a new
equilibrium state during each cycle After a long time t gtgt τ the membrane reaches the
new state with new equilibrium water content ( )xλ During the cycle λ oscillates below
and above ( )xλ At ( )xλλ = the membrane is not stressed The in-plane stress in the
18
periodical regime is driven by the deviation of λ from ( )xλ and is calculated by
following equation
( ) ( ) ( ) ( )( )xtxtxEtxyy λλασ minusminus= (14)
The stress averaged over time in the periodic regime is equal to zero for any x
Averaging (14) over time and taking advantage of the condition ( ) 0 =tyy txσ we
obtain the following expression for ( )xλ
( ) ( ) ( )( )
t
t
txE
txtxEx
λλ = (15)
Substituting (15) into (14) we obtain the final equation for the stress under periodic RH
cycling
( ) ( ) ( ) ( ) ( )( )
minusminus=
t
tyy txE
txtxEtxtxEtx
λλασ (16)
Substituting ( )txλ calculated from equation (10) with boundary conditions (9) into
equation (16) we calculate cyclic stress in the membrane
IV Damage accrual model
In this section we describe the model that calculates the membrane lifetime as a function
of applied cyclic stress Using the membrane stress model presented in Section III we
calculate the stress profile in the membrane ( )txyy σ for a given water content λ(xt)
We predict the membrane lifetime as a function of membrane stress using the damage
accrual model
19
The typical stress in the membrane under fuel cell operating conditions is much smaller
than the membrane tensile strength Many RH cycles are required to cause substantial
membrane damage However with each cycle the cyclic stress causes small irreversible
elongation ie plastic deformation of the membrane Accumulation of irreversible
elongation in the membrane causes membrane damage after a large number of cycles
Tang et al [7] experimentally studied Nafion111 membrane irreversible elongation under
cyclic stress They observed that irreversible elongation is accumulated over a large
number of cycles and causes damage of the membrane even at relatively small
amplitudes of cyclic stress They also demonstrated that at relatively small stress
σlt4MPa the membrane elongation rate is a linear function of applied stress magnitude
At larger stress amplitudes of about σ=65MPa the elongation rate rapidly increases We
speculate that such nonlinear dependence of elongation rate on stress amplitude is caused
by exponential dependence of the stress relaxation rate on the stress magnitude predicted
by extended Eyring model presented in Section III
The elongation of the membrane subjected to step-like cyclic stress is a function of the
stress amplitude σ and the cycle period Tcyc Applying equation (7) to the membrane
elongation during constant stress hold in one cycle we obtain
=
T
cycT
E
T
σσ
τσ
ε sinh1 (17)
Only a small fraction γ of this elongation is irreversible ie leads to membrane damage
In the current work we assume that γ depends only on cyclic period Tcyc and is
20
independent of σ Also we do not account for self-acceleration of membrane damage ie
we assume that irreversible elongation is proportional to the number of cycles N The
equation for irreversible elongation of the membrane per N cycles is
( )
=
T
NNσσεσε sinh 0 (18)
Here ε0 is
( )τγσ
εE
TT cyccycT=0 (19)
The elongation as a function of the stress and the number of cycles ε(σN) was measured
experimentally using Dynamic Mechanical Analysis (DMA) equipment for two specific
values of stress amplitude Because ε0 is proportional to an unknown parameter γ and
inversely proportional to another unknown parameter τ the lumped parameter ε0 was
used for fitting The model parameters ε0 and σT were fitted to DMA data The
membrane elongation for arbitrary stress amplitude σ was calculated from equation (18)
To validate equation (18) elongation per one stress cycle ε1(σ) was calculated from
Tangs experimental data [7] for Nafion111 membrane and plotted as a function of
applied stress σ see Fig 4 It follows from (18) that
( ) ( )
==
TdN
Nd
σσεσεσε sinh
01 (20)
The experimental data are in good agreement with the prediction of equation (20) with
σT=1 MPa and ε0=37sdot10-6 (Fig 4)
21
Membrane failure occurs after a critical irreversible elongation (damage) εcrit is
accumulated The number of cycles to failure Ncrit is calculated from the following
condition
( ) critcritN εσε =1 (21)
We assume that εcrit does not depend on stress amplitude and frequency and can be
measured once at a specific stress in a DMA test The number of cycles to failure NDMA
in out-off-cell tests is calculated by equation
( )Tcrit
NN
σσsinh0= (22)
( )cyccycT
critcrit
TT
EN
γστε
εε ==
00 (23)
We use N0 as a lumped fitting parameter obtained from a DMA test To obtain the values
of N0 and σT we performed stress cycling for two stress amplitudes σ and fitted the
experimental number of cycles to failure Ncrit by equation (22) Equation (22) predicts
membrane lifetime in a DMA test with arbitrary stress amplitude σ using the obtained
values of N0 and σT from experimental data Analytical dependence of these parameters
on temperature and RH will be published later
Fuel cell conditions under RH cycling differ from DMA test conditions because in DMA
testing the stress is uniformly distributed through the membrane cross-section while in
the cell the stress in the membrane changes substantially from the anode to the cathode
side We incorporated calibration parameter β into the current version of the model in
order to use equation (22) for in-cell membrane lifetime prediction This parameter is
used for renormalization of stress The membrane damage in DMA testing with stress
22
amplitude σ is equivalent to membrane damage in a fuel cell stack when the membrane is
subjected to RH cycling that cause a stress amplitude of βσ
To obtain the calibration parameter β we performed a single RH cycling experiment in a
fuel cell up to membrane failure for particular conditions and measured the experimental
membrane lifetime Ncell Using the membrane stress model we calculated the stress
amplitude σmax for these particular conditions Parameter β is calculated from the
following equation
( )Tcell
NN
σβσ max
0
sinh= (24)
Using the parameters N0 and σT obtained from fitting DMA data by equation (22) and
the parameter β obtained from the in-cell test we predict the in-cell membrane lifetime
under arbitrary RH cycling conditions
V Model parameters
In this section we present input model parameter values and experimental data for a
GORE-SELECTreg membrane in a PRIMEAreg MEA In RH cycling experiments
hydrogen with 100 RH was fed to the anode channel Air fed to the cathode channel
was cycled from RHmax to RHmin with equal time intervals Experimental conditions are
summarized in Table 1 Mechanical properties of GORE-SELECT membranes were
obtained from available literature and summarized in Table 1 DMA tests required for
model calibration were also performed
23
VI Model results
In this section we report the result of modeling of GORE-SELECT membrane damage
and lifetime under in-cell RH cycling conditions The model components ie fuel cell
model membrane stress model and stress accrual model were incorporated into the
MATLAB code The model parameters and test conditions are summarized in Section V
The relative humidity variation in the cathode gas channel during the cycle was
calculated from the fuel cell model and used as the input for the membrane stress model
The calculated relative humidity variation is shown in Fig6 The function with fast
exponential relaxation was used instead of step-wise function for better convergence of
the numerical solution The calculated dependence of λ on time at three points across
the membrane (at the cathode side at the middle of the membrane and at the anode side)
is also shown in Fig6 This dependence is calculated from water diffusion equation in
the membrane (10) with boundary conditions (9) and initial condition ( ) 110 =xλ
Figure 9 indicates that the membrane water content λ(t) follows the humidity cycle RH(t)
There is no time lag because water diffusion time in the membrane sD
htdif 20
2
asymp= is
much smaller than cycling period Tcyc=30s Here h=18 microm is membrane thickness and
D=0510-6 cm2s is the average water diffusion coefficient in the membrane
Water content in the membrane )( txλ is utilized in the membrane stress model to
predict the stress )( txσ distribution in the membrane The model prediction of the
stress in the membrane by equation (13) as a function of time is shown in Fig7 at the
24
cathode and anode sides of the membrane The membrane reaches quasi-steady state
regime after t gtgt τ and stress becomes a periodic function of time oscillating around the
equilibrium value The model prediction for the stress in the periodic regime as a
function of time calculated by equation (16) is shown in Fig8 Maximal stress is
imposed in the region with maximal humidity variation ie at the cathode side of the
membrane At the anode side of the membrane the stress is equal to zero because there is
no humidity cycling One can see that the stress calculated by equation (13) at large time
is in good agreement with the periodic stress shown in Fig8 calculated analytically from
equation (16)
Figures 7 and 8 indicate that after time t larger than relaxation time τ the stress at the
cathode sides oscillates around the equilibrium stress 0=eqσ The membrane at the
cathode side is subjected to tensile stress when ( ) ( )00 =lt xt λλ and to compressive
stress when ( ) ( )00 =gt xt λλ
The maximal value of the stress calculated by the membrane stress model is used in the
damage accrual model to predict membrane lifetime by equation (24) As discussed in
Section IV this equation contains three unknown parameters σT N0 and β Parameters
σT and N0 are calculated by fitting UTC POWER DMA data by equation (22)
Calibration parameter β is calculated from an in-cell lifetime experiment under specific
RH cycling conditions The in-cell membrane stress was calculated by the membrane
stress model
25
Using the model parameters calculated from DMA testing and in-cell RH cycling we
predicted GORE-SELECT membrane lifetime under arbitrary RH cycling conditions
Predicted membrane lifetime (number of cycles to failure) as a function of minimal RH in
the cathode gas channel RHmin is plotted in Fig 9 The anode gas humidity was
assumed to be 100 The maximal RH in the cathode gas channel RHmax of 100 was
also assumed At high RH cycling amplitude (low RHmin) the model predicts exponential
decrease of membrane lifetime with increase of RH cycling amplitude Stress amplitude
is approximately proportional to RH cycling amplitude and the number of cycles to
failure depends exponentially on the stress for large stress according to equation (22)
This results in exponential dependence of the membrane lifetime on RH cycling
amplitude for large values of amplitude (small value of RHmin)
VII Conclusions
A modeling framework was developed that predicts the lifetime of PEM fuel cell
membranes subjected to hydration cycling The developed model predicts membrane
lifetime as a function of RH cycling amplitude and membrane mechanical properties
Membrane failure in the fuel cell is caused by damage accumulation under cyclic stress in
the membrane subjected to cyclic hydrationdehydration A fuel cell membrane is
typically subjected to hydrationdehydration under fuel cell conditions One side of the
membrane dehydrates and attempts to shrink when the feed gas (air) is switched from wet
to dry in the cathode gas channel Mechanical constraints imposed by bipolar plates
prevent the membrane from shrinking This causes in-plane tensile stress in the
membrane Tensile stress causes a crack formation at RH cycled side of the membrane
26
(Fig 3) Further propagation of the crack in the through-plane direction causes
membrane mechanical failure
The modeling framework consists of three components a model of RH distribution in gas
channels a membrane stress model and a damage accrual model Several models of RH
distribution in gas channels are available in literature [8 9 10 11 and 12] and we do not
discuss this model component in the current paper In the current version of the model
we assume equilibrium of water in the membrane with the vapor at the membranegas
interface and use the conventional diffusion equation for calculation of water content in
the membrane bulk with the water diffusion coefficient dependent on water content D(λ)
The membrane stress model calculates the stress in the membrane caused by membrane
cyclic swellingshrinking under RH cycling conditions The local stress in the membrane
is caused by the change in the local hydration level The damage accrual model predicts
the number of cycles to failure for the membrane under applied cyclic stress The input
for the damage accrual model is a maximal stress in the membrane calculated by the
membrane stress model and experimental membrane lifetimes in DMA tests for two
cycling amplitudes The current version of the model also contains one calibration
parameter obtained from an in-cell RH cycling experiment with specific RH cycling
conditions
The model was utilized for in-cell lifetime predictions of GORE-SELECT membranes
The membrane mechanical properties and swelling coefficient were obtained from the
literature DMA testing and in-cell RH cycling were carried out at UTC Power After
27
calibration the model predicts membrane lifetime in fuel cells under arbitrary RH cycling
conditions The calculated membrane lifetime (number of cycles to failure) as a function
of minimal RH in cathode gas channel RHmin is plotted in Fig 9 At high RH cycling
amplitude (low RHmin) the model predicts exponential decrease of membrane lifetime
with increase of RH cycling amplitude Stress amplitude is approximately proportional
to RH cycling amplitude and the number of cycles to failure depends exponentially on
stress for large stress magnitude according to equation (22) This results in exponential
dependence of membrane lifetime on RH cycling amplitude for large values of amplitude
(small value of RHmin)
Acknowledgement
This work was supported by the US Department of Energy under the grant DE-PS36-
08GO98009
References
1 Ho Lee Taehee Kim Woojong Sim Saehoon Kim Byungki Ahn Taewon Lim
and Kwonpil Park Korean J Chem Eng 28(2) 487-491 (2011)
2 Xinyu Huang Roham Solasi Yue Zou Matthew Feshler Kenneth Reifsnider
David Condit Sergei Burlatsky Thomas Madden Journal of Polymer Science
Part B 44 (16) p 2346ndash2357 (2006)
3 Yaliang Tang Anette M Karlsson Michael H Santare Michael Gilbert Simon
Cleghorn William B Johnson Materials Science and Engineering A 425 (2006)
297ndash304
28
4 Yaliang Tang Ahmet Kusoglu Anette M Karlsson Michael H Santare Simon
Cleghorn William B Johnson Journal of Power Sources 175 (2008) 817ndash825
5 A Kusoglu A M Karlsson M H Santare S Cleghorn W B Johnson Journal
of Power Sources 161 987-996 (2006)
6 A Kusoglu A M Karlsson M H Santare Simon Cleghorn W B Johnson
Journal of Power Sources 170 345-358 (2007)
7 Haolin Tang Shen Peikang San Ping Jiang Fang Wang Mu Pan Journal of
Power Sources 170 (2007) 85ndash92
8 T F Fuller and J Newman J Electrochem Soc 140 (5) 1218-1225 (1993)
9 T V Nguyen and R E White J Electrochem Soc 140 (8) 2178-2186 (1993)
10 J S Yi and T V Nguyen J Electrochem Soc 145 (4) 1149-1159 (1998)
11 T E Springer T A Zawodzinski and S Gottesfeld J Electrochem Soc 138 (8)
2334-2342 (1991)
12 A Z Weber R M Darling and J Newman J Electrochem Soc 151 (10)
A1715-A1727 (2004)
13 L Boltzmann Pogg Ann u Chem 7 624 (1876)
14 S Turner Polymer Eng a Sci 6 306 (1966)
15 W N Findley and G Khosla J Appl Phys 26 821 (1955)
16 K van Holde J Polymer Sci 24 417 (1957)
17 T L Smith Trans Soc Rheol 6 61 (1962)
18 H Leaderman Trans Soc Rheol 6 361 (1962)
19 I M Ward and E T Onat J Mech Phys Solids 11 217 (1963)
29
20 Roham Solasi Yue Zou Xinyu Huang Kenneth Reifsnider Mech Time-Depend
Mater 12 15ndash30 (2008)
21 Paul W Majsztrik Andrew B Bocarsly and Jay B Benziger Macromolecules
41 9849-9862 (2008)
22 F Bauer S Denneler M Willert-Porada Journal of Polymer Science Part B
Polymer Physics Vol 43 786ndash795 (2005)
23 Kirt A Page Kevin M Cable and Robert B Moore Macromolecules 2005 38
6472-6484
24 Gierke T D Munn G E Wilson F C J Polym Sci Polym Phys Ed 1981 19
1687ndash1704
25 Hsu W Y Gierke T D J Membrane Sci 1983 13 307ndash326
26 Thomas A Zawodzinski Thomas E Spriner John Davey Roger Jestel Cruz
Lopez Judith Valerio and Shimshon Gottesfeld J Electrochem Soc 140 (7)
1981-1985 (1993)
27 Paul W Majsztrik M Barclay Satterfield Andrew B Bocarsly Jay B Benziger
J Membrane Sci 301 (2007) 93ndash106
28 T Takamatsu M Hashiyama A Eisenberg J Appl Polym Sci 24 (11) (1979)
2199ndash2220
29 DR Morris XD Sun J Appl Polym Sci 50 (8) (1993) 1445ndash1452
30 Shanhai Ge Xuguang Li Baolian Yi and I-Ming Hsing J Electrochem Soc
152 (6) A1149-A1157 (2005)
31 Adam Z Weber and John Newman J Electrochem Soc 151 (2) A311-A325
(2004)
30
32 Adam Z Weber and John Newman Chem Rev 2004 104 4679-4726
33 Timothy J Silverman Jeremy P Meyers and Joseph J Beaman J Electrochem
Soc 157 (10) B1376-B1381 (2010)
34 Halsey G White HJ Eyring H Text Res J 1945 v 15 p 295
35 M Gummalla VV Atrazhev AN Varyukhin and SF Burlatsky To be
published
36 P Choi and R Datta J Electrochem Soc 150 E601 (2003)
37 P de Gennes Scaling Concepts in Polymer Physics Cornell University Press
List of Tables
Table 1 Model parameters and experimental conditions
Parameter Description ValueSource
Operational conditions
Tcyc RH cycling time period 30 sec
RHmax Maximum relative humidity in cathode channel 100
RHmin Minimum relative humidity in cathode channel 10
T Cell temperature 78ordmC
Membrane properties
E(RHT) Youngrsquos modulus of the membrane [4]
)(aλ Membrane water content as a function of vapor
activity [mol H2Omol SO3] [36]
)(λD Diffusion coefficient of water in the membrane Fig5
31
α Dimension change coefficient 0004 (data from [4])
Tσ Fitting parameter (internal data fit to Eq 27) 17 MPa
0N Fitting parameter (internal data fit to Eq 27) 12middot106
β DMA to in-cell calibration parameter 23
Figure Captions
Figure 1 Schematic diagram showing the components of the model framework to predict
mechanical life of the membrane undergoing hydration cycles
Figure 2 (a) Polymer chain segment constrained by one entanglement and subjected to
the external force F (b) Potential energy of monomer in entanglement before applying
the force (in the left hand side of the Fig 2b) and after applying the force (in the right
hand side of the Fig 2b)
Figure 3 Schematic figure of membrane in fuel cell (counter-flow configuration)
constrained between two bi-polar plates (a) and crack formation (b) The wet fuel exits
from the anode gas channel (top channel) Initially wet air is fed into cathode gas
channel (bottom channel) When cathode side feed gas (air) is switched from wet to dry
cathode side of the membrane dehydrates and attempts to shrink The anode side of the
membrane remains wet and swollen
Figure 4 Fitting Tangs experimental data [7] (triangles) by equation (22) (solid line)
Fitting parameters values are σT=1 MPa and ε0=37sdot10-6
32
Figure 5 Dependence of diffusion coefficient in Nafion membrane on water content λ
(UTRC internal experimental data) There are not available data in range from 52=λ
to 15=λ so linear approximation is used in this region
Figure 6 Model prediction of dependence of RH on time and λ on time at the anode side
at the middle of the membrane and at the cathode side
Figure 7 Model prediction of stress as a function of time under RH cycling at the cathode
and at the anode sides of membrane
Figure 8 Model prediction of stress in quasi-steady-state regime at the cathode side at
the middle of the membrane and at the anode side
Figure 9 Calculated membrane lifetime (the number of cycles to failure) as a function of
minimal RH at the cathode side of membrane Anode side of membrane maintains 100
RH
33
Figures
Fuel cell RH distribution model
Operating conditionsinlet RH inlet Tcycling period
hydrationdehydration induced stress model
σ(t)Damage accrual model
Membrane Mechanical Degradation Model
Membrane propertiesE(RHT) ε∆λ DMA
ε(σNcycT) εcrit
Mechanical life-time
Fuel cell stack design
λ(t)
Figure 1
34
Figure 2
35
Figure 3
σ yy a)
b)
Crack formation
bi - polar plate
bi - polar plate
dry region
stress
y
x
σ yy a)
b)
Crack formation
bi - polar plate
bi - polar plate
dry air
wet fuel
σ yy a)
b)
Crack formation
bi - polar plate
bi - polar plate
dry region
stress
y
x
σ yy a)
b)
Crack formation
bi - polar plate
bi - polar plate
dry air
wet fuel
36
0
50
100
150
200
250
0 1 2 3 4 5 6 7
dud
N
Stress (MPa)
Figure 4
37
0
2
4
6
8
10
12
14
16
0 25 5 75 10 125 15
D1
0^-6
cm
^2s
λ
Figure 5
38
0
3
6
9
12
15
0 5 10 15 20 25 30 35 time s
000
2000
4000
6000
8000
10000
x=0 (Cathode side) x=h2 x=h (Anode side) RH
λ RH
Figure 6
39
-15
-1
-05
0
05
1
15
2
25
0 50 100 150 200 250 300
Time t
Str
ess
MP
a
x=0 (Cathode side)
x=h (Anode side)
Figure 7
40
-15
-1
-05
0
05
1
15
0 5 10 15 20 25 30 35
time s
Str
ess
MP
a
x=0 (Cathode side)x=h2x=h (Anode side)
a)
Figure 8
41
Life-time cycles
100E+05
100E+06
100E+07
100E+08
100E+09
0 02 04 06 08 1RH min
Figure 9

14
and oxidant is supplied through oxidant (air) channels as indicated schematically in
Figure 3
To illustrate the mechanism of membrane failure due to RH cycling in the gas channels
we consider the following experiment Initially wet fuel is fed into the anode gas
channel (top channel shown in Figure 3a) and wet air is fed into the cathode gas channel
(bottom channel shown in Figure 3a) Both sides of the membrane are equilibrated with
wet gas until the equilibrium water content λ0 is reached and all mechanical stresses in
the membrane relax to zero The cathode side of the membrane dehydrates and attempts
to shrink when feed gas (air) is switched from wet to dry in the cathode gas channel
Mechanical constraints which prevent the membrane from shrinking cause in-plane
tensile stress σyy in the membrane Tensile stress results in a crack formation on the RH
cycled side of the membrane (Fig 3b) Further propagation of the crack in the through-
plane direction causes membrane mechanical failure
To calculate water distribution in the membrane cross-section at a fixed coordinate y
along the air channel we use RH(yt) the relative humidity distribution function predicted
by the fuel cell model Here we assume that the equilibration time of water in the
membrane is much smaller than RH cycling period in the gas channels Therefore the
water at the membrane interfaces is in thermodynamic equilibrium with vapor in the gas
channels
( ) ( )( )( ) ( )( )tyRHtyLx
tyRHtyx
Aeqm
Ceq
0
λλλλ==
== (9)
15
Here x is the through-membrane coordinate λeq(RH) is the equilibrium water content in
the membrane (an experimentally measured function of RH) RHC is the gas RH in the
cathode gas channel and RHA is the gas RH in the anode gas channel In the current
paper we utilize the following conventional diffusion equation with a water content
dependent diffusion coefficient to calculate water profile in the membrane
( ) 0=
partpart
partpartminus
partpart
xD
xt
λλλ (10)
Here D(λ) is the experimentally measured water diffusion coefficient in the membrane
(see Fig7 in Section VI) Initial conditions for equation (10) can be chosen arbitrarily
because after several cycles the membrane evolves to a new quasi-equilibrium state
governed by cyclic conditions and the initial state becomes irrelevant We chose the
initial conditions ( ) 00 λλ =x Solution of equation (10) with the boundary conditions (9)
gives the water distribution in the membrane λ(xyt) Below we calculate the membrane
stress at the membrane boundary adjacent to the air inlet (fixed coordinate y) where RH
cycling and stress amplitudes are maximal and limit membrane lifetime We start with a
calculation of the linear elastic response of the membrane to small changes in λ and
subsequently model the more general viscoelastic case
The macroscopic state of the membrane is determined by two parameters the membrane
length L0 and water content λ0 We assume that at equilibrium the stress in the
membrane is equal to zero The stress in the membrane can be generated by deviation of
the membrane length from equilibrium 0LLL minus=∆ at constant water content Also the
stress can be generated by deviation of water content from equilibrium
16
( ) ( ) 0 λλλ minus=∆ txtx in the geometrically constrained membrane (at constant length)
By analogy with linear elasticity theory with thermal expansion we calculate the linear
response of the membrane stress to small deviation from equilibrium as follows
( )( )txE yyyy λαεσ ∆minus= (11)
Here 0LLyy ∆=ε and E is the Young modulus of the membrane Swelling coefficient α
determines the length change ∆y of unconstrained (zero σ) membrane caused by the
change of the membrane water content ∆λ λα∆=∆ yy In 1D approximation the local
stress in the membrane depends on the change of the local membrane hydration (λ(xt)-
λ0)
In the membrane stress can be induced by changes in deformation water content and
simultaneous plastic relaxation The total rate of the stress change is the sum of the stress
change rate caused by membrane deformation and the stress change rate caused by the
change of membrane water content
λε
σσσttdt
d yyyyyy
partpart
+part
part= (12)
According to equation (11) the rate of the stress change induced by the change of the rate
of deviation of water content in constrained system with constant deformation and
without plastic relaxation is
dt
dE
tyy λα
σ
ε
∆=part
part (12a)
The second term in equation (12) is presented by equation (7)
17
minus=
partpart
T
Tyyyy
dt
dE
t σσ
τσεσ
λλ
sinh (12b)
Substituting equations (12a) and (12b) into the right hand side of equation (12) we obtain
the equation for the total rate of stress change in the membrane
( ) ( ) ( ) ( )
minus∆+
partpart
=T
yyTyyyy tx
dt
txdE
t
txE
dt
txd
σσ
τσλα
εσ
λ
sinh
(13)
The first term in the right hand side of equation (13) is equal to zero in a constrained
membrane Local water content λ(xt) is calculated by equation (10) with boundary
conditions (9) Equation (13) relates the stress in the membrane with water content in the
membrane for arbitrary RH cycling protocol
Equation (13) was solved numerically with parameters specified in the Table 1 The
calculated stress as a function of time is presented in Figure 7 The results indicate that
the membrane stress becomes a periodic function of time after several cycles if RH is a
periodic function of time To derive an analytical equation for the periodic stress we
utilize the separation of slow variable method The plastic (irreversible) deformation of
the membrane during one cycle is small because the cycling period is much smaller than
the membrane relaxation time Tcyc ltlt τ Therefore we can consider the membrane as an
elastic media during one cycle However the membrane slowly approaches a new
equilibrium state during each cycle After a long time t gtgt τ the membrane reaches the
new state with new equilibrium water content ( )xλ During the cycle λ oscillates below
and above ( )xλ At ( )xλλ = the membrane is not stressed The in-plane stress in the
18
periodical regime is driven by the deviation of λ from ( )xλ and is calculated by
following equation
( ) ( ) ( ) ( )( )xtxtxEtxyy λλασ minusminus= (14)
The stress averaged over time in the periodic regime is equal to zero for any x
Averaging (14) over time and taking advantage of the condition ( ) 0 =tyy txσ we
obtain the following expression for ( )xλ
( ) ( ) ( )( )
t
t
txE
txtxEx
λλ = (15)
Substituting (15) into (14) we obtain the final equation for the stress under periodic RH
cycling
( ) ( ) ( ) ( ) ( )( )
minusminus=
t
tyy txE
txtxEtxtxEtx
λλασ (16)
Substituting ( )txλ calculated from equation (10) with boundary conditions (9) into
equation (16) we calculate cyclic stress in the membrane
IV Damage accrual model
In this section we describe the model that calculates the membrane lifetime as a function
of applied cyclic stress Using the membrane stress model presented in Section III we
calculate the stress profile in the membrane ( )txyy σ for a given water content λ(xt)
We predict the membrane lifetime as a function of membrane stress using the damage
accrual model
19
The typical stress in the membrane under fuel cell operating conditions is much smaller
than the membrane tensile strength Many RH cycles are required to cause substantial
membrane damage However with each cycle the cyclic stress causes small irreversible
elongation ie plastic deformation of the membrane Accumulation of irreversible
elongation in the membrane causes membrane damage after a large number of cycles
Tang et al [7] experimentally studied Nafion111 membrane irreversible elongation under
cyclic stress They observed that irreversible elongation is accumulated over a large
number of cycles and causes damage of the membrane even at relatively small
amplitudes of cyclic stress They also demonstrated that at relatively small stress
σlt4MPa the membrane elongation rate is a linear function of applied stress magnitude
At larger stress amplitudes of about σ=65MPa the elongation rate rapidly increases We
speculate that such nonlinear dependence of elongation rate on stress amplitude is caused
by exponential dependence of the stress relaxation rate on the stress magnitude predicted
by extended Eyring model presented in Section III
The elongation of the membrane subjected to step-like cyclic stress is a function of the
stress amplitude σ and the cycle period Tcyc Applying equation (7) to the membrane
elongation during constant stress hold in one cycle we obtain
=
T
cycT
E
T
σσ
τσ
ε sinh1 (17)
Only a small fraction γ of this elongation is irreversible ie leads to membrane damage
In the current work we assume that γ depends only on cyclic period Tcyc and is
20
independent of σ Also we do not account for self-acceleration of membrane damage ie
we assume that irreversible elongation is proportional to the number of cycles N The
equation for irreversible elongation of the membrane per N cycles is
( )
=
T
NNσσεσε sinh 0 (18)
Here ε0 is
( )τγσ
εE
TT cyccycT=0 (19)
The elongation as a function of the stress and the number of cycles ε(σN) was measured
experimentally using Dynamic Mechanical Analysis (DMA) equipment for two specific
values of stress amplitude Because ε0 is proportional to an unknown parameter γ and
inversely proportional to another unknown parameter τ the lumped parameter ε0 was
used for fitting The model parameters ε0 and σT were fitted to DMA data The
membrane elongation for arbitrary stress amplitude σ was calculated from equation (18)
To validate equation (18) elongation per one stress cycle ε1(σ) was calculated from
Tangs experimental data [7] for Nafion111 membrane and plotted as a function of
applied stress σ see Fig 4 It follows from (18) that
( ) ( )
==
TdN
Nd
σσεσεσε sinh
01 (20)
The experimental data are in good agreement with the prediction of equation (20) with
σT=1 MPa and ε0=37sdot10-6 (Fig 4)
21
Membrane failure occurs after a critical irreversible elongation (damage) εcrit is
accumulated The number of cycles to failure Ncrit is calculated from the following
condition
( ) critcritN εσε =1 (21)
We assume that εcrit does not depend on stress amplitude and frequency and can be
measured once at a specific stress in a DMA test The number of cycles to failure NDMA
in out-off-cell tests is calculated by equation
( )Tcrit
NN
σσsinh0= (22)
( )cyccycT
critcrit
TT
EN
γστε
εε ==
00 (23)
We use N0 as a lumped fitting parameter obtained from a DMA test To obtain the values
of N0 and σT we performed stress cycling for two stress amplitudes σ and fitted the
experimental number of cycles to failure Ncrit by equation (22) Equation (22) predicts
membrane lifetime in a DMA test with arbitrary stress amplitude σ using the obtained
values of N0 and σT from experimental data Analytical dependence of these parameters
on temperature and RH will be published later
Fuel cell conditions under RH cycling differ from DMA test conditions because in DMA
testing the stress is uniformly distributed through the membrane cross-section while in
the cell the stress in the membrane changes substantially from the anode to the cathode
side We incorporated calibration parameter β into the current version of the model in
order to use equation (22) for in-cell membrane lifetime prediction This parameter is
used for renormalization of stress The membrane damage in DMA testing with stress
22
amplitude σ is equivalent to membrane damage in a fuel cell stack when the membrane is
subjected to RH cycling that cause a stress amplitude of βσ
To obtain the calibration parameter β we performed a single RH cycling experiment in a
fuel cell up to membrane failure for particular conditions and measured the experimental
membrane lifetime Ncell Using the membrane stress model we calculated the stress
amplitude σmax for these particular conditions Parameter β is calculated from the
following equation
( )Tcell
NN
σβσ max
0
sinh= (24)
Using the parameters N0 and σT obtained from fitting DMA data by equation (22) and
the parameter β obtained from the in-cell test we predict the in-cell membrane lifetime
under arbitrary RH cycling conditions
V Model parameters
In this section we present input model parameter values and experimental data for a
GORE-SELECTreg membrane in a PRIMEAreg MEA In RH cycling experiments
hydrogen with 100 RH was fed to the anode channel Air fed to the cathode channel
was cycled from RHmax to RHmin with equal time intervals Experimental conditions are
summarized in Table 1 Mechanical properties of GORE-SELECT membranes were
obtained from available literature and summarized in Table 1 DMA tests required for
model calibration were also performed
23
VI Model results
In this section we report the result of modeling of GORE-SELECT membrane damage
and lifetime under in-cell RH cycling conditions The model components ie fuel cell
model membrane stress model and stress accrual model were incorporated into the
MATLAB code The model parameters and test conditions are summarized in Section V
The relative humidity variation in the cathode gas channel during the cycle was
calculated from the fuel cell model and used as the input for the membrane stress model
The calculated relative humidity variation is shown in Fig6 The function with fast
exponential relaxation was used instead of step-wise function for better convergence of
the numerical solution The calculated dependence of λ on time at three points across
the membrane (at the cathode side at the middle of the membrane and at the anode side)
is also shown in Fig6 This dependence is calculated from water diffusion equation in
the membrane (10) with boundary conditions (9) and initial condition ( ) 110 =xλ
Figure 9 indicates that the membrane water content λ(t) follows the humidity cycle RH(t)
There is no time lag because water diffusion time in the membrane sD
htdif 20
2
asymp= is
much smaller than cycling period Tcyc=30s Here h=18 microm is membrane thickness and
D=0510-6 cm2s is the average water diffusion coefficient in the membrane
Water content in the membrane )( txλ is utilized in the membrane stress model to
predict the stress )( txσ distribution in the membrane The model prediction of the
stress in the membrane by equation (13) as a function of time is shown in Fig7 at the
24
cathode and anode sides of the membrane The membrane reaches quasi-steady state
regime after t gtgt τ and stress becomes a periodic function of time oscillating around the
equilibrium value The model prediction for the stress in the periodic regime as a
function of time calculated by equation (16) is shown in Fig8 Maximal stress is
imposed in the region with maximal humidity variation ie at the cathode side of the
membrane At the anode side of the membrane the stress is equal to zero because there is
no humidity cycling One can see that the stress calculated by equation (13) at large time
is in good agreement with the periodic stress shown in Fig8 calculated analytically from
equation (16)
Figures 7 and 8 indicate that after time t larger than relaxation time τ the stress at the
cathode sides oscillates around the equilibrium stress 0=eqσ The membrane at the
cathode side is subjected to tensile stress when ( ) ( )00 =lt xt λλ and to compressive
stress when ( ) ( )00 =gt xt λλ
The maximal value of the stress calculated by the membrane stress model is used in the
damage accrual model to predict membrane lifetime by equation (24) As discussed in
Section IV this equation contains three unknown parameters σT N0 and β Parameters
σT and N0 are calculated by fitting UTC POWER DMA data by equation (22)
Calibration parameter β is calculated from an in-cell lifetime experiment under specific
RH cycling conditions The in-cell membrane stress was calculated by the membrane
stress model
25
Using the model parameters calculated from DMA testing and in-cell RH cycling we
predicted GORE-SELECT membrane lifetime under arbitrary RH cycling conditions
Predicted membrane lifetime (number of cycles to failure) as a function of minimal RH in
the cathode gas channel RHmin is plotted in Fig 9 The anode gas humidity was
assumed to be 100 The maximal RH in the cathode gas channel RHmax of 100 was
also assumed At high RH cycling amplitude (low RHmin) the model predicts exponential
decrease of membrane lifetime with increase of RH cycling amplitude Stress amplitude
is approximately proportional to RH cycling amplitude and the number of cycles to
failure depends exponentially on the stress for large stress according to equation (22)
This results in exponential dependence of the membrane lifetime on RH cycling
amplitude for large values of amplitude (small value of RHmin)
VII Conclusions
A modeling framework was developed that predicts the lifetime of PEM fuel cell
membranes subjected to hydration cycling The developed model predicts membrane
lifetime as a function of RH cycling amplitude and membrane mechanical properties
Membrane failure in the fuel cell is caused by damage accumulation under cyclic stress in
the membrane subjected to cyclic hydrationdehydration A fuel cell membrane is
typically subjected to hydrationdehydration under fuel cell conditions One side of the
membrane dehydrates and attempts to shrink when the feed gas (air) is switched from wet
to dry in the cathode gas channel Mechanical constraints imposed by bipolar plates
prevent the membrane from shrinking This causes in-plane tensile stress in the
membrane Tensile stress causes a crack formation at RH cycled side of the membrane
26
(Fig 3) Further propagation of the crack in the through-plane direction causes
membrane mechanical failure
The modeling framework consists of three components a model of RH distribution in gas
channels a membrane stress model and a damage accrual model Several models of RH
distribution in gas channels are available in literature [8 9 10 11 and 12] and we do not
discuss this model component in the current paper In the current version of the model
we assume equilibrium of water in the membrane with the vapor at the membranegas
interface and use the conventional diffusion equation for calculation of water content in
the membrane bulk with the water diffusion coefficient dependent on water content D(λ)
The membrane stress model calculates the stress in the membrane caused by membrane
cyclic swellingshrinking under RH cycling conditions The local stress in the membrane
is caused by the change in the local hydration level The damage accrual model predicts
the number of cycles to failure for the membrane under applied cyclic stress The input
for the damage accrual model is a maximal stress in the membrane calculated by the
membrane stress model and experimental membrane lifetimes in DMA tests for two
cycling amplitudes The current version of the model also contains one calibration
parameter obtained from an in-cell RH cycling experiment with specific RH cycling
conditions
The model was utilized for in-cell lifetime predictions of GORE-SELECT membranes
The membrane mechanical properties and swelling coefficient were obtained from the
literature DMA testing and in-cell RH cycling were carried out at UTC Power After
27
calibration the model predicts membrane lifetime in fuel cells under arbitrary RH cycling
conditions The calculated membrane lifetime (number of cycles to failure) as a function
of minimal RH in cathode gas channel RHmin is plotted in Fig 9 At high RH cycling
amplitude (low RHmin) the model predicts exponential decrease of membrane lifetime
with increase of RH cycling amplitude Stress amplitude is approximately proportional
to RH cycling amplitude and the number of cycles to failure depends exponentially on
stress for large stress magnitude according to equation (22) This results in exponential
dependence of membrane lifetime on RH cycling amplitude for large values of amplitude
(small value of RHmin)
Acknowledgement
This work was supported by the US Department of Energy under the grant DE-PS36-
08GO98009
References
1 Ho Lee Taehee Kim Woojong Sim Saehoon Kim Byungki Ahn Taewon Lim
and Kwonpil Park Korean J Chem Eng 28(2) 487-491 (2011)
2 Xinyu Huang Roham Solasi Yue Zou Matthew Feshler Kenneth Reifsnider
David Condit Sergei Burlatsky Thomas Madden Journal of Polymer Science
Part B 44 (16) p 2346ndash2357 (2006)
3 Yaliang Tang Anette M Karlsson Michael H Santare Michael Gilbert Simon
Cleghorn William B Johnson Materials Science and Engineering A 425 (2006)
297ndash304
28
4 Yaliang Tang Ahmet Kusoglu Anette M Karlsson Michael H Santare Simon
Cleghorn William B Johnson Journal of Power Sources 175 (2008) 817ndash825
5 A Kusoglu A M Karlsson M H Santare S Cleghorn W B Johnson Journal
of Power Sources 161 987-996 (2006)
6 A Kusoglu A M Karlsson M H Santare Simon Cleghorn W B Johnson
Journal of Power Sources 170 345-358 (2007)
7 Haolin Tang Shen Peikang San Ping Jiang Fang Wang Mu Pan Journal of
Power Sources 170 (2007) 85ndash92
8 T F Fuller and J Newman J Electrochem Soc 140 (5) 1218-1225 (1993)
9 T V Nguyen and R E White J Electrochem Soc 140 (8) 2178-2186 (1993)
10 J S Yi and T V Nguyen J Electrochem Soc 145 (4) 1149-1159 (1998)
11 T E Springer T A Zawodzinski and S Gottesfeld J Electrochem Soc 138 (8)
2334-2342 (1991)
12 A Z Weber R M Darling and J Newman J Electrochem Soc 151 (10)
A1715-A1727 (2004)
13 L Boltzmann Pogg Ann u Chem 7 624 (1876)
14 S Turner Polymer Eng a Sci 6 306 (1966)
15 W N Findley and G Khosla J Appl Phys 26 821 (1955)
16 K van Holde J Polymer Sci 24 417 (1957)
17 T L Smith Trans Soc Rheol 6 61 (1962)
18 H Leaderman Trans Soc Rheol 6 361 (1962)
19 I M Ward and E T Onat J Mech Phys Solids 11 217 (1963)
29
20 Roham Solasi Yue Zou Xinyu Huang Kenneth Reifsnider Mech Time-Depend
Mater 12 15ndash30 (2008)
21 Paul W Majsztrik Andrew B Bocarsly and Jay B Benziger Macromolecules
41 9849-9862 (2008)
22 F Bauer S Denneler M Willert-Porada Journal of Polymer Science Part B
Polymer Physics Vol 43 786ndash795 (2005)
23 Kirt A Page Kevin M Cable and Robert B Moore Macromolecules 2005 38
6472-6484
24 Gierke T D Munn G E Wilson F C J Polym Sci Polym Phys Ed 1981 19
1687ndash1704
25 Hsu W Y Gierke T D J Membrane Sci 1983 13 307ndash326
26 Thomas A Zawodzinski Thomas E Spriner John Davey Roger Jestel Cruz
Lopez Judith Valerio and Shimshon Gottesfeld J Electrochem Soc 140 (7)
1981-1985 (1993)
27 Paul W Majsztrik M Barclay Satterfield Andrew B Bocarsly Jay B Benziger
J Membrane Sci 301 (2007) 93ndash106
28 T Takamatsu M Hashiyama A Eisenberg J Appl Polym Sci 24 (11) (1979)
2199ndash2220
29 DR Morris XD Sun J Appl Polym Sci 50 (8) (1993) 1445ndash1452
30 Shanhai Ge Xuguang Li Baolian Yi and I-Ming Hsing J Electrochem Soc
152 (6) A1149-A1157 (2005)
31 Adam Z Weber and John Newman J Electrochem Soc 151 (2) A311-A325
(2004)
30
32 Adam Z Weber and John Newman Chem Rev 2004 104 4679-4726
33 Timothy J Silverman Jeremy P Meyers and Joseph J Beaman J Electrochem
Soc 157 (10) B1376-B1381 (2010)
34 Halsey G White HJ Eyring H Text Res J 1945 v 15 p 295
35 M Gummalla VV Atrazhev AN Varyukhin and SF Burlatsky To be
published
36 P Choi and R Datta J Electrochem Soc 150 E601 (2003)
37 P de Gennes Scaling Concepts in Polymer Physics Cornell University Press
List of Tables
Table 1 Model parameters and experimental conditions
Parameter Description ValueSource
Operational conditions
Tcyc RH cycling time period 30 sec
RHmax Maximum relative humidity in cathode channel 100
RHmin Minimum relative humidity in cathode channel 10
T Cell temperature 78ordmC
Membrane properties
E(RHT) Youngrsquos modulus of the membrane [4]
)(aλ Membrane water content as a function of vapor
activity [mol H2Omol SO3] [36]
)(λD Diffusion coefficient of water in the membrane Fig5
31
α Dimension change coefficient 0004 (data from [4])
Tσ Fitting parameter (internal data fit to Eq 27) 17 MPa
0N Fitting parameter (internal data fit to Eq 27) 12middot106
β DMA to in-cell calibration parameter 23
Figure Captions
Figure 1 Schematic diagram showing the components of the model framework to predict
mechanical life of the membrane undergoing hydration cycles
Figure 2 (a) Polymer chain segment constrained by one entanglement and subjected to
the external force F (b) Potential energy of monomer in entanglement before applying
the force (in the left hand side of the Fig 2b) and after applying the force (in the right
hand side of the Fig 2b)
Figure 3 Schematic figure of membrane in fuel cell (counter-flow configuration)
constrained between two bi-polar plates (a) and crack formation (b) The wet fuel exits
from the anode gas channel (top channel) Initially wet air is fed into cathode gas
channel (bottom channel) When cathode side feed gas (air) is switched from wet to dry
cathode side of the membrane dehydrates and attempts to shrink The anode side of the
membrane remains wet and swollen
Figure 4 Fitting Tangs experimental data [7] (triangles) by equation (22) (solid line)
Fitting parameters values are σT=1 MPa and ε0=37sdot10-6
32
Figure 5 Dependence of diffusion coefficient in Nafion membrane on water content λ
(UTRC internal experimental data) There are not available data in range from 52=λ
to 15=λ so linear approximation is used in this region
Figure 6 Model prediction of dependence of RH on time and λ on time at the anode side
at the middle of the membrane and at the cathode side
Figure 7 Model prediction of stress as a function of time under RH cycling at the cathode
and at the anode sides of membrane
Figure 8 Model prediction of stress in quasi-steady-state regime at the cathode side at
the middle of the membrane and at the anode side
Figure 9 Calculated membrane lifetime (the number of cycles to failure) as a function of
minimal RH at the cathode side of membrane Anode side of membrane maintains 100
RH
33
Figures
Fuel cell RH distribution model
Operating conditionsinlet RH inlet Tcycling period
hydrationdehydration induced stress model
σ(t)Damage accrual model
Membrane Mechanical Degradation Model
Membrane propertiesE(RHT) ε∆λ DMA
ε(σNcycT) εcrit
Mechanical life-time
Fuel cell stack design
λ(t)
Figure 1
34
Figure 2
35
Figure 3
σ yy a)
b)
Crack formation
bi - polar plate
bi - polar plate
dry region
stress
y
x
σ yy a)
b)
Crack formation
bi - polar plate
bi - polar plate
dry air
wet fuel
σ yy a)
b)
Crack formation
bi - polar plate
bi - polar plate
dry region
stress
y
x
σ yy a)
b)
Crack formation
bi - polar plate
bi - polar plate
dry air
wet fuel
36
0
50
100
150
200
250
0 1 2 3 4 5 6 7
dud
N
Stress (MPa)
Figure 4
37
0
2
4
6
8
10
12
14
16
0 25 5 75 10 125 15
D1
0^-6
cm
^2s
λ
Figure 5
38
0
3
6
9
12
15
0 5 10 15 20 25 30 35 time s
000
2000
4000
6000
8000
10000
x=0 (Cathode side) x=h2 x=h (Anode side) RH
λ RH
Figure 6
39
-15
-1
-05
0
05
1
15
2
25
0 50 100 150 200 250 300
Time t
Str
ess
MP
a
x=0 (Cathode side)
x=h (Anode side)
Figure 7
40
-15
-1
-05
0
05
1
15
0 5 10 15 20 25 30 35
time s
Str
ess
MP
a
x=0 (Cathode side)x=h2x=h (Anode side)
a)
Figure 8
41
Life-time cycles
100E+05
100E+06
100E+07
100E+08
100E+09
0 02 04 06 08 1RH min
Figure 9

15
Here x is the through-membrane coordinate λeq(RH) is the equilibrium water content in
the membrane (an experimentally measured function of RH) RHC is the gas RH in the
cathode gas channel and RHA is the gas RH in the anode gas channel In the current
paper we utilize the following conventional diffusion equation with a water content
dependent diffusion coefficient to calculate water profile in the membrane
( ) 0=
partpart
partpartminus
partpart
xD
xt
λλλ (10)
Here D(λ) is the experimentally measured water diffusion coefficient in the membrane
(see Fig7 in Section VI) Initial conditions for equation (10) can be chosen arbitrarily
because after several cycles the membrane evolves to a new quasi-equilibrium state
governed by cyclic conditions and the initial state becomes irrelevant We chose the
initial conditions ( ) 00 λλ =x Solution of equation (10) with the boundary conditions (9)
gives the water distribution in the membrane λ(xyt) Below we calculate the membrane
stress at the membrane boundary adjacent to the air inlet (fixed coordinate y) where RH
cycling and stress amplitudes are maximal and limit membrane lifetime We start with a
calculation of the linear elastic response of the membrane to small changes in λ and
subsequently model the more general viscoelastic case
The macroscopic state of the membrane is determined by two parameters the membrane
length L0 and water content λ0 We assume that at equilibrium the stress in the
membrane is equal to zero The stress in the membrane can be generated by deviation of
the membrane length from equilibrium 0LLL minus=∆ at constant water content Also the
stress can be generated by deviation of water content from equilibrium
16
( ) ( ) 0 λλλ minus=∆ txtx in the geometrically constrained membrane (at constant length)
By analogy with linear elasticity theory with thermal expansion we calculate the linear
response of the membrane stress to small deviation from equilibrium as follows
( )( )txE yyyy λαεσ ∆minus= (11)
Here 0LLyy ∆=ε and E is the Young modulus of the membrane Swelling coefficient α
determines the length change ∆y of unconstrained (zero σ) membrane caused by the
change of the membrane water content ∆λ λα∆=∆ yy In 1D approximation the local
stress in the membrane depends on the change of the local membrane hydration (λ(xt)-
λ0)
In the membrane stress can be induced by changes in deformation water content and
simultaneous plastic relaxation The total rate of the stress change is the sum of the stress
change rate caused by membrane deformation and the stress change rate caused by the
change of membrane water content
λε
σσσttdt
d yyyyyy
partpart
+part
part= (12)
According to equation (11) the rate of the stress change induced by the change of the rate
of deviation of water content in constrained system with constant deformation and
without plastic relaxation is
dt
dE
tyy λα
σ
ε
∆=part
part (12a)
The second term in equation (12) is presented by equation (7)
17
minus=
partpart
T
Tyyyy
dt
dE
t σσ
τσεσ
λλ
sinh (12b)
Substituting equations (12a) and (12b) into the right hand side of equation (12) we obtain
the equation for the total rate of stress change in the membrane
( ) ( ) ( ) ( )
minus∆+
partpart
=T
yyTyyyy tx
dt
txdE
t
txE
dt
txd
σσ
τσλα
εσ
λ
sinh
(13)
The first term in the right hand side of equation (13) is equal to zero in a constrained
membrane Local water content λ(xt) is calculated by equation (10) with boundary
conditions (9) Equation (13) relates the stress in the membrane with water content in the
membrane for arbitrary RH cycling protocol
Equation (13) was solved numerically with parameters specified in the Table 1 The
calculated stress as a function of time is presented in Figure 7 The results indicate that
the membrane stress becomes a periodic function of time after several cycles if RH is a
periodic function of time To derive an analytical equation for the periodic stress we
utilize the separation of slow variable method The plastic (irreversible) deformation of
the membrane during one cycle is small because the cycling period is much smaller than
the membrane relaxation time Tcyc ltlt τ Therefore we can consider the membrane as an
elastic media during one cycle However the membrane slowly approaches a new
equilibrium state during each cycle After a long time t gtgt τ the membrane reaches the
new state with new equilibrium water content ( )xλ During the cycle λ oscillates below
and above ( )xλ At ( )xλλ = the membrane is not stressed The in-plane stress in the
18
periodical regime is driven by the deviation of λ from ( )xλ and is calculated by
following equation
( ) ( ) ( ) ( )( )xtxtxEtxyy λλασ minusminus= (14)
The stress averaged over time in the periodic regime is equal to zero for any x
Averaging (14) over time and taking advantage of the condition ( ) 0 =tyy txσ we
obtain the following expression for ( )xλ
( ) ( ) ( )( )
t
t
txE
txtxEx
λλ = (15)
Substituting (15) into (14) we obtain the final equation for the stress under periodic RH
cycling
( ) ( ) ( ) ( ) ( )( )
minusminus=
t
tyy txE
txtxEtxtxEtx
λλασ (16)
Substituting ( )txλ calculated from equation (10) with boundary conditions (9) into
equation (16) we calculate cyclic stress in the membrane
IV Damage accrual model
In this section we describe the model that calculates the membrane lifetime as a function
of applied cyclic stress Using the membrane stress model presented in Section III we
calculate the stress profile in the membrane ( )txyy σ for a given water content λ(xt)
We predict the membrane lifetime as a function of membrane stress using the damage
accrual model
19
The typical stress in the membrane under fuel cell operating conditions is much smaller
than the membrane tensile strength Many RH cycles are required to cause substantial
membrane damage However with each cycle the cyclic stress causes small irreversible
elongation ie plastic deformation of the membrane Accumulation of irreversible
elongation in the membrane causes membrane damage after a large number of cycles
Tang et al [7] experimentally studied Nafion111 membrane irreversible elongation under
cyclic stress They observed that irreversible elongation is accumulated over a large
number of cycles and causes damage of the membrane even at relatively small
amplitudes of cyclic stress They also demonstrated that at relatively small stress
σlt4MPa the membrane elongation rate is a linear function of applied stress magnitude
At larger stress amplitudes of about σ=65MPa the elongation rate rapidly increases We
speculate that such nonlinear dependence of elongation rate on stress amplitude is caused
by exponential dependence of the stress relaxation rate on the stress magnitude predicted
by extended Eyring model presented in Section III
The elongation of the membrane subjected to step-like cyclic stress is a function of the
stress amplitude σ and the cycle period Tcyc Applying equation (7) to the membrane
elongation during constant stress hold in one cycle we obtain
=
T
cycT
E
T
σσ
τσ
ε sinh1 (17)
Only a small fraction γ of this elongation is irreversible ie leads to membrane damage
In the current work we assume that γ depends only on cyclic period Tcyc and is
20
independent of σ Also we do not account for self-acceleration of membrane damage ie
we assume that irreversible elongation is proportional to the number of cycles N The
equation for irreversible elongation of the membrane per N cycles is
( )
=
T
NNσσεσε sinh 0 (18)
Here ε0 is
( )τγσ
εE
TT cyccycT=0 (19)
The elongation as a function of the stress and the number of cycles ε(σN) was measured
experimentally using Dynamic Mechanical Analysis (DMA) equipment for two specific
values of stress amplitude Because ε0 is proportional to an unknown parameter γ and
inversely proportional to another unknown parameter τ the lumped parameter ε0 was
used for fitting The model parameters ε0 and σT were fitted to DMA data The
membrane elongation for arbitrary stress amplitude σ was calculated from equation (18)
To validate equation (18) elongation per one stress cycle ε1(σ) was calculated from
Tangs experimental data [7] for Nafion111 membrane and plotted as a function of
applied stress σ see Fig 4 It follows from (18) that
( ) ( )
==
TdN
Nd
σσεσεσε sinh
01 (20)
The experimental data are in good agreement with the prediction of equation (20) with
σT=1 MPa and ε0=37sdot10-6 (Fig 4)
21
Membrane failure occurs after a critical irreversible elongation (damage) εcrit is
accumulated The number of cycles to failure Ncrit is calculated from the following
condition
( ) critcritN εσε =1 (21)
We assume that εcrit does not depend on stress amplitude and frequency and can be
measured once at a specific stress in a DMA test The number of cycles to failure NDMA
in out-off-cell tests is calculated by equation
( )Tcrit
NN
σσsinh0= (22)
( )cyccycT
critcrit
TT
EN
γστε
εε ==
00 (23)
We use N0 as a lumped fitting parameter obtained from a DMA test To obtain the values
of N0 and σT we performed stress cycling for two stress amplitudes σ and fitted the
experimental number of cycles to failure Ncrit by equation (22) Equation (22) predicts
membrane lifetime in a DMA test with arbitrary stress amplitude σ using the obtained
values of N0 and σT from experimental data Analytical dependence of these parameters
on temperature and RH will be published later
Fuel cell conditions under RH cycling differ from DMA test conditions because in DMA
testing the stress is uniformly distributed through the membrane cross-section while in
the cell the stress in the membrane changes substantially from the anode to the cathode
side We incorporated calibration parameter β into the current version of the model in
order to use equation (22) for in-cell membrane lifetime prediction This parameter is
used for renormalization of stress The membrane damage in DMA testing with stress
22
amplitude σ is equivalent to membrane damage in a fuel cell stack when the membrane is
subjected to RH cycling that cause a stress amplitude of βσ
To obtain the calibration parameter β we performed a single RH cycling experiment in a
fuel cell up to membrane failure for particular conditions and measured the experimental
membrane lifetime Ncell Using the membrane stress model we calculated the stress
amplitude σmax for these particular conditions Parameter β is calculated from the
following equation
( )Tcell
NN
σβσ max
0
sinh= (24)
Using the parameters N0 and σT obtained from fitting DMA data by equation (22) and
the parameter β obtained from the in-cell test we predict the in-cell membrane lifetime
under arbitrary RH cycling conditions
V Model parameters
In this section we present input model parameter values and experimental data for a
GORE-SELECTreg membrane in a PRIMEAreg MEA In RH cycling experiments
hydrogen with 100 RH was fed to the anode channel Air fed to the cathode channel
was cycled from RHmax to RHmin with equal time intervals Experimental conditions are
summarized in Table 1 Mechanical properties of GORE-SELECT membranes were
obtained from available literature and summarized in Table 1 DMA tests required for
model calibration were also performed
23
VI Model results
In this section we report the result of modeling of GORE-SELECT membrane damage
and lifetime under in-cell RH cycling conditions The model components ie fuel cell
model membrane stress model and stress accrual model were incorporated into the
MATLAB code The model parameters and test conditions are summarized in Section V
The relative humidity variation in the cathode gas channel during the cycle was
calculated from the fuel cell model and used as the input for the membrane stress model
The calculated relative humidity variation is shown in Fig6 The function with fast
exponential relaxation was used instead of step-wise function for better convergence of
the numerical solution The calculated dependence of λ on time at three points across
the membrane (at the cathode side at the middle of the membrane and at the anode side)
is also shown in Fig6 This dependence is calculated from water diffusion equation in
the membrane (10) with boundary conditions (9) and initial condition ( ) 110 =xλ
Figure 9 indicates that the membrane water content λ(t) follows the humidity cycle RH(t)
There is no time lag because water diffusion time in the membrane sD
htdif 20
2
asymp= is
much smaller than cycling period Tcyc=30s Here h=18 microm is membrane thickness and
D=0510-6 cm2s is the average water diffusion coefficient in the membrane
Water content in the membrane )( txλ is utilized in the membrane stress model to
predict the stress )( txσ distribution in the membrane The model prediction of the
stress in the membrane by equation (13) as a function of time is shown in Fig7 at the
24
cathode and anode sides of the membrane The membrane reaches quasi-steady state
regime after t gtgt τ and stress becomes a periodic function of time oscillating around the
equilibrium value The model prediction for the stress in the periodic regime as a
function of time calculated by equation (16) is shown in Fig8 Maximal stress is
imposed in the region with maximal humidity variation ie at the cathode side of the
membrane At the anode side of the membrane the stress is equal to zero because there is
no humidity cycling One can see that the stress calculated by equation (13) at large time
is in good agreement with the periodic stress shown in Fig8 calculated analytically from
equation (16)
Figures 7 and 8 indicate that after time t larger than relaxation time τ the stress at the
cathode sides oscillates around the equilibrium stress 0=eqσ The membrane at the
cathode side is subjected to tensile stress when ( ) ( )00 =lt xt λλ and to compressive
stress when ( ) ( )00 =gt xt λλ
The maximal value of the stress calculated by the membrane stress model is used in the
damage accrual model to predict membrane lifetime by equation (24) As discussed in
Section IV this equation contains three unknown parameters σT N0 and β Parameters
σT and N0 are calculated by fitting UTC POWER DMA data by equation (22)
Calibration parameter β is calculated from an in-cell lifetime experiment under specific
RH cycling conditions The in-cell membrane stress was calculated by the membrane
stress model
25
Using the model parameters calculated from DMA testing and in-cell RH cycling we
predicted GORE-SELECT membrane lifetime under arbitrary RH cycling conditions
Predicted membrane lifetime (number of cycles to failure) as a function of minimal RH in
the cathode gas channel RHmin is plotted in Fig 9 The anode gas humidity was
assumed to be 100 The maximal RH in the cathode gas channel RHmax of 100 was
also assumed At high RH cycling amplitude (low RHmin) the model predicts exponential
decrease of membrane lifetime with increase of RH cycling amplitude Stress amplitude
is approximately proportional to RH cycling amplitude and the number of cycles to
failure depends exponentially on the stress for large stress according to equation (22)
This results in exponential dependence of the membrane lifetime on RH cycling
amplitude for large values of amplitude (small value of RHmin)
VII Conclusions
A modeling framework was developed that predicts the lifetime of PEM fuel cell
membranes subjected to hydration cycling The developed model predicts membrane
lifetime as a function of RH cycling amplitude and membrane mechanical properties
Membrane failure in the fuel cell is caused by damage accumulation under cyclic stress in
the membrane subjected to cyclic hydrationdehydration A fuel cell membrane is
typically subjected to hydrationdehydration under fuel cell conditions One side of the
membrane dehydrates and attempts to shrink when the feed gas (air) is switched from wet
to dry in the cathode gas channel Mechanical constraints imposed by bipolar plates
prevent the membrane from shrinking This causes in-plane tensile stress in the
membrane Tensile stress causes a crack formation at RH cycled side of the membrane
26
(Fig 3) Further propagation of the crack in the through-plane direction causes
membrane mechanical failure
The modeling framework consists of three components a model of RH distribution in gas
channels a membrane stress model and a damage accrual model Several models of RH
distribution in gas channels are available in literature [8 9 10 11 and 12] and we do not
discuss this model component in the current paper In the current version of the model
we assume equilibrium of water in the membrane with the vapor at the membranegas
interface and use the conventional diffusion equation for calculation of water content in
the membrane bulk with the water diffusion coefficient dependent on water content D(λ)
The membrane stress model calculates the stress in the membrane caused by membrane
cyclic swellingshrinking under RH cycling conditions The local stress in the membrane
is caused by the change in the local hydration level The damage accrual model predicts
the number of cycles to failure for the membrane under applied cyclic stress The input
for the damage accrual model is a maximal stress in the membrane calculated by the
membrane stress model and experimental membrane lifetimes in DMA tests for two
cycling amplitudes The current version of the model also contains one calibration
parameter obtained from an in-cell RH cycling experiment with specific RH cycling
conditions
The model was utilized for in-cell lifetime predictions of GORE-SELECT membranes
The membrane mechanical properties and swelling coefficient were obtained from the
literature DMA testing and in-cell RH cycling were carried out at UTC Power After
27
calibration the model predicts membrane lifetime in fuel cells under arbitrary RH cycling
conditions The calculated membrane lifetime (number of cycles to failure) as a function
of minimal RH in cathode gas channel RHmin is plotted in Fig 9 At high RH cycling
amplitude (low RHmin) the model predicts exponential decrease of membrane lifetime
with increase of RH cycling amplitude Stress amplitude is approximately proportional
to RH cycling amplitude and the number of cycles to failure depends exponentially on
stress for large stress magnitude according to equation (22) This results in exponential
dependence of membrane lifetime on RH cycling amplitude for large values of amplitude
(small value of RHmin)
Acknowledgement
This work was supported by the US Department of Energy under the grant DE-PS36-
08GO98009
References
1 Ho Lee Taehee Kim Woojong Sim Saehoon Kim Byungki Ahn Taewon Lim
and Kwonpil Park Korean J Chem Eng 28(2) 487-491 (2011)
2 Xinyu Huang Roham Solasi Yue Zou Matthew Feshler Kenneth Reifsnider
David Condit Sergei Burlatsky Thomas Madden Journal of Polymer Science
Part B 44 (16) p 2346ndash2357 (2006)
3 Yaliang Tang Anette M Karlsson Michael H Santare Michael Gilbert Simon
Cleghorn William B Johnson Materials Science and Engineering A 425 (2006)
297ndash304
28
4 Yaliang Tang Ahmet Kusoglu Anette M Karlsson Michael H Santare Simon
Cleghorn William B Johnson Journal of Power Sources 175 (2008) 817ndash825
5 A Kusoglu A M Karlsson M H Santare S Cleghorn W B Johnson Journal
of Power Sources 161 987-996 (2006)
6 A Kusoglu A M Karlsson M H Santare Simon Cleghorn W B Johnson
Journal of Power Sources 170 345-358 (2007)
7 Haolin Tang Shen Peikang San Ping Jiang Fang Wang Mu Pan Journal of
Power Sources 170 (2007) 85ndash92
8 T F Fuller and J Newman J Electrochem Soc 140 (5) 1218-1225 (1993)
9 T V Nguyen and R E White J Electrochem Soc 140 (8) 2178-2186 (1993)
10 J S Yi and T V Nguyen J Electrochem Soc 145 (4) 1149-1159 (1998)
11 T E Springer T A Zawodzinski and S Gottesfeld J Electrochem Soc 138 (8)
2334-2342 (1991)
12 A Z Weber R M Darling and J Newman J Electrochem Soc 151 (10)
A1715-A1727 (2004)
13 L Boltzmann Pogg Ann u Chem 7 624 (1876)
14 S Turner Polymer Eng a Sci 6 306 (1966)
15 W N Findley and G Khosla J Appl Phys 26 821 (1955)
16 K van Holde J Polymer Sci 24 417 (1957)
17 T L Smith Trans Soc Rheol 6 61 (1962)
18 H Leaderman Trans Soc Rheol 6 361 (1962)
19 I M Ward and E T Onat J Mech Phys Solids 11 217 (1963)
29
20 Roham Solasi Yue Zou Xinyu Huang Kenneth Reifsnider Mech Time-Depend
Mater 12 15ndash30 (2008)
21 Paul W Majsztrik Andrew B Bocarsly and Jay B Benziger Macromolecules
41 9849-9862 (2008)
22 F Bauer S Denneler M Willert-Porada Journal of Polymer Science Part B
Polymer Physics Vol 43 786ndash795 (2005)
23 Kirt A Page Kevin M Cable and Robert B Moore Macromolecules 2005 38
6472-6484
24 Gierke T D Munn G E Wilson F C J Polym Sci Polym Phys Ed 1981 19
1687ndash1704
25 Hsu W Y Gierke T D J Membrane Sci 1983 13 307ndash326
26 Thomas A Zawodzinski Thomas E Spriner John Davey Roger Jestel Cruz
Lopez Judith Valerio and Shimshon Gottesfeld J Electrochem Soc 140 (7)
1981-1985 (1993)
27 Paul W Majsztrik M Barclay Satterfield Andrew B Bocarsly Jay B Benziger
J Membrane Sci 301 (2007) 93ndash106
28 T Takamatsu M Hashiyama A Eisenberg J Appl Polym Sci 24 (11) (1979)
2199ndash2220
29 DR Morris XD Sun J Appl Polym Sci 50 (8) (1993) 1445ndash1452
30 Shanhai Ge Xuguang Li Baolian Yi and I-Ming Hsing J Electrochem Soc
152 (6) A1149-A1157 (2005)
31 Adam Z Weber and John Newman J Electrochem Soc 151 (2) A311-A325
(2004)
30
32 Adam Z Weber and John Newman Chem Rev 2004 104 4679-4726
33 Timothy J Silverman Jeremy P Meyers and Joseph J Beaman J Electrochem
Soc 157 (10) B1376-B1381 (2010)
34 Halsey G White HJ Eyring H Text Res J 1945 v 15 p 295
35 M Gummalla VV Atrazhev AN Varyukhin and SF Burlatsky To be
published
36 P Choi and R Datta J Electrochem Soc 150 E601 (2003)
37 P de Gennes Scaling Concepts in Polymer Physics Cornell University Press
List of Tables
Table 1 Model parameters and experimental conditions
Parameter Description ValueSource
Operational conditions
Tcyc RH cycling time period 30 sec
RHmax Maximum relative humidity in cathode channel 100
RHmin Minimum relative humidity in cathode channel 10
T Cell temperature 78ordmC
Membrane properties
E(RHT) Youngrsquos modulus of the membrane [4]
)(aλ Membrane water content as a function of vapor
activity [mol H2Omol SO3] [36]
)(λD Diffusion coefficient of water in the membrane Fig5
31
α Dimension change coefficient 0004 (data from [4])
Tσ Fitting parameter (internal data fit to Eq 27) 17 MPa
0N Fitting parameter (internal data fit to Eq 27) 12middot106
β DMA to in-cell calibration parameter 23
Figure Captions
Figure 1 Schematic diagram showing the components of the model framework to predict
mechanical life of the membrane undergoing hydration cycles
Figure 2 (a) Polymer chain segment constrained by one entanglement and subjected to
the external force F (b) Potential energy of monomer in entanglement before applying
the force (in the left hand side of the Fig 2b) and after applying the force (in the right
hand side of the Fig 2b)
Figure 3 Schematic figure of membrane in fuel cell (counter-flow configuration)
constrained between two bi-polar plates (a) and crack formation (b) The wet fuel exits
from the anode gas channel (top channel) Initially wet air is fed into cathode gas
channel (bottom channel) When cathode side feed gas (air) is switched from wet to dry
cathode side of the membrane dehydrates and attempts to shrink The anode side of the
membrane remains wet and swollen
Figure 4 Fitting Tangs experimental data [7] (triangles) by equation (22) (solid line)
Fitting parameters values are σT=1 MPa and ε0=37sdot10-6
32
Figure 5 Dependence of diffusion coefficient in Nafion membrane on water content λ
(UTRC internal experimental data) There are not available data in range from 52=λ
to 15=λ so linear approximation is used in this region
Figure 6 Model prediction of dependence of RH on time and λ on time at the anode side
at the middle of the membrane and at the cathode side
Figure 7 Model prediction of stress as a function of time under RH cycling at the cathode
and at the anode sides of membrane
Figure 8 Model prediction of stress in quasi-steady-state regime at the cathode side at
the middle of the membrane and at the anode side
Figure 9 Calculated membrane lifetime (the number of cycles to failure) as a function of
minimal RH at the cathode side of membrane Anode side of membrane maintains 100
RH
33
Figures
Fuel cell RH distribution model
Operating conditionsinlet RH inlet Tcycling period
hydrationdehydration induced stress model
σ(t)Damage accrual model
Membrane Mechanical Degradation Model
Membrane propertiesE(RHT) ε∆λ DMA
ε(σNcycT) εcrit
Mechanical life-time
Fuel cell stack design
λ(t)
Figure 1
34
Figure 2
35
Figure 3
σ yy a)
b)
Crack formation
bi - polar plate
bi - polar plate
dry region
stress
y
x
σ yy a)
b)
Crack formation
bi - polar plate
bi - polar plate
dry air
wet fuel
σ yy a)
b)
Crack formation
bi - polar plate
bi - polar plate
dry region
stress
y
x
σ yy a)
b)
Crack formation
bi - polar plate
bi - polar plate
dry air
wet fuel
36
0
50
100
150
200
250
0 1 2 3 4 5 6 7
dud
N
Stress (MPa)
Figure 4
37
0
2
4
6
8
10
12
14
16
0 25 5 75 10 125 15
D1
0^-6
cm
^2s
λ
Figure 5
38
0
3
6
9
12
15
0 5 10 15 20 25 30 35 time s
000
2000
4000
6000
8000
10000
x=0 (Cathode side) x=h2 x=h (Anode side) RH
λ RH
Figure 6
39
-15
-1
-05
0
05
1
15
2
25
0 50 100 150 200 250 300
Time t
Str
ess
MP
a
x=0 (Cathode side)
x=h (Anode side)
Figure 7
40
-15
-1
-05
0
05
1
15
0 5 10 15 20 25 30 35
time s
Str
ess
MP
a
x=0 (Cathode side)x=h2x=h (Anode side)
a)
Figure 8
41
Life-time cycles
100E+05
100E+06
100E+07
100E+08
100E+09
0 02 04 06 08 1RH min
Figure 9

16
( ) ( ) 0 λλλ minus=∆ txtx in the geometrically constrained membrane (at constant length)
By analogy with linear elasticity theory with thermal expansion we calculate the linear
response of the membrane stress to small deviation from equilibrium as follows
( )( )txE yyyy λαεσ ∆minus= (11)
Here 0LLyy ∆=ε and E is the Young modulus of the membrane Swelling coefficient α
determines the length change ∆y of unconstrained (zero σ) membrane caused by the
change of the membrane water content ∆λ λα∆=∆ yy In 1D approximation the local
stress in the membrane depends on the change of the local membrane hydration (λ(xt)-
λ0)
In the membrane stress can be induced by changes in deformation water content and
simultaneous plastic relaxation The total rate of the stress change is the sum of the stress
change rate caused by membrane deformation and the stress change rate caused by the
change of membrane water content
λε
σσσttdt
d yyyyyy
partpart
+part
part= (12)
According to equation (11) the rate of the stress change induced by the change of the rate
of deviation of water content in constrained system with constant deformation and
without plastic relaxation is
dt
dE
tyy λα
σ
ε
∆=part
part (12a)
The second term in equation (12) is presented by equation (7)
17
minus=
partpart
T
Tyyyy
dt
dE
t σσ
τσεσ
λλ
sinh (12b)
Substituting equations (12a) and (12b) into the right hand side of equation (12) we obtain
the equation for the total rate of stress change in the membrane
( ) ( ) ( ) ( )
minus∆+
partpart
=T
yyTyyyy tx
dt
txdE
t
txE
dt
txd
σσ
τσλα
εσ
λ
sinh
(13)
The first term in the right hand side of equation (13) is equal to zero in a constrained
membrane Local water content λ(xt) is calculated by equation (10) with boundary
conditions (9) Equation (13) relates the stress in the membrane with water content in the
membrane for arbitrary RH cycling protocol
Equation (13) was solved numerically with parameters specified in the Table 1 The
calculated stress as a function of time is presented in Figure 7 The results indicate that
the membrane stress becomes a periodic function of time after several cycles if RH is a
periodic function of time To derive an analytical equation for the periodic stress we
utilize the separation of slow variable method The plastic (irreversible) deformation of
the membrane during one cycle is small because the cycling period is much smaller than
the membrane relaxation time Tcyc ltlt τ Therefore we can consider the membrane as an
elastic media during one cycle However the membrane slowly approaches a new
equilibrium state during each cycle After a long time t gtgt τ the membrane reaches the
new state with new equilibrium water content ( )xλ During the cycle λ oscillates below
and above ( )xλ At ( )xλλ = the membrane is not stressed The in-plane stress in the
18
periodical regime is driven by the deviation of λ from ( )xλ and is calculated by
following equation
( ) ( ) ( ) ( )( )xtxtxEtxyy λλασ minusminus= (14)
The stress averaged over time in the periodic regime is equal to zero for any x
Averaging (14) over time and taking advantage of the condition ( ) 0 =tyy txσ we
obtain the following expression for ( )xλ
( ) ( ) ( )( )
t
t
txE
txtxEx
λλ = (15)
Substituting (15) into (14) we obtain the final equation for the stress under periodic RH
cycling
( ) ( ) ( ) ( ) ( )( )
minusminus=
t
tyy txE
txtxEtxtxEtx
λλασ (16)
Substituting ( )txλ calculated from equation (10) with boundary conditions (9) into
equation (16) we calculate cyclic stress in the membrane
IV Damage accrual model
In this section we describe the model that calculates the membrane lifetime as a function
of applied cyclic stress Using the membrane stress model presented in Section III we
calculate the stress profile in the membrane ( )txyy σ for a given water content λ(xt)
We predict the membrane lifetime as a function of membrane stress using the damage
accrual model
19
The typical stress in the membrane under fuel cell operating conditions is much smaller
than the membrane tensile strength Many RH cycles are required to cause substantial
membrane damage However with each cycle the cyclic stress causes small irreversible
elongation ie plastic deformation of the membrane Accumulation of irreversible
elongation in the membrane causes membrane damage after a large number of cycles
Tang et al [7] experimentally studied Nafion111 membrane irreversible elongation under
cyclic stress They observed that irreversible elongation is accumulated over a large
number of cycles and causes damage of the membrane even at relatively small
amplitudes of cyclic stress They also demonstrated that at relatively small stress
σlt4MPa the membrane elongation rate is a linear function of applied stress magnitude
At larger stress amplitudes of about σ=65MPa the elongation rate rapidly increases We
speculate that such nonlinear dependence of elongation rate on stress amplitude is caused
by exponential dependence of the stress relaxation rate on the stress magnitude predicted
by extended Eyring model presented in Section III
The elongation of the membrane subjected to step-like cyclic stress is a function of the
stress amplitude σ and the cycle period Tcyc Applying equation (7) to the membrane
elongation during constant stress hold in one cycle we obtain
=
T
cycT
E
T
σσ
τσ
ε sinh1 (17)
Only a small fraction γ of this elongation is irreversible ie leads to membrane damage
In the current work we assume that γ depends only on cyclic period Tcyc and is
20
independent of σ Also we do not account for self-acceleration of membrane damage ie
we assume that irreversible elongation is proportional to the number of cycles N The
equation for irreversible elongation of the membrane per N cycles is
( )
=
T
NNσσεσε sinh 0 (18)
Here ε0 is
( )τγσ
εE
TT cyccycT=0 (19)
The elongation as a function of the stress and the number of cycles ε(σN) was measured
experimentally using Dynamic Mechanical Analysis (DMA) equipment for two specific
values of stress amplitude Because ε0 is proportional to an unknown parameter γ and
inversely proportional to another unknown parameter τ the lumped parameter ε0 was
used for fitting The model parameters ε0 and σT were fitted to DMA data The
membrane elongation for arbitrary stress amplitude σ was calculated from equation (18)
To validate equation (18) elongation per one stress cycle ε1(σ) was calculated from
Tangs experimental data [7] for Nafion111 membrane and plotted as a function of
applied stress σ see Fig 4 It follows from (18) that
( ) ( )
==
TdN
Nd
σσεσεσε sinh
01 (20)
The experimental data are in good agreement with the prediction of equation (20) with
σT=1 MPa and ε0=37sdot10-6 (Fig 4)
21
Membrane failure occurs after a critical irreversible elongation (damage) εcrit is
accumulated The number of cycles to failure Ncrit is calculated from the following
condition
( ) critcritN εσε =1 (21)
We assume that εcrit does not depend on stress amplitude and frequency and can be
measured once at a specific stress in a DMA test The number of cycles to failure NDMA
in out-off-cell tests is calculated by equation
( )Tcrit
NN
σσsinh0= (22)
( )cyccycT
critcrit
TT
EN
γστε
εε ==
00 (23)
We use N0 as a lumped fitting parameter obtained from a DMA test To obtain the values
of N0 and σT we performed stress cycling for two stress amplitudes σ and fitted the
experimental number of cycles to failure Ncrit by equation (22) Equation (22) predicts
membrane lifetime in a DMA test with arbitrary stress amplitude σ using the obtained
values of N0 and σT from experimental data Analytical dependence of these parameters
on temperature and RH will be published later
Fuel cell conditions under RH cycling differ from DMA test conditions because in DMA
testing the stress is uniformly distributed through the membrane cross-section while in
the cell the stress in the membrane changes substantially from the anode to the cathode
side We incorporated calibration parameter β into the current version of the model in
order to use equation (22) for in-cell membrane lifetime prediction This parameter is
used for renormalization of stress The membrane damage in DMA testing with stress
22
amplitude σ is equivalent to membrane damage in a fuel cell stack when the membrane is
subjected to RH cycling that cause a stress amplitude of βσ
To obtain the calibration parameter β we performed a single RH cycling experiment in a
fuel cell up to membrane failure for particular conditions and measured the experimental
membrane lifetime Ncell Using the membrane stress model we calculated the stress
amplitude σmax for these particular conditions Parameter β is calculated from the
following equation
( )Tcell
NN
σβσ max
0
sinh= (24)
Using the parameters N0 and σT obtained from fitting DMA data by equation (22) and
the parameter β obtained from the in-cell test we predict the in-cell membrane lifetime
under arbitrary RH cycling conditions
V Model parameters
In this section we present input model parameter values and experimental data for a
GORE-SELECTreg membrane in a PRIMEAreg MEA In RH cycling experiments
hydrogen with 100 RH was fed to the anode channel Air fed to the cathode channel
was cycled from RHmax to RHmin with equal time intervals Experimental conditions are
summarized in Table 1 Mechanical properties of GORE-SELECT membranes were
obtained from available literature and summarized in Table 1 DMA tests required for
model calibration were also performed
23
VI Model results
In this section we report the result of modeling of GORE-SELECT membrane damage
and lifetime under in-cell RH cycling conditions The model components ie fuel cell
model membrane stress model and stress accrual model were incorporated into the
MATLAB code The model parameters and test conditions are summarized in Section V
The relative humidity variation in the cathode gas channel during the cycle was
calculated from the fuel cell model and used as the input for the membrane stress model
The calculated relative humidity variation is shown in Fig6 The function with fast
exponential relaxation was used instead of step-wise function for better convergence of
the numerical solution The calculated dependence of λ on time at three points across
the membrane (at the cathode side at the middle of the membrane and at the anode side)
is also shown in Fig6 This dependence is calculated from water diffusion equation in
the membrane (10) with boundary conditions (9) and initial condition ( ) 110 =xλ
Figure 9 indicates that the membrane water content λ(t) follows the humidity cycle RH(t)
There is no time lag because water diffusion time in the membrane sD
htdif 20
2
asymp= is
much smaller than cycling period Tcyc=30s Here h=18 microm is membrane thickness and
D=0510-6 cm2s is the average water diffusion coefficient in the membrane
Water content in the membrane )( txλ is utilized in the membrane stress model to
predict the stress )( txσ distribution in the membrane The model prediction of the
stress in the membrane by equation (13) as a function of time is shown in Fig7 at the
24
cathode and anode sides of the membrane The membrane reaches quasi-steady state
regime after t gtgt τ and stress becomes a periodic function of time oscillating around the
equilibrium value The model prediction for the stress in the periodic regime as a
function of time calculated by equation (16) is shown in Fig8 Maximal stress is
imposed in the region with maximal humidity variation ie at the cathode side of the
membrane At the anode side of the membrane the stress is equal to zero because there is
no humidity cycling One can see that the stress calculated by equation (13) at large time
is in good agreement with the periodic stress shown in Fig8 calculated analytically from
equation (16)
Figures 7 and 8 indicate that after time t larger than relaxation time τ the stress at the
cathode sides oscillates around the equilibrium stress 0=eqσ The membrane at the
cathode side is subjected to tensile stress when ( ) ( )00 =lt xt λλ and to compressive
stress when ( ) ( )00 =gt xt λλ
The maximal value of the stress calculated by the membrane stress model is used in the
damage accrual model to predict membrane lifetime by equation (24) As discussed in
Section IV this equation contains three unknown parameters σT N0 and β Parameters
σT and N0 are calculated by fitting UTC POWER DMA data by equation (22)
Calibration parameter β is calculated from an in-cell lifetime experiment under specific
RH cycling conditions The in-cell membrane stress was calculated by the membrane
stress model
25
Using the model parameters calculated from DMA testing and in-cell RH cycling we
predicted GORE-SELECT membrane lifetime under arbitrary RH cycling conditions
Predicted membrane lifetime (number of cycles to failure) as a function of minimal RH in
the cathode gas channel RHmin is plotted in Fig 9 The anode gas humidity was
assumed to be 100 The maximal RH in the cathode gas channel RHmax of 100 was
also assumed At high RH cycling amplitude (low RHmin) the model predicts exponential
decrease of membrane lifetime with increase of RH cycling amplitude Stress amplitude
is approximately proportional to RH cycling amplitude and the number of cycles to
failure depends exponentially on the stress for large stress according to equation (22)
This results in exponential dependence of the membrane lifetime on RH cycling
amplitude for large values of amplitude (small value of RHmin)
VII Conclusions
A modeling framework was developed that predicts the lifetime of PEM fuel cell
membranes subjected to hydration cycling The developed model predicts membrane
lifetime as a function of RH cycling amplitude and membrane mechanical properties
Membrane failure in the fuel cell is caused by damage accumulation under cyclic stress in
the membrane subjected to cyclic hydrationdehydration A fuel cell membrane is
typically subjected to hydrationdehydration under fuel cell conditions One side of the
membrane dehydrates and attempts to shrink when the feed gas (air) is switched from wet
to dry in the cathode gas channel Mechanical constraints imposed by bipolar plates
prevent the membrane from shrinking This causes in-plane tensile stress in the
membrane Tensile stress causes a crack formation at RH cycled side of the membrane
26
(Fig 3) Further propagation of the crack in the through-plane direction causes
membrane mechanical failure
The modeling framework consists of three components a model of RH distribution in gas
channels a membrane stress model and a damage accrual model Several models of RH
distribution in gas channels are available in literature [8 9 10 11 and 12] and we do not
discuss this model component in the current paper In the current version of the model
we assume equilibrium of water in the membrane with the vapor at the membranegas
interface and use the conventional diffusion equation for calculation of water content in
the membrane bulk with the water diffusion coefficient dependent on water content D(λ)
The membrane stress model calculates the stress in the membrane caused by membrane
cyclic swellingshrinking under RH cycling conditions The local stress in the membrane
is caused by the change in the local hydration level The damage accrual model predicts
the number of cycles to failure for the membrane under applied cyclic stress The input
for the damage accrual model is a maximal stress in the membrane calculated by the
membrane stress model and experimental membrane lifetimes in DMA tests for two
cycling amplitudes The current version of the model also contains one calibration
parameter obtained from an in-cell RH cycling experiment with specific RH cycling
conditions
The model was utilized for in-cell lifetime predictions of GORE-SELECT membranes
The membrane mechanical properties and swelling coefficient were obtained from the
literature DMA testing and in-cell RH cycling were carried out at UTC Power After
27
calibration the model predicts membrane lifetime in fuel cells under arbitrary RH cycling
conditions The calculated membrane lifetime (number of cycles to failure) as a function
of minimal RH in cathode gas channel RHmin is plotted in Fig 9 At high RH cycling
amplitude (low RHmin) the model predicts exponential decrease of membrane lifetime
with increase of RH cycling amplitude Stress amplitude is approximately proportional
to RH cycling amplitude and the number of cycles to failure depends exponentially on
stress for large stress magnitude according to equation (22) This results in exponential
dependence of membrane lifetime on RH cycling amplitude for large values of amplitude
(small value of RHmin)
Acknowledgement
This work was supported by the US Department of Energy under the grant DE-PS36-
08GO98009
References
1 Ho Lee Taehee Kim Woojong Sim Saehoon Kim Byungki Ahn Taewon Lim
and Kwonpil Park Korean J Chem Eng 28(2) 487-491 (2011)
2 Xinyu Huang Roham Solasi Yue Zou Matthew Feshler Kenneth Reifsnider
David Condit Sergei Burlatsky Thomas Madden Journal of Polymer Science
Part B 44 (16) p 2346ndash2357 (2006)
3 Yaliang Tang Anette M Karlsson Michael H Santare Michael Gilbert Simon
Cleghorn William B Johnson Materials Science and Engineering A 425 (2006)
297ndash304
28
4 Yaliang Tang Ahmet Kusoglu Anette M Karlsson Michael H Santare Simon
Cleghorn William B Johnson Journal of Power Sources 175 (2008) 817ndash825
5 A Kusoglu A M Karlsson M H Santare S Cleghorn W B Johnson Journal
of Power Sources 161 987-996 (2006)
6 A Kusoglu A M Karlsson M H Santare Simon Cleghorn W B Johnson
Journal of Power Sources 170 345-358 (2007)
7 Haolin Tang Shen Peikang San Ping Jiang Fang Wang Mu Pan Journal of
Power Sources 170 (2007) 85ndash92
8 T F Fuller and J Newman J Electrochem Soc 140 (5) 1218-1225 (1993)
9 T V Nguyen and R E White J Electrochem Soc 140 (8) 2178-2186 (1993)
10 J S Yi and T V Nguyen J Electrochem Soc 145 (4) 1149-1159 (1998)
11 T E Springer T A Zawodzinski and S Gottesfeld J Electrochem Soc 138 (8)
2334-2342 (1991)
12 A Z Weber R M Darling and J Newman J Electrochem Soc 151 (10)
A1715-A1727 (2004)
13 L Boltzmann Pogg Ann u Chem 7 624 (1876)
14 S Turner Polymer Eng a Sci 6 306 (1966)
15 W N Findley and G Khosla J Appl Phys 26 821 (1955)
16 K van Holde J Polymer Sci 24 417 (1957)
17 T L Smith Trans Soc Rheol 6 61 (1962)
18 H Leaderman Trans Soc Rheol 6 361 (1962)
19 I M Ward and E T Onat J Mech Phys Solids 11 217 (1963)
29
20 Roham Solasi Yue Zou Xinyu Huang Kenneth Reifsnider Mech Time-Depend
Mater 12 15ndash30 (2008)
21 Paul W Majsztrik Andrew B Bocarsly and Jay B Benziger Macromolecules
41 9849-9862 (2008)
22 F Bauer S Denneler M Willert-Porada Journal of Polymer Science Part B
Polymer Physics Vol 43 786ndash795 (2005)
23 Kirt A Page Kevin M Cable and Robert B Moore Macromolecules 2005 38
6472-6484
24 Gierke T D Munn G E Wilson F C J Polym Sci Polym Phys Ed 1981 19
1687ndash1704
25 Hsu W Y Gierke T D J Membrane Sci 1983 13 307ndash326
26 Thomas A Zawodzinski Thomas E Spriner John Davey Roger Jestel Cruz
Lopez Judith Valerio and Shimshon Gottesfeld J Electrochem Soc 140 (7)
1981-1985 (1993)
27 Paul W Majsztrik M Barclay Satterfield Andrew B Bocarsly Jay B Benziger
J Membrane Sci 301 (2007) 93ndash106
28 T Takamatsu M Hashiyama A Eisenberg J Appl Polym Sci 24 (11) (1979)
2199ndash2220
29 DR Morris XD Sun J Appl Polym Sci 50 (8) (1993) 1445ndash1452
30 Shanhai Ge Xuguang Li Baolian Yi and I-Ming Hsing J Electrochem Soc
152 (6) A1149-A1157 (2005)
31 Adam Z Weber and John Newman J Electrochem Soc 151 (2) A311-A325
(2004)
30
32 Adam Z Weber and John Newman Chem Rev 2004 104 4679-4726
33 Timothy J Silverman Jeremy P Meyers and Joseph J Beaman J Electrochem
Soc 157 (10) B1376-B1381 (2010)
34 Halsey G White HJ Eyring H Text Res J 1945 v 15 p 295
35 M Gummalla VV Atrazhev AN Varyukhin and SF Burlatsky To be
published
36 P Choi and R Datta J Electrochem Soc 150 E601 (2003)
37 P de Gennes Scaling Concepts in Polymer Physics Cornell University Press
List of Tables
Table 1 Model parameters and experimental conditions
Parameter Description ValueSource
Operational conditions
Tcyc RH cycling time period 30 sec
RHmax Maximum relative humidity in cathode channel 100
RHmin Minimum relative humidity in cathode channel 10
T Cell temperature 78ordmC
Membrane properties
E(RHT) Youngrsquos modulus of the membrane [4]
)(aλ Membrane water content as a function of vapor
activity [mol H2Omol SO3] [36]
)(λD Diffusion coefficient of water in the membrane Fig5
31
α Dimension change coefficient 0004 (data from [4])
Tσ Fitting parameter (internal data fit to Eq 27) 17 MPa
0N Fitting parameter (internal data fit to Eq 27) 12middot106
β DMA to in-cell calibration parameter 23
Figure Captions
Figure 1 Schematic diagram showing the components of the model framework to predict
mechanical life of the membrane undergoing hydration cycles
Figure 2 (a) Polymer chain segment constrained by one entanglement and subjected to
the external force F (b) Potential energy of monomer in entanglement before applying
the force (in the left hand side of the Fig 2b) and after applying the force (in the right
hand side of the Fig 2b)
Figure 3 Schematic figure of membrane in fuel cell (counter-flow configuration)
constrained between two bi-polar plates (a) and crack formation (b) The wet fuel exits
from the anode gas channel (top channel) Initially wet air is fed into cathode gas
channel (bottom channel) When cathode side feed gas (air) is switched from wet to dry
cathode side of the membrane dehydrates and attempts to shrink The anode side of the
membrane remains wet and swollen
Figure 4 Fitting Tangs experimental data [7] (triangles) by equation (22) (solid line)
Fitting parameters values are σT=1 MPa and ε0=37sdot10-6
32
Figure 5 Dependence of diffusion coefficient in Nafion membrane on water content λ
(UTRC internal experimental data) There are not available data in range from 52=λ
to 15=λ so linear approximation is used in this region
Figure 6 Model prediction of dependence of RH on time and λ on time at the anode side
at the middle of the membrane and at the cathode side
Figure 7 Model prediction of stress as a function of time under RH cycling at the cathode
and at the anode sides of membrane
Figure 8 Model prediction of stress in quasi-steady-state regime at the cathode side at
the middle of the membrane and at the anode side
Figure 9 Calculated membrane lifetime (the number of cycles to failure) as a function of
minimal RH at the cathode side of membrane Anode side of membrane maintains 100
RH
33
Figures
Fuel cell RH distribution model
Operating conditionsinlet RH inlet Tcycling period
hydrationdehydration induced stress model
σ(t)Damage accrual model
Membrane Mechanical Degradation Model
Membrane propertiesE(RHT) ε∆λ DMA
ε(σNcycT) εcrit
Mechanical life-time
Fuel cell stack design
λ(t)
Figure 1
34
Figure 2
35
Figure 3
σ yy a)
b)
Crack formation
bi - polar plate
bi - polar plate
dry region
stress
y
x
σ yy a)
b)
Crack formation
bi - polar plate
bi - polar plate
dry air
wet fuel
σ yy a)
b)
Crack formation
bi - polar plate
bi - polar plate
dry region
stress
y
x
σ yy a)
b)
Crack formation
bi - polar plate
bi - polar plate
dry air
wet fuel
36
0
50
100
150
200
250
0 1 2 3 4 5 6 7
dud
N
Stress (MPa)
Figure 4
37
0
2
4
6
8
10
12
14
16
0 25 5 75 10 125 15
D1
0^-6
cm
^2s
λ
Figure 5
38
0
3
6
9
12
15
0 5 10 15 20 25 30 35 time s
000
2000
4000
6000
8000
10000
x=0 (Cathode side) x=h2 x=h (Anode side) RH
λ RH
Figure 6
39
-15
-1
-05
0
05
1
15
2
25
0 50 100 150 200 250 300
Time t
Str
ess
MP
a
x=0 (Cathode side)
x=h (Anode side)
Figure 7
40
-15
-1
-05
0
05
1
15
0 5 10 15 20 25 30 35
time s
Str
ess
MP
a
x=0 (Cathode side)x=h2x=h (Anode side)
a)
Figure 8
41
Life-time cycles
100E+05
100E+06
100E+07
100E+08
100E+09
0 02 04 06 08 1RH min
Figure 9
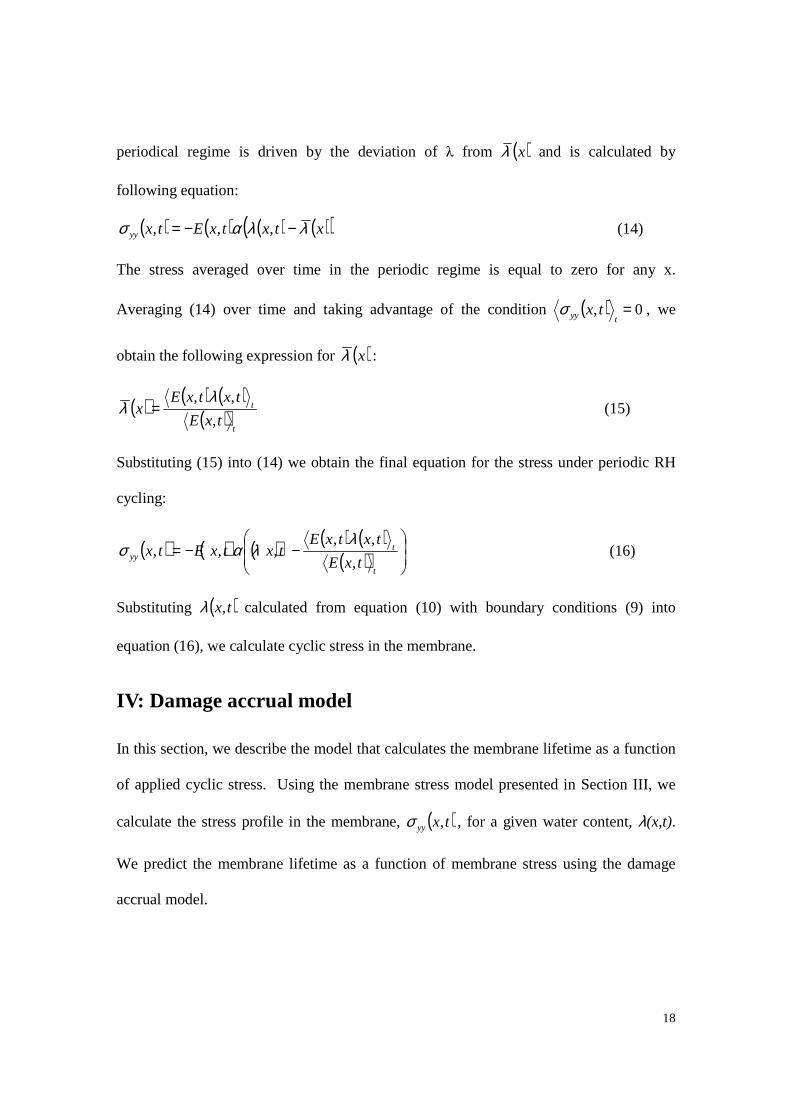

25
Using the model parameters calculated from DMA testing and in-cell RH cycling we
predicted GORE-SELECT membrane lifetime under arbitrary RH cycling conditions
Predicted membrane lifetime (number of cycles to failure) as a function of minimal RH in
the cathode gas channel RHmin is plotted in Fig 9 The anode gas humidity was
assumed to be 100 The maximal RH in the cathode gas channel RHmax of 100 was
also assumed At high RH cycling amplitude (low RHmin) the model predicts exponential
decrease of membrane lifetime with increase of RH cycling amplitude Stress amplitude
is approximately proportional to RH cycling amplitude and the number of cycles to
failure depends exponentially on the stress for large stress according to equation (22)
This results in exponential dependence of the membrane lifetime on RH cycling
amplitude for large values of amplitude (small value of RHmin)
VII Conclusions
A modeling framework was developed that predicts the lifetime of PEM fuel cell
membranes subjected to hydration cycling The developed model predicts membrane
lifetime as a function of RH cycling amplitude and membrane mechanical properties
Membrane failure in the fuel cell is caused by damage accumulation under cyclic stress in
the membrane subjected to cyclic hydrationdehydration A fuel cell membrane is
typically subjected to hydrationdehydration under fuel cell conditions One side of the
membrane dehydrates and attempts to shrink when the feed gas (air) is switched from wet
to dry in the cathode gas channel Mechanical constraints imposed by bipolar plates
prevent the membrane from shrinking This causes in-plane tensile stress in the
membrane Tensile stress causes a crack formation at RH cycled side of the membrane
26
(Fig 3) Further propagation of the crack in the through-plane direction causes
membrane mechanical failure
The modeling framework consists of three components a model of RH distribution in gas
channels a membrane stress model and a damage accrual model Several models of RH
distribution in gas channels are available in literature [8 9 10 11 and 12] and we do not
discuss this model component in the current paper In the current version of the model
we assume equilibrium of water in the membrane with the vapor at the membranegas
interface and use the conventional diffusion equation for calculation of water content in
the membrane bulk with the water diffusion coefficient dependent on water content D(λ)
The membrane stress model calculates the stress in the membrane caused by membrane
cyclic swellingshrinking under RH cycling conditions The local stress in the membrane
is caused by the change in the local hydration level The damage accrual model predicts
the number of cycles to failure for the membrane under applied cyclic stress The input
for the damage accrual model is a maximal stress in the membrane calculated by the
membrane stress model and experimental membrane lifetimes in DMA tests for two
cycling amplitudes The current version of the model also contains one calibration
parameter obtained from an in-cell RH cycling experiment with specific RH cycling
conditions
The model was utilized for in-cell lifetime predictions of GORE-SELECT membranes
The membrane mechanical properties and swelling coefficient were obtained from the
literature DMA testing and in-cell RH cycling were carried out at UTC Power After
27
calibration the model predicts membrane lifetime in fuel cells under arbitrary RH cycling
conditions The calculated membrane lifetime (number of cycles to failure) as a function
of minimal RH in cathode gas channel RHmin is plotted in Fig 9 At high RH cycling
amplitude (low RHmin) the model predicts exponential decrease of membrane lifetime
with increase of RH cycling amplitude Stress amplitude is approximately proportional
to RH cycling amplitude and the number of cycles to failure depends exponentially on
stress for large stress magnitude according to equation (22) This results in exponential
dependence of membrane lifetime on RH cycling amplitude for large values of amplitude
(small value of RHmin)
Acknowledgement
This work was supported by the US Department of Energy under the grant DE-PS36-
08GO98009
References
1 Ho Lee Taehee Kim Woojong Sim Saehoon Kim Byungki Ahn Taewon Lim
and Kwonpil Park Korean J Chem Eng 28(2) 487-491 (2011)
2 Xinyu Huang Roham Solasi Yue Zou Matthew Feshler Kenneth Reifsnider
David Condit Sergei Burlatsky Thomas Madden Journal of Polymer Science
Part B 44 (16) p 2346ndash2357 (2006)
3 Yaliang Tang Anette M Karlsson Michael H Santare Michael Gilbert Simon
Cleghorn William B Johnson Materials Science and Engineering A 425 (2006)
297ndash304
28
4 Yaliang Tang Ahmet Kusoglu Anette M Karlsson Michael H Santare Simon
Cleghorn William B Johnson Journal of Power Sources 175 (2008) 817ndash825
5 A Kusoglu A M Karlsson M H Santare S Cleghorn W B Johnson Journal
of Power Sources 161 987-996 (2006)
6 A Kusoglu A M Karlsson M H Santare Simon Cleghorn W B Johnson
Journal of Power Sources 170 345-358 (2007)
7 Haolin Tang Shen Peikang San Ping Jiang Fang Wang Mu Pan Journal of
Power Sources 170 (2007) 85ndash92
8 T F Fuller and J Newman J Electrochem Soc 140 (5) 1218-1225 (1993)
9 T V Nguyen and R E White J Electrochem Soc 140 (8) 2178-2186 (1993)
10 J S Yi and T V Nguyen J Electrochem Soc 145 (4) 1149-1159 (1998)
11 T E Springer T A Zawodzinski and S Gottesfeld J Electrochem Soc 138 (8)
2334-2342 (1991)
12 A Z Weber R M Darling and J Newman J Electrochem Soc 151 (10)
A1715-A1727 (2004)
13 L Boltzmann Pogg Ann u Chem 7 624 (1876)
14 S Turner Polymer Eng a Sci 6 306 (1966)
15 W N Findley and G Khosla J Appl Phys 26 821 (1955)
16 K van Holde J Polymer Sci 24 417 (1957)
17 T L Smith Trans Soc Rheol 6 61 (1962)
18 H Leaderman Trans Soc Rheol 6 361 (1962)
19 I M Ward and E T Onat J Mech Phys Solids 11 217 (1963)
29
20 Roham Solasi Yue Zou Xinyu Huang Kenneth Reifsnider Mech Time-Depend
Mater 12 15ndash30 (2008)
21 Paul W Majsztrik Andrew B Bocarsly and Jay B Benziger Macromolecules
41 9849-9862 (2008)
22 F Bauer S Denneler M Willert-Porada Journal of Polymer Science Part B
Polymer Physics Vol 43 786ndash795 (2005)
23 Kirt A Page Kevin M Cable and Robert B Moore Macromolecules 2005 38
6472-6484
24 Gierke T D Munn G E Wilson F C J Polym Sci Polym Phys Ed 1981 19
1687ndash1704
25 Hsu W Y Gierke T D J Membrane Sci 1983 13 307ndash326
26 Thomas A Zawodzinski Thomas E Spriner John Davey Roger Jestel Cruz
Lopez Judith Valerio and Shimshon Gottesfeld J Electrochem Soc 140 (7)
1981-1985 (1993)
27 Paul W Majsztrik M Barclay Satterfield Andrew B Bocarsly Jay B Benziger
J Membrane Sci 301 (2007) 93ndash106
28 T Takamatsu M Hashiyama A Eisenberg J Appl Polym Sci 24 (11) (1979)
2199ndash2220
29 DR Morris XD Sun J Appl Polym Sci 50 (8) (1993) 1445ndash1452
30 Shanhai Ge Xuguang Li Baolian Yi and I-Ming Hsing J Electrochem Soc
152 (6) A1149-A1157 (2005)
31 Adam Z Weber and John Newman J Electrochem Soc 151 (2) A311-A325
(2004)
30
32 Adam Z Weber and John Newman Chem Rev 2004 104 4679-4726
33 Timothy J Silverman Jeremy P Meyers and Joseph J Beaman J Electrochem
Soc 157 (10) B1376-B1381 (2010)
34 Halsey G White HJ Eyring H Text Res J 1945 v 15 p 295
35 M Gummalla VV Atrazhev AN Varyukhin and SF Burlatsky To be
published
36 P Choi and R Datta J Electrochem Soc 150 E601 (2003)
37 P de Gennes Scaling Concepts in Polymer Physics Cornell University Press
List of Tables
Table 1 Model parameters and experimental conditions
Parameter Description ValueSource
Operational conditions
Tcyc RH cycling time period 30 sec
RHmax Maximum relative humidity in cathode channel 100
RHmin Minimum relative humidity in cathode channel 10
T Cell temperature 78ordmC
Membrane properties
E(RHT) Youngrsquos modulus of the membrane [4]
)(aλ Membrane water content as a function of vapor
activity [mol H2Omol SO3] [36]
)(λD Diffusion coefficient of water in the membrane Fig5
31
α Dimension change coefficient 0004 (data from [4])
Tσ Fitting parameter (internal data fit to Eq 27) 17 MPa
0N Fitting parameter (internal data fit to Eq 27) 12middot106
β DMA to in-cell calibration parameter 23
Figure Captions
Figure 1 Schematic diagram showing the components of the model framework to predict
mechanical life of the membrane undergoing hydration cycles
Figure 2 (a) Polymer chain segment constrained by one entanglement and subjected to
the external force F (b) Potential energy of monomer in entanglement before applying
the force (in the left hand side of the Fig 2b) and after applying the force (in the right
hand side of the Fig 2b)
Figure 3 Schematic figure of membrane in fuel cell (counter-flow configuration)
constrained between two bi-polar plates (a) and crack formation (b) The wet fuel exits
from the anode gas channel (top channel) Initially wet air is fed into cathode gas
channel (bottom channel) When cathode side feed gas (air) is switched from wet to dry
cathode side of the membrane dehydrates and attempts to shrink The anode side of the
membrane remains wet and swollen
Figure 4 Fitting Tangs experimental data [7] (triangles) by equation (22) (solid line)
Fitting parameters values are σT=1 MPa and ε0=37sdot10-6
32
Figure 5 Dependence of diffusion coefficient in Nafion membrane on water content λ
(UTRC internal experimental data) There are not available data in range from 52=λ
to 15=λ so linear approximation is used in this region
Figure 6 Model prediction of dependence of RH on time and λ on time at the anode side
at the middle of the membrane and at the cathode side
Figure 7 Model prediction of stress as a function of time under RH cycling at the cathode
and at the anode sides of membrane
Figure 8 Model prediction of stress in quasi-steady-state regime at the cathode side at
the middle of the membrane and at the anode side
Figure 9 Calculated membrane lifetime (the number of cycles to failure) as a function of
minimal RH at the cathode side of membrane Anode side of membrane maintains 100
RH
33
Figures
Fuel cell RH distribution model
Operating conditionsinlet RH inlet Tcycling period
hydrationdehydration induced stress model
σ(t)Damage accrual model
Membrane Mechanical Degradation Model
Membrane propertiesE(RHT) ε∆λ DMA
ε(σNcycT) εcrit
Mechanical life-time
Fuel cell stack design
λ(t)
Figure 1
34
Figure 2
35
Figure 3
σ yy a)
b)
Crack formation
bi - polar plate
bi - polar plate
dry region
stress
y
x
σ yy a)
b)
Crack formation
bi - polar plate
bi - polar plate
dry air
wet fuel
σ yy a)
b)
Crack formation
bi - polar plate
bi - polar plate
dry region
stress
y
x
σ yy a)
b)
Crack formation
bi - polar plate
bi - polar plate
dry air
wet fuel
36
0
50
100
150
200
250
0 1 2 3 4 5 6 7
dud
N
Stress (MPa)
Figure 4
37
0
2
4
6
8
10
12
14
16
0 25 5 75 10 125 15
D1
0^-6
cm
^2s
λ
Figure 5
38
0
3
6
9
12
15
0 5 10 15 20 25 30 35 time s
000
2000
4000
6000
8000
10000
x=0 (Cathode side) x=h2 x=h (Anode side) RH
λ RH
Figure 6
39
-15
-1
-05
0
05
1
15
2
25
0 50 100 150 200 250 300
Time t
Str
ess
MP
a
x=0 (Cathode side)
x=h (Anode side)
Figure 7
40
-15
-1
-05
0
05
1
15
0 5 10 15 20 25 30 35
time s
Str
ess
MP
a
x=0 (Cathode side)x=h2x=h (Anode side)
a)
Figure 8
41
Life-time cycles
100E+05
100E+06
100E+07
100E+08
100E+09
0 02 04 06 08 1RH min
Figure 9
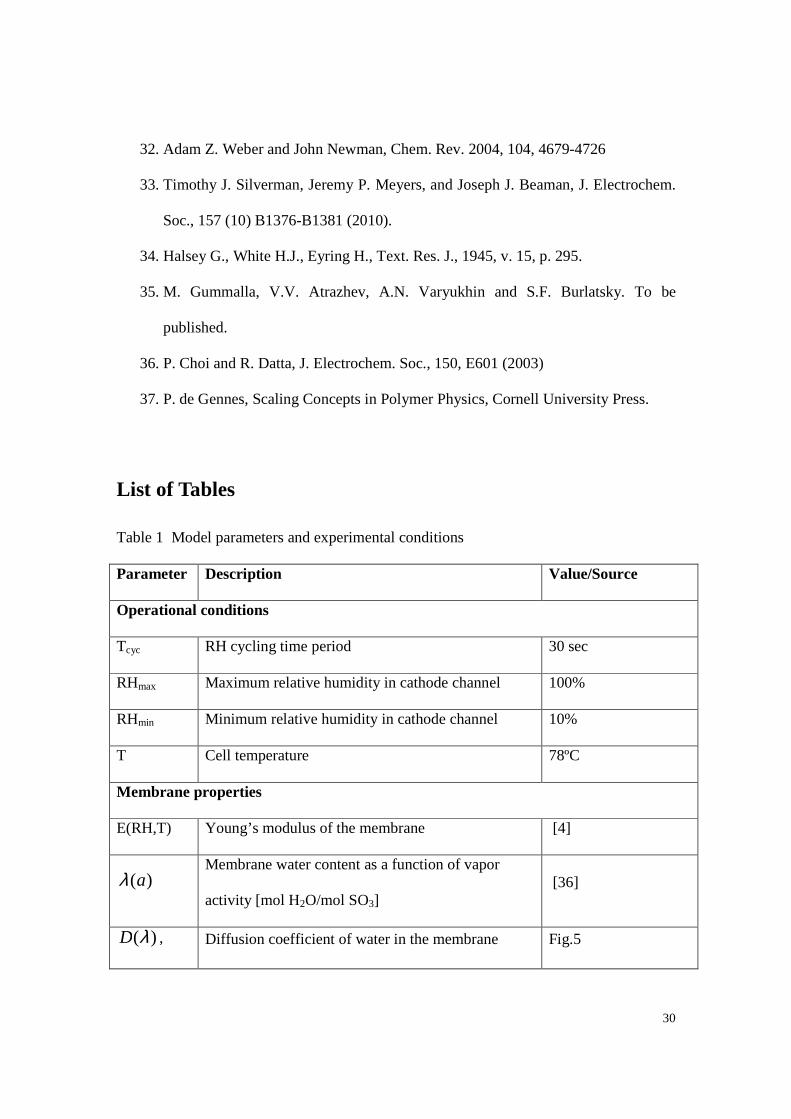
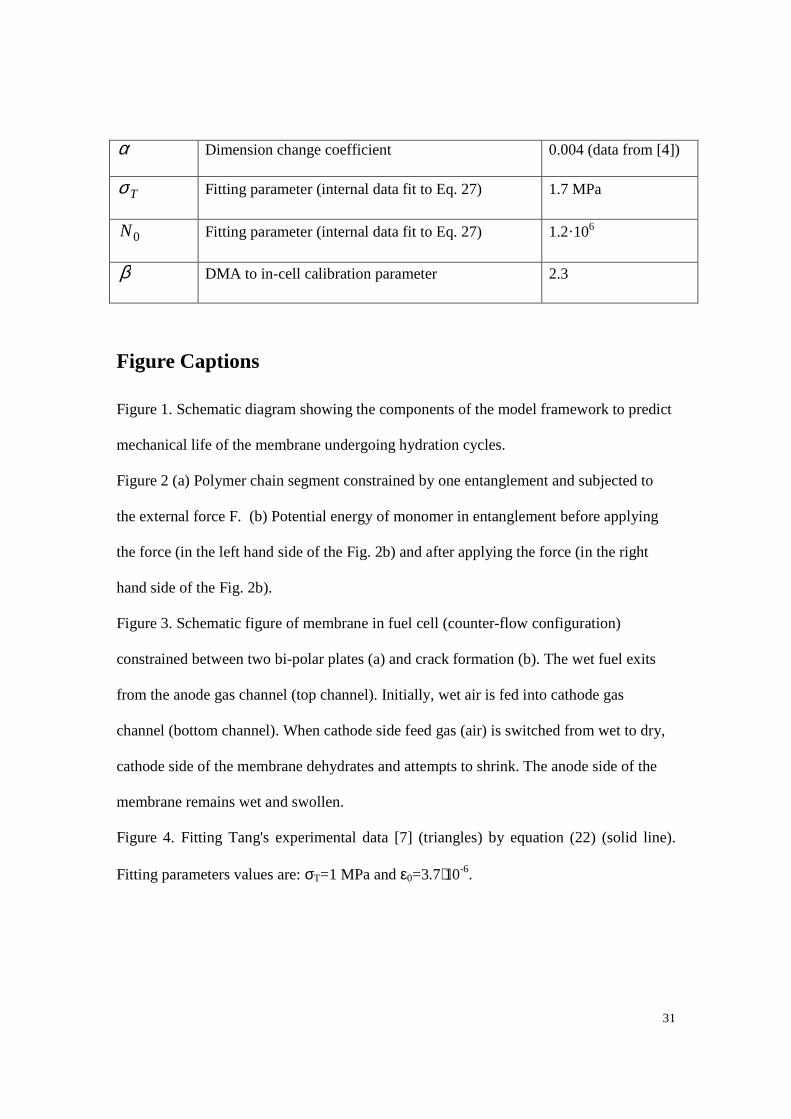

40
-15
-1
-05
0
05
1
15
0 5 10 15 20 25 30 35
time s
Str
ess
MP
a
x=0 (Cathode side)x=h2x=h (Anode side)
a)
Figure 8
41
Life-time cycles
100E+05
100E+06
100E+07
100E+08
100E+09
0 02 04 06 08 1RH min
Figure 9
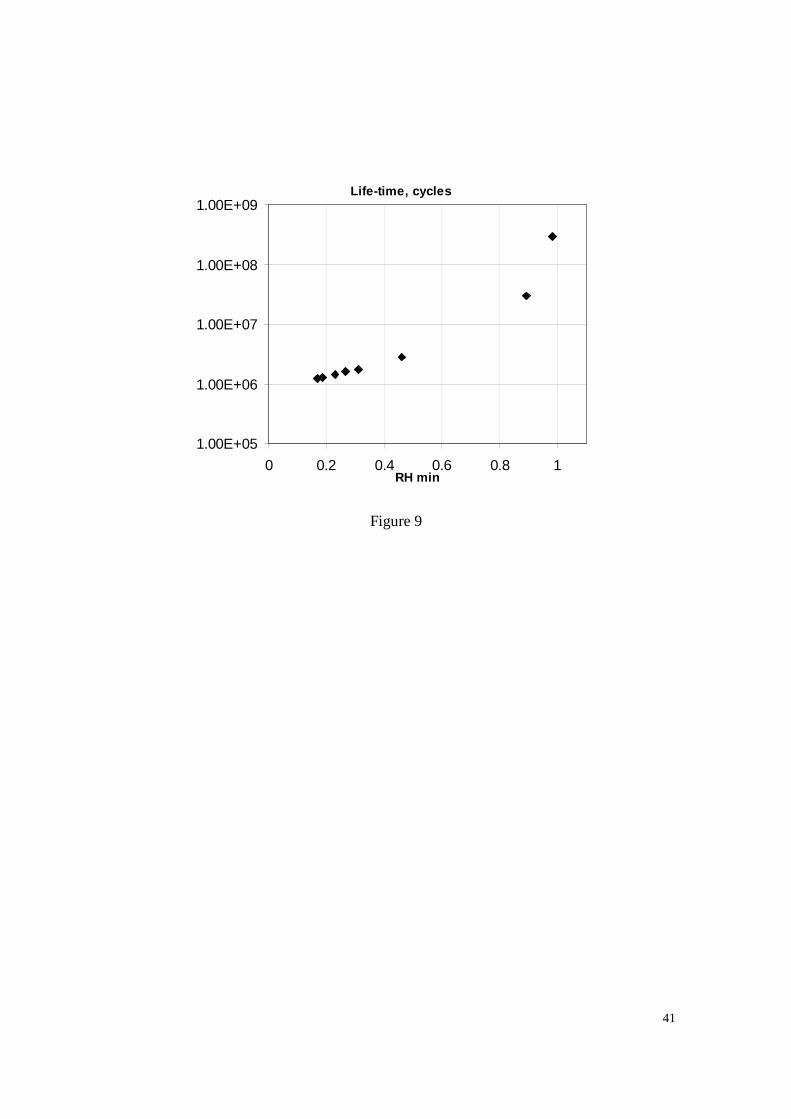
41
Life-time cycles
100E+05
100E+06
100E+07
100E+08
100E+09
0 02 04 06 08 1RH min
Figure 9