A Longitudinal Study of Top-Level Executive Performance ...00.pdf · A Longitudinal Study of...
52
Predicting Executive Performance 1 A Longitudinal Study of Top-Level Executive Performance Craig J. Russell University of Oklahoma June 12, 2000 In press, Journal of Applied Psychology . Author Note Craig J. Russell, Price College of Business. Comments on an earlier version of this study by Michelle A. Dean and two anonymous reviewers are greatly appreciated. Correspondence concerning this article should be addressed to Craig J. Russell, Price College of Business, 307 W. Brooks Drive, University of Oklahoma, Norman, OK 73019-0450. Electronic mail may be sent via Internet to [email protected].
Transcript of A Longitudinal Study of Top-Level Executive Performance ...00.pdf · A Longitudinal Study of...

Predicting Executive Performance 1
A Longitudinal Study of Top-Level Executive Performance
Craig J. Russell
University of Oklahoma
June 12, 2000
In press, Journal of Applied Psychology.
Author Note
Craig J. Russell, Price College of Business.
Comments on an earlier version of this study by Michelle A. Dean and two
anonymous reviewers are greatly appreciated. Correspondence concerning this article
should be addressed to Craig J. Russell, Price College of Business, 307 W. Brooks Drive,
University of Oklahoma, Norman, OK 73019-0450. Electronic mail may be sent via Internet

Predicting Executive Performance 2
Abstract
Competency ratings were obtained from a hybrid selection system on 98 top-
level executives in a predictive validity design. HLM results indicate “resource
problem-solving oriented” competency ratings predicted initial performance, while
“people-oriented” competency ratings predicted subsequent performance trends.
Brogdon-Cronbach-Glaser utility estimates suggested the system generates an
additional $3M in annual profit per candidate selected. Groups of executives with
similar performance trends were identified who had encountered qualitatively
different situational circumstances. Findings imply a model of executive
performance must contain main effects for person (competencies) and situation
characteristics (economic/industry characteristics) on both subsequent performance
and performance trends. Future research needs to examine which (if any)
situational circumstances moderate relationships between executive competencies
and initial performance or subsequent performance trends.

Predicting Executive Performance 3
A Longitudinal Study of Top-Level Executive Performance
The industrial/organizational psychology and human resources management arenas
have been inundated with models of executive, managerial, or leadership "competencies,"
"skills," or "traits." Stogdill (1948) noted the total absence of systematic support for trait
models within the leadership literature before 1948. Almost thirty years later, Stogdill (1974)
concluded improved research designs, broader predictor construct domains, and better
measurement instruments had led to more consistent evidence of construct validity. A
smaller number of these efforts made empirical contributions to our understanding and
prediction of performance in top-level leadership or executive positions. A coarse and
somewhat arbitrary classification of these efforts would describe them as coming from
literatures on managerial selection and development, leadership, and business strategy.
Following brief surveys of these literatures, a conceptual definition of executive
competencies is provided and an empirical assessment of competency ratings’ abilities to
predict executive performance is reported.
Managerial Selection and Development Literature
In early management selection and development work following Stogdill’s (1948)
review, Katz (1955) and Mann (1965) described a three dimensional model containing
technical, interpersonal, and conceptual competencies, though no evidence was reported to
support this conceptualization. Kotter (1982, 1988, 1990) and Sessa, Kaiser, Taylor, and
Campbell (1999) used combinations of surveys and interviews with samples of high
performing executives to expand and elaborate on these three competencies, though
supporting evidence was limited to interpretation of narrative summaries and simple
descriptive statistics.

Predicting Executive Performance 4
Boyatzis (1982) developed a nine competency model derived from interview-based
assessments of 253 managers from all levels (75 at executive levels) of 12 Fortune 500
firms and four public agencies. Competencies included: 1) efficiency orientation, 2) concern
with impact, 3) proactivity, 4) self-confidence, 5) oral presentation skill, 6) conceptualization,
7) diagnostic use of concepts, 8) use of socialized power, and 9) managing group process.
Stepwise discriminant analysis indicated ratings on these competencies (derived from
coded interviews) permitted correct identification of superiors' ordinal assessment of
managers' performance (poor, average, superior) 51% of the time (p < .05, where 33%
correct classification was expected by random chance). The stepwise discriminant analysis
was not subjected to cross-validation, hence, estimates of classification accuracy were
likely inflated due to stepwise discriminant analysis’ ability to take advantage of chance
associations.
Separate analyses for 75 executives reported mean competency ratings for superior,
average, and poor performers (Boyatzis, 1982, p. 275). All possible t-tests of paired mean
comparisons (corrected for unequal sample size) between superior, average, and poor
performers were reported (ANOVA results testing the hypothesis Ho: µ1 = µ2 = µ3 were not
reported). Three of the 27 2-tailed t-tests comparing competency ratings of poor, average,
and superior performers were statistically significant at p < .01, while one was significant at
p < .05. In light of these findings and the absence of control for study-wide accumulation of
Type I error, results did not suggest a meaningful associations between competency
measures and executive performance (results were marginally stronger for lower
management levels).
McCall and Lombardo (1983) and Leslie and Van Velsor (1996) interviewed a large
number of managers to identify characteristics associated with executive success or failure.
Predicting Executive Performance 5
Competencies and characteristics of managers who "derailed" included emotional stability
and composure, defensiveness, interpersonal skills, and technical/cognitive skills.
"Derailment" can certainly be a negative personal and organizational outcome.
Unfortunately, collapsing the entire range of executive performance into two categories –
derailed and not derailed – prevented inferences from being drawn about competencies or
characteristics of executives who exhibit high versus low levels of performance. Further,
those who did not derail may have subsequently performed poorly, while those who derailed
may have performed well if not for some nonperformance-related derailment events. No
relationships between derailment antecedents and personal or organizational performance
outcome measures were reported.
In one of the more thorough examinations of a management competency model,
Posner and Kouzes (1988, 1993) developed five competencies labeled "challenging the
process, inspiring a shared vision, enabling others to act, modeling the way, and
encouraging the heart" (Kouzes & Posner, 1995, p. 9). Alternately describing these as five
"practices," Kouzes and Posner (1995) went on to describe two behaviors (labeled
"commitments") characteristic of each competency. For example, "(s)earch out challenging
opportunities to change, grow, innovate, and improve" and "(e)xperiment, take risks, learn
from the accompanying mistakes" (Kouzes & Posner, 1995, p. 10) were behaviors seen as
contributing to the construct domain of "challenging the process."
Posner and Kouzes (1988, 1993) reported impressive construct validity evidence for
a 30-item Leadership Practices Inventory constructed to measure the five competencies in
samples of N = 2168 and N = 30913. Confirmatory factor analysis reported by Harold,
Fields, and Wyatt (1993) supported the latent 5-factor structure, while Posner and Kouzes
(1988, 1993) reported internal reliability estimates ranging from α = .81 - .91. Posner and

Predicting Executive Performance 6
Kouzes (1988) also reported extraordinarily high criterion validity when subordinate ratings
of 708 superiors' performance were regressed onto five scale scores derived from the
Leadership Practices Inventory (R = .740 {.869 when corrected for criterion unreliability}).
Unfortunately, the six items used in the performance appraisal instrument sampled
virtually identical domains as items contained in the Leadership Practices Inventory. For
example, one of the performance appraisal items was "felt empowered by this manager,"
while items from the Leadership Practices Inventory questions included "Gives members of
the team lots of appreciation and support for their contributions" and "Treats others with
dignity and respect." Taken at face value, criterion validity evidence reported by Posner
and Kouzes (1988) demonstrated what subordinates say about their managers on the
Leadership Practices Inventory converges with what they say about their managers in
response to comparable questions asked on a "criterion" performance appraisal instrument.
Additional design problems preclude any interpretation of Posner and Kouzes' (1988)
criterion validity evidence (e.g., correlated errors occurred when 708 managers'
performance evaluations were regressed onto 2168 subordinate Leadership Practices
Inventory ratings and stepwise regression was used without cross-validation).
Leadership Literature
Numerous models of leadership suggest candidate characteristics might be used to
predict future executive-level performance. Bass (1985, 1998) expanded upon House
(1977) and Burns' (1978) original conceptualizations of transactional and transformational
(sometimes labeled "charismatic") leadership to develop and test a model using survey
instruments. In general, results were encouraging and support the model, though criterion
validity evidence relies heavily on "same source" measures (e.g., subordinate assessments
of leadership and performance). Fortunately, additional criterion validity evidence has been
reported since Russell (1990) lamented "that evidence of (a) construct validity and (b)
Predicting Executive Performance 7
consistencies between a (leadership) theory's nomological net and observed relationships
do not necessarily mean the theory yields tools for selecting effective managers and
leaders" (p. 73). For example, Yammarino and colleagues (Yammarino, Dubnisky, Comer,
& Bass, 1997; Yammarino, Spangler, & Bass, 1993) found measures of transformational
leadership taken from samples of female sales managers and midshipmen at the U.S.
Naval Academy predicted subsequent measures of performance.
In a rare laboratory study, Kirkpatrick and Locke (1996) manipulated three
dimensions of charismatic leadership using trained actors as "managers" of a simulated
production job. They found two core components of charismatic leadership (vision and
vision communication) directly influenced subordinate attitudes and perceptions of
charisma, with weak influence on performance quality and no effect on performance
quantity. Finally, Barling, Weber, and Kelloway (1996) reported results from a quasi-
experimental field design indicating a training intervention targeting branch bank managers'
transformational leadership skills caused a significant increase in the branch's personal loan
sales (η2 = .193, p < .02), though an increase in credit card sales did not reach significance
(η2 = .143, p > .05).
Very promising empirical results suggest aspects of transactional and
transformational leadership are related to important organizational outcomes. It remains to
be seen whether subsequent research can fashion tools needed for top-level executive
selection from these efforts.
Business Strategy Literature
Last, models and hypotheses concerning executive performance can also be found
in the strategic management literature. Hambrick and Fukutomi (1991) developed a stage
model of executive performance in which "seasons" of executive tenure are hypothesized to

Predicting Executive Performance 8
influence executive behavior, attention, and performance (Hambrick & Fukutomi, 1991).
Gupta (Gupta, 1984; Gupta & Govindarajan, 1984; Gupta & Taylor, 1988) hypothesized
individual differences in tolerance for ambiguity and locus of control will interact with
characteristics of the strategic context and internal administrative control system. No
research could be located in which these hypothesized relationships were systematically
assessed.
In sum, unlike cumulative research establishing psychometric evidence of
Spearman’s (1902, 1927) general and specific cognitive ability dimensions (g and s, Carroll,
1993), construct validity evidence in support of executive-level competency models must be
viewed as mixed. Criterion validity evidence at executive levels is almost non-existent. It
remains to be seen whether evidence of construct and criterion validity will be forthcoming
when rigor characterizing cognitive ability research is focused on executive positions.
Regardless of the lack of guidance from theory, organizations must nonetheless select
individuals for top-level executive positions.
The purpose of this study was to examine how well executive competency ratings
predict initial and subsequent performance for top-level executives. Executive
competencies are first conceptually defined. Second, personnel selection technologies
extant at the study's onset (circa 1984) are discussed in terms of implementation viability at
executive levels, followed by a description of the technology used and research questions
addressed.
Executive Competencies
“Competency” was conceptually defined as a meaningful rating or evaluation used to
forecast future job performance. While not available when the study started, Sandberg’s
(2000) conceptualization of an “evaluative intersection” of person information (e.g., worker
characteristics, worker requirements, and experience requirements) and work information

Predicting Executive Performance 9
(e.g., occupational requirements, occupation specific requirements, and occupational
characteristics) best describes how the executive competencies were viewed. The
evaluative intersection occurred in the current effort when evaluators provided ratings based
on simultaneous consideration and integration of 1) candidates’ personal characteristics
and skills with 2) task and other characteristics of the target job. The competency rating’s
purpose was to simply forecast candidates’ future job performance in executive positions
(Sandberg, 2000). Hence, “competencies” as conceptually used here were assessments
found in personnel selection systems used to predict future job performance.
Competencies were not viewed as characteristics of a job or characteristics of the
incumbent (or prospective incumbent), they were an amalgamation of both.
Available Selection Technologies
With or without theory, selection technologies routinely identify individual difference
measures on the basis of job analysis information that are subsequently shown to predict
candidate job performance in a wide variety of jobs (Guion, 1998). Unfortunately,
experience obtained in the current study suggests many selection technologies were not
accepted by users or candidates. Candidates for executive positions typically spend a large
portion of their careers progressing through professional and managerial positions. The
CEO, members of the firm's executive committee, and candidates in the current study
strongly believed characteristics required of top-level corporate executives could not be
measured using paper-and-pencil tests or through "simulations and games" (e.g.,
assessment centers such as those used at lower levels of the participating firm). Anecdotal
evidence from discussions with dozens of executives in other firms suggested this
sentiment is widely held, effectively limiting choice of selection technologies to those
involving face-to-face interviews and/or systematic coding of archival work history

Predicting Executive Performance 10
information. Relatedly, Owens (1976) suggested biographical information might be
harvested through interview procedures.
Hence, the current effort developed and validated a hybrid selection system using
features of structured interviews, assessment center rating procedures, and biographical
information to generate executive competency ratings. Job analysis identified
competencies required for executive positions in a Fortune 50 firm, while structured
interviews targeted prior life experiences thought to contribute to executive competencies.
Information gathered from the interviews was assessed through a procedure similar to
assessment center consensus discussions to arrive at forecasted executive competency
ratings as well as overall ratings for each candidate.
Research Questions
Owners of equity (or their representatives) in a for-profit organization are usually the
final decision makers in executive selection. Their primary concern is to select individuals
who will meet financial performance objectives. Moreover, they want these financial
objectives to be met "in perpetuity," i.e., until the individual retires or is promoted to some
higher level of executive responsibility. Hence, any selection system must be examined
relative to its ability to predict both initial and ongoing performance outcomes. The following
research questions guided analyses reported below.
• RQ1: Do executive competencies ratings made on the basis of structured interviews
targeting prior life experiences predict initial executive performance?
• RQ2: Do executive competencies ratings made on the basis of structured interviews
targeting prior life experiences predict subsequent change in executive performance (or
performance trends)?

Predicting Executive Performance 11
Fleishman (1972) and Ackerman (1989) reported results suggesting individuals start skill
acquisition tasks with different ability profiles and that some abilities will be critical to early
task performance and others to later task performance. Assuming affirmative answers to
the first two research questions, a final research question asked:
• RQ3: Do executive competency ratings that predict initial performance also predict
subsequent performance change?
Method
Sample
One hundred and thirty three individuals considered “first replacements” were
evaluated for positions as division general managers (GM's) in a Fortune 50 firm between
1985 and 1992. Sixty-six of these candidates made up the subject pool examined by
Russell (1990) in a concurrent validity design. Of the 133 candidates, the current study
examined data from 98 who were ultimately promoted into GM positions (promotions
occurred between 1987 and 1995). Candidate average age was 46.2 years and average
tenure with the firm was 21 years. All candidates had college degrees, 42 had MBAs, and
three had Ph.D.'s (all in basic sciences). Candidates held positions either one level below
that of GM or held staff positions at the business unit level (GMs managed divisions,
business units contained multiple divisions). All candidates were part of the business unit's
strategic management team and participated in the corporate bonus pool reserved for
positions seen as having a major impact on corporate financial goals.
Candidate career paths varied widely, though virtually all candidates career paths
stayed within the industry in which candidates first assumed middle management positions.
Some spent their entire careers in one functional area while others rotated through a range
of functional and staff positions. Some operated small independent businesses (usually

Predicting Executive Performance 12
under $70M in sales) with hundreds of subordinates and multiple facilities (all profit and loss
responsibilities were held by GM's, though many candidates maintained "de facto" profit
and loss accounting systems within their units). Others held staff positions with no direct
reports. Regardless, product markets were diverse, lateral career moves across product
markets were rare, and career moves across industry were nonexistent.
GM positions were the lowest level executive position with profit and loss
responsibility in the firm. Divisions generated revenues between $125M and $775M per
year in fiscal 1998, which would cause all divisions to fall in the middle half of the Fortune
1000 largest firms if they were freestanding organizations. GMs were paid $175,000 in
average annual base salary at the start of the study, though the lowest paid GM in 1998
received a base salary (not including bonus) of approximately $325,000. The position was
between three and five levels below CEO throughout the study, with incumbent GMs
actively participating on the business unit strategic decision-making team. Twelve business
units each generated between $450M and $5B annually.
Procedures
Job Analysis. Twelve top performing GMs were convened in a focus group in 1984
to identify competency requirements common across all GM positions. Job analysis
procedures followed to generate critical incidents are described in detail by Russell (1990).
The nine competencies identified are described in Table 1.
_________________________
Insert Table 1 about here
_________________________
Note again, “competencies” are conceptually defined here as a performance forecast
formed from the confluence of information about task requirements and candidate skills and
abilities. So for example, a “staffing” competency rating is a forecast of future executive

Predicting Executive Performance 13
performance formed by a rater’s simultaneous consideration of task requirements
associated with staffing and a candidates individual difference characteristics, skills, and
abilities.
Interviews. Structured interviews with each candidate and candidate's immediate
superior were used to collect biographical information. Five interviewers (including the
author) conducted one-on-one interviews with each candidate and candidate's boss.
Individual interviewers were responsible for gathering all data and generation of a narrative
report for each candidate. The interviewers had two to 15 years of experience operating
assessment centers at entry through middle level management ranks within the firm. Four
interviewers were external consultants and one academic hired for the project, while one
interviewer was a senior human resource specialist assigned to corporate headquarters.
Each interview was tape recorded, transcribed, and distributed to the other
interviewers (with the interviewee's permission). Candidate interviews covered three
domains: prior career experiences, current accomplishments, and career aspirations.
Candidates were first asked to describe accomplishments, disappointments, and lessons
learned from experiences in college and all positions held since entering the work force.
Special attention was paid to obstacles, assistance, conflicts, or other aspects of life
experiences that accompanied each accomplishment or disappointment. Candidates
averaged 9.8 positions held since college (not including their current position). Questions
relating to the first domain took approximately three hours to complete.
Second, candidates described accomplishments, disappointments, and lessons
learned in their current position that reflected each of the nine GM competency dimensions.
For example, questions targeting Financial Analysis asked candidates about
accomplishments, disappointments, lessons learned, sources of assistance, obstacles, etc.
associated with use of financial tools, development of short- and long-term financial

Predicting Executive Performance 14
objectives, and evaluating financial performance. Questions covering the first two domains
closely paralleled those used by Lindsey, Homes, and McCall (1987). Unlike Lindsey et
al.’s groundbreaking effort, the current study gathered multiple key events in all prior
positions and college for each candidate. Questions targeting experiences in their current
position took approximately one hour to complete.
Third, candidates were asked about their career aspirations, formal developmental
efforts they had engaged in, self-perceptions, and how they thought they were perceived by
superiors, peers, and subordinates. Questions targeting the third domain took about 45
minutes to complete. Interview length varied greatly, generally ranging from 6 to 9.5 hours.
Candidates were all senior managers who wanted to be promoted to a GM position and
were highly motivated to talk at length about aspects of prior work experiences.
Interviews with candidates' immediate superiors followed the same format, though
questions were not asked about candidates’ experiences in prior positions unless the
superior had been present at that time. Superior interviews took an average of 2.75 hours.
Tape recordings of candidate and superior interviews were transcribed and copies (~250
pages each) distributed to all interviewers.
Questionnaires. Candidates submitted names of current subordinates, peers, and
past superiors to receive performance assessment questionnaires. Section I of the
questionnaire asked respondents open-ended questions about the candidate's major
accomplishments and disappointments. Section II contained items reflecting critical
incidents generated in the focus group discussions organized around the nine dimensional
headings. Respondents rated candidates on 65 items using a nine point Likert scale where
0 = "less skilled than any general manager I know or know about," 3-4 = "about the same as
most general managers I know or know about," 7 = "more skilled than any general manager
I know or know about," and 8 = "Don't know." Example items included "Entrepreneurial;

Predicting Executive Performance 15
seizes new opportunities," "Knows hot spots and problem areas of business," and "Able to
deal with customer concerns, maintain and develop good customer relations." Finally,
Section III contained open-ended questions targeting "functions mastered," strengths and
weaknesses, and any other comments a respondent might think useful.
Rating Process. Competency ratings forecasting how well candidates would perform
in each of the nine GM performance domains were obtained in a two-step process. These
steps constitute a “hybrid” combination of biodata, interview, 360 performance appraisal,
and assessment center consensus discussion components. The assigned interviewer
gathered all information on a candidate and distributed copies to the other four interviewers
in Step I. Narrative answers to open-ended items on the questionnaire were typed in
summary form along with all individual responses, means, and standard deviations for
superior, peer, and subordinate respondents. Each interviewer read all information
(including transcribed interviews) for all candidates. Information from candidates' personnel
records such as prior performance ratings or developmental action plans was not made
available to interviewers.
In Step II all interviewers met at corporate headquarters for consensus discussion
and evaluation of the candidates. Each interviewer prepared a summary report on his/her
assigned candidate and distributed it to other interviewers in advance. Reports initially
contained a narrative description of accomplishments and disappointments (~1 page),
followed by the original interviewer's ratings on each of the nine GM job dimensions.
Dimensional ratings ranged from 4 = "outstanding: predicted to perform as well as the top 5-
10% of current GMs," 3 = "above average: predicted to perform as well as the next 20-25%
of current GMs," 2 = "average: predicted to perform as well as the next 50% of the current
GMs," and 1 = "needs development: bottom 15-25%." Ratings were accompanied by the
interviewer’s one paragraph narrative description of prior accomplishments, task outcomes,

Predicting Executive Performance 16
and experiences upon which each rating was based. Last, an overall rating was made,
where 3 = "Ready now - minimal (or no) weaknesses to be addressed in order to perform
adequately," 2 = "Ready now - a small number of weaknesses need to be taken into
account in position placement," and 1 = "Needs development - numerous weaknesses need
to be addressed before being considered for GM position."
Interviewer consensus discussion was very similar to consensus discussion found in
typical assessment center designs, though discussion centered on candidates' prior life
experiences. Themes dominating discussion included a) "Is this prior experience an
example of dimension A or B?," b) "What does a candidate need to have done to be
considered outstanding, above average, etc.?," and c) "How should dimensional ratings be
combined into an overall recommendation?" An upper level executive (corporate vice
president or business unit manager) typically sat in on discussions to help with points a and
b. Executives did not typically read transcribed interviews, though they did read summaries
of questionnaire responses. Regardless, discussions paid particular attention to patterns of
convergent or divergent information.
Approximately two hours were spent discussing each candidate. Meetings were
held approximately every two months to discuss four to five candidates in a single day.
Two-hour discussion periods started with the interviewer reading a candidate report aloud.
Discussion participants challenged and scrutinized every descriptive statement and
conclusion based on their interpretation of transcripts and questionnaire data. The
interviewer revised the report as the panel arrived at consensus regarding wording and
ratings. Subsequently, interviewers fed back revised reports to candidates and superiors in
separate interviews.
Criteria

Predicting Executive Performance 17
At least three years of data on five related criteria were available for the 98
candidates subsequently promoted into GM positions. GM superiors’ annual "fiscal" and
"non-fiscal" performance ratings for subordinate GMs constituted the first two criteria.
Ratings were made on a four point scale with no anchors, with "4" as the highest rating.
Unfortunately, GMs' superiors received no special training in performance appraisal
systems or rating processes. Corporate headquarters had little confidence in these ratings.
Indeed, Russell (1990) reported 3.8X = for both ratings, and only one of 20 simple
concurrent validity coefficients was significantly different from zero for these two criterion
measures.
Third, the amount of annual management bonus received as obtained from
personnel records for each GM’s first three years on the job. Business units were annually
allocated a sum of money for management bonuses based on business unit financial
performance goals. Financial performance goals were established every three to five years,
with occasional adjustments based on unexpected environmental events.
General managers were allocated bonuses based on division financial performance
relative to performance goals. Performance goals addressed profits, sales volume, and
market share, though profit and sales objectives were clearly dominant. Some units had
additional strategic objectives unique to their circumstances. Interestingly, some
performance goals targeted negative profits. For example, one GM's profit goal was to lose
$52M in fiscal 1991. This division manufactured product "A" that constituted one of 18-20
related products sold by the business unit. If the firm was going to participate in this
industry, it had to manufacture the full line of 18-20 products (including product "A").
Unfortunately, because of the location of fixed assets (i.e., high cost, non-portable
manufacturing facilities) in geographic areas with high labor costs, the division producing

Predicting Executive Performance 18
"A" could not be profitable in the short- to medium-term. Hence, the GM's goal was to
"only" lose $52M in fiscal 1991. The GM received a large performance bonus for fiscal
1991 when he was able to generate performance efficiencies resulting in a loss of only
$17M! This circumstance was routinely encountered in a small number of divisions. Sales,
profit, sales goals, and profit goals for the first three complete years immediately following
candidates' appointments as GM were obtained from archival accounting and operating
records.
In sum, the five criterion measures available for the first three complete fiscal years
after receiving GM appointments were superiors’ global ratings of fiscal and non-fiscal
performance, bonuses received, profit, and sales. Note, date of promotion into the GM
position varied between 1986 and 1995, with a lag of three months to four years between
candidate assessment and promotion. Use of performance data from candidates’ first four
years in GM positions would have reduced the sample size by over 60%. Use of
performance data from candidates’ first two years in GM positions only marginally increased
the sample size and precluded examination of nonlinear performance trends.
Design and Analyses
By early 1999, 98 candidates had been promoted into GM positions with at least
three years of criterion data available (two candidates were promoted and subsequently left
GM positions for non-job related health considerations). The current study used a
predictive validity with selection design to determine how well the executive competency
ratings described above predicted subsequent performance and performance trends of top-
level corporate executives.
Until recently there was little consensus regarding the best means of examining
performance trends (e.g., Ackerman, 1989; Alexander, Barrett, & Doverspike, 1991; Austin,
Humphreys, & Hulin, 1989; Barrett & Alexander, 1989; Henry & Hulin, 1987; Hulin, Henry, &

Predicting Executive Performance 19
Noon, 1990; Murphy, 1989). The resulting confusion led many investigators to use
inappropriate analytic procedures (see Bergh, 1993a, 1993b, 1995, for a discussion of
these issues). Fortunately, recent developments in use of hierarchical linear models (HLM)
resolve many of these issues (Bryk & Raudenbush, 1987; Hofmann, 1997). HLM analyses
provide greater insight into the nature performance prediction and prediction of performance
change. Three sets of individual difference measures (the nine competency ratings, the
overall rating, and questionnaire responses) were used to predict initial performance and
subsequent three-year performance trends using HLM procedures (Bryk, Raudenbush, &
Congdon, 1992). Clustering procedures were used to identify subgroups with similar
performance trends. The Brogdon-Cronbach-Gleser (BCG) model of selection utility was
also used to estimate economic utility of the selection system.
Results
Factor Analysis Results
One thousand six hundred and thirty two questionnaires were returned by X = 3.1
peers, 6.6 subordinates, and 2.5 prior superiors per candidate. Replicating results reported
by Russell (1990), Hotelling T2 indicated no significant differences among peer,
subordinate, and superiors' inter-item correlation matrices. Similarly, no significant
interaction effects were detected in a 2-way ANOVA (three respondent groups by 65 items).
Responses from the three groups were combined for subsequent factor analyses.
Exploratory factor analytic results reported by Russell (1990) suggested a single
global performance factor best explained relationships among the 65 questionnaire items.
Hence, a priori measurement models containing nine and one latent factors were estimated
using LISREL 8.3. Results suggested a measurement model containing nine latent factors
did not fit the data well (χ278, n = 1486 = 7,456.2, p < .001; GFI = .67; CFI = .59; NFI = .59;

Predicting Executive Performance 20
PNFI = .47; and RMSEA = .25), though a single factor model met heuristic standards
commonly put forth by Mulaik, James, Van Alstine, Bennett, Lind, and Stilwell (1989) (χ278, n
=1486 = 2,597.4, p < .001; GFI = 95; CFI = .92; NFI = .91; PNFI = .65; RMSEA = .04).
Hence, results suggested subordinates', peers', and prior superiors' questionnaire
responses where driven by a common, single latent factor. A single global "questionnaire"
predictor score was constructed by simply averaging all questionnaire responses returned
for each GM. However, it is important to note the global questionnaire score was derived
post hoc and was not derived or used by interviewers at the time of assessment. In fact,
variations in candidate rating patterns were explicitly examined in the consensus discussion
process.
Descriptive Statistics
Descriptive statistics and simple correlations are reported in Table 2 for the 98 GM’s.
Simple correlations between predictors and criteria are reported in raw form for all but two
predictors. Initial correlations suggested profit and sales were minimally related to any
other measures. Subsequent discussions with GM's and their immediate superiors
suggested GM's targeted their behavior toward profit and sales relative to profit and sales
goals, as this is what the corporation rewarded. Consequently, all correlations and
subsequent HLM analyses were conducted with "profit" operationalized as the annual
corporate accounting profit measure divided by annual profit goal for that fiscal year.
Similarly, "sales" was operationalized as the annual corporate accounting sales measure
divided by annual sales goal for that fiscal year. To aid interpretation, means and standard
deviations for “profit” and “sales” were expressed in raw score form (e.g., the average
amount by which profit exceeded profit goal was 9% and average profit goal was $31.2M in
Year 1, hence the average “Profit Year 1” value listed in Table 2 is $34M).

Predicting Executive Performance 21
________________________
Insert Table 2 about here
________________________
Corrections for direct range restriction on predictors due to selection on the overall
ratings are also reported on criterion validities for the overall rating (given its use in actual
selection of GM candidates). Correlations between the overall rating and nine of the 12
criterion (all three fiscal performance ratings, nonfiscal performance ratings, and profit)
exhibited strong evidence of predictive validity. Correcting for attenuation effects of direct
range restriction yielded rxy estimates ranging from .33 to .52. None of the correlations with
the three annual measures of gross sales rejected Ho: ρ = 0.
Utility Analysis
Using a typical, though conservative, application of the BCG model of selection utility
puts these criterion validities in a context most useful for organizational decision makers
(Brogdon, 1946, 1949; Cronbach & Glaser, 1965). Expected average amount by which
annual profit goal was exceeded in Year 2 (where the estimate of rxy is the smallest) for
those selected using the interview-based biodata system was estimated as follows:
xprofit profit xy profity r SD Zµ= +
Equation 1
where . . . profity = average profit generated by those selected µprofit = average profit of those selected under previous
selection system (i.e., profit expected if the old selection system had been used to screen these applicants)
rxy = predictor criterion validity SDprofit = standard deviation of profit in selected candidates xZ = average predictor score of group selected in z-score
form

Predicting Executive Performance 22
Incremental utility, or expected change in profit due to use of the interview-based biodata
system (∆Uprofit), was estimated by subtracting µprofit from both sides of Equation 1. For the
current estimate, µprofit was set equal to the average profit goal. Plugging in appropriate
values from the current data (using rxy = .28 for the correlation between the overall rating
and Profit Year 2 as the most conservative estimate of rxy and the standard deviation of the
percentage of profit goal achieved transformed back to a dollar scale1), candidates selected
using the interview-based biodata system were expected to exceed annual profit goals by a
little more than $3M ($3M = .28[16.5M][.65]), or $4M when the criterion validity was
corrected for direct range restriction ($3.96M = .37[16.5M][.65]).
HLM Analyses
HLM analyses simultaneously estimated effects within and between levels of
analysis. Two levels of analysis could be examined in the current data. Level 1 analyses
examined the ability of past measures of performance (e.g., profit, sales, etc.) to predict
future performance measures in a time series forecast. Level 2 analyses examined the
ability of candidate individual differences (i.e., competency ratings) to predict parameters at
the lower level of analysis. The latter analyses used parameters from the lower level of
analysis (i.e., intercepts and slopes from the time series) as dependent variables and
competency ratings as independent variables.
Linear Performance Trend. Linear and nonlinear trends could be examined across
three years on which performance information was available. Support for both linear
(Deadrick & Madigan, 1990; Deadrick, Bennett, & Russell, 1997) and nonlinear
performance trends (Hofmann, Jacobs, & Gerras, 1992; Hofmann, Jacobs, & Baratta, 1993)
has been reported for non-executive level positions. As none of the literature examined top-
level executive performance trends, both were examined. Initially the mean of the three

Predicting Executive Performance 23
annual performance measures (an unconditional null model with no level-1 predictors) was
estimated and compared to a linear time series model to determine how well a simple linear
trend captured within subject performance change over the three year period (i.e., earlier
performance measures constituted independent variables in a time series analysis used to
predict subsequent performance measures). Comparing R2 for the two models indicated
how much within-person variance is explained by a linearly increasing/decreasing
performance trend relative to predicting each individual's performance with the grand mean
(i.e., y derived over all three years).
Analyses indicated a linear performance trend explained 72, 65, 82, and 65% of the
within-subject performance variance, respectively, in fiscal performance ratings, nonfiscal
performance ratings, profits, and sales. Visual interpretation of performance data for the 98
candidates indicated all changes in dependent variables were either monotonically
increasing or decreasing. Hence, it was not surprising that nonlinear models did not
contribute meaningful variance prediction for the dependent variables (cf. Dawes &
Corrigan, 1974).
Null model results also indicated 58, 67, 78, and 65% of the total variance (i.e., the
sum of variance between individuals and within individual across time periods) was due to
differences between candidates in fiscal performance ratings, nonfiscal performance
ratings, bonus, profit, and sales, respectively. Hence, a meaningful portion of performance
variation was available to be predicted by individual difference variables (level-2 predictors).
Random Coefficient Regression Model (Level-1). An unconditional null model was
initially estimated to determine average initial performance (intercept) and average
performance trend (slope) across individuals (Bryk & Raudenbush, 1992). Results for these

Predicting Executive Performance 24
analyses are reported in Table 3 for fiscal performance ratings, nonfiscal performance
ratings, and bonus, while Table 4 contains results for profit and sales.
________________________
Insert Tables 3 & 4 about here
________________________
The top portions of Tables 3 and 4 report fixed effects of the unconditional model,
i.e., estimates of the mean starting performance level (intercept βoo) and mean rate of
change in performance (slope β10) over time. For example, the top portion of Table 3
indicates the average initial fiscal performance rating in Year 1 was 3.82x = and the
average rate of change in fiscal performance rating over each of the next two years was
.02x∆ = . Similarly, Table 4 results indicate the average initial profit in Year 1 was
$34x M= and the average rate of change in profits was $5.1x M∆ = .2 Significant t-ratios
indicated βoo were necessary for any description of individual performance trends. In
contrast, nonsignificant t-ratios indicated β10 were not needed. This suggested either 1)
individual performance trends across all four dependent variables were best described by a
simple average or 2) different trends exist across subgroups of general managers (some
increasing, some decreasing) that, on average, canceled one another out.
Variance components of random effects are reported in the next sections of Tables 3
and 4, revealing the nature of individual performance trend deviations from the mean
performance trend. For example, estimates of variance in initial performance (βoo) and
performance trend (β10) for fiscal performance ratings and profit were 332.22 and 879.56,
respectively. HLM analyses generated a χ2 test of the null hypothesis that no true variation
existed in these parameters. All χ2 statistics reject the null hypotheses, indicating GMs did
vary in initial performance levels and subsequent change in performance over time.

Predicting Executive Performance 25
Reliability estimates reported at the bottom of Tables 3 and 4 capture the systematic
portion of between-group variance. This is the portion of variance in parameter estimates
available to be explained by individual difference measures (predictors) in level-2 HLM
analyses. Reliability estimates suggested the majority of variability in intercept and slope
parameters were not due to error. This is especially important for the slope parameters, as
it suggests meaningful variation in performance trends exist across general managers that
was not due to sampling error. Clusters of general managers with different performance
profiles (i.e., starting point β01 and annual rate of change β10 over the next two years) may
exist.
HLM procedures also estimated the correlation between average initial performance
level (βoo) and subsequent performance trend (β10). This correlation ranged from r = -.06 to
.12 for the five criterion performance measures, suggesting subsequent change in
performance over time is not a function of a general manager's initial performance starting
point.
Intercept- and Slopes-as-Outcomes Model (Level-2). Next, individual difference
measures obtained through the interview-based biodata screening system were used to
predict the intercept and slope parameters estimated at level-1. These results are
presented in Tables 5 and 6.
____________________________
Insert Tables 5 & 6 about here
___________________________
Results indicated the Overall Rating and ratings on dimensions of Financial Analysis,
Understanding the Business, and Short Term Business Execution consistently predicted
initial performance levels (the intercept, βoo) for all five criteria. The Overall Rating and

Predicting Executive Performance 26
ratings on Staffing, Climate Setting and Communications, Customer Interaction, and
Product Planning consistently predicted performance trend (the slope, β10) for all criteria.
Organizational Acumen predicted initial performance levels for fiscal ratings, nonfiscal
ratings, and bonus. It would appear that "resource-problem solving" dimensions (Financial
Analysis, Understanding the Business, Short Term Business Execution) contributed most to
General Managers' initial performance. However, "people-oriented" dimensions (Staffing,
Climate Setting and Communications, and Customer Interaction) contributed most to
prediction of subsequent change in performance.
In sum, HLM results suggest:
1. Initial levels on the dependent variables (β00) were significantly different from
zero.
2. Variance in initial dependent variable levels (β00) is significantly different from
zero and contains reliable, systematic variance.
3. Variance in initial dependent variable levels (β00) is predicted by “resource-
problem solving” competency ratings.
4. Subsequent dependent variable rates of change (β10) are not significantly
different from zero.
5. Variance in dependent variable rates of change (β10) is significantly different
from zero and contains reliable, systematic variance.
6. Variance in dependent variable rates of change (β10) is predicted by “people-
oriented” competency ratings.
Cluster Analyses. Finally, level-1 analyses reported above indicated GMs’
performance varied systematically in initial performance and subsequent performance
trends. Level-2 analyses suggested differences in predictor scores predict initial

Predicting Executive Performance 27
performance and subsequent performance trends. Ward's (1963) hierarchical
agglomerative clustering method was applied to identify cohorts of general managers with
similar performance profiles. Using procedures described by Hofmann et al. (1993), GMs
with linear parameter estimates three or more standard deviations from the mean were
deleted due cluster analysis' sensitivity to outliers (Afifi & Clark, 1984). Examination of
Euclidean distance metrics indicated a four cluster solution should be retained for profit
performance trends, while a two cluster should be retained for sales, bonus, and
performance rating trends.
Cluster analysis results for sales trends resulted in an identifiable "Group 1" with
common membership across profit and sales trends, while profit trend Groups 2, 3, and 4
combined into a single sales trend group. Figure 1 portrays regression profit trend lines
based on empirical Bayes estimates from the level-1 analyses performed within each
cluster. Post hoc discussion with the CEO and senior executives indicated bonus and
performance ratings were particularly responsive to “big wins,” i.e., profit levels that
exceeded expectations by a great deal. Hence, it is not surprising that cluster analyses of
bonuses and performance ratings clearly distinguished the “big win” profit group (Group 1)
while relegating all “non-big win” GMs into a single group. Nonetheless, the four profit trend
group sales trend profiles are plotted in Figure 2 for comparison purposes. Trend lines for
bonus and performance ratings exhibited minor group membership differences from those
generated from sales trend lines and are available from the author on request.
___________________________
Insert Figures 1 & 2 about here
___________________________
Qualitative examination of businesses falling in each cluster yielded a number of
interesting insights. Specifically, Group 1 contained predominantly GM's whose divisions

Predicting Executive Performance 28
produced consumer products or services or were in a communication industry (radio,
television, cable, etc.). Group 2 contained what the CEO described as "niche" businesses
that took advantage of unique market opportunities crossing traditional industry lines.
These markets were viewed as “medium term,” i.e., unlikely to ever evolve into a “mature”
industry (e.g., steel production, nuclear power plant design and construction, etc.), and may
disappear with the advent of some break-through technological innovation. Group 3
divisions addressed traditional, mature industries characterized by low growth and non-
volatile environments. Group 4 divisions looked very similar to Group 3 divisions with some
identifiable "problem," ranging from severe union-management conflict to moderate product
market decline due to gradual customer substitution of new technology or products.
Discussion
The current study reports the first evidence suggesting top-level corporate executive
performance can be reliably predicted from assessments of top-level executive
competencies. Conservative application of the BCG model indicated a minimal expectation
of $3M in additional profit per year for each candidate selected using the procedure.
Importantly, the Overall Rating predicted both initial performance level and subsequent
performance trend across all five criteria. Results addressing the three research questions
suggested different executive competencies predicted initial executive performance than
predicted subsequent performance trend. "Resource problem solving" competencies
captured by Financial Analysis, Understanding the Business, and Short Term Business
Execution ratings consistently predicted initial performance level. "People-oriented"
competencies captured by Staffing, Climate Setting and Communications, and Customer
Interaction ratings predicted subsequent performance trends.
Post-hoc ANOVA comparisons of rating means across clusters of GM's with
homogeneous profit trajectories indicated significant mean differences in Staffing, Climate
Predicting Executive Performance 29
Setting and Communications, and Customer Interaction ratings across groups - GM's who
received higher ratings tended to be in groups with faster profit growth. Hence, the
systematic portion of variance in β10 reported in Tables 3 and 4 was not due to the absence
of a performance trend, but due to systematic variation of performance trends as a function
of GM “people-oriented” skills. Visual interpretation of the “fan” patterns in Figures 1 and 2
suggest these performance trends tended to cancel one another out, causing nonsignificant
β10 in Tables 3 and 4 in the presence of χ2 tests rejecting the hypothesis of no significant
variance in β10.
This pattern of results yields strong implications for development of a grounded
theory of executive performance (Glaser & Strauss, 1967). Existing competency models of
management or leadership performance did not suggest different executive competencies
would predict initial performance and subsequent performance trend. Before weaving any
post hoc explanation for the prediction pattern, the CEO, senior executives, and select
study participants (SMEs) were briefed on the results presented above and asked for their
interpretation (results were presented absent any initial interpretation). Executives
suggested GMs would quickly diagnose and address problems or opportunities in which
"resource problem solving" competencies could enhance performance (e.g., changing cash
management procedures, upgrading inventory control systems, or other "financial analysis"
or "short term business execution" activities).
In contrast, managing relationships with employees or customers (e.g., Staffing or
Customer Interaction efforts) would take longer to implement, causing lagged performance
gains that contribute to performance trends. Simply put, good GMs were thought to exert
strong controls immediately over raw materials and other capital assets (e.g., financial and
inventory controls), while efforts to implement a new vision or mission paired with necessary

Predicting Executive Performance 30
changes in trust, work values, corporate culture, and vendor/customer relations did not
occur quickly. Hence, it was not surprising to SMEs that “resource problem solving”
contributed most to prediction of initial performance levels, while “people-oriented”
dimensions predicted subsequent performance change.
In support of this interpretation, a number of SMEs participating in the briefing
offered different "new GM schemas" or "lessons" passed on to them by mentors upon
taking their initial GM assignment. Example "lessons" included 1) "poll your top talent for
ideas on how to get a 'quick win' right away while you get the lay of the land and try and
develop relationships with key customers, vendors, and employee talent" and 2) "find out
who you can count on by their reactions to operational changes you absolutely 'know' will
have a positive impact before you make any major personnel changes."
This interpretation might be labeled a “time-oriented situation specificity” explanation.
Specifically, a competency’s contribution to performance prediction depends on the time
frame in which the performance measure was obtained, providing initial support for
Hambrick and Fukutomi’s (1991) hypotheses about “seasons” of executive performance –
different capabilities contribute to performance in different “seasons.” Cluster analysis
results compliment and extend these findings. Qualitatively different "situations" or industry
characteristics covaried with differences in performance trends.
Psychological research has a long history of theory and empirical support for person-
situation interaction effects (Epstein, 1984). Unfortunately, empirical assessment of
interactions between subgroup membership and executive competency ratings on initial
performance level or subsequent performance trend was not possible in the current data
due to severe consumption of degrees of freedom when HLM analysis was extended to an
additional third level (by way of comparison to traditional OLS procedures, nine competency
ratings, an overall rating, a dummy coded group membership variable, and 40 two-way

Predicting Executive Performance 31
interactions between the group membership variable and competency ratings consumes 51
degrees of freedom from an original sample of N = 98). Regardless, exploratory cluster
analysis results reported above suggest “strong situations” occur at executive levels and
have a main effect on performance (Epstein, 1984). Post hoc discussion with senior
corporate executives and participants suggested some GM positions were "hot," or had
greater potential for a competent GM to generate high performance levels. This suggests
performance variance may not be constant across clusters due to opportunity-induced
range restriction. If subsequent research confirms these speculations, violation of
parametric assumption of homogeneity of variance will preclude use of OLS or ANOVA
procedures (though HLM inferences are unaffected, Bryk & Raudenbush, 1992, p. 15).
Future research using larger samples “within-situation” is needed to test the person-
situation interaction effects suggested by exploratory analyses reported here.
A number of research questions remain. The current study provided no direct insight
(other than SMEs post hoc interpretations) into processes by which top-level executives
influenced their environments. Many alternative explanations are possible, e.g., “resource
problem solving” competencies may fail to contribute to later performance gains because of
a ceiling effect (i.e., only a limited amount of performance is available to be gained from
“resource problem solving” efforts). Even if SME post hoc explanations were accepted at
face value, we do not know what GMs who were high on Financial Analysis did that may
have caused higher levels of initial performance. Future research needs to examine
whether more than one profile or pattern of GM on-the-job behaviors is equally likely to
result in performance, much as McCall and Lombardo (1983) and Leslie and Van Velsor
(1996) found multiple ways in which managers "derail."
In sum, ratings obtained from an interview-based biographical information selection
technology were shown to predict initial performance and subsequent performance trends in

Predicting Executive Performance 32
a sample of top-level corporate executives. Immediate implications for practice suggest
organizations will realize substantial financial performance gains when executives are
selected with such a system. Implications for a theory or model of executive competencies
suggest main effects for person characteristics (competency ratings) and situation
characteristics (group characteristics) on subsequent performance trends. Future research
needs to examine whether “fit” as reflected in executive competency by situation
characteristic interactions contribute to prediction of initial performance or subsequent
performance trends.

Predicting Executive Performance 33
References
Ackerman, P.L. (1989). Within-task intercorrelations of skilled performance:
Implications for predicting individual differences? (A comment on Henry & Hulin, 1987).
Journal of Applied Psychology, 74, 360-364.
Afifi, A.A. & Clark, V. (1984). Computer-aided multivariate analysis. New York: Van
Nostrand Reinhold.
Alexander, R.A., Barrett, G.V., & Doverspike, D. (1991, April). Appropriate (and
inappropriate) data and analyses relevant to the dynamic criteria question. In R.J. Hanges
(Chair), Dynamic criteria: Are we shooting at a moving target? Symposium conducted at
the sixth annual conference of the Society of Industrial and Organizational Psychology, St.
Louis, MO.
Austin, J.T., Hmphreys, L.G., & Hulin, C.L. (1989). Another view of dynamic criteria:
A critical reanalysis of Barrett, Caldwell, and Alexander. Personnel Psychology, 42, 583-
596.
Barling, J., Weber, T., & Kelloway, E.K. (1996). Effects of transformational
leadership training on attitudinal and financial outcomes: A field experiment. Journal of
Applied Psychology, 81, 827-832.
Barrett, G.V. & Alexander, R.A. (1989). Rejoinder to Austin, Humphreys, and Hulin:
A critical reanalysis of Barrett, Caldwell, and Alexander. Personnel Psychology, 42, 597-
612.
Bass, B.M. (1985). Leadership and performance beyond expectations. New York:
Free Press.
Bass, B.M. (1998). Transformational leadership: Industry, military, and educational
impact. Mahwah, NJ: Erlbaum.
Predicting Executive Performance 34
Bergh, D.D. (1993a). Watch the time carefully: The use and misuses of time effects
in management research. Journal of Management, 19, 683-705.
Bergh, D.D. (1993b). Don't "waste" your time! The effects of time series errors in
management research: The case of ownership concentrations and research and
development spending. Journal of Management, 19, 897-914.
Bergh, D.D. (1995). Problems with repeated measures analysis: Demonstration with
a study of the diversification and performance relationship. Academy of Management
Journal, 38, 1692-1708.
Boyatzis, R.E. (1982). The competent manager. New York: Wiley.
Brogden, H.E. (1946). On the interpretation of the correlation coefficient as a
measure of predictive efficiency. Journal of Applied Psychology, 37, 65-76.
Brogden, H.E. (1949). When testing pays off. Personnel Psychology, 2, 171-183.
Bryk, A.S. & Raudenbush, S.W. (1987). Application of hierarchical linear models to
assessing change. Psychological Bulletin, 101, 147-158.
Bryk, A.S. & Raudenbush, S.W. (1992). Hierarchical linear models: Applications and
data analysis methods. Newbury Park, CA: Sage.
Bryk, A.S., Raudenbush, S.W., & Congdon, R.J. (1992). Hierarchical linear models:
Applications and data analysis methods. Newbury Park, CA: Sage.
Burns, J.M. (1978). Leadership. New York: Harper & Row.
Carroll, J.B. (1993). Human cognitive abilities: A survey of factor analytic studies.
Charlottsville, VA: Cambridge University Press.
Cronbach, L.J. & Gleser, G. (1965) Psychological tests and personnel decisions.
Urbana, IL: University of Illinois Press.
Dawes, R. & Corrigan, B. (1974). Linear models in decision making. Psychological
Bulletin, 81, 414-417.

Predicting Executive Performance 35
Deadrick, D.L., Bennett, N., & Russell, C.J. (1997). Using hierarchical linear
modeling to examine dynamic performance criteria over time. Journal of Management, 23,
745-757.
Deadrick, D.L. & Madigan, R.M. (1990). Dynamic criteria revisited: A longitudinal
study of performance stability and predictive validity. Personnel Psychology, 43, 717-744.
Epstein, S. (1984). The stability of behavior across time and situations. In R. Zucker
and A.I. Rabin (Eds.), Personality and the prediction of behavior(pp. 209-268). San Diego,
CA: Academic Press.
Fleishman, E.A. (1972). On the relation between abilities, learning, and human
performance. American Psychologist, 27, 1017-1032.
Glaser, B.G. & Strauss, A.L. (1967). The discovery of grounded theory: Strategies
for qualitative research. New York: Aldine.
Guion, R. (1998). Assessment, measurement, and prediction for personnel
decisions. Mahwah, NJ: Erlbaum.
Gupta, A.K. (1984). Contingency linkages between strategy and general managerial
characteristics: A conceptual examination. Academy of Management Review, 9, 399-412.
Gupta, A.K. & Govindarajan, V. (1984). Business unit strategy, managerial
characteristics, and business unit effectiveness at strategy implementation. Academy of
Management Review, 27, 25-41.
Gupta, A.K. & Taylor, M.S. (1988). What general managers say about their careers:
A survey of Fortune 500 corporations on linkages between business strategies and
executive careers. College of Business and Management, University of Maryland: College
Park, MD.
Hambrick, D.C. & Fukutomi, G.D.S. (1991). The seasons of a CEO’s tenure.
Academy of Management Review, 16, 719-742.

Predicting Executive Performance 36
Harold, D.M., Fields, D.I., & Wyatt, C.W. (1993, August). Using leadership
instruments in a management development context: What are we measuring? Presented at
the annual meetings of the Academy of Management, Atlanta, GA.
Henry, R.A. & Hulin, C.L. (1987). Stability of skilled performance across time: Some
generalizations and limitations on utilities. Journal of Applied Psychology, 72, 457-462.
Hofmann, D.A. (1997). An overview of the logic and rationale of hierarchical linear
models. Journal of Management, 23, 723-744.
Hofmann, D.A., Jacobs, R., & Baratta, J.E. (1993). Dynamic criteria and the
measurement of change. Journal of Applied Psychology, 78, 194-204.
Hofmann, D.A., Jacobs, R., & Gerras, S.J. (1992). Mapping individual performance
over time. Journal of Applied Psychology, 77, 185-195.
House, R.J. (1977). A 1976 theory of charismatic leadership. In. J.G. Hunt and L.L.
Larson (Eds.), Leadership: The cutting edge (pp. 189-207). Carbondale, IL: Southern Illinois
University Press.
Hulin, C.L., Henry, R.A., & Noon, S.L. (1990). Adding a dimension: Time as a factor
in the generalizability of predictive relationships. Psychological Bulletin, 107, 328-340.
Hunter, J. E., & Hunter, R. F. (1984). Validity and utility of alternative predictors of
job performance. Psychological Bulletin, 96, 72-98.
James, L.R., Demaree, R.G., Mulaik, S.A., & Ladd, R.T. (1992). Validity
generalization in the context of situational models. Journal of Applied Psychology, 77, 3-14.
Kanfer, R. & Ackerman, P.L. (1989). Motivation and cognitive abilities: An
integrated/aptitude-treatment interaction approach to skill acquisition. Journal of Applied
Psychology, 74, 657-690.
Katz, R.L. (1955, January-February). Skills of an effective administrator. Harvard
Business Review, 33-42.

Predicting Executive Performance 37
Katzell, R.A., Barrett, R.S., Vann, D.H., & Hogan, J.M. (1968). Organizational
correlates of executive roles. Journal of Applied Psychology, 52, 22-28.
Kidwell, R.E., Mossholder, K.W., & Bennett, N. (1997). Cohesiveness and
organizational citizenship behavior: A multi-level analysis using work groups and
individuals. Journal of Management, 23, 775-793.
Kirkpatrick, S.A. & Locke, E.A. (1996). Direct and indirect effects of three core
charismatic leadership components on performance and attitudes. Journal of Applied
Psychology, 81, 36-51.
Kotter, J. (1982). The general managers. New York: The Free Press.
Kotter, J. (1986). The leadership factor. New York: The Free Press.
Kotter, J. (1990). A force for change: How leadership differs from management.
New York: The Free Press.
Kouzes, J.M. & Posner, B.Z. (1995). The leadership challenge: How
to keep getting extraordinary things done in organizations. San Francisco:
Jossey-Bass.
Leslie, J.G. & Van Velsor, E. (1996). A look at derailment today: North America and
Europe. Greensboro, NC: Center for Creative Leadership.
Mann, F.C. (1965). Toward an understanding of the leadership role in formal
organization. In R. Dubin, G.C., Homans, F.C. Mann, and D.C. Miller (Eds.), Leadership
and productivity, some facts of industrial life (pp. 44-78). San Francisco: Chandler.
McCall, M.W. Jr. (1992). Executive development as a business strategy.
Journal of Business Strategy, 13, 25-31.
McCauley, C.D. (1986). Developmental experiences in managerial work: A literature
review. (Technical Report No. 26). Greensboro, NC: Center for Creative Leadership.
Predicting Executive Performance 38
McCauley, C.D., Ruderman, M.N., Ohlott, P.J., & Morrow, J.E. (1994). Assessing
the development components of managerial jobs. Journal of Applied Psychology, 79, 544-
560.
Morrison, R.G., & Hock, R.R. (1986). Career building: Learning from cumulative work
experience. In D.T. Hall (Ed.), Career development in organizations (pp. 236-273). San
Francisco: Jossey-Bass.
Mulaik, S.A., James, L.R., Van Alstine, J., Bennett, N., Lind, S., & Stilwell, C.D.
(1989). Evaluation of goodness-of-fit indices for structural equation models. Psychological
Bulletin, 105, 430-445.
Murphy, K.R. (1989). Is the relationship between cognitive ability and job
performance stable over time? Human Performance, 2, 183-200.
Posner, B.Z. & Kouzes, J.M. (1988). Development and validation of the leadership
practices inventory. Educational and Psychological Measurement, 48(2), 483-496.
Posner, B.Z. & Kouzes, J.M. (1993). Psychometric properties of the leadership
practices inventory - updated. Educational and Psychological Measurement, 53(1), 191-
199.
Rambo, W.W. & Chomiak, A.M. & Price, J.M. (1983). Consistency of performance
under stable conditions of work. Journal of Applied Psychology, 68, 78-87.
Russell, C.J. (1990). Selecting top corporate leaders: An example of biographical
information. Journal of Management, 16, 73-86.
Russell, C.J., Colella, A., & Bobko, P.Q. (1993). Expanding the context of utility: The
strategic impact of personnel selection. Personnel Psychology, 46, 781-801.
Sandberg, J. (2000). Understanding human competence at work: An interpretive
approach. Academy of Management Journal, 43, 9-25.

Predicting Executive Performance 39
Sessa, V.I., Kaiser, R., Taylor, J.K., & Campbell, R.J. (1999). Executive selection: A
research report on what works and what doesn't. Greensboro, NC: Center for Creative
Leadership.
Schmitt, N., Gooding, R. Z., Noe, R. D., & Kirsch, M. (1984). Meta-analyses of
validity studies published between 1964 and 1982 and the investigation of study
characteristics. Personnel Psychology, 37, 407-422.
Sloan, E.B., Hezlett, S.A., Kuncel, N.R., & Sytsma, M.R. (1996, April). Performance,
potential, and peril: What it takes to succeed at the top. Paper presented at the 11th annual
conference of the Society of Industrial and Organizational Psychology, San Diego, CA.
Spearman, C. (1902). General intelligence, objectively determined and measured.
American Journal of Psychology, 15, 201-293.
Spearman, C. (1927). The abilities of man. London: Macmillan.
Spreitzer, G.M., McCall, M.W., & Mahoney, J.D. (1997). Early identification of
international executive potential. Journal of Applied Psychology, 82, 6-29.
Stogdill, R.M. (1948). Personal factors associated with leadership: A survey of the
literature. Journal of Psychology, 25, 35-71.
Stogdill, R.M. (1974). Handbook of leadership: A survey of the literature. New York:
Free Press.
Welbourne, T. & Andrews, A. (1996). Predicting performance of initial public offering
firms: Should HRM be in the equation? Academy of Management Journal, 39, 891-919.
Yammarino, F.J., Dubinsky, A.J., Comer, L.B., & Jolson, M.A. (1997). Women and
transformational and contingent reward leadership: A multiple-levels-of-analysis
perspective. Academy of Management Journal, 40, 205-222.
Yammarino, F.J., Spangler, W.D., & Bass, B.M. (1993). Transformational leadership
and performance: A longitudinal investigation. Leadership Quarterly, 4, 81-102.

Predicting Executive Performance 40
Yammarino, F.J., Spangler, W.D., & Dubinsky, A.J. (1998). Transformational and
contingent reward leadership: Individual, dyad, and group levels of analysis. Leadership
Quarterly, 9, 27-54.

Predicting Executive Performance 41
Table 1
General Manager Job Dimension Definitions1
D1: Understanding, analyzing, and setting direction for a business: Finding out what is going on by seeking information from many sources on all aspects of the business and interprets, integrates, and evaluates it for use in decision making and subsequent communication with others.
D2: Short term business execution: Responding to ongoing operational problems by
balancing consequences and taking action to implement. Installs or changes systems to support operation.
D3: Communication and climate setting: Establishing the environment (climate) for
unfiltered information to be easily and informally received from and provided to all levels in his/her organization.
D4: Customer and other external relations: Promotes company's interest by
interacting with and influencing customers, vendors, and community leaders. Actively monitors legislative/governmental environment for changes impacting business.
D5: Staffing: Takes action to identify, evaluate, develop, select, and remove
employees as appropriate in order to build teams that get the job done and have people in place to run the business.
D6: Financial analysis: Uses financial tools to understand financial implications in
business decision making and execution. Develops short- and long-range financial objectives and evaluates performance in relation to financial commitments.
D7: Strategic planning: Develops strategies and responses which have long-range
consequences and takes the necessary action to implement them. D8: Product planning and development: Seizes opportunities by anticipating new or
expanded demands for products or services, selecting the right alternatives and stimulating others to develop market opportunities.
D9: Organizational acumen: Understands and uses the corporate environment to
achieve both individual and unit objectives.
1. Definitions reported originally by Russell (1990).

Pred
ictin
g Ex
ecut
ive
Perfo
rman
ce 4
2 Ta
ble
2
Des
crip
tive
Stat
istic
s an
d Si
mpl
e C
orre
latio
ns (N
= 9
8)∗
Pr
edic
tor
Varia
bles
Dep
ende
nt
Varia
bles
X
S
D1
D2
D3
D4
D5
D6
D7
D8
D9
Overall Rating
Average Quest. Response Fiscal Rating Year 1 Fiscal Rating Year 2 Fiscal Rating Year 3 Nonfiscal Rating Year 1 Nonfiscal Rating Year 2 Nonfiscal Rating Year 3
Bonus Year 1
Bonus Year 2
Bonus Year 3
Profit Year 1
Profit Year 2
Profit Year 3
Sales Year 1
Sales Year 2
Sales Year 3
D1:
Und
erst
and-
ing
busi
ness
2.
90
.84
-
D2:
Sho
rt te
rm
exec
utio
n 3.
00
1.00
44
-
D3:
Clim
ate
& C
omm
unic
atio
n 2.
80
.97
22
52
-
D4:
Cus
tom
er
Inte
ract
ion
2.60
1.
01
36
33
30
-
D5:
Sta
ffing
2.
50
.91
25
31
39
00
-
D6:
Fin
anci
al
anal
ysis
2.
40
.87
27
00
-01
-31
21
-
D7:
Stra
tegi
c pl
anni
ng
2.40
1.
07
14
-03
22
06
19
42
-
D8:
Pro
duct
pl
anni
ng
2.50
.9
9 29
20
21
21
-0
1 -2
2 21
-
D9:
Org
. ac
umen
2.
30
.89
11
01
38
22
25
23
35
-20
-
Ove
rall
Rat
ing
1.90
(1
.40 )
.55
(.75)
54
39
44
29
24
06
09
18
26
-
Aver
age
Que
st.
Res
pons
e 5.
7 1.
9 16
14
17
11
09
22
13
13
21
18
-
Fisc
al P
erf.
Rat
ing
Year
1
3.82
.1
2 22
22
19
28
19
17
21
11
13
41
(5
2)
08
-
Fisc
al P
erf.
Rat
ing
Year
2
3.81
.1
5 25
26
22
29
30
30
14
14
11
37
(4
8)
-02
59
-
* A
ll st
atis
tics
in p
aren
thes
es w
ere
eith
er 1
) der
ived
from
the
appl
ican
t poo
l (N
= 1
33) o
r 2) a
re c
orre
latio
ns c
orre
cted
for d
irect
rang
e re
stric
tion.
All
corre
latio
ns
are
repo
rted
with
out d
ecim
al p
oint
s. A
ll co
rrela
tions
≥ ±
.20
are
sign
ifica
ntly
diff
eren
t fro
m z
ero
at p
< .0
5 (2
-taile
d te
st) a
nd c
orre
latio
ns ≥
±.2
5 ar
e si
gnifi
cant
ly
diffe
rent
from
zer
o at
p <
.01
(2-ta
iled)
.

Pred
ictin
g Pe
rform
ance
43
Pred
icto
r Va
riabl
es
Dep
ende
nt
Varia
bles
X
S
D1
D2
D3
D4
D5
D6
D7
D8
D9
Overall Rating
Average Quest. Response Fiscal Rating Year 1 Fiscal Rating Year 2 Fiscal Rating Year 3 Nonfiscal Rating Year 1 Nonfiscal Rating Year 2 Nonfiscal Rating Year 3
Bonus Year 1
Bonus Year 2
Bonus Year 3
Profit Year 1
Profit Year 2
Profit Year 3
Sales Year 1
Sales Year 2
Sales Year 3
Fisc
al P
erf.
Rat
ing
Year
3
3.79
.1
1 19
20
21
30
29
25
22
21
17
40
(5
1)
06
55
66
-
Non
fisca
l Per
f. R
atin
g Ye
ar 1
3.
89
.18
12
08
13
08
05
06
07
12
11
25
(33)
11
22
25
16
-
Non
fisca
l Per
f. R
atin
g Ye
ar 2
3.
89
.13
09
10
10
13
05
05
12
11
03
25
(33)
17
20
19
18
67
-
Non
fisca
l Per
f. R
atin
g Ye
ar 3
3.
90
.19
02
04
03
09
06
10
08
08
10
27
(36)
16
29
22
12
72
69
-
Bonu
s Ye
ar 1
1 35
k 40
k 13
10
22
28
14
23
17
-0
1 17
22
(3
1)
13
78
59
69
57
58
39
-
Bonu
s Ye
ar 2
33
k 22
k 11
03
26
25
28
22
10
09
15
27
(3
6)
09
77
82
77
45
62
55
89
-
Bonu
s Ye
ar 3
47
k 36
k 17
13
19
30
33
15
04
15
11
29
(4
0)
12
67
67
80
52
56
50
65
81
-
Prof
it Ye
ar 1
2 34
M
15M
19
22
20
25
11
16
17
22
20
30
(3
9)
15
67
54
45
33
36
55
67
56
46
-
Prof
it Ye
ar 2
37
M
22M
11
11
15
21
22
10
10
04
08
28
(3
7)
08
43
73
60
43
44
52
48
70
56
78
-
Prof
it Ye
ar 3
44
M
14M
19
11
04
25
14
16
17
15
20
33
(4
3)
00
45
59
74
44
34
53
37
51
62
65
76
-
Sale
s Ye
ar 1
3 45
5M
175M
14
20
20
25
13
12
12
22
20
10
(1
4)
07
52
58
53
28
40
22
72
46
41
82
77
69
-
Sale
s Ye
ar 2
48
5M
132M
13
11
15
23
02
11
10
06
07
12
(1
6)
11
49
58
53
30
33
31
57
53
58
73
67
71
80
-
Sale
s Ye
ar 3
49
2M
167M
10
14
04
21
14
13
13
12
20
09
(1
2)
04
55
55
61
30
29
22
50
44
64
61
56
77
67
72
-
* A
ll st
atis
tics
in p
aren
thes
es w
ere
eith
er 1
) der
ived
from
the
appl
ican
t poo
l (N
= 1
33) o
r 2) a
re c
orre
latio
ns c
orre
cted
for d
irect
rang
e re
stric
tion.
All
corre
latio
ns
are
repo
rted
with
out d
ecim
al p
oint
s. A
ll co
rrela
tions
≥ ±
.20
are
sign
ifica
ntly
diff
eren
t fro
m z
ero
at p
< .0
5 (2
-taile
d) a
nd c
orre
latio
ns ≥
±.2
5 ar
e si
gnifi
cant
ly d
iffer
ent
from
zer
o at
p <
.01
(2-ta
iled)
. 1 B
onus
es a
re e
xpre
ssed
in th
ousa
nds
of d
olla
rs.
2 Pro
fits
are
expr
esse
d in
milli
ons
of d
olla
rs.
3 Sal
es a
re e
xpre
ss in
milli
ons
of d
olla
rs.
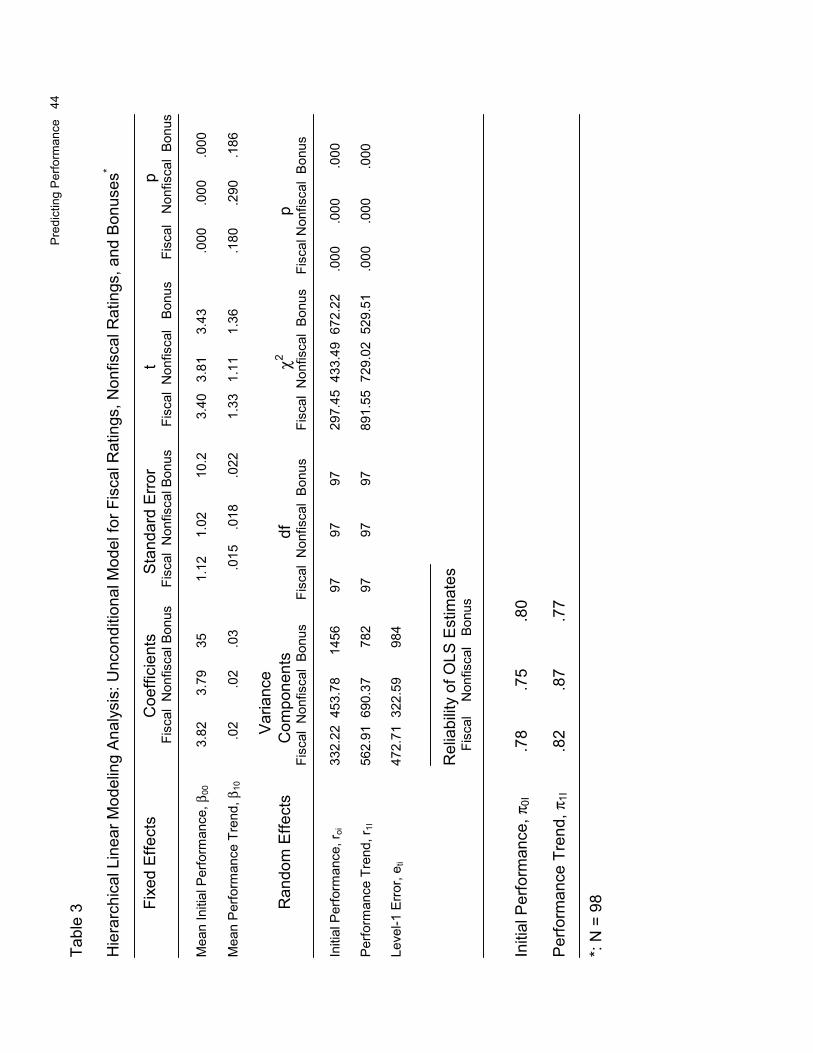
Pred
ictin
g Pe
rform
ance
44
Tabl
e 3
Hie
rarc
hica
l Lin
ear M
odel
ing
Anal
ysis
: Unc
ondi
tiona
l Mod
el fo
r Fis
cal R
atin
gs, N
onfis
cal R
atin
gs, a
nd B
onus
es*
Fi
xed
Effe
cts
Coe
ffici
ents
Stan
dard
Erro
r
t
p
Fisc
al N
onfis
cal B
onus
F
isca
l N
onfis
cal B
onus
F
isca
l N
onfis
cal
Bon
us
Fi
scal
N
onfis
cal
Bonu
s M
ean
Initi
al P
erfo
rman
ce, β
00
3
.82
3.79
35
1
.12
1
.02
10.2
3.40
3.
81
3.43
.000
.000
.000
M
ean
Perfo
rman
ce T
rend
, β10
.0
2
.
02
.0
3
.015
.0
18
.022
1.33
1.
11
1.36
.180
.290
.186
V
aria
nce
R
ando
m E
ffect
s
Com
pone
nts
d
f
χ2
p
Fi
scal
Non
fisca
l Bo
nus
F
isca
l N
onfis
cal
Bonu
s Fi
scal
Non
fisca
l Bo
nus
Fi
scal
Non
fisca
l Bo
nus
Initi
al P
erfo
rman
ce, r
oi
332.
22 4
53.7
8
145
6
9
7
97
97
29
7.45
433
.49
672.
22
.0
00
.0
00
.
000
Perfo
rman
ce T
rend
, r1I
562
.91
690.
37
7
82
97
97
97
8
91.5
5 72
9.02
529
.51
.0
00
.0
00
.
000
Leve
l-1 E
rror,
e ti
472
.71
322.
59
9
84
Rel
iabi
lity
of O
LS E
stim
ates
Fis
cal
Non
fisca
l B
onus
In
itial
Per
form
ance
, π0I
.78
.75
.80
Perfo
rman
ce T
rend
, π1I
.82
.87
.77
*: N
= 9
8

Pred
ictin
g Pe
rform
ance
45
Tabl
e 4
Hie
rarc
hica
l Lin
ear M
odel
ing
Anal
ysis
: Unc
ondi
tiona
l Mod
el fo
r Pro
fit a
nd S
ales
*
Fi
xed
Effe
cts
Coe
ffici
ents
Stan
dard
Erro
r
t
p
P
rofit
S
ales
Pr
ofit
Sa
les
Prof
it
Sale
s
Prof
it
Sale
s M
ean
Initi
al P
erfo
rman
ce, β
00
34.0
45
5.0
4.
25
75.8
0
8.00
6.
00
.0
00
.000
M
ean
Perfo
rman
ce T
rend
, β10
5
1
2
3.31
7.
85
1.
54
1.57
.130
.1
20
Varia
nce
R
ando
m E
ffect
s
Com
pone
nts
df
χ2
p
P
rofit
S
ales
P
rofit
S
ales
Pro
fit
Sal
es
Prof
it
Sale
s In
itial
Per
form
ance
, roi
873.
56
24,8
54.4
8
97
9
7
1,0
43.5
6 1,
296.
56
.000
.0
00
Perfo
rman
ce T
rend
, r1I
1,50
9.38
34
,971
.00
9
7
97
1
,893
.05
2,12
9.90
.0
00
.000
Leve
l-1 E
rror,
e ti
54
8.11
789
.49
Rel
iabi
lity
of O
LS E
stim
ates
Prof
it
Sale
s In
itial
Per
form
ance
, π0I
.87
.90
Perfo
rman
ce T
rend
, π1I
.91
.97
*: N
= 9
8

Pred
ictin
g Ex
ecut
ive
Perfo
rman
ce 4
6 Ta
ble
5 H
iera
rchi
cal L
inea
r Mod
el A
naly
sis
- Con
ditio
nal M
odel
for F
isca
l and
Non
fisca
l Per
form
ance
Rat
ings
1
Fixe
d Ef
fect
s
Coe
ffici
ent
St
anda
rd E
rror
Fi
scal
Non
fisca
l
Bon
us
Fi
scal
N
onfis
cal
B
onus
M
odel
for I
nitia
l Sta
tus,
π0I
Inte
rcep
t, β 0
0
5.
53
6.
48
12.4
5
3.81
5.12
13.
87
D
1, U
nder
stan
ding
. . .
bus
ines
s, β
01
.
58*
.
71*
2.5
4**
.
21
.3
2
.
99
D
2, S
hort
term
. . .
exe
cutio
n, β
02
.6
7**
.
42*
3.0
2**
.
25
.2
1
1.
01
D
3, C
limat
e se
tting
& c
omm
unic
atio
ns, β
03
.83
.
53
1.9
3*
.
65
.5
6
.
79
D
4, C
usto
mer
inte
ract
ion,
β04
.3
4
.17
3
.49
.
33
.2
5
3.
81
D
5, S
taffi
ng, β
05
.61
.
79
1.0
0
.56
.71
2.34
D
6, F
inan
cial
ana
lysi
s, β
06
.41*
.91
**
4
.51*
*
.21
.33
1.57
D
7, S
trate
gic
plan
ning
, β07
.8
8
.52
3
.92
.
97
.6
9
2.
67
D
8, P
rodu
ct p
lann
ing,
β08
.36
.
71
2.2
2
.56
.59
2.05
D
9, O
rg. a
cum
en, β
09
.7
8
.43
3
.92
.
77
.6
7
4.
02
O
vera
ll R
atin
g, β
010
.8
8*
.
38**
2.7
4*
.
38
.1
1
1.
35
Q
uest
ionn
aire
, β01
1
.45
.
73
4.0
1
.74
.56
2.98
1 N =
98
* p <
.05,
** p
< .0
1, **
* p <
.001
, 2-ta
iled.

Pred
ictin
g Pe
rform
ance
47
Tabl
e 5
(con
n.)
Mod
el fo
r Per
form
ance
Tre
nd, π
1I
C
oeffi
cien
t
Stan
dard
Erro
r
Fi
scal
Non
fisca
l
Bon
us
Fi
scal
N
onfis
cal
B
onus
Inte
rcep
t, β 1
0
.16
6
-.0
15
5.90
8.2
3
.
031
14.2
D
1, U
nder
stan
ding
. . .
bus
ines
s, β
11
.116
.2
08
2.45
.0
71
.191
1
.57
D
2, S
hort
term
. . .
exe
cutio
n, β
12
.142
.2
03
2.78
.0
94
.093
1
.89
D
3, C
limat
e se
tting
& c
omm
unic
atio
ns, β
13
.0
55*
.047
* 2.
05*
.022
.0
21
1.0
0
D
4, C
usto
mer
inte
ract
ion,
β14
.021
*
.0
21*
2.87
**
.0
11
.010
.87
D
5, S
taffi
ng, β
15
.0
97**
.0
38**
**
1.91
***
.0
33
.009
.58
D
6, F
inan
cial
ana
lysi
s, β
16
.0
64
.082
1.
02
.052
.0
54
1.0
7
D
7, S
trate
gic
plan
ning
, β17
.059
.0
52
2.79
.0
38
.064
1
.98
D
8, P
rodu
ct p
lann
ing,
β18
.0
43**
.0
68**
1.
87*
.015
.0
23
1.0
0
D
9, O
rg. a
cum
en, β
19
.030
**
.094
* 2.
29**
.012
.0
43
.7
9
O
vera
ll R
atin
g, β
110
.012
**
.051
**
4.40
*
.0
04
.019
2
.11
Q
uest
ionn
aire
, β11
1
.0
11
.009
1.
05
.012
.0
09
1.3
4
1 N =
98
* p <
.05,
** p
< .0
1, **
* p <
.001
, 2-ta
iled.
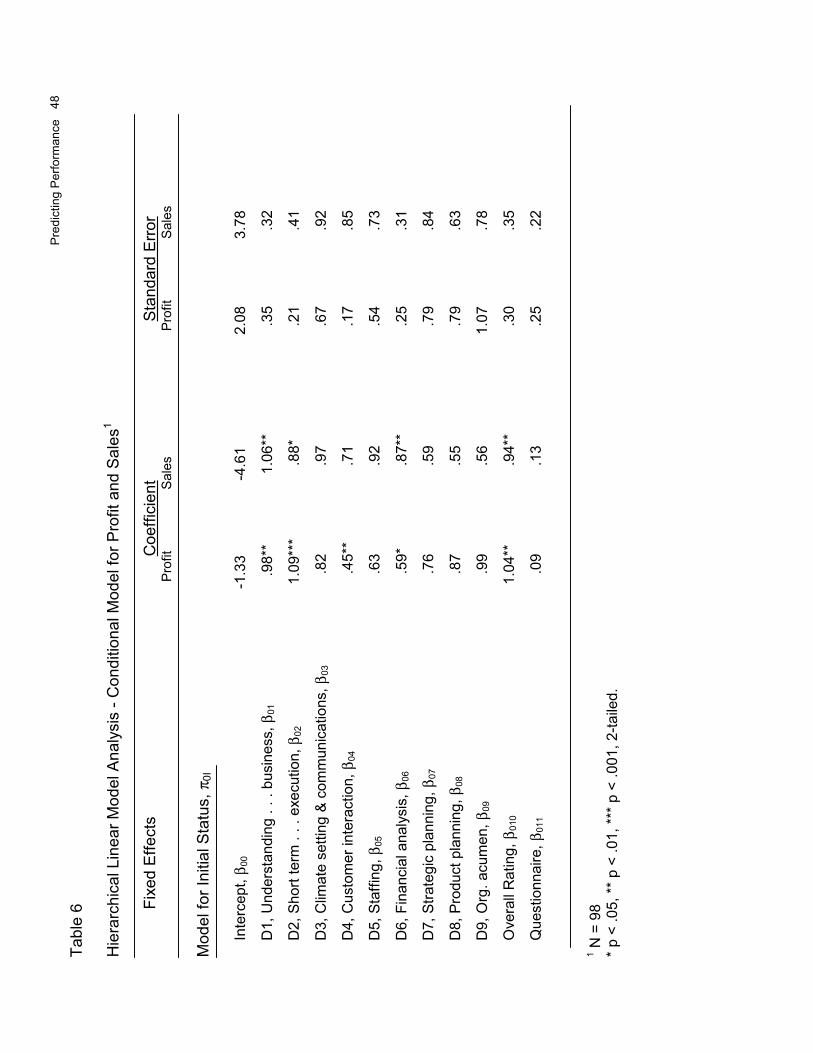
Pred
ictin
g Pe
rform
ance
48
Tabl
e 6
Hie
rarc
hica
l Lin
ear M
odel
Ana
lysi
s - C
ondi
tiona
l Mod
el fo
r Pro
fit a
nd S
ales
1
Fi
xed
Effe
cts
Coe
ffici
ent
St
anda
rd E
rror
Prof
it
Sal
es
P
rofit
Sale
s M
odel
for I
nitia
l Sta
tus,
π0I
Inte
rcep
t, β 0
0
-
1.33
-4.
61
2.08
3.78
D
1, U
nder
stan
ding
. . .
bus
ines
s, β
01
.98
**
1
.06*
*
.35
.32
D
2, S
hort
term
. . .
exe
cutio
n, β
02
1.09
***
.88*
.21
.41
D
3, C
limat
e se
tting
& c
omm
unic
atio
ns, β
03
.8
2
.9
7
.
67
.
92
D
4, C
usto
mer
inte
ract
ion,
β04
.45*
*
.7
1
.
17
.
85
D
5, S
taffi
ng, β
05
.6
3
.9
2
.
54
.
73
D
6, F
inan
cial
ana
lysi
s, β
06
.59*
.8
7**
.
25
.
31
D
7, S
trate
gic
plan
ning
, β07
.76
.59
.79
.84
D
8, P
rodu
ct p
lann
ing,
β08
.8
7
.5
5
.
79
.
63
D
9, O
rg. a
cum
en, β
09
.99
.56
1.07
.78
O
vera
ll R
atin
g, β
010
1.04
**
.94*
*
.30
.35
Q
uest
ionn
aire
, β01
1
.0
9
.1
3
.
25
.
22
1 N =
98
* p <
.05,
** p
< .0
1, **
* p <
.001
, 2-ta
iled.

Pred
ictin
g Pe
rform
ance
49
Tabl
e 6
(con
n.)
Mod
el fo
r Per
form
ance
Tre
nd, π
1I
C
oeffi
cien
t
Stan
dard
Erro
r
Pr
ofit
Sal
es
P
rofit
Sa
les
In
terc
ept,
β 10
-8
.11
-7
.45
8
.23
9.3
8
D
1, U
nder
stan
ding
. . .
bus
ines
s, β
11
.5
6
.78
.6
1
.9
1
D
2, S
hort
term
. . .
exe
cutio
n, β
12
.1
2
.4
3
.42
.39
D
3, C
limat
e se
tting
& c
omm
unic
atio
ns, β
13
.55*
.67*
.2
6
.30
D
4, C
usto
mer
inte
ract
ion,
β14
.8
1*
.4
1*
.36
.18
D
5, S
taffi
ng, β
15
.89*
*
.7
8***
*
.3
3
.09
D
6, F
inan
cial
ana
lysi
s, β
16
.26
.4
5
.20
.4
4
D
7, S
trate
gic
plan
ning
, β17
.4
5
.82
.3
8
.67
D
8, P
rodu
ct p
lann
ing,
β18
.57*
*
.68*
*
.2
2
.23
D
9, O
rg. a
cum
en, β
19
.8
0**
.69*
.2
7
.3
1
O
vera
ll R
atin
g, β
110
1.2
0**
1.5
0**
.43
.83
Q
uest
ionn
aire
, β11
1
.02
.03
.1
2
.0
9
1 N =
98
* p <
.05,
** p
< .0
1, **
* p <
.001
, 2-ta
iled.
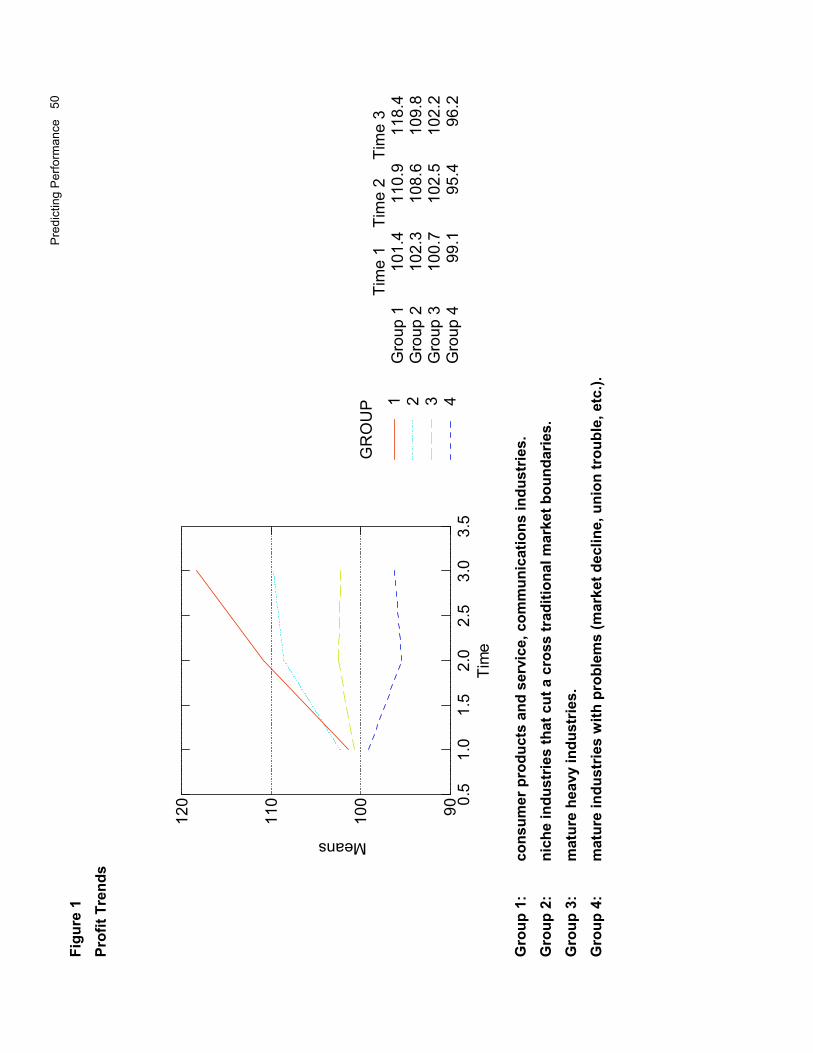
Pred
ictin
g Pe
rform
ance
50
Figu
re 1
Pr
ofit
Tren
ds
Tim
e 1
Tim
e 2
Tim
e 3
Gro
up 1
10
1.4
110.
911
8.4
Gro
up 2
10
2.3
108.
610
9.8
Gro
up 3
10
0.7
102.
510
2.2
Gro
up 4
99
.195
.496
.2
Gro
up 1
: co
nsum
er p
rodu
cts
and
serv
ice,
com
mun
icat
ions
indu
strie
s.
Gro
up 2
: ni
che
indu
strie
s th
at c
ut a
cro
ss tr
aditi
onal
mar
ket b
ound
arie
s.
Gro
up 3
: m
atur
e he
avy
indu
strie
s.
Gro
up 4
: m
atur
e in
dust
ries
with
pro
blem
s (m
arke
t dec
line,
uni
on tr
oubl
e, e
tc.).
0.5
1.0
1.5
2.0
2.5
3.0
3.5
Tim
e
90100
110
120
Profit
4321
GR
OU
P
Means

Pred
ictin
g Pe
rform
ance
51
Figu
re 2
Sa
les
Tren
ds
Tim
e 1
Tim
e 2
Tim
e 3
Gro
up 1
10
1.4
106.
411
4.7
Gro
up 2
10
0.4
102.
810
2.9
Gro
up 3
10
2.5
102.
510
2.2
Gro
up 4
99
.110
0.1
101.
7 0.
51.
01.
52.
02.
53.
03.
5Ti
me
90100
110
120
Sales
4321
GR
OU
P
Means

Predicting Executive Performance 52
Endnotes
1 The average percent of the profit goal achieved was 109% and the average profit goal was $33.9M in year 2. The standard deviation of the difference between profit obtained and profit goal in dollar terms ($16.5) was used to derive the BCG estimate of expected utility. 2 All HLM analyses were performed on profit and sales as percentages of profit and sales goals, respectively. As in Table 2, mean profit and sales values are reported in absolute dollar scales in Table 4 to ease interpretation.