A Lightning Plasma and Composite Specimen Damage ... · Magnetohydrodynamics (MHD), use a...
12
A Lightning Plasma and Composite Specimen Damage Simulation Framework for SAE Test Waveform B Millen, S. L. J., Murphy, A., Abdelal, G., & Catalanotti, G. (2019). A Lightning Plasma and Composite Specimen Damage Simulation Framework for SAE Test Waveform B. In ICOLSE 2019 Conference Proceedings [4] ICOLSE. Published in: ICOLSE 2019 Conference Proceedings Document Version: Peer reviewed version Queen's University Belfast - Research Portal: Link to publication record in Queen's University Belfast Research Portal General rights Copyright for the publications made accessible via the Queen's University Belfast Research Portal is retained by the author(s) and / or other copyright owners and it is a condition of accessing these publications that users recognise and abide by the legal requirements associated with these rights. Take down policy The Research Portal is Queen's institutional repository that provides access to Queen's research output. Every effort has been made to ensure that content in the Research Portal does not infringe any person's rights, or applicable UK laws. If you discover content in the Research Portal that you believe breaches copyright or violates any law, please contact [email protected]. Download date:01. Apr. 2020
Transcript of A Lightning Plasma and Composite Specimen Damage ... · Magnetohydrodynamics (MHD), use a...
A Lightning Plasma and Composite Specimen Damage SimulationFramework for SAE Test Waveform B
Millen, S. L. J., Murphy, A., Abdelal, G., & Catalanotti, G. (2019). A Lightning Plasma and Composite SpecimenDamage Simulation Framework for SAE Test Waveform B. In ICOLSE 2019 Conference Proceedings [4]ICOLSE.
Published in:ICOLSE 2019 Conference Proceedings
Document Version:Peer reviewed version
Queen's University Belfast - Research Portal:Link to publication record in Queen's University Belfast Research Portal
General rightsCopyright for the publications made accessible via the Queen's University Belfast Research Portal is retained by the author(s) and / or othercopyright owners and it is a condition of accessing these publications that users recognise and abide by the legal requirements associatedwith these rights.
Take down policyThe Research Portal is Queen's institutional repository that provides access to Queen's research output. Every effort has been made toensure that content in the Research Portal does not infringe any person's rights, or applicable UK laws. If you discover content in theResearch Portal that you believe breaches copyright or violates any law, please contact [email protected].
Download date:01. Apr. 2020

XX.1
A LIGHTNING PLASMA AND COMPOSITE SPECIMEN DAMAGE SIMULATION FRAMEWORK FOR SAE TEST WAVEFORM B
S.L.J. Millen, A. Murphy, G. Abdelal, G. Catalanotti
School of Mechanical and Aerospace Engineering, Queen’s University Belfast Belfast, Northern Ireland
This paper presents an overview of the research which has been conducted to simulate and understand the direct effects resulting from SAE test Waveform B. The research focuses on an unprotected composite specimen, with aerospace materials, and attempts to demonstrate how simulation can quantitatively link artificial lightning test waveform parameters to test specimen loading from the lightning plasma, through to the resulting specimen material damage. A variety of simulation techniques have been investigated to characterize the lightning plasma and the specimen damage and a framework for simulation is proposed. A 2D-axisymmetric finite element plasma simulation is used in which the waveform properties and specimen materials have been modified to establish their impact on the plasma formed between the discharge probe and the specimen surface. Within the specimen a two-step finite element modelling process is assembled; to represent the coupled thermal-electric behavior and to predict the temperature profile as a result of current resistive heating; to represent the coupled temperature, displacement and damage behavior resulting from the strike pressure loading and the thermal expansion due to the resistive heating. Finally a novel material representation has been developed which modifies the local specimen material properties such as moduli, strength and stiffness parameters to reflect the effects of combined strain and thermal loading and also includes both failure initiation and softening. The results demonstrate the sensitivity of plasma properties to the artificial waveform parameters (maximum current, rise times etc.) and the specimen properties (electrical and thermal conductivity). The sensitivity of the specimen damage, including the mechanisms (thermal versus mechanical) and the damage profile (damage depth and surface area) are also calculated. The presented results, for Waveform B, illustrate the volume of thermal damage over mechanical damage due to the long exposure to the current load and the opportunity for greater resistive heating, and the lower peak current and rise time, when compared with other artificial lightning test waveforms.
ACRONYMS AND SYMBOLS
MHD - Magnetohydrodynamics FE - Finite Element FV - Finite Volume SAE - Society of Automotive Engineers Ipeak - Peak Current kA - Kiloamps T1 - The rise time from 10% to 90% of Ipeak T2 - Time to reach 50% of the post-peak current LPS - Lightning Protection System
νij - Poisson’s Ratio
σ - Stress σn - Normal component of the traction tensor τL - Shear component of the traction tensor ε - Strain εf - Failure strain εi - Initiation strain Γ - Intralaminar fracture toughness l* - Characteristic length of the element F - Damage Variable d - Damage Parameter
τi (i=1,2,3) - Stress in each material orientation
τi0
(i=1,2,3) - Maximum stress in each orientation INTRODUCTION
Lightning strikes can cause damage to aircraft if attachment occurs, particularly if the wing or fuselage is constructed from unprotected composite materials due to their poor electrical conductivity. Lightning forms a plasma channel between clouds and the aircraft during its flight. Temperatures inside this plasma channel can exceed 10,000
oC.
Test standards have been defined which allow the aircraft industry to appropriately test aircraft composites and their resistance to lightning strikes. Four artificial test lightning Waveforms (A, B, C and D), proposed in SAE-ARP5412B [1] and shown in Figure 1 have been defined. Waveform A is the first return stroke; Waveform B is the intermediate current; Waveform C is the long duration current; and Waveform D is a subsequent stroke. Each waveform has its own time period and peak current amplitude, Ipeak (kA), lasting between microseconds and seconds and ranging from 200A to 200kA. Other properties of

XX.2
each waveform include the rise time from 10% to 90% of Ipeak, T1 (ms), the time to reach the post-peak value of 50% of Ipeak, T2 (ms), the peak rate-of-rise (kA/ms) and the action integral (A
2s).
Simulations have predominantly focused on either the plasma conditions or specimen damage using assumed surface loading conditions [2]–[5] applied from above the specimen to replicate plasma loading. Recently progress has been made to couple these simulations to establish the impact of modelling the lightning plasma on the predicted loads and resulting damage [6], [7]. Plasma simulations based on Magnetohydrodynamics (MHD), use a combination of Maxwell’s equations, Navier-Stokes equations, and thermal conduction equations simulated within the Finite Element (FE) method or the Finite Volume methods [2], [6], [8]. Damage models have typically assumed the loading on the surface to be applied over a uniform area and to be representative of the input waveform. Composite damage has been predicted for lightning current, temperature and pressure loading [4], [5], [9]–[11].
Figure 1 - Standardized SAE lightning waveforms
The focus of this paper is on the work which has been completed to simulate and understand the direct effects resulting from SAE test Waveform B. Firstly the method used to transfer loading from a plasma model in COMSOL multiphysics to a thermal-electric FE model in ABAQUS will be discussed. The effects of changes to the specimen material and waveform matrix thermal damage will then be reported. A novel damage model incorporating strain and heating rate effects will then be presented and results discussed giving a full picture of damage due to electric
current, pressure loading and thermal expansion in the composite specimen. The background to the field will now be briefly discussed followed by a description of the models to be used herein. BACKGROUND Lightning Strike Experimental Research Lightning strike experimental research has generally focused on the four artificial test lightning waveforms mentioned previously. Conical tip discharge probes have been used almost exclusively in all experimental works. The majority of authors have focused on Waveform A with the peak current scaled to 40kA to allow smaller test specimens to be used [12]–[14]. Hirano et al. [12] have provided one of the most thorough experimental publications with detailed images of damage. Recently some progress has been made with experiments for multiple or sequential strikes, however this work is restricted to limited experimental publications [15] with no modelling to date. While many authors have been interested in the damage profile some have attempted to correlate specimen damage with waveform parameters [12], [13], [16]. Another set of authors have attempted to characterize the plasma generated during experiments using high-speed video cameras and Schlieren photography [17]. In this work an alternative jet diverting discharge probe was tested and results for CFRP and Aluminum specimens were compared. Lightning Arc Plasma Modelling Progress is continuing to be made with regards to modelling the thermal plasma generated during a simulated lightning strike with models for Waveforms A, B and C available in literature [2], [6], [8], [18]. Chemartin et al. [18] modelled a Waveform C swept stroke, however did not provide details of the solution procedure involved. Abdelal and Murphy [2] presented a more comprehensive solution procedure and model description for their 2D-axisymmetric model for Waveform B. Similitude theory was used within COMSOL Multiphysics to enable simulations to be completed within a suitable amount of time. Two further works, Chen et al. [6] and Wang et al. [8], have used CFD and ANSYS Fluent to model the
XX.3
lightning plasmas for Waveforms A and C respectively in full 3D. Both of these models included assumed initial boundary conditions in order to generate an initial arc. Specimen Damage Modelling
The first detailed lightning strike damage simulation was produced by Ogasawara et al. [5]. However loads were applied to only one node which was deemed inaccurate. Most authors in this area have used either finite or expanding radii and assumed loading conditions equal to the incident waveform [3], [4]. Abdelal and Murphy [3] used a loading area equal to an assumed arc radius and temperature dependent material properties to improve the initial work. Abdelal and Murphy also included a copper mesh lightning protection system (LPS) in their work. Foster et al. [4] studied the influence of arc attachment using a variety of circular and elliptical expanding load methods. Foster et al. [4] were also one of the only authors to present a mesh convergence study in this field. Recently authors have attempted to couple plasma and damage simulations to better capture plasma loading conditions [6], [7]. Chen et al. [6] used a volume spline function while Millen et al. [7] used a python script method for Waveforms A and B respectively. Other models which have been presented in literature include pressure loading simulations [9], [10], [19] and thermal-expansion simulations [11]. Authors have typically used Equation 1 to determine the pressure load to be applied based on the current waveform and assumed loading radius. However the division factor has varied between works (division factor of 8 in Equation 1).
∇𝑝 = 𝜇0𝑖2/8𝜋2𝑟2 (1)
Muñoz et al. [9] assumed separate acoustic and electromagnetic pressures. Acoustic was assumed to be 10 MPa over a radius of 12.5mm while electromagnetic pressure was assumed constant up to the arc radius (5mm) and then decreased exponentially. Foster et al. [10] assumed a circular load, again using Equation 1 to determine the pressure for Waveform A. Karch et al. [19] conducted an extensive study for Waveform D (200 bar peak) using FE and FV methods to determine the arc root expansion and magnetic forces of the shock wave. Karch also
included a LPS on their specimen and a progressive damage model was also included using four bilinear softening laws. However, Karch et al. did not include cohesive zones between plies unlike Foster et al. Foster et al. [11] also conducted a thermal expansion analysis using the results from their earlier thermal-electric simulations [4]. For consistency the meshes needed to be generated in the same manner between models. Foster compared temperature dependent, temperature rate dependent, and strain rate dependent properties. Summary
To date, experimental and numerical works have developed steadily to understand the effects of lightning strikes on composites. However, there has been a disparity between the conditions of an experiment and those modelled in a numerical simulation listed here:
Preceding research has used assumed loading conditions at the specimen surface
Most works have neglected the plasma generated between the discharge probe and the specimen surface
Works have attempted to correlate waveform properties and damage for only high peak current waveforms
There is limited understanding of the effects of specimen material and design on the lightning plasma and subsequent specimen damage
There is limited understanding of the effects of waveform properties on the lightning plasma and subsequent specimen damage
Given the present assumptions in literature it is essential that the lightning arc between the probe and the specimen is modelled and the calculated loading conditions are applied to the specimen. When attempting to understand the relationships between waveform/specimen properties and damage this approach is also required, as is quantification of the relationships for lower peak, longer duration waveforms. This work has attempted to improve these areas of research and the relevant methodology and
XX.4
results will be presented here with thermal-mechanical damage presented for the first time for test Waveform B. METHODOLOGY In this section each simulation used in this research will be presented and discussed in terms of design. The steps taken to modify the waveform properties, specimen design and generate the damage model will then be discussed. Simulations and Boundary Conditions
Plasma Simulation(s) The numerical thermal plasma model used in this work was originally developed by Abdelal and Murphy within COMSOL Multiphysics [2]. The model was developed for test Waveform B using the finite element method with MHD and similitude theory. Initially the model featured a copper discharge probe and copper specimen. This modelled was governed by Equation 2.
𝐼(𝑡) = 11300(𝑒−70∙𝑡 − 𝑒−200∙𝑡) (2)
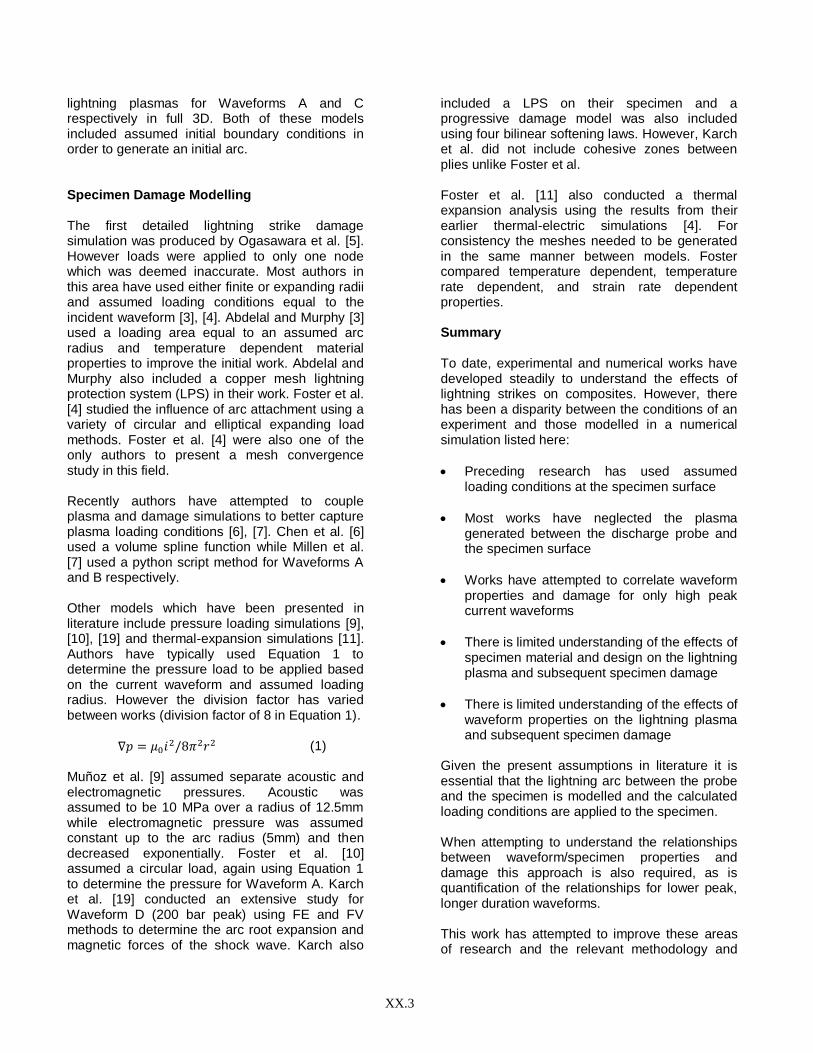
The simulation domain for the plasma model is shown in Figure 2. The modifications to this simulation within this work will now be explained.
Specimen Modifications The effects of specimen representation were studied using two different specimen designs. The first was the reference case modelled previously [2]. Case 2 modelled the specimen with composite properties with boundary conditions representative of the experimental conditions. Waveform Modifications To study the effects of waveform changes on the plasma and subsequent damage, the input waveform peak current, Ipeak, and time periods, T1/T2 were modified by 10%, consequently changing the action integral of the input waveform. Case 2 was repeated to study the effects of waveform changes with another test case, Case 3 which increased the peak current and time periods by 10% are shown in Table 1. Thermal-Electric Simulation(s) The thermal-electric simulation used in this work was used to assess thermal damage regions and generate a temperature profile to pass to the next simulation. The composite specimen measured
150 x 100 mm with a total thickness of 4.704mm and had a ply layup of [45/0/−45/90]4s. Temperature dependent IM600/133 material properties were used and can be found in reference [20]. A coupled, thermal-electric step with DC3D8E elements was employed along with a zero electrical potential boundary condition on the side and bottom surfaces of the specimen to replicate the experimental work of Hirano et al. [12].
Figure 2 - Axisymmetric Plasma Domain
Method to Transfer Loading The method used to apply loads from the COMSOL plasma simulation to subsequent analyses in ABAQUS has been presented in a previous publication [7]. This method analyzed the outputs from the plasma model and used an automated approach to prepare the mesh and loading boundary conditions of the subsequent model. Specimen Modifications Specimens were modified in the thermal-electric simulation much like in the plasma simulation previously. The reference case featured a 0.05mm deep copper mesh placed above the composite specimen mentioned previously. In Case 2 the basic composite specimen was used. When studying the effects of waveform changes, a composite specimen was used for both Case 2 and 3.
XX.5
Table 1 - Idealized lightning current waveform modifications
Test Case
Ipeak (kA)
T1 (µs)
T2 (µs)
Action Integral (A
2s)
Charge Transfer (C)
Case 2 4.17 813 2345 2.85x10⁴ 10.0
Case 3 4.59 894 2605 3.82x10⁴ 11.9
Dynamic, Temp-Disp, Explicit Analysis
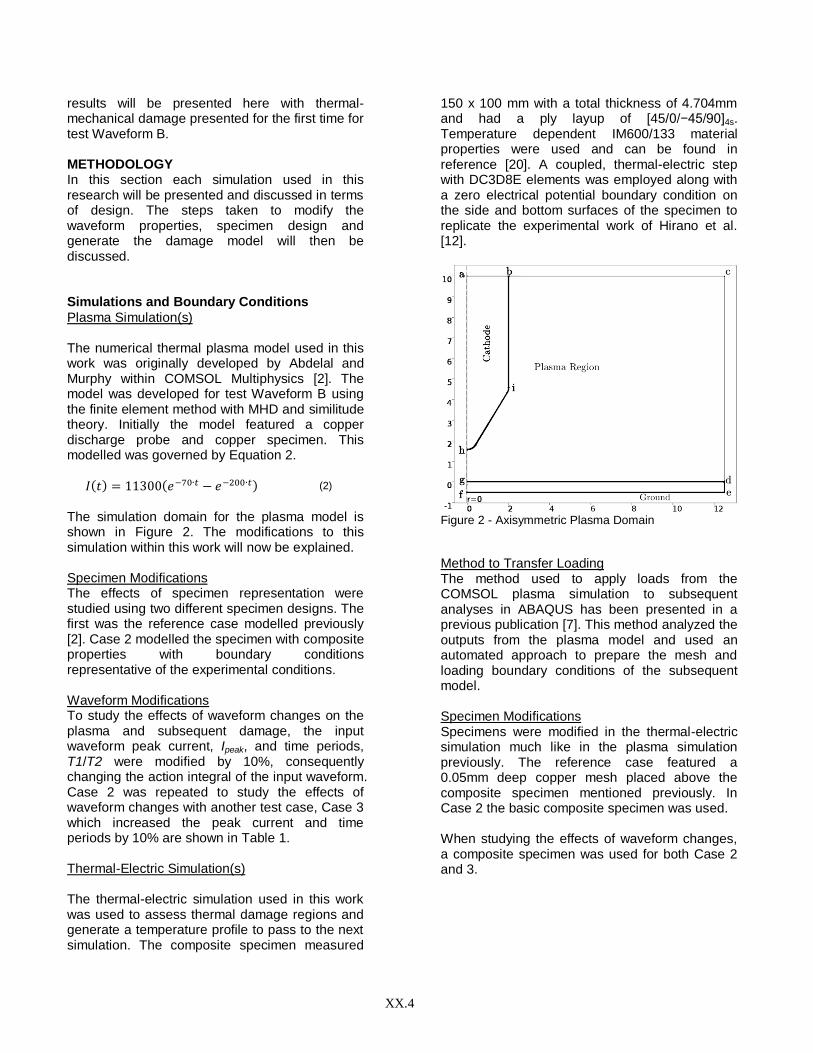
The final simulation is a dynamic, temp-disp, explicit analysis step completed in ABAQUS Explicit. In order to transfer the temperature boundary conditions from the thermal-electric step, the same python script was used as developed by Foster et al. [11]. C3D8RT elements were used in this simulation with the same mesh as the thermal-electric giving a total element count of 33,478 elements. In order to incorporate the effects of pressure loading a VDLOAD subroutine was used as developed previously [21]. This simulation is shown in Figure 3 where the specimen is placed on a constrained copper plate.
Figure 3 - Design of thermal expansion simulation
Case 4 was developed to include the same loading as Case 2 but with a mesh that could aid run-time and suit the element characteristic length requirements of the progressive damage behavior within the new VUMAT damage model. VUMAT Damage Model This section will give an overview of the VUMAT damage model used in this model. The orthotropic nature of the material was incorporated into the VUMAT using the constitutive relationship used in previous works [22]. Strain and heating rate effects were incorporated into the damage model using scaling effects for moduli, fracture toughness and strength properties of the material [23]. The damage initiation criteria used in this work was the Hashin/Puck criteria as demonstrated by Foster et al. [10]. Once the failure initiation criteria
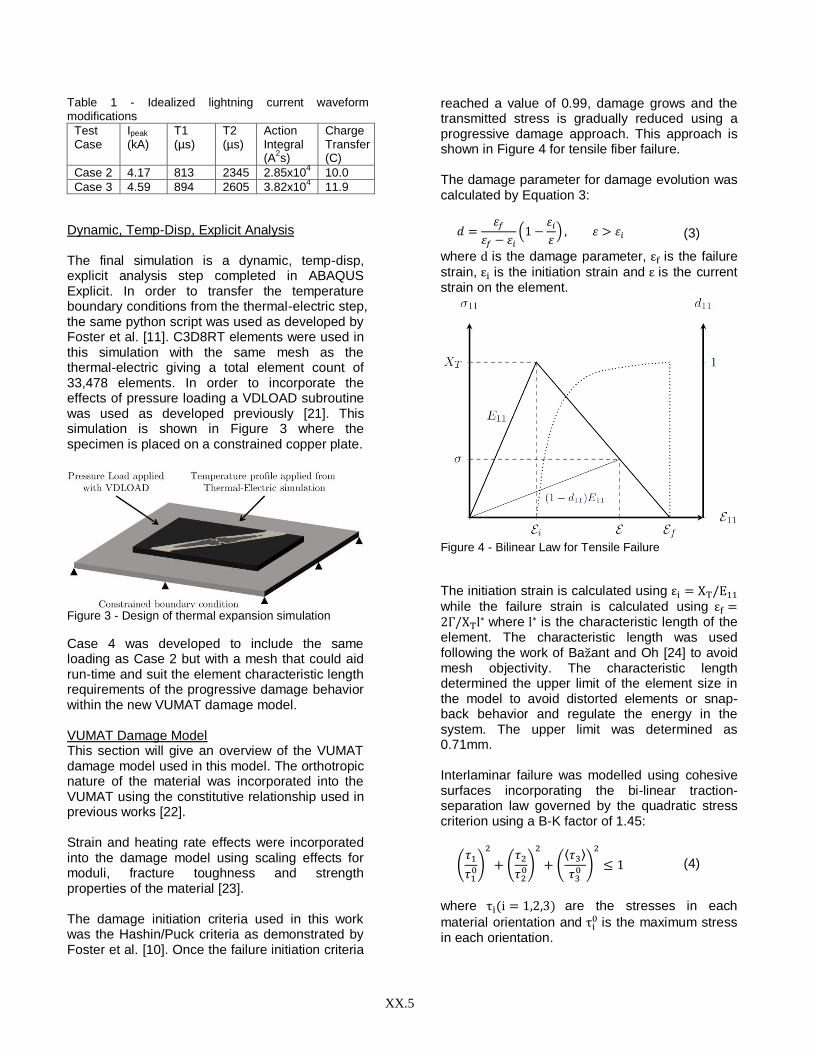
reached a value of 0.99, damage grows and the transmitted stress is gradually reduced using a progressive damage approach. This approach is shown in Figure 4 for tensile fiber failure. The damage parameter for damage evolution was calculated by Equation 3:
𝑑 =𝜀𝑓
𝜀𝑓 − 𝜀𝑖(1 −
𝜀𝑖𝜀) , 𝜀 > 𝜀𝑖 (3)
where d is the damage parameter, εf is the failure
strain, εi is the initiation strain and ε is the current strain on the element.
Figure 4 - Bilinear Law for Tensile Failure
The initiation strain is calculated using εi = XT/E11 while the failure strain is calculated using εf =2Γ/XTl
∗ where l∗ is the characteristic length of the element. The characteristic length was used following the work of Bazant and Oh [24] to avoid mesh objectivity. The characteristic length determined the upper limit of the element size in the model to avoid distorted elements or snap-back behavior and regulate the energy in the system. The upper limit was determined as 0.71mm. Interlaminar failure was modelled using cohesive surfaces incorporating the bi-linear traction-separation law governed by the quadratic stress criterion using a B-K factor of 1.45:
(𝜏1𝜏10)
2
+ (𝜏2𝜏20)
2
+ (⟨𝜏3⟩
𝜏30 )
2
≤ 1 (4)
where τi(i = 1,2,3) are the stresses in each
material orientation and τi0 is the maximum stress
in each orientation.
XX.6
Other model considerations were tensile softening in the through-thickness direction was ignored since propagation occurs in the interface and the cohesive region is weaker than the ply and no strain rate effects were considered for E1. The failure model was then benchmarked in component parts against relevant literature for a variety of test cases [22], [25]–[27]. The model in its implementation was found to be within 10% of the experiment and published results. RESULTS Influence of Specimen Representation
Focusing firstly on the influence of specimen representation on the plasma itself some clear patterns emerge, shown in Table 2. Namely, that the conductivity of the specimen has a large influence on the plasma characteristics. The reference case has 26% lower plasma current density than Case 2 due to a change in electrical conductivity from 6x10
7 to 35971 S/m in the fiber
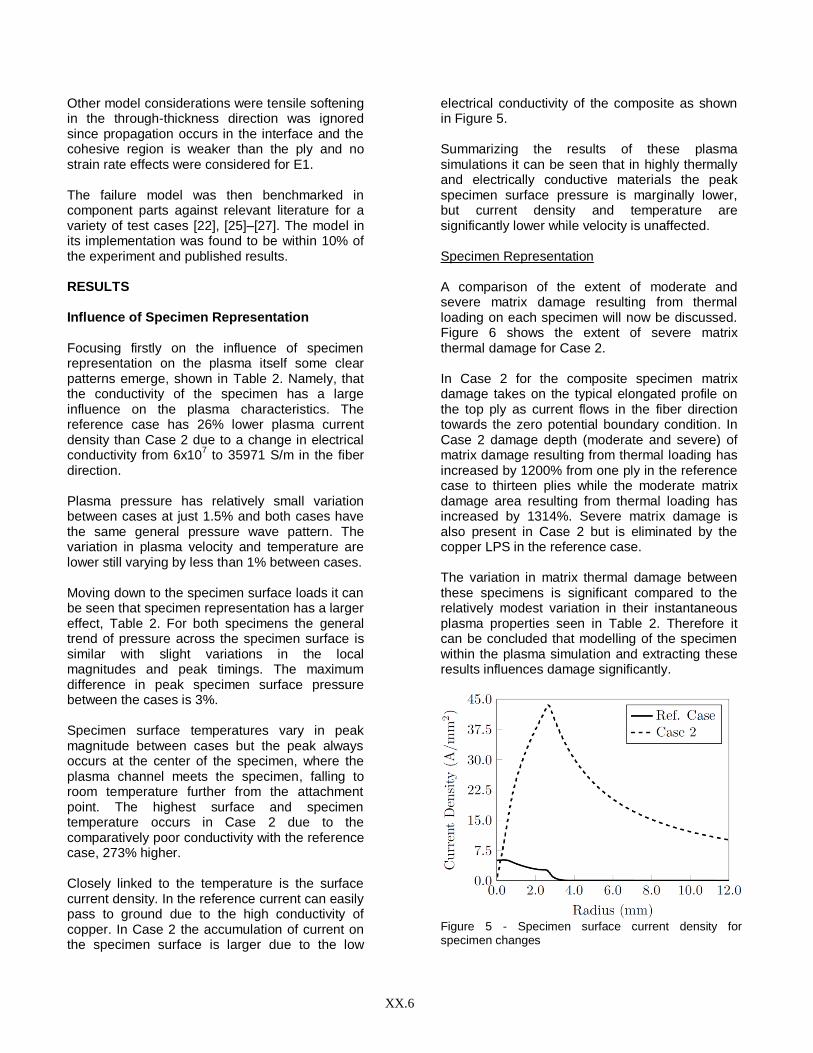
direction. Plasma pressure has relatively small variation between cases at just 1.5% and both cases have the same general pressure wave pattern. The variation in plasma velocity and temperature are lower still varying by less than 1% between cases. Moving down to the specimen surface loads it can be seen that specimen representation has a larger effect, Table 2. For both specimens the general trend of pressure across the specimen surface is similar with slight variations in the local magnitudes and peak timings. The maximum difference in peak specimen surface pressure between the cases is 3%. Specimen surface temperatures vary in peak magnitude between cases but the peak always occurs at the center of the specimen, where the plasma channel meets the specimen, falling to room temperature further from the attachment point. The highest surface and specimen temperature occurs in Case 2 due to the comparatively poor conductivity with the reference case, 273% higher. Closely linked to the temperature is the surface current density. In the reference current can easily pass to ground due to the high conductivity of copper. In Case 2 the accumulation of current on the specimen surface is larger due to the low
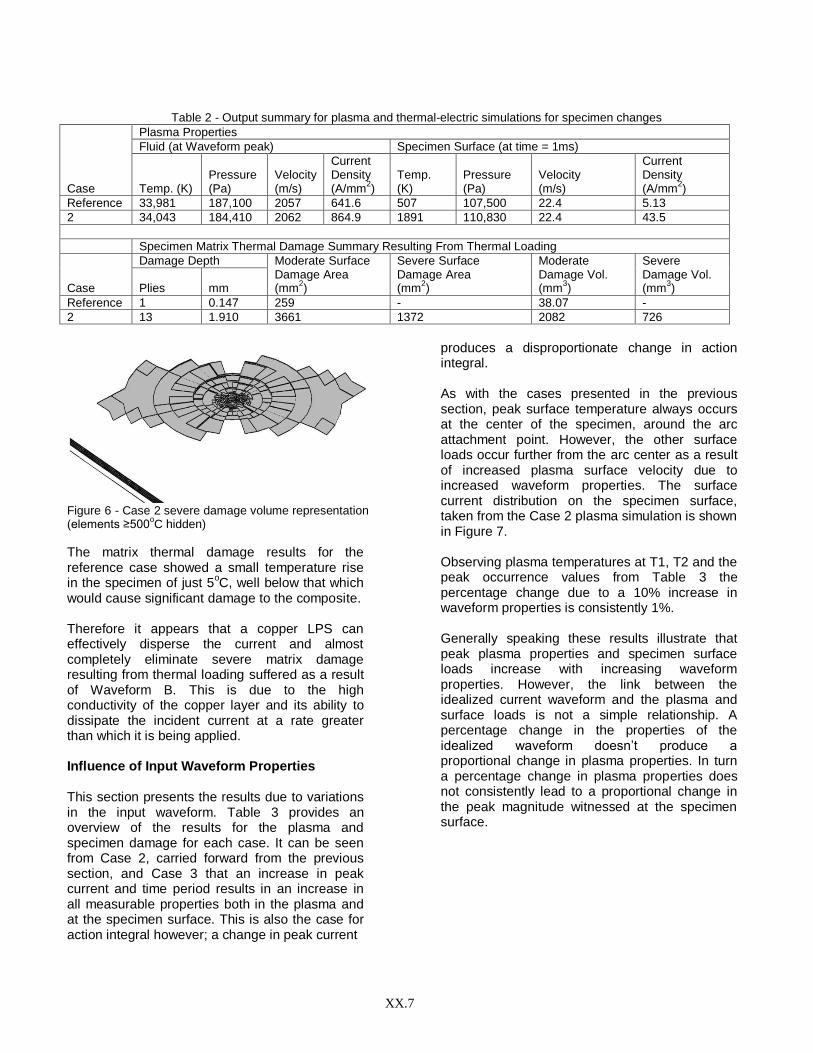
electrical conductivity of the composite as shown in Figure 5. Summarizing the results of these plasma simulations it can be seen that in highly thermally and electrically conductive materials the peak specimen surface pressure is marginally lower, but current density and temperature are significantly lower while velocity is unaffected. Specimen Representation A comparison of the extent of moderate and severe matrix damage resulting from thermal loading on each specimen will now be discussed. Figure 6 shows the extent of severe matrix thermal damage for Case 2. In Case 2 for the composite specimen matrix damage takes on the typical elongated profile on the top ply as current flows in the fiber direction towards the zero potential boundary condition. In Case 2 damage depth (moderate and severe) of matrix damage resulting from thermal loading has increased by 1200% from one ply in the reference case to thirteen plies while the moderate matrix damage area resulting from thermal loading has increased by 1314%. Severe matrix damage is also present in Case 2 but is eliminated by the copper LPS in the reference case. The variation in matrix thermal damage between these specimens is significant compared to the relatively modest variation in their instantaneous plasma properties seen in Table 2. Therefore it can be concluded that modelling of the specimen within the plasma simulation and extracting these results influences damage significantly.
Figure 5 - Specimen surface current density for specimen changes
XX.7
Table 2 - Output summary for plasma and thermal-electric simulations for specimen changes
Case
Plasma Properties
Fluid (at Waveform peak) Specimen Surface (at time = 1ms)
Temp. (K) Pressure (Pa)
Velocity (m/s)
Current Density (A/mm
2)
Temp. (K)
Pressure (Pa)
Velocity (m/s)
Current Density (A/mm
2)
Reference 33,981 187,100 2057 641.6 507 107,500 22.4 5.13
2 34,043 184,410 2062 864.9 1891 110,830 22.4 43.5
Specimen Matrix Thermal Damage Summary Resulting From Thermal Loading
Case
Damage Depth Moderate Surface Damage Area (mm
2)
Severe Surface Damage Area (mm
2)
Moderate Damage Vol. (mm
3)
Severe Damage Vol. (mm
3) Plies mm
Reference 1 0.147 259 - 38.07 -
2 13 1.910 3661 1372 2082 726
Figure 6 - Case 2 severe damage volume representation (elements ≥500
oC hidden)
The matrix thermal damage results for the reference case showed a small temperature rise in the specimen of just 5
oC, well below that which
would cause significant damage to the composite. Therefore it appears that a copper LPS can effectively disperse the current and almost completely eliminate severe matrix damage resulting from thermal loading suffered as a result of Waveform B. This is due to the high conductivity of the copper layer and its ability to dissipate the incident current at a rate greater than which it is being applied. Influence of Input Waveform Properties This section presents the results due to variations in the input waveform. Table 3 provides an overview of the results for the plasma and specimen damage for each case. It can be seen from Case 2, carried forward from the previous section, and Case 3 that an increase in peak current and time period results in an increase in all measurable properties both in the plasma and at the specimen surface. This is also the case for action integral however; a change in peak current
produces a disproportionate change in action integral. As with the cases presented in the previous section, peak surface temperature always occurs at the center of the specimen, around the arc attachment point. However, the other surface loads occur further from the arc center as a result of increased plasma surface velocity due to increased waveform properties. The surface current distribution on the specimen surface, taken from the Case 2 plasma simulation is shown in Figure 7. Observing plasma temperatures at T1, T2 and the peak occurrence values from Table 3 the percentage change due to a 10% increase in waveform properties is consistently 1%. Generally speaking these results illustrate that peak plasma properties and specimen surface loads increase with increasing waveform properties. However, the link between the idealized current waveform and the plasma and surface loads is not a simple relationship. A percentage change in the properties of the idealized waveform doesn’t produce a proportional change in plasma properties. In turn a percentage change in plasma properties does not consistently lead to a proportional change in the peak magnitude witnessed at the specimen surface.

XX.8
Table 3 - Output summary for plasma and thermal-electric simulations for Waveform changes
Case
Plasma Properties
Fluid (at time of peak occurrence) Specimen Surface (at load peak)
Temp. (K) Pressure (Pa)
Velocity (m/s)
Temp. (K)
Pressure (Pa)
Velocity (m/s)
Current Density (A/mm
2)
2 34,051 187,160 2077 4620.1 123,070 25.0 44.3
3 34,394 195,090 2172 5089.7 120,570 28.6 46.5
Case Specimen Matrix Thermal Damage Summary Resulting From Thermal Loading
Damage Depth Moderate Surface
Damage Area (mm
2)
Severe Surface Damage Area (mm
2)
Moderate Damage Vol. (mm
3)
Severe Damage Vol. (mm
3) Plies mm
2 13 1.91 3661 1372 2082 726
3 15 2.20 3706 1391 2371 856
Specimen Matrix Thermal and Mechanical Damage Summary Resulting From Combined Loading
Matrix Thermal Loading Damage Depth (Plies)
Delamination Depth (Plies)
Moderate Surface Damage Area (mm
2)
Severe Surface Damage Area (mm
2)
Delamination Area (mm
2)
Moderate Damage Vol.
(mm3)
Severe Damage Vol.
(mm3)
4 5 5 2970 1140 3057 772 310
Figure 7 - Specimen surface current density at T1 for Case 2 taken from plasma simulation (A/mm
2)
Waveform Modifications – Matrix Damage Due To Thermal Loading The typical matrix thermal damage outline, illustrated by temperature contours, is shown for example in Figure 8 for Case 2. Matrix thermal damage results, presented in Table 3 using five measures, generally illustrate that an increase in peak current/time period and subsequently action integral have the greatest contribution to matrix thermal damage.
Increased waveform properties result in an increase in all damage measures with the largest percentage increase going to the depth of matrix thermal damage which in turn increases the surface thermal damage areas and therefore the total matrix thermal damage volume.
Figure 8 - Top ply contours Case 2
Damage resulting from combined thermal loading, pressure loading and thermal expansion The final results in this work will present the extent
of specimen damage, both thermal and mechanical,
under the combined effects of thermal loading,
pressure loading and thermal-expansion for Case
4. Results of Case 4 are summarized in Table 3.
Under combined loading Waveform B strain rates
XX.9
range from 102
- 103 s
-1 classifying these as bar
impact type values.
Transverse and through-thickness stresses are
both compressive and peak at approximately 100
and 40MPa respectively for Waveform B. These
are not enough to cause significant stress/strain
induced fiber damage resulting from combined
thermal loading, pressure loading and thermal-
expansion. This is due to the scaling effects of
strain and heating rates and the low magnitude
loads being applied. For example the peak
pressure load for Waveform B has been predicted
via simulation as 0.123MPa [2]. Strains in all
directions are of the order of 10-3
.
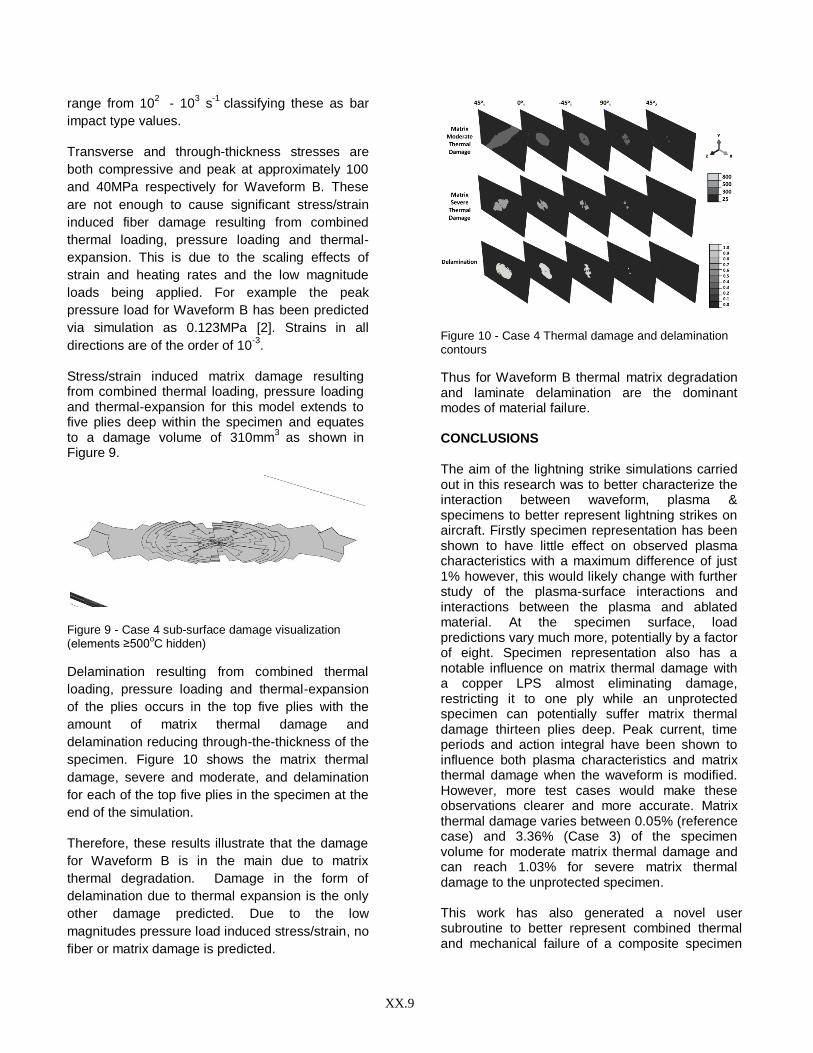
Stress/strain induced matrix damage resulting from combined thermal loading, pressure loading and thermal-expansion for this model extends to five plies deep within the specimen and equates to a damage volume of 310mm
3 as shown
in
Figure 9.
Figure 9 - Case 4 sub-surface damage visualization (elements ≥500
oC hidden)
Delamination resulting from combined thermal
loading, pressure loading and thermal-expansion
of the plies occurs in the top five plies with the
amount of matrix thermal damage and
delamination reducing through-the-thickness of the
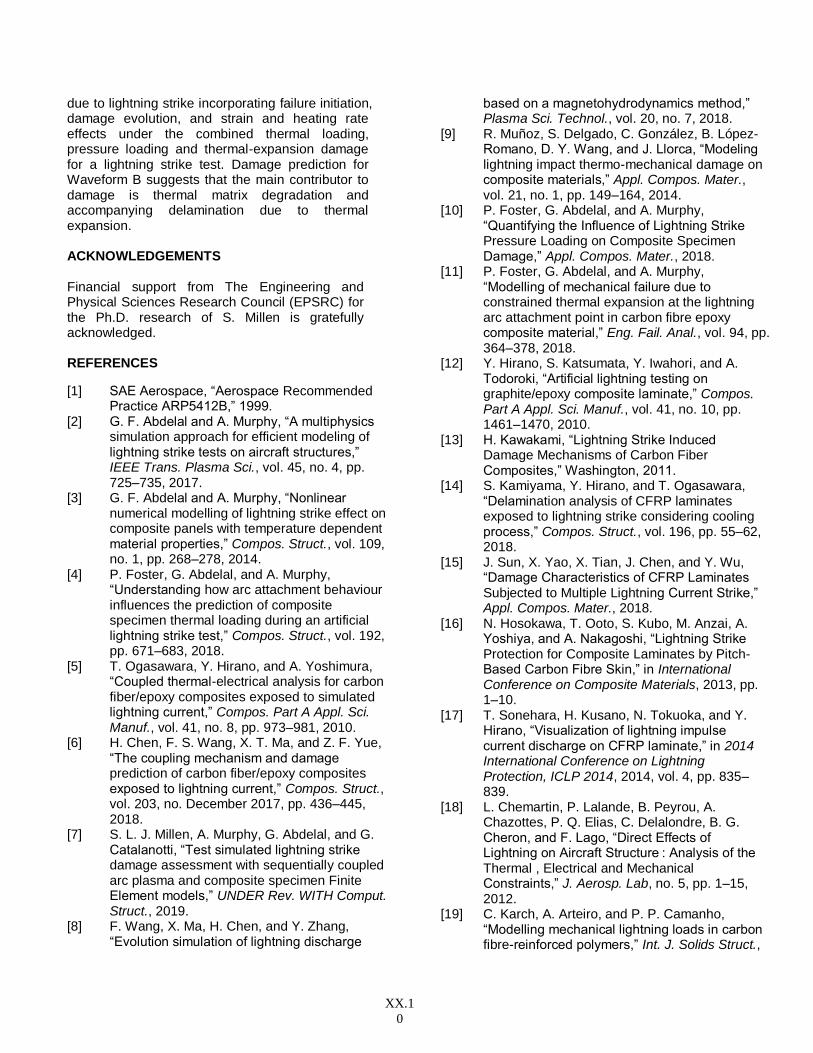
specimen. Figure 10 shows the matrix thermal
damage, severe and moderate, and delamination
for each of the top five plies in the specimen at the
end of the simulation.
Therefore, these results illustrate that the damage
for Waveform B is in the main due to matrix
thermal degradation. Damage in the form of
delamination due to thermal expansion is the only
other damage predicted. Due to the low
magnitudes pressure load induced stress/strain, no
fiber or matrix damage is predicted.
Figure 10 - Case 4 Thermal damage and delamination contours
Thus for Waveform B thermal matrix degradation and laminate delamination are the dominant modes of material failure. CONCLUSIONS The aim of the lightning strike simulations carried out in this research was to better characterize the interaction between waveform, plasma & specimens to better represent lightning strikes on aircraft. Firstly specimen representation has been shown to have little effect on observed plasma characteristics with a maximum difference of just 1% however, this would likely change with further study of the plasma-surface interactions and interactions between the plasma and ablated material. At the specimen surface, load predictions vary much more, potentially by a factor of eight. Specimen representation also has a notable influence on matrix thermal damage with a copper LPS almost eliminating damage, restricting it to one ply while an unprotected specimen can potentially suffer matrix thermal damage thirteen plies deep. Peak current, time periods and action integral have been shown to influence both plasma characteristics and matrix thermal damage when the waveform is modified. However, more test cases would make these observations clearer and more accurate. Matrix thermal damage varies between 0.05% (reference case) and 3.36% (Case 3) of the specimen volume for moderate matrix thermal damage and can reach 1.03% for severe matrix thermal damage to the unprotected specimen. This work has also generated a novel user subroutine to better represent combined thermal and mechanical failure of a composite specimen
XX.1
0
due to lightning strike incorporating failure initiation, damage evolution, and strain and heating rate effects under the combined thermal loading, pressure loading and thermal-expansion damage for a lightning strike test. Damage prediction for Waveform B suggests that the main contributor to damage is thermal matrix degradation and accompanying delamination due to thermal expansion. ACKNOWLEDGEMENTS
Financial support from The Engineering and Physical Sciences Research Council (EPSRC) for the Ph.D. research of S. Millen is gratefully acknowledged. REFERENCES
[1] SAE Aerospace, “Aerospace Recommended Practice ARP5412B,” 1999.
[2] G. F. Abdelal and A. Murphy, “A multiphysics simulation approach for efficient modeling of lightning strike tests on aircraft structures,” IEEE Trans. Plasma Sci., vol. 45, no. 4, pp. 725–735, 2017.
[3] G. F. Abdelal and A. Murphy, “Nonlinear numerical modelling of lightning strike effect on composite panels with temperature dependent material properties,” Compos. Struct., vol. 109, no. 1, pp. 268–278, 2014.
[4] P. Foster, G. Abdelal, and A. Murphy, “Understanding how arc attachment behaviour influences the prediction of composite specimen thermal loading during an artificial lightning strike test,” Compos. Struct., vol. 192, pp. 671–683, 2018.
[5] T. Ogasawara, Y. Hirano, and A. Yoshimura, “Coupled thermal-electrical analysis for carbon fiber/epoxy composites exposed to simulated lightning current,” Compos. Part A Appl. Sci. Manuf., vol. 41, no. 8, pp. 973–981, 2010.
[6] H. Chen, F. S. Wang, X. T. Ma, and Z. F. Yue, “The coupling mechanism and damage prediction of carbon fiber/epoxy composites exposed to lightning current,” Compos. Struct., vol. 203, no. December 2017, pp. 436–445, 2018.
[7] S. L. J. Millen, A. Murphy, G. Abdelal, and G. Catalanotti, “Test simulated lightning strike damage assessment with sequentially coupled arc plasma and composite specimen Finite Element models,” UNDER Rev. WITH Comput. Struct., 2019.
[8] F. Wang, X. Ma, H. Chen, and Y. Zhang, “Evolution simulation of lightning discharge
based on a magnetohydrodynamics method,” Plasma Sci. Technol., vol. 20, no. 7, 2018.
[9] R. Muñoz, S. Delgado, C. González, B. López-Romano, D. Y. Wang, and J. Llorca, “Modeling lightning impact thermo-mechanical damage on composite materials,” Appl. Compos. Mater., vol. 21, no. 1, pp. 149–164, 2014.
[10] P. Foster, G. Abdelal, and A. Murphy, “Quantifying the Influence of Lightning Strike Pressure Loading on Composite Specimen Damage,” Appl. Compos. Mater., 2018.
[11] P. Foster, G. Abdelal, and A. Murphy, “Modelling of mechanical failure due to constrained thermal expansion at the lightning arc attachment point in carbon fibre epoxy composite material,” Eng. Fail. Anal., vol. 94, pp. 364–378, 2018.
[12] Y. Hirano, S. Katsumata, Y. Iwahori, and A. Todoroki, “Artificial lightning testing on graphite/epoxy composite laminate,” Compos. Part A Appl. Sci. Manuf., vol. 41, no. 10, pp. 1461–1470, 2010.
[13] H. Kawakami, “Lightning Strike Induced Damage Mechanisms of Carbon Fiber Composites,” Washington, 2011.
[14] S. Kamiyama, Y. Hirano, and T. Ogasawara, “Delamination analysis of CFRP laminates exposed to lightning strike considering cooling process,” Compos. Struct., vol. 196, pp. 55–62, 2018.
[15] J. Sun, X. Yao, X. Tian, J. Chen, and Y. Wu, “Damage Characteristics of CFRP Laminates Subjected to Multiple Lightning Current Strike,” Appl. Compos. Mater., 2018.
[16] N. Hosokawa, T. Ooto, S. Kubo, M. Anzai, A. Yoshiya, and A. Nakagoshi, “Lightning Strike Protection for Composite Laminates by Pitch-Based Carbon Fibre Skin,” in International Conference on Composite Materials, 2013, pp. 1–10.
[17] T. Sonehara, H. Kusano, N. Tokuoka, and Y. Hirano, “Visualization of lightning impulse current discharge on CFRP laminate,” in 2014 International Conference on Lightning Protection, ICLP 2014, 2014, vol. 4, pp. 835–839.
[18] L. Chemartin, P. Lalande, B. Peyrou, A. Chazottes, P. Q. Elias, C. Delalondre, B. G. Cheron, and F. Lago, “Direct Effects of Lightning on Aircraft Structure : Analysis of the Thermal , Electrical and Mechanical Constraints,” J. Aerosp. Lab, no. 5, pp. 1–15, 2012.
[19] C. Karch, A. Arteiro, and P. P. Camanho, “Modelling mechanical lightning loads in carbon fibre-reinforced polymers,” Int. J. Solids Struct.,
XX.1
1
vol. 162, 2018. [20] S. L. J. Millen, A. Murphy, G. Abdelal, and G.
Catalanotti, “Specimen Representation on the Prediction of Artificial Test Lightning Plasma, Resulting Specimen Loading and Subsequent Composite Material Damage,” UNDER Rev. WITH Compos. Struct., 2019.
[21] S. L. J. Millen, A. Murphy, G. F. Abdelal, and G. Catalanotti, “Quantifying the Influence of Plasma - Solid Mechanics Coupling on the Prediction of Lightning Strike Composite Specimen Damage,” in 1st International Conference on Advances in Aerospace Structures, Systems & Technology (AASST), 2018, pp. 103–112.
[22] W. Tan, B. G. Falzon, L. N. S. Chiu, and M. Price, “Predicting low velocity impact damage and Compression-After-Impact (CAI) behaviour of composite laminates,” Compos. Part A Appl. Sci. Manuf., vol. 71, pp. 212–226, 2015.
[23] S. L. J. Millen, A. Murphy, G. Catalanotti, and G. Abdelal, “Coupled thermal-mechanical progressive damage model with strain and heating rate effects for lighting strike damage assessment,” Submitt. TO Compos. Struct., 2019.
[24] Z. Bazant and B. Oh, “Crack band theory of concrete,” Mater. Struct., vol. 16, pp. 155–177, 1983.
[25] H. Koerber, J. Xavier, and P. P. Camanho, “High strain rate characterisation of unidirectional carbon-epoxy IM7-8552 in transverse compression and in-plane shear using digital image correlation,” Mech. Mater., vol. 42, no. 11, pp. 1004–1019, 2010.
[26] H. Koerber and P. P. Camanho, “High strain rate characterisation of unidirectional carbon-epoxy IM7-8552 in longitudinal compression,” Compos. Part A Appl. Sci. Manuf., vol. 42, no. 5, pp. 462–470, 2011.
[27] R. F. Pinto, G. Catalanotti, and P. P. Camanho, “Measuring the intralaminar crack resistance curve of fibre reinforced composites at extreme temperatures,” Compos. Part A Appl. Sci. Manuf., vol. 91, pp. 145–155, 2016.