
A Level Biology B (Advancing Biology) - Groby Bio...
20
A Level Biology B (Advancing Biology) H422/03 Practical skills in biology Practice paper – Set 1 Time allowed: 1 hour 30 minutes INSTRUCTIONS • Use black ink. You may use an HB pencil for graphs and diagrams. • Complete the boxes above with your name, centre number and candidate number. • Answer all the questions. • Write your answer to each question in the space provided. If additional space is required, use the lined page(s) at the end of this booklet. The question number(s) must be clearly shown. • Do not write in the barcodes. INFORMATION • The total mark for this paper is 60. • The marks for each question are shown in brackets [ ]. • Quality of extended responses will be assessed in questions marked with an asterisk (*). • This document consists of 20 pages. © OCR 2016 PRACTICE PAPER OCR is an exempt Charity H42203/12 Turn over You must have: • the Insert (inserted) You may use: • a scientific calculator • a ruler (cm/mm) First name Last name Centre number Candidate number
Transcript of A Level Biology B (Advancing Biology) - Groby Bio...
A Level Biology B (Advancing Biology) H422/03 Practical skills in biology
Practice paper – Set 1 Time allowed: 1 hour 30 minutes
INSTRUCTIONS
• Use black ink. You may use an HB pencil for graphs and diagrams.
• Complete the boxes above with your name, centre number and candidate number.
• Answer all the questions.
• Write your answer to each question in the space provided. If additional space is
required, use the lined page(s) at the end of this booklet. The question number(s)
must be clearly shown.
• Do not write in the barcodes.
INFORMATION
• The total mark for this paper is 60.
• The marks for each question are shown in brackets [ ].
• Quality of extended responses will be assessed in questions marked with an
asterisk (*).
• This document consists of 20 pages.
© OCR 2016 PRACTICE PAPER OCR is an exempt Charity
H42203/12 Turn over
You must have:
• the Insert (inserted)
You may use:
• a scientific calculator• a ruler (cm/mm)
First name
Last name
Centre
number
Candidate
number
2
© OCR 2016 PRACTICE PAPER H422/03
Answer all the questions.
1 (a) A farmer with an orchard produces cider using the juice from the apples.
An advisor from the Government visits the farm and suggests that the farmer could grazesheep on the grass in the orchard to qualify for additional grant payments. The advisorsays that the productivity figures for the sheep will not be as good as the figures for theapples.
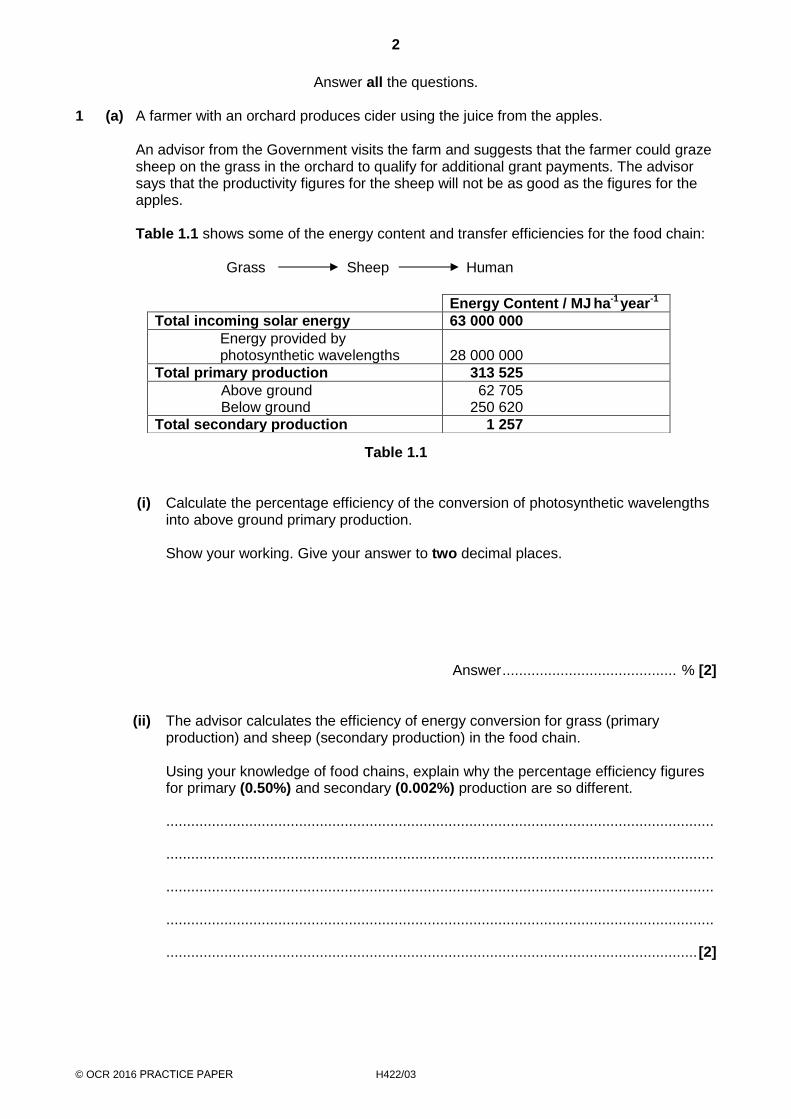
Table 1.1 shows some of the energy content and transfer efficiencies for the food chain:
Grass Sheep Human
Table 1.1
(i) Calculate the percentage efficiency of the conversion of photosynthetic wavelengthsinto above ground primary production.
Show your working. Give your answer to two decimal places.
Answer .......................................... % [2]
(ii) The advisor calculates the efficiency of energy conversion for grass (primaryproduction) and sheep (secondary production) in the food chain.
Using your knowledge of food chains, explain why the percentage efficiency figuresfor primary (0.50%) and secondary (0.002%) production are so different.
....................................................................................................................................
....................................................................................................................................
....................................................................................................................................
....................................................................................................................................
................................................................................................................................ [2]
Energy Content / MJ ha-1 year-1
Total incoming solar energy 63 000 000
Energy provided by photosynthetic wavelengths 28 000 000
Total primary production 313 525
Above ground Below ground
62 705 250 620
Total secondary production 1 257

3
© OCR 2016 PRACTICE PAPER H422/03 Turn over
(b) The farmer produces prize-winning cider which is bottled on the farm.
To make the perfect cider, it must contain just the right volume ofcarbon dioxide (CO2) gas to make it fizzy.
Live yeast remaining in the sealed bottles of cider produce this CO2.
Name the process by which live yeast cells make CO2 in a sealed bottle..
....................................................................................................................................... [1]
(c) A haemocytometer is used to estimate the population of live yeast in a sample ofundiluted cider.
The stain methylene blue is added to the sample. Only live yeast cells will take up thisstain.
Fig 1.1 shows the haemocytometer chamber containing the cider sample when viewedunder a light microscope.
Fig. 1.1
(i) The depth of the haemocytometer chamber, shown in Fig. 1.1, is 0.2 mm.
Calculate the number of live yeast cells in 1 cm3 of the cider sample.
Show your working.
Answer ............................................... [3]
4
© OCR 2016 PRACTICE PAPER H422/03
(ii) At the time it is bottled the optimum number of live yeast cells is between 250 000 to500 000 cells per cm3 of cider. This ensures the finished cider will contain just theright volume of CO2.
Using this information and your answer to (c)(i) would this cider be ready forbottling?
Justify your answer.
....................................................................................................................................
................................................................................................................................ [1]
(d) Flow cytometry is another technique that can be used for counting cells.
Compare the suitability of both techniques for counting the number of yeast cells in thispopulation.
...........................................................................................................................................
...........................................................................................................................................
...........................................................................................................................................
...........................................................................................................................................
...........................................................................................................................................
...........................................................................................................................................
...........................................................................................................................................
...........................................................................................................................................
....................................................................................................................................... [3]

5
© OCR 2016 PRACTICE PAPER H422/03 Turn over
2 A horse being treated by a vet appears to have pneumonia caused by a bacterial infection.
Antibiotics will be used to treat the horse, but the vet must first find out which species ofbacterium is causing the pneumonia.
A sample of fluid containing the bacteria is taken from the horse and sent to a laboratoryfor analysis in a small lidded bottle.
(a)* Write a method for safely obtaining a pure culture of the bacteria from the fluid sample.
You should name any equipment needed and justify your choice of equipment.
Your method must be based on the assumption that you are provided with school or college resources.
...........................................................................................................................................
...........................................................................................................................................
...........................................................................................................................................
...........................................................................................................................................
...........................................................................................................................................
...........................................................................................................................................
...........................................................................................................................................
...........................................................................................................................................
...........................................................................................................................................
...........................................................................................................................................
...........................................................................................................................................
...........................................................................................................................................
...........................................................................................................................................
...........................................................................................................................................
...........................................................................................................................................
...........................................................................................................................................
...........................................................................................................................................
...........................................................................................................................................
...........................................................................................................................................
...........................................................................................................................................
...........................................................................................................................................
....................................................................................................................................... [9]

6
© OCR 2016 PRACTICE PAPER H422/03
(b) The vet discovers that two different species of bacteria are present which may be causingthe pneumonia.
Once suitably prepared and stained using the Gram staining technique, a sample of thebacteria are observed using the high power lens of a light microscope.
In one of the bacterial species, the cells are seen to be stained red/pink.
(i) Why must a high power lens be used to view the bacteria?
....................................................................................................................................
................................................................................................................................ [1]
(ii) What does the red/pink colour of the stained bacteria suggest about the structure ofthe cells?
....................................................................................................................................
....................................................................................................................................
................................................................................................................................ [1]
(c) Fig. 2.1, on the Insert, is a photomicrograph of the bacterium, Klebsiella pneumoniae,the probable cause of the pneumonia.
(i) The cell labelled A, in Fig. 2.1, is undergoing cell division by a process called binaryfission.
Suggest why these bacterial cells do not divide by mitosis.
....................................................................................................................................
....................................................................................................................................
................................................................................................................................ [1]
(ii) The cell labelled B, in Fig. 2.1, has a width of 5 μm measured between X and Y.
Calculate the magnification of the photomicrograph.Show your working. Give your answer to three significant figures.
Answer X ...................................... [2]
7
© OCR 2016 PRACTICE PAPER H422/03 Turn over
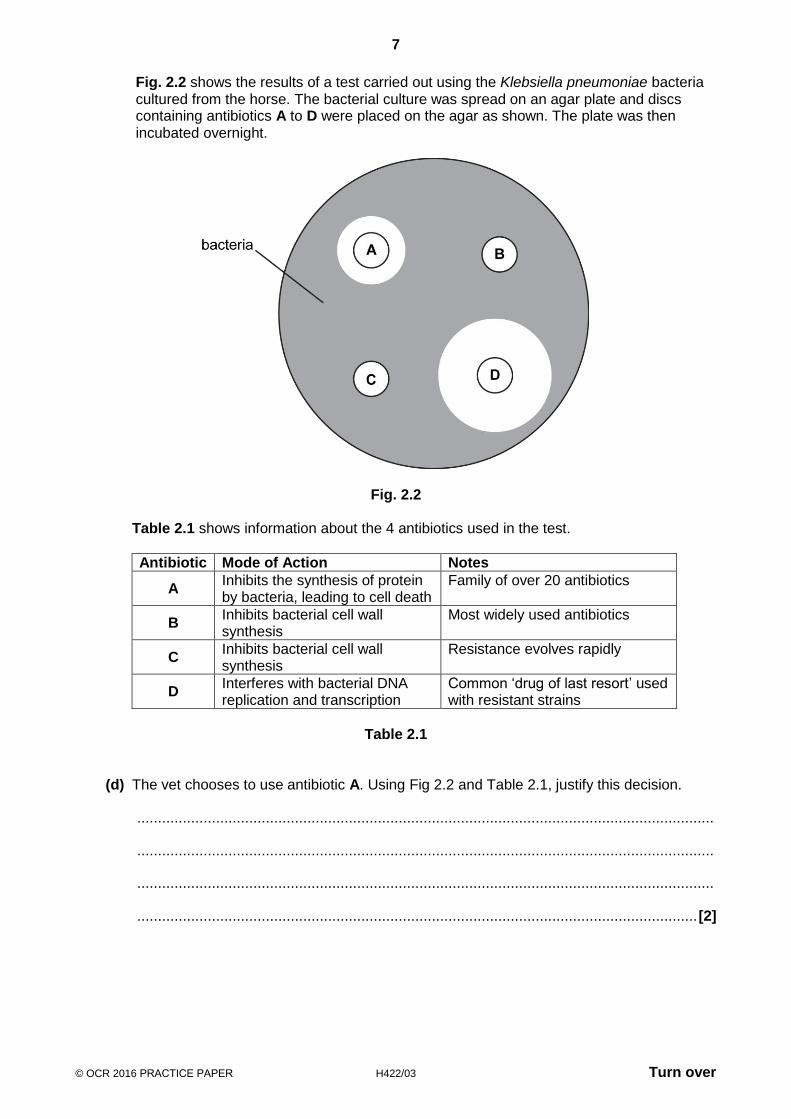
Fig. 2.2 shows the results of a test carried out using the Klebsiella pneumoniae bacteria cultured from the horse. The bacterial culture was spread on an agar plate and discs containing antibiotics A to D were placed on the agar as shown. The plate was then incubated overnight.
Fig. 2.2
Table 2.1 shows information about the 4 antibiotics used in the test.
Antibiotic Mode of Action Notes
A Inhibits the synthesis of protein by bacteria, leading to cell death
Family of over 20 antibiotics
B Inhibits bacterial cell wall synthesis
Most widely used antibiotics
C Inhibits bacterial cell wall synthesis
Resistance evolves rapidly
D Interferes with bacterial DNA replication and transcription
Common ‘drug of last resort’ used with resistant strains
Table 2.1
(d) The vet chooses to use antibiotic A. Using Fig 2.2 and Table 2.1, justify this decision.
...........................................................................................................................................
...........................................................................................................................................
...........................................................................................................................................
....................................................................................................................................... [2]
8
© OCR 2016 PRACTICE PAPER H422/03
3 (a) Fig. 3.1, on the Insert, is a colour enhanced light micrograph of mammalian pancreatictissue.
(i) Name the structure labelled Z in Fig 3.1.
................................................................................................................................ [1]
(ii) In the space below draw a labelled and annotated plan of the pancreatic tissueshown in Fig. 3.1.
[3]
(b) A student is asked to analyse some blood plasma from a Type 1 diabetic person for thepresence of glucose.
The analysis is carried out by heating a plasma sample with Benedict’s solution in aboiling water bath and observing any colour change.
A colorimeter is then used to obtain quantitative results.

9
© OCR 2016 PRACTICE PAPER H422/03 Turn over
Table 3.1 shows the blood glucose concentrations recorded by the student over five days.
Time when blood
glucose tested
Day 1 Day 2 Day 3 Day 4 Day 5
07:00 4.5 4.7 4.7 4.8 4.6
09:00 7.5 6.9 7.4 4.7 7.3
11:00 6.4 6.0 6.1 4.5 6.0
13:00 7.9 7.4 7.6 7.8 7.5
15:00 6.8 6.3 6.3 6.8 6.2
17:00 5.8 5.7 5.7 5.8 5.8
19:00 7.9 7.5 7.6 7.8 7.5
21:00 5.8 5.7 5.7 5.8 5.8
23:00 5.2 5.2 5.3 5.1 5.4
Mean 6.42 6.16 6.27 6.23
Table 3.1
(i) Complete Table 3.1, by calculating the mean for Day 4.[1]
(ii) Calculating a mean blood glucose concentration to plan the correct doses of insulinfor each day is inappropriate. Explain why.
....................................................................................................................................
....................................................................................................................................
....................................................................................................................................
................................................................................................................................ [2]
(iii) The data for the morning of Day 4 appear to be different from the other days.Suggest two possible reasons why.
1 ..................................................................................................................................
2 .................................................................................................................................. [1]
(c) Apart from using Benedict’s solution and a colorimeter, suggest two alternativequantitative methods for measuring the concentration of glucose in blood plasma.
1 .........................................................................................................................................
...........................................................................................................................................
2 .........................................................................................................................................
........................................................................................................................................... [2]
10
© OCR 2016 PRACTICE PAPER H422/03
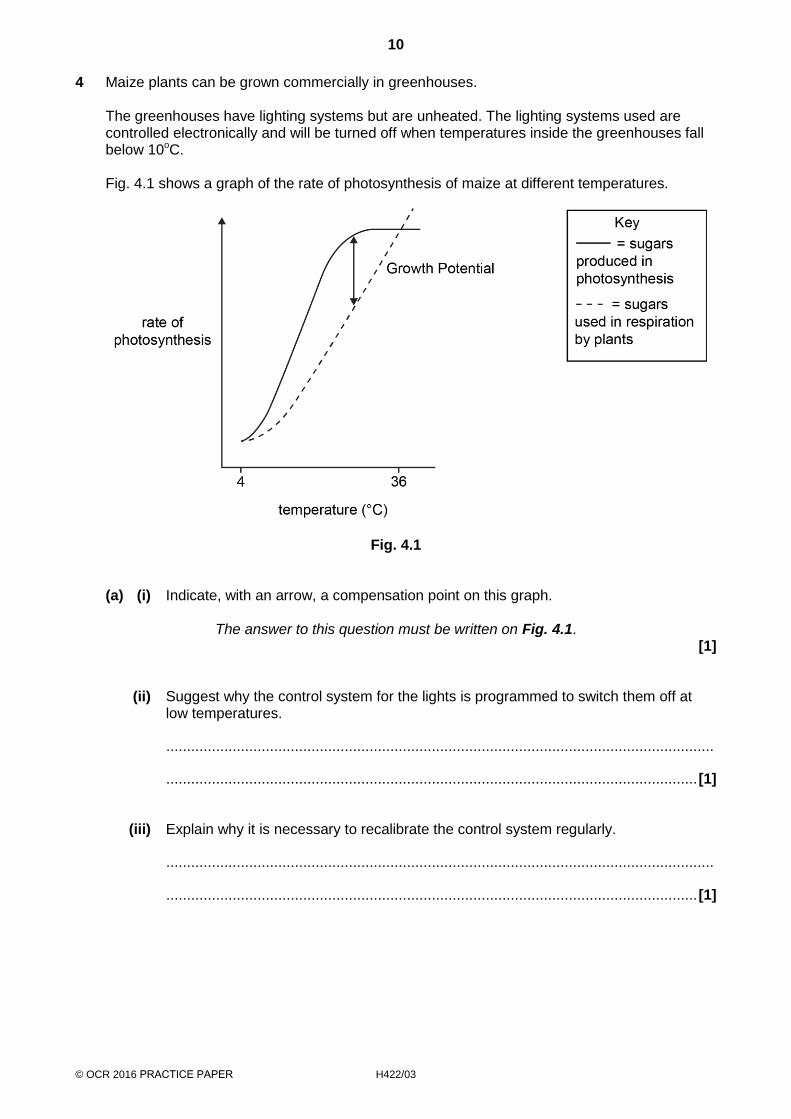
4 Maize plants can be grown commercially in greenhouses.
The greenhouses have lighting systems but are unheated. The lighting systems used are controlled electronically and will be turned off when temperatures inside the greenhouses fall below 10oC.
Fig. 4.1 shows a graph of the rate of photosynthesis of maize at different temperatures.
Fig. 4.1
(a) (i) Indicate, with an arrow, a compensation point on this graph.
The answer to this question must be written on Fig. 4.1. [1]
(ii) Suggest why the control system for the lights is programmed to switch them off atlow temperatures.
....................................................................................................................................
................................................................................................................................ [1]
(iii) Explain why it is necessary to recalibrate the control system regularly.
....................................................................................................................................
................................................................................................................................ [1]
11
© OCR 2016 PRACTICE PAPER H422/03 Turn over
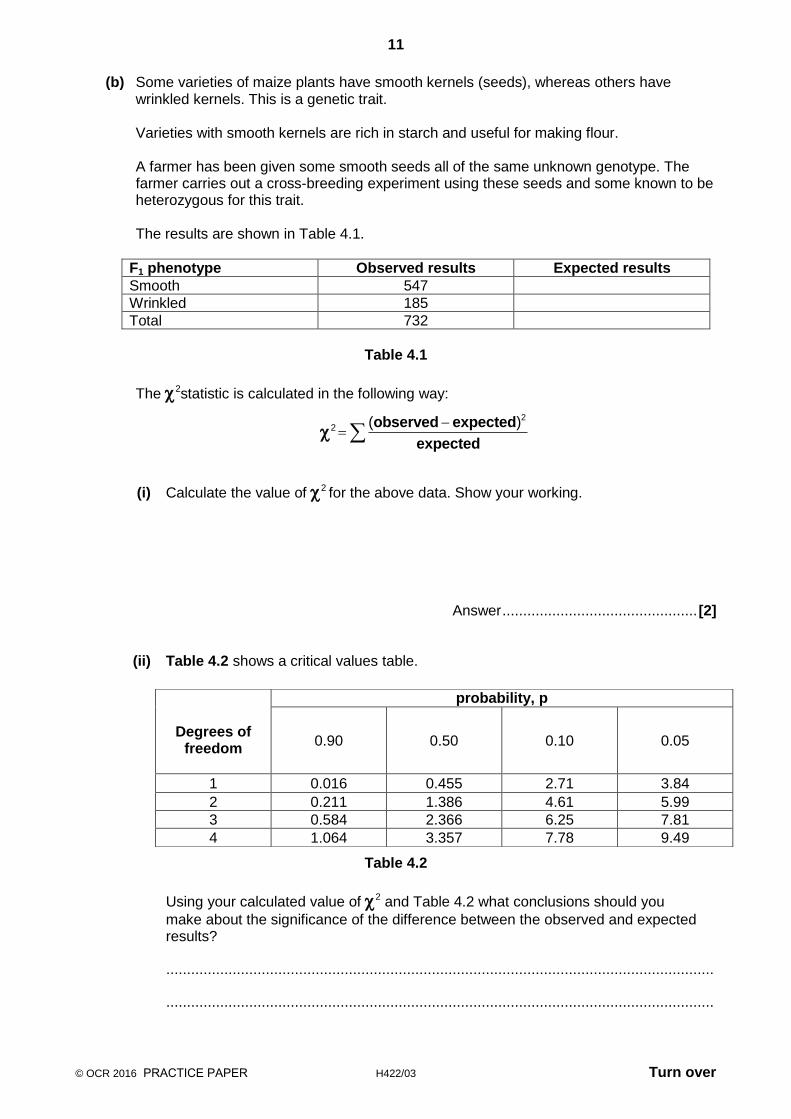
(b) Some varieties of maize plants have smooth kernels (seeds), whereas others havewrinkled kernels. This is a genetic trait.
Varieties with smooth kernels are rich in starch and useful for making flour.
A farmer has been given some smooth seeds all of the same unknown genotype. Thefarmer carries out a cross-breeding experiment using these seeds and some known to beheterozygous for this trait.
The results are shown in Table 4.1.
F1 phenotype Observed results Expected results
Smooth 547
Wrinkled 185
Total 732
Table 4.1
The 2statistic is calculated in the following way:
22( )
observed expected
expected
(i) Calculate the value of 2 for the above data. Show your working.
Answer ............................................... [2]
(ii) Table 4.2 shows a critical values table.
Table 4.2
Using your calculated value of 2 and Table 4.2 what conclusions should you
make about the significance of the difference between the observed and expected results?
....................................................................................................................................
....................................................................................................................................
Degrees of freedom
probability, p
0.90 0.50 0.10 0.05
1 0.016 0.455 2.71 3.84
2 0.211 1.386 4.61 5.99
3 0.584 2.366 6.25 7.81
4 1.064 3.357 7.78 9.49

12
© OCR 2016 PRACTICE PAPER H422/03
................................................................................................................................ [2] (iii) Describe the genotype of the seed the farmer was given. Give a reason for your
answer.
....................................................................................................................................
....................................................................................................................................
................................................................................................................................ [2]

13
© OCR 2016 PRACTICE PAPER H422/03 Turn over
5 Fig. 5.1 shows VO2 max for a number of different mammals.
Fig. 5.1
(a) (i) Describe the trend in the data shown in Fig. 5.1.
....................................................................................................................................
................................................................................................................................ [1]
(ii) One point in the data, shown in Fig. 5.1, does not fit the trend.Name the mammal.
Mammal ......................................................................................................................
The data for this mammal is accurate. Suggest one reason why the VO2 max for this mammal does not fit the trend.
....................................................................................................................................
....................................................................................................................................
.................................................................................................................................... [1]
(iii) Suggest why a logarithmic scale has been used on the x-axis of the graph inFig. 5.1.
....................................................................................................................................
................................................................................................................................ [1]

14
© OCR 2016 PRACTICE PAPER H422/03
(b) Higher VO2 max is associated with better race performance. An athlete has a VO2 max of38 cm3 kg-1
min-1. The athlete’s trainer suggests experimenting with carbohydrate-loadingto find out if carbohydrate-loading improves VO2 max.
During the experiment, the athlete raced once a week and each time the VO2 max was measured. For the first 8 weeks, the athlete ate a normal diet. For weeks 9 to 20, the athlete followed a carbohydrate-loading diet plan.
The athlete’s VO2 max was measured every week during the investigation.
The results are shown in Table 5.1.
Week Treatment VO2 max (cm3 kg-1 min-1)
1 Normal diet 38
2 37
3 37
4 39
5 41
6 41
7 40
8 38
Mean VO2 max (cm3 kg-1 min-1)
39
9 Carbohydrate-loading 39
10 40
11 39
12 42
13 43
14 39
15 44
16 40
17 40
18 41
19 43
20 42
Mean VO2 max (cm3 kg-1 min-1)
41
Table 5.1
(i) Plot a graph, on the grid provided, to show the mean values of the data shown inTable 5.1 in the most appropriate way.
Add range bars to show the highest and lowest VO2 max values in each of the two treatments.
[4]

15
© OCR 2016 PRACTICE PAPER H422/03 Turn over

16
© OCR 2016 PRACTICE PAPER H422/03
(ii)* If the results of the investigation show that the carbohydrate-loading improves VO2 max the trainer would recommend it for all the athletes they coach.
Evaluate the investigation the trainer carried out. Your account should include a consideration of:
variables
confidence in the data
validity.
....................................................................................................................................
....................................................................................................................................
....................................................................................................................................
....................................................................................................................................
....................................................................................................................................
....................................................................................................................................
....................................................................................................................................
....................................................................................................................................
....................................................................................................................................
....................................................................................................................................
....................................................................................................................................
....................................................................................................................................
....................................................................................................................................
................................................................................................................................ [6]
END OF QUESTION PAPER

17
© OCR 2016 PRACTICE PAPER H420/03 Turn over
ADDITIONAL ANSWER SPACE
If additional answer space is required, you should use the following lined page(s). The question number(s) must be clearly shown in the margin(s).

18
© OCR 2016 PRACTICE PAPER H422/03

19
© OCR 2016 PRACTICE PAPER H420/03 Turn over

20
© OCR 2016 PRACTICE PAPER H422/03
Copyright Information:
OCR is committed to seeking permission to reproduce all third-party content that it uses in its assessment materials. OCR has attempted to identify and contact all copyright holders whose work is used in this paper. To avoid the issue of disclosure of answer-related information to candidates, all copyright acknowledgements are reproduced in the OCR Copyright Acknowledgements Booklet. This is produced for each series of examinations and is freely available to download from our public website (www.ocr.org.uk) after the live examination series. If OCR has unwittingly failed to correctly acknowledge or clear any third-party content in this assessment material OCR will be happy to correct its mistake at the earliest possible opportunity. For queries or further information please contact the Copyright Team, First Floor, 9 Hills Road, Cambridge CB2 1GE. OCR is part of the Cambridge Assessment Group. Cambridge Assessment is the brand name of University of Cambridge Local Examinations Syndicate (UCLES), which is itself a department of the University of Cambridge.