
A Legislator’s Guide to Revitalizing Performance Budgeting ... · A Legislator’s Guide to...
27
A Legislator’s Guide to Revitalizing Performance Budgeting in Mississippi 2015 Regular Session Mississippi Legislature
Transcript of A Legislator’s Guide to Revitalizing Performance Budgeting ... · A Legislator’s Guide to...

A Legislator’s Guide
to
Revitalizing Performance Budgeting in Mississippi
2015 Regular Session Mississippi Legislature

i
Purpose and Content of This Guide
The purpose of this guide is to explain, in question and answer format:
• performance budgeting;
• the Legislature’s history with performance budgeting and the need to strengthen its efforts;
• key components of the performance budgeting revitalization effort; and,
• your role in making this effort successful. For each question, the short answer is highlighted in blue bold text, with more detail following.
This guide also includes:
• a list of questions you might consider asking agency staff during appropriations hearings; and,
• a glossary of performance budgeting terms.

iii
Preface
As you know, the “power of the purse” is one of the most important powers of the Legislature. As noted by the late Professor Alan Rosenthal, a leading scholar of state legislatures:
The budget is probably the most important bill that a legislature passes. A legislature that performs poorly on the budget is likely to be an ineffective legislature overall.
FY 2015 appropriations for the State of Mississippi totaled approximately $20 billion, of which $5.5 billion were general funds. It is your challenge and responsibility to protect this significant investment in state government by using the budgetary process to help ensure that public dollars are committed to their highest and best use. The performance budgeting revitalization effort described in this guide is a process that will take time and resources to implement fully. The effort will require the commitment of the Legislature and its staff, as well as the commitment of all state employees, to a culture of using data to drive decisions. The long-term benefit of this effort will be a performance-based budgeting and management system that identifies and eliminates wasteful and ineffective programs and drives public resources to programs that are proven to work.

v
Table of Contents Purpose and Content of This Guide ........................................................................................................ i Preface ...............................................................................................................................iii Chapter 1: Revitalizing Performance Budgeting..................................................................................1 What is performance budgeting?...................................................................................................1 Why “revitalize” performance budgeting?...................................................................................1 What are the primary components of the performance budgeting revitalization effort? ................................................................................................................................2 Chapter 2: Statewide Strategic Plan .......................................................................................................3 What is a statewide strategic plan?...............................................................................................3 How does a statewide strategic plan help to revitalize performance budgeting? .............3 What is a legislator’s role in the statewide strategic planning process?...............................3 What are the next steps for the statewide strategic plan?.......................................................5 Chapter 3: Comprehensive Program Inventory ...................................................................................6 What is a comprehensive program inventory? ...........................................................................6 How does development of a comprehensive program inventory help to revitalize performance budgeting? ..............................................................................................................6 What is a legislator’s role in utilizing the comprehensive program inventory?..................7 What are the next steps in developing the comprehensive program inventory? ................7
Chapter 4: Pew-MacArthur Results First Initiative..............................................................................9 What is the Pew-MacArthur Results First Initiative? .................................................................9 How does implementation of the Pew-MacArthur Results First Initiative help to revitalize performance budgeting? ............................................................................................9 What is a legislator’s role in implementation of the Pew-MacArthur Results First Initiative? ..............................................................................................................................12 What are the next steps in implementing the Pew-MacArthur Results First Initiative? ..............................................................................................................................13 Chapter 5: Suggested Appropriation Hearing Questions, by Primary Component of the Performance Budgeting Revitalization Effort .......................................................................................14 Appendix A: Glossary of Performance Budgeting Terms ................................................17 Appendix B: Monetary Benefits and Costs of Mississippi’s Evidence-Based Adult Criminal Justice Intervention Programs (in 2012 Dollars) ...........21

vii
List of Exhibits Exhibit 1: Strategic Planning Template for Mississippi Government ..............................................4 Exhibit 2: The Pew-MacArthur Results First Approach to Evidence-Based Policymaking..........10 Exhibit 3: Explanation of Key Statistics Reported by the Pew-MacArthur Results First
Cost-Benefit Analysis Model ........................................................................................................11

1
Chapter 1: Revitalizing Performance Budgeting
What is performance budgeting? Performance budgeting is a method of allocating dollars to programs based on consideration of how efficiently and effectively each program can deliver the desired results with the dollars requested. Performance budgeting1 moves the focus of budgetary decisions from what government buys (e. g., major objects of expenditure such as salaries and fringe benefits, commodities; commonly referred to as line-item budgeting) to what government achieves as efficiently as possible (e. g., improved student performance on statewide assessments, reduction in births of low birth weight) through the delivery of its programs and activities. The goal of performance budgeting is to create a more efficient, effective, transparent, and accountable state government. The Legislature adopted performance budgeting through passage of the Mississippi Performance Budget and Strategic Planning Act of 1994. The act requires the collection and analysis of data measuring the performance of state agency programs relative to the goals and objectives for the programs established in agencies’ five-year strategic plans. Why “revitalize” performance budgeting? The strategic planning and performance measurement information provided to legislators under the Mississippi Performance Budget and Strategic Planning Act of 1994 has been difficult to incorporate into budgetary decisions because it presents an incomplete picture of the results achieved by a program relative to its expenditure of public resources. The purpose of the revitalization effort is to realize performance budgeting’s goal of a more efficient, effective, transparent, and accountable state government by:
• shifting the focus of performance data reported by state agencies under the 1994 act from things done (e. g., number of reports issued) to things accomplished efficiently (e. g., number of dollars saved through adoption of report recommendations) pursuant to statewide priorities set by legislative leadership; and,
• taking advantage of advances in computer technology and analytical tools since passage of the 1994 act to provide legislators with information that is easier to use in making budgetary decisions, including the information needed to ensure that public resources are invested in programs and policies that are grounded in evidence-based research and best practices.
While agencies have complied with the 1994 act by annually submitting five-year strategic plans and performance data to the Legislature, this information is not driving appropriations decisions. Typically, the performance data submitted by agencies is limited in content and lacks the analysis necessary to make it useful in the budgetary
1Words defined in the Glossary (Appendix A, page 17) are indicated in green italics the first time that they appear in the text of this section of the guide.
2
process. While there are exceptions, most state agencies have reported the number of actions taken (e. g., licenses issued, inspections conducted, people served, reports issued) with no data documenting the results achieved through the actions, how these results contribute to progress toward agency goals and objectives, or whether the agency is achieving results as efficiently as possible. Further, until the Legislature’s formal identification of statewide goals and objectives in its document Building a Better Mississippi: The Statewide Strategic Plan for Performance and Budgetary Success (July 2014), the individual strategic plans of state agencies were not linked to a unifying framework of statewide priorities. Significant advances in computer technology and related analytical tools since passage of the 1994 act have made it possible to collect and analyze large quantities of agency expenditure and performance data and to present the results of this analysis online in formats that can directly inform budgetary decisions. For example, newer technology makes it easy to create graphs showing historical trend lines comparing actual performance to targeted levels of performance and to create tables showing the comparative returns on investment for various programs. These technological advances also provide online access to:
• clearinghouses of research on public programs and policies that allow public officials to identify programs that are proven to work through evidence-based research; and,
• compendiums of public program “best practices” that allow public officials to identify methods or techniques that are proven to achieve desired outcomes efficiently.
As discussed in this guide, these advances form the basis of the current revitalization effort. What are the primary components of the performance budgeting revitalization effort? The three primary components of the performance budgeting revitalization effort are the:
• development of a statewide strategic plan;
• creation of a comprehensive inventory of state agency programs; and,
• implementation of the Pew-MacArthur Results First Initiative. The following chapters contain discussions of each of these components.

3
Chapter 2: Statewide Strategic Plan
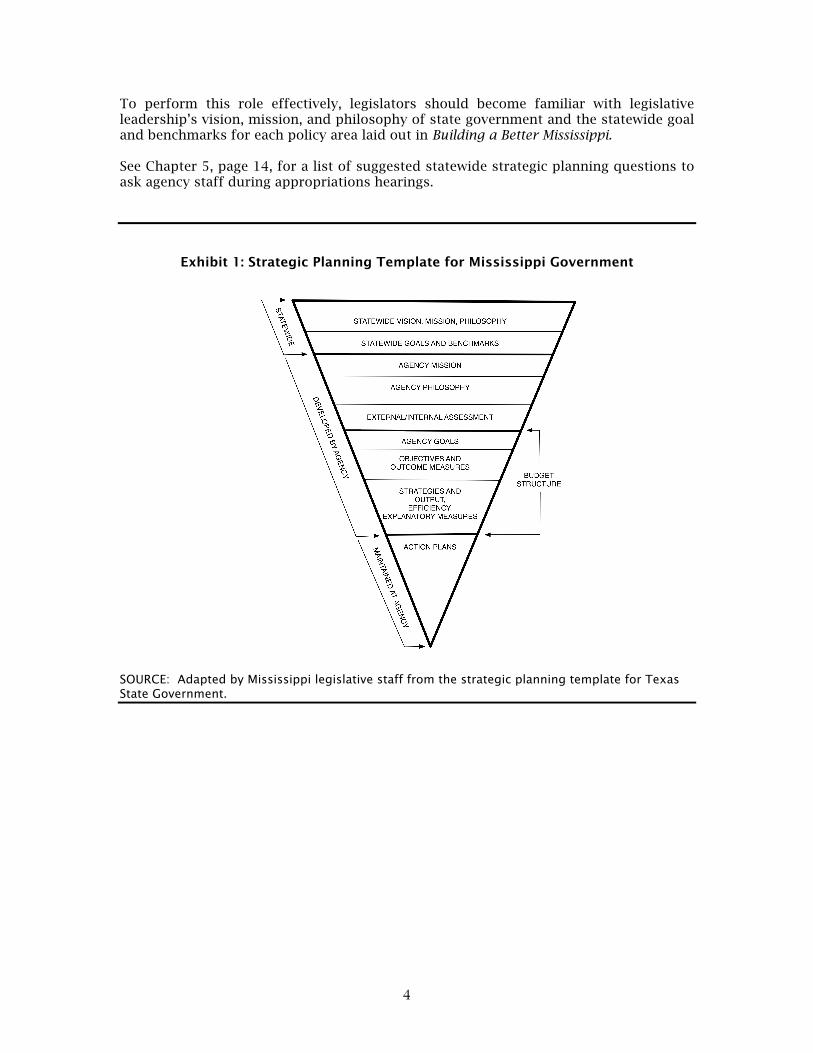
What is a statewide strategic plan? A statewide strategic plan lays out the actions and strategies that state agencies intend to undertake in order to achieve the vision, mission, philosophy, goals, and benchmarks that leadership has identified for state government. In developing Mississippi’s statewide strategic plan, legislative leadership adapted the framework used by the State of Texas. As shown in Exhibit 1 on page 4, the top two layers of the template contain the “statewide elements” of the statewide strategic plan-- i. e., the vision, mission, philosophy, goals, and benchmarks identified by legislative leadership for the work of state government. In July 2014, legislative leadership identified the statewide elements for Mississippi government in Building a Better Mississippi: The Statewide Strategic Plan for Performance and Budgetary Success. This document may be accessed online through the following websites:
Legislative Budget Office: http://www.lbo.ms.gov/index_files/pdf/MSStrategicPlan.pdf PEER: http://www.peer.state.ms.us/reports/strategic_plan.pdf
In its strategic plan instructions for FY 2016-20, the Legislative Budget Office directs state agencies to align their five-year strategic and action plans (the next seven layers of the template) with the statewide elements of the statewide strategic plan. The Legislative Budget Office also instructs state agencies to explain how their services and work activities link to achieving the statewide vision, mission, philosophy, goals, and benchmarks. How does a statewide strategic plan help to revitalize performance budgeting? A statewide strategic plan helps legislators to direct state appropriations to programs and activities most likely to achieve the outcomes identified as statewide priorities by legislative leadership. While state agencies have developed their own individual five-year strategic plans since passage of the Mississippi Performance Budget and Strategic Planning Act of 1994, this is the first year that agency plans are being linked to a unifying framework of statewide priorities. What is a legislator’s role in the statewide strategic planning process? A legislator’s role in the statewide strategic planning process is to consider how strongly an agency program or activity for which funding is being requested links to the achievement of priority outcomes identified by legislative leadership. A legislator’s role in the statewide strategic planning process is to question agencies as to how the programs and activities for which they are seeking funding help to achieve the statewide priorities identified by legislative leadership. Because of the comprehensive nature of the statewide vision, mission, philosophy, and goals that legislative leadership has established for state government, legislators should carefully consider any request for funding that falls outside of this framework.
4
To perform this role effectively, legislators should become familiar with legislative leadership’s vision, mission, and philosophy of state government and the statewide goal and benchmarks for each policy area laid out in Building a Better Mississippi. See Chapter 5, page 14, for a list of suggested statewide strategic planning questions to ask agency staff during appropriations hearings.
Exhibit 1: Strategic Planning Template for Mississippi Government
SOURCE: Adapted by Mississippi legislative staff from the strategic planning template for Texas State Government.

5
What are next steps for the statewide strategic plan? In the short run, legislative staff will collect and report data for each statewide benchmark so that performance regarding the benchmark can be assessed. In the longer run, legislative staff plans to develop an online statewide data dashboard2 that will allow legislators to assess performance on the benchmarks at a glance. In the short run, the first step for the statewide strategic plan is to collect and report data for each statewide benchmark by the next budget cycle and to indicate which benchmarks have improved, maintained, and worsened over the fiscal year. To further focus the efforts of state government and to increase its transparency, as resources become available, legislative staff plans to develop an online statewide data dashboard. The dashboard would provide a visual online display of progress made on the top statewide benchmarks and would also provide drill-down capacity to access more detailed information (e. g., performance on the benchmark by region of the state, performance on the benchmark in comparison to other states) and graphics for each benchmark.
2While some states and agencies use the terms “dashboards” and “scorecards” interchangeably, as they are both visual online displays of performance data, others differentiate between the two by defining a dashboard as a display that allows for monitoring the entity’s performance on key indicators at a glance and a scorecard as a tabular visualization that compares actual performance on key indicators to targeted performance.
6
Chapter 3: Comprehensive Program Inventory What is a comprehensive program inventory? A comprehensive program inventory identifies each “accountability program,” defined as a set of activities designed to achieve a specific outcome(s), carried out by state agencies and collects and reports performance and expenditure data for each of these programs. For purposes of the comprehensive program inventory, legislative staff defines a “program” as any set of activities designed to achieve a specific outcome(s). This is a generally narrower definition of a program than the definition of a program for budgetary purposes (refer to the Glossary in Appendix A, page 17, for the definition of a budgetary program). The generally narrower definition of a program for purposes of the inventory is necessary to identify programs at the level that they would be found in the research and best practices literature. To distinguish inventory programs from budgetary programs, legislative staff refers to programs in the inventory as accountability programs. The Legislature mandated the development of a comprehensive program inventory in state law through passage of H.B. 677 during its 2014 Regular Session. A new CODE section, MISS. CODE ANN. Section 27-103-159 (1972), requires the development of an inventory of programs and activities for use in the budgeting process, beginning with the departments of Corrections, Health, Education, and Transportation. How does development of a comprehensive program inventory help to revitalize performance budgeting? The collection and reporting of performance and expenditure data at the accountability program level will enable legislators to drill down into budgetary programs to understand what agencies are accomplishing with public dollars and to question activities that appear to be ineffective or otherwise wasteful. In developing a comprehensive program inventory for the four pilot agencies, legislative staff, working with pilot agency staff, has already identified over a thousand accountability programs. The next step will be to collect expenditure and performance data (emphasizing the development of outcome measures) for each program and to classify each program as “evidence-based,” “research-based,” “promising practices” or “other programs and activities” according to the framework established in MISS. CODE ANN. Section 27-103-159 (1972). This classification divides programs into those whose efficiency and effectiveness can be established through research (i. e., intervention programs, which are the focus of the Pew-MacArthur Results First Initiative discussed on page 9) versus those non-intervention programs such as “general accounting,” the efficiency and effectiveness of which can be measured against best practices. Legislative staff is structuring the inventory so that accountability programs that exist in more than one state agency (e. g., administrative programs such as payroll processing, general accounting) will have the same performance measures. These measures can then be analyzed and compared in order to identify best practices among state agencies--i. e., programs best achieving desired results at the lowest cost--and to compare these practices to best practices identified in national compendiums. The efficiency and

7
effectiveness of state government can then be improved by transferring best practices to agencies that have not yet adopted these practices. The information collected through the comprehensive program inventory will only become useful to legislators in the budgetary process when it can be accessed online (see discussion under “next steps,” below). Online access will permit legislators to drill down into budgetary programs to determine what is being accomplished with public dollars and to identify accountability programs that appear to be ineffective or otherwise wasteful. Online access will also enable legislators to determine total public resources that state agencies are expending to achieve a specific statewide benchmark, such as reducing infant mortality. What is a legislator’s role in utilizing the comprehensive program inventory? A legislator’s role with respect to the comprehensive program inventory is to access and use the data and information captured by the inventory to make more informed budgetary decisions. Until legislators can access this information online, their role in using this information to make budgetary decisions is severely restricted. Once the comprehensive program inventory data is available online, legislators will be able to examine budgetary programs in greater detail to identify components that are inefficient or ineffective. Until that time, legislators can encourage agencies to examine the components of their own budgetary programs in order to compile an inventory of accountability programs. Once agencies have identified their accountability programs, they should develop and report the following information for each program:
• the full range of performance measures required by the Legislative Budget Office, with a particular emphasis on developing and reporting good outcome measures; and,
• expenditure data.
Agencies should also identify the research basis of each of their intervention programs, as mandated by MISS. CODE ANN. Section 27-103-159 (1972) (see discussion on page 6) and provide online links to best practices applicable to each of their non-intervention programs. See Chapter 5, page 14, for a list of suggested comprehensive program inventory questions to ask agency staff during appropriations hearings. What are the next steps in developing the comprehensive program inventory? After completing the initial program inventories for the four pilot agencies, the next step will be to determine the appropriate level of program detail needed to make more informed budget decisions before expanding the inventory to other state agencies. The first step is to complete the accountability program inventories for the four pilot agencies, including identifying outcome measures for each program, collecting expenditure data, classifying intervention programs according to their research basis, and identifying “best practices” applicable to non-intervention programs when such information is available through national compendiums. Program inventories must be

8
updated as accountability programs change. Agencies operating a large number of intervention programs (e. g., the departments of Health and Education) will likely have frequent changes to their accountability program inventories. The next step will be to assess whether the level of accountability program detail collected for the pilot agencies is appropriate for informing state budget decisions or whether less detail is more appropriate before developing accountability program inventories for all state agencies. While these steps are being carried out, legislative staff is exploring ways to present the inventory data online, including capturing and reporting the data through MAGIC. It is expected that as MAGIC becomes fully operational, it will link accountability programs to statewide benchmarks so that all resources expended on achieving a statewide benchmark will be captured and the effectiveness of individual programs in contributing to achieving statewide outcomes can be analyzed. Legislators will then be able to use this information in the budgetary process to transfer resources from less effective programs to more effective programs.

9
Chapter 4: Pew-MacArthur Results First Initiative What is the Pew-MacArthur Results First Initiative? The Pew-MacArthur Results First Initiative is a project of The Pew Charitable Trusts and the John D. and Catherine T. MacArthur Foundation. The initiative works with states to implement an innovative cost-benefit analysis approach that helps them to invest in programs and policies that are proven to work. The Pew-MacArthur Results First Initiative works with states to implement an innovative approach to evidence-based policymaking. Exhibit 2 on page 10 presents an infographic of the Pew-MacArthur Results First Approach to evidence-based policymaking. The Results First cost-benefit analysis model was originally developed by the Washington State Institute for Public Policy and continues to be refined in partnership with that body. In implementing the model, states compile an inventory of all intervention programs that agencies are currently operating and then determine which of these programs have been tested and are considered to be effective or promising, based on rigorous, scientific research. States then compare the expense of their intervention programs to the returns that they are projected to deliver, enabling policymakers to direct limited resources toward the most cost-effective programs while curbing spending on those programs that are less cost-effective or proven through research to be ineffective. How does implementation of the Pew-MacArthur Results First Initiative help to revitalize performance budgeting? The Pew-MacArthur Results First Initiative provides a significant benefit to the performance budgeting revitalization effort because it converts program cost and benefit data into statistics that can be compared among programs and used to drive budgetary decisions. Prior to the Pew-MacArthur Results First Initiative, state legislatures had difficulty implementing performance budgeting because of uncertainty as to how to use performance data to make funding decisions. For example, should an agency that does not achieve its program objectives be punished with reduced funding even though its failure may be due to insufficient resources to meet its objectives? Should an agency that is meeting or exceeding its objectives be rewarded with increased funding even though its success may be due to “low-balling” its objectives--i. e., setting objectives that are below the agency’s potential based on the resources already committed to the program? The Pew-MacArthur Results First Initiative helps to resolve such dilemmas by providing an analytic tool, the Pew-MacArthur Results First Cost-Benefit Analysis Model, that converts complex program cost and benefit data into single statistics (i. e., benefit-to-cost ratio, net present value of long-term program benefits minus costs) that can be compared among programs and used to drive budgetary decisions. Exhibit 3 on page 11 explains each of these key statistics. The data collected for and reported in the model can also be translated into line graphs that compare the projected effects of a properly implemented evidence-based intervention program on the primary targeted outcome (e.g., the effects of a “correctional education in prison” program on recidivism) to the recidivism rates projected to occur without the intervention program.

10
Exhibit 2 The Pew-MacArthur Results First Approach to Evidence-Based Policymaking
SOURCE: Pew-MacArthur Results First Initiative.

11
Exhibit 3
Explanation of Key Statistics Reported by the Pew-MacArthur Results First
Cost-Benefit Analysis Model Benefit-to-Cost Ratio A program’s benefit-to-cost ratio shows the dollar value of benefits generated by a program for every dollar invested in the operation of the program. For example, a program with a benefit-to-cost ratio of $10 generates $10 in benefits for every $1 invested in the operation of the program. A program with a benefit-to-cost ratio of less than $1 has a negative return on investment. For example, a program with a benefit-to-cost ratio of $0.50 generates only fifty cents in benefits for every dollar invested in the program.
Net Present Value (long-term benefits minus costs) The net present value of long-term benefits converts the purchase value of future dollars into their present value to show the current dollar value of program benefits minus program costs on a per-participant basis. For example, a program with a net present value of $9,000 means that each participant in the program generates $9,000 in current dollar benefits after deducting costs of participation. SOURCE: Legislative staff in collaboration with staff of the Pew-MacArthur Results First Initiative. Mississippi piloted the Results First Cost-Benefit Analysis Model to assess programs in the adult criminal justice system that were intended to prevent crime. Of the nineteen programs operating at the time of the pilot, nine met the standards for evidence-based research necessary for inclusion in the model. As shown in Appendix B on page 21, the statistics generated by the model showed that seven of the nine programs yielded positive returns in line with the returns reported in the research literature, while two (domestic violence perpetrator treatment and drug courts) showed poor returns on investment. While drug court programs have strong evidence of effectiveness, the analysis showed that the costs of drug courts, as they are delivered in Mississippi, exceed projected benefits. As discussed on page 13, Mississippi’s drug courts are undergoing fidelity audits in an effort to bring their return on investment more in line with that reported in the evidence-based research. The statistics reported in Appendix B could change as the data entered into the model is refined to include actual Mississippi data as it becomes available in those cases in which estimates had to be used because the data needed to run the model was not being collected and reported at the time of the pilot. Recognizing the caveats noted in the previous paragraph, Appendix B shows that the positive benefit-to-cost ratios calculated by the model ranged from $44.06 for the “outpatient/non-intensive drug treatment while incarcerated” program to $1.29 for the “correctional industries in prison” program. The net present value of long-term benefits minus costs for the nine programs ranged from $12,222 per participant for the correctional education in prison program to -$4,283 (a negative return) per participant for the drug court program.

12
What is a legislator’s role in the implementation of the Pew-MacArthur Results First Initiative? A legislator’s role in implementation of the Pew-MacArthur Results First Initiative is to:
• understand the initiative’s key terms (e. g., intervention programs, evidence-based programs, benefit-to-cost ratio, net present value of long-term benefits minus costs);
• use the Pew-MacArthur Results First Approach to direct public dollars to the
most cost-effective programs and policies, beginning with adult criminal justice system programs and expanding to other public policy areas as analytics become available; and,
• curb spending on programs that the Results First Approach shows to be
ineffective. Through the return on investment statistics (benefit-to-cost ratios and net present value calculations) and evidence-based model program design and practice information provided through the Pew-MacArthur Results First Initiative, budgetary decisionmakers can choose from a variety of resource allocation options, including:
• eliminating programs with no research basis or with research documenting their ineffectiveness and reallocating their resources to evidence-based programs;
• expanding evidence-based programs with a positive return on investment, based
on the degree of relevant unmet need for services offered by the program and availability of public funds to allocate to the program;
• transferring public funds from evidence-based programs with lower positive
returns on investment to evidence-based programs seeking to achieve the same outcome with higher returns on investment; and,
• encouraging agencies to identify resources to conduct fidelity audits of
programs with a strong evidence base to ensure the full value of taxpayer investments.
Mississippi’s pilot implementation of the Pew-MacArthur Results First Model has already yielded the following three opportunities to use Results First information to make budgetary decisions:
1. Transfer funding from the Regimented Inmate Discipline (RID) Program to a cost-effective evidence-based program. MDOC currently operates RID programs at its South Mississippi Correctional Institution, Walnut Grove Correctional Facility, and Flowood Satellite Facility. The research on adult criminal justice intervention programs indicates that RID programs do not have a documented positive return on investment. Legislative staff is working with staff of MDOC to identify the costs of operating its RID programs so that they can be terminated (pending the passage of legislation allowing for their termination, since the RID program is referenced in state law) and their resources transferred to a cost-effective evidence-based correctional program (such as cognitive behavioral treatment) that better serves the needs of individuals currently enrolled in RID programs.

13
2. Monitor the cost-effectiveness of drug courts until they achieve a positive return on investment in line with the research literature before committing new funding to the program. In the second instance, Mississippi’s drug courts are yielding benefit-to-cost statistics significantly lower than the statistics expected in the research literature (a negative return of 38 cents for every dollar invested in the program in Mississippi, versus a positive return of $2.86 for every dollar invested in the program reported in the rigorous, scientific research literature; a negative net present value of benefits minus costs of -$4,283 per program participant in Mississippi versus a net present value of benefits minus costs of $8,867 per program participant reported in the rigorous, scientific research literature). In an effort to address these discrepancies, the Administrative Office of the Courts has hired a Drug Court Compliance Officer to conduct a fidelity audit of each of the state’s drug courts. These audits will determine whether deviations from the program model (e. g., applying the program to low-risk rather than high-risk offenders, resulting in smaller program benefits; keeping offenders in the program longer than necessary, resulting in higher program costs) explain the difference between Mississippi’s drug court benefit-to-cost statistics and those statistics reported in the research literature. If such discrepancies exist, their correction should result in a benefit-to-cost ratio and net present value for the program more in line with the research literature.
3. Transfer funding from the Domestic Violence Perpetrator Treatment Program to a
cost-effective evidence-based program that better serves the same population. Mississippi’s Domestic Violence Perpetrator Treatment programs are yielding a negative benefit-to-cost ratio of -$1.67 and a net present value of benefits minus costs of -$1,416 per participant. The rigorous, scientific research literature on Domestic Violence Perpetrator Treatment Programs (Duluth-based model) also reports a negative return on investment. It is possible that an evidence-based program such as Cognitive Behavioral Treatment with a positive return on investment (benefit-to-cost ratio of $26.47 and net present value of benefits minus costs of $10,777 per program participant) could better address the needs of this population.
See Chapter 5, page 14, for a list of suggested Pew-MacArthur Results First Initiative questions to ask agency staff during appropriations hearings. What are the next steps in implementing the Pew-MacArthur Results First Initiative? The next steps in implementing the Pew-MacArthur Results First Initiative are to refine the cost-benefit analyses for adult criminal justice programs and to expand Mississippi’s use of the Pew-MacArthur Results First model to early childhood education. In the near term, legislative staff plans to refine its cost-benefit analysis for adult criminal justice programs and expand its use of the Results First model to early childhood education, with an initial focus on four-year-old pre-kindergarten. As time and resources permit, legislative staff may also work with agency staff to conduct fidelity audits of evidence-based programs that are underperforming in comparison to expected returns on investment in order to determine whether there are program implementation problems that could be addressed to yield a higher benefit-to-cost ratio and net present value per participant. As the Pew-MacArthur Results First Model matures and new meta-analyses are complete, Mississippi will expand its use of the model to other areas of public policy.

14
Chapter 5: Suggested Appropriation Hearing Questions, by Primary Component of the Performance Budgeting
Revitalization Effort
Statewide Strategic Plan
1. Explain which specific statewide element(s) of the statewide strategic plan your request for funding addresses, with a particular focus on which statewide benchmark(s) your request addresses.
2. Explain how your request for funding will impact the element of the statewide strategic plan identified in the previous question and how you will measure and document the impact of your effort, if funded.
Comprehensive Program Inventory
1. What specific accountability program does your request for funding support?
2. Is the accountability program for which you are seeking funding an intervention program or a non-intervention program? The research basis of intervention programs is addressed in the next set of questions. If the program is a non-intervention program, what best practices support the program? Provide an online link to supporting documentation.
3. When was the last time that the accountability program for which you are
requesting funding was evaluated internally by your agency? Provide a copy of the evaluation.
4. What specific outcome(s) do you expect to achieve with your funding request?
5. What is the expected cost per unit of outcome?
6. What specific performance measure(s) will you collect and report to document
your actual performance in relation to expected outcomes?
7. What output(s) do you expect to produce in order to achieve your expected outcome(s)?
8. What specific performance measure(s) will you collect and report to document
your actual performance in relation to expected outputs? Pew-MacArthur Results First Initiative
1. If the funding is being requested to support an intervention program that has been studied as part of Mississippi’s implementation of the Pew-MacArthur Results First Initiative (i. e., adult criminal justice system intervention programs):

15
a. What is the return on investment (benefit-to-cost ratio and net present value of benefits) for the program as calculated using the Results First model?
i. If the program has a negative return on investment--i. e., the costs
of the program exceed the monetary value of its estimated benefits--where could you redirect funds to achieve a positive return on investment while addressing the same or similar programming needs?
ii. If there are multiple programs that address the same or similar
needs, have you considered directing available funds to the program(s) with the highest return on investment?
2. If the funding is being requested to support an intervention program that has not already been studied as part of Mississippi’s implementation of the Pew-MacArthur Results First Initiative:
a. What is the research basis of the program--i. e., is the program evidence-based, research-based, a promising practice, or other?
b. If the program is evidence-based, research-based, or a promising practice,
provide a link to or copy of the supporting research.
c. What steps will you take to ensure that your agency is implementing the program with fidelity to the evidence- or research-based model? Provide documentation that the programs are being carried out with fidelity to the model by the next budget cycle.
d. If the program is a promising practice, describe the research that will be
conducted to determine whether the practice is effective.
e. Provide benefit-to-cost analysis for the program with supporting documentation at the appropriate time following program implementation.

16

17
Appendix A: Glossary of Performance Budgeting Terms Accountability Program: a set of agency activities designed to achieve a specific
outcome. Accountability programs must be identified at a sufficient level of detail that allows for each program to be identified in the research or best practices literature. Under MISS. CODE ANN. Section 27-103-159 (1972), the state’s accountability programs (i. e., programs included in the comprehensive program inventory) are to be identified by the Legislative Budget Office, PEER Committee staff, and agency staff, beginning with the following four pilot agencies: departments of Corrections, Education, Health, and Transportation.
Action Plan: detailed methods and tasks for implementing state agency strategies.
Action plans are developed and maintained by agencies. Benchmark (statewide): specific performance indicators and targets used to assess
progress at the statewide level in achieving statewide goals Benefit-to-cost Ratio: an indicator that shows the value of a program (through
monetization of its benefits) in relation to the financial resources expended on operating the program. In the Pew-MacArthur Results First Model, the benefit-to-cost ratio shows the dollar value of benefits in relation to every dollar spent on a program.
Best Practice: a method or technique that has consistently shown results superior to
those achieved with other means. Budgetary Program: a grouping of agency activities for the purpose of making state-level
resource allocation decisions pursuant to the Mississippi Performance Budget and Strategic Planning Act of 1994. Following passage of the 1994 act, the Legislative Budget Office, in conjunction with state agency staff, established the budgetary programs for state agencies. Legislators can make changes to a state agency’s budgetary programs during the session. Also, state agencies can request a budgetary program change via formal letter to LBO and DFA.
Comprehensive Program Inventory: a complete list of all agency accountability programs
and the associated expenditure and performance data that will be monitored and reported on an ongoing basis in order to hold the programs accountable for performance
Cost-effective Program: a set of activities with quantified outcomes that exceed the costs
of producing those outcomes Data Dashboard (Statewide): a visual online display of the state’s key performance
indicators (benchmarks), generally limited to one computer screen, that allows for monitoring of the state’s performance on the indicators (benchmarks) at a glance
Data-driven Decision-making: the process of moving an organization toward achieving
desired outcomes by using the information gained through the collection and analysis of pertinent data to inform and improve practice
Economy Measure: indicators that quantify an agency’s cost, unit cost, or productivity
associated with a given outcome

18
Efficiency Measure: indicators that quantify an agency’s cost, unit cost, or productivity
associated with a given output Evidence-based program: a program or practice that has had multiple-site random
controlled trials or quasi-experimental comparison across heterogeneous populations demonstrating that the program or practice is effective for the population
Explanatory Measures: quantitative indicators that provide additional information that
contributes to the understanding of an agency’s operating environment and performance--e. g., data showing a large increase in an agency’s caseload
External/Internal Assessment: an evaluation of key factors that influence the agency and
its performance--e. g., organizational strengths, weaknesses, opportunities, and threats. Examples of external factors include statutory changes and economic conditions. Examples of internal factors include management policies and resource constraints.
Fidelity Audit: a comparison of the implementation of an intervention program to the
key components necessary to achieve the outcomes reported in the research literature
Goal:
- Statewide Goals: general ends toward which the state directs its efforts
- Agency Goals: general ends toward which agencies direct their efforts Input: measure of the resources, both financial and human, committed to a program Intervention Program: a set of activities designed to achieve a specific outcome or
outcomes by positively affecting the educational, economic, social, behavioral, and/or health status of citizens and that may be subjected to experimental review for efficacy
Line-item Budgeting: a system of allocating resources to state budget units by major
object of expenditure--e. g., salaries and fringe benefits, travel, contractual services
Mission:
- Statewide Mission: a concise statement of the basic purpose and role of state government
- Agency Mission: the reason for an agency’s existence Net Present Value of Long-term Benefits minus Costs: the dollar value of program
benefits minus costs over the long-term, expressed in current dollars--i. e., adjusted for changes to the purchase value of a dollar over time
Objective: target for specific action, stated in measurable terms, including a target date
for accomplishment Outcome: performance measure that quantifies the result, effect, or consequence of
providing a government good or service
19
Output: performance measure that quantifies the activities that an agency carries out
and the goods and services that it produces in order to meet its goals and objectives
Performance Budgeting: a method of allocating resources to programs based on
consideration of how efficiently and effectively each program can achieve desired results with the requested resources
Performance-based Management: a systematic approach to performance improvement
through an ongoing process of establishing performance objectives; measuring performance; collecting, analyzing, and reporting performance data; and using that data to drive performance improvement.
Performance-based Contracting: a results-oriented method of procuring services that
specifies in the legally binding agreement for services the outputs, quality, and/or outcomes to be achieved by the service provider. At least a portion of the contractor’s payment, contract extensions, or contract renewals may be tied to the achievement of specific, measurable performance standards and requirements.
Pew-MacArthur Results First Initiative: A project of the Pew Charitable Trusts and the
John D. and Catherine T. MacArthur Foundation that works with states to implement an innovative cost-benefit analysis approach that helps them to invest in policies and programs that are proven to work
Pew-MacArthur Results First Cost-Benefit Analysis Model: an econometric model that
helps states to calculate the benefit-to-cost ratio and net present value of long-term benefits of public sector programs and policies
Pew-MacArthur Results First Approach: a disciplined practice designed to move public
resources to programs and policies proven to work through evidence-based research. The practice consists of the five steps identified in Exhibit 2 on page 10.
Philosophy:
- Statewide Philosophy: a statement of the core values and principles underlying state government service
- Agency Philosophy: the expression of the core values and principles for the conduct of an agency in carrying out its mission
Program Premise: the theory that underpins a government’s decision to intervene with
its authority and resources to contend with a problem that the free market alone could not correct
Promising Practice: a program or practice that presents potential, based upon
preliminary information, for becoming a research-based or evidence-based program or practice
Research-based Program: a program or practice that has some research demonstrating
effectiveness, but that does not yet meet the standard of evidence-based practices
20
Return on Investment: dollar value of program benefits generated by each dollar invested in the operation of the program
Scorecard: a tabular visualization of performance measures and their respective targets
with visual indicators to see how each measure is performing against its target at a glance
Statewide Strategic Plan: a blueprint for the activities of state government created
through the alignment of state agency goals, objectives, outcome measures, strategies, output measures, efficiency measures, explanatory measures, and action plans with the priorities of government (i. e., state government’s vision, mission, philosophy, goals, and benchmarks) identified by leadership. A statewide strategic plan seeks to improve the efficiency and effectiveness of state government by coordinating the efforts of state agency programs and activities toward achieving priority outcomes.
Strategy: method for achieving goals and objectives Vision: an inspiring view of the preferred future Washington State Institute for Public Policy (WSIPP): a public policy research body created
by the Legislature of the State of Washington in 1983 to carry out practical, non-partisan research at the direction of the Legislature or Board of Directors. WSIPP’s Board of Directors includes members representing the Legislature, Governor, and public universities. Since the 1990s, WSIPP has mined the public policy and program research literature to provide Washington budget writers and policymakers with a list of evidence-based programs and policies that can, with a high degree of certainty, lead to better statewide outcomes and a more efficient use of taxpayer dollars.

21
Appendix B

22


![Revitalizing the Brand[1]](https://static.fdocuments.net/doc/165x107/546aa096af79596c298b47b0/revitalizing-the-brand1.jpg)


