A ‘Lean’ Study using the Soft Systems Methodology · A ‘Lean’ Study using the Soft Systems...
13
International Journal of Applied Science and Technology Vol. 1 No. 6; November 2011 68 A ‘Lean’ Study using the Soft Systems Methodology Ifechukwude K. Dibia School of Engineering University of Portsmouth Anglesea Building, Anglesea Road Portsmouth PO1 3DJ, United Kingdom. Hom Nath Dhakal, PhD. School of Engineering University of Portsmouth Anglesea Building, Anglesea Road Portsmouth PO1 3DJ, United Kingdom. Spencer Onuh, PhD., MIET FHEA (UK) CEng The Director/CE office Centre for Satellite Technology Development National Space Research & Development Agency PMB 593, Garki, Abuja, Nigeria. Abstract Lean Production System as a concept emphasizes the elimination of waste in order to ensure optimum utilization of all available resources for the realization of optimum benefit which is doing more with less. This paper looks at the optimization and waste elimination concept of lean from the human perspective using a case study of a biscuit manufacturing company. The Soft Systems Methodology was used for the study and the findings showed that the „Leanness‟ in production can only be guaranteed if the Human resources, the one resource that manages every other resource within the production process is well organised, motivated and adequately managed. Keywords: Lean Production, Waste, Human Resources, Optimisation. Introduction Lean production is an operations management philosophy pioneered by Henry Ford but developed and made popular in the way it is used today by Eiji Toyoda and Taiichi Ohno Toyota‟s chief Engineer. It was and is still being used as the core of Toyota production system. By definition, “Lean production is an integrated management system that emphasizes to a great extent the elimination of waste and the continuous improvement of operations for the optimization of the benefits derived from its immediate use of sca rce resources” (Dibia and Onuh, 2010a). Simply put, Lean is less time, less inventory, less space, less labour and less money or cost for achieving more. This is of course directly in line with the definition of productivity in terms of outputs and inputs but, could be interpreted more widely as doing good with less resources, materials and energy to achieve ultimate sustainability. Lean production focuses on reducing waste in a production system. Waste is anything that adds cost, but adds no extra value to a product. While products may differ, typical, the wastes found in a production environment are quite similar. After years of working to eliminate waste, Toyota, the Japanese automobile manufacturer, identified Overproduction, Waiting, Transportation, Unnecessary Inventory, Inappropriate Processing, Excess Motion and Defects as the seven wastes which adversely affect profitability (Ohno, 1988). Waste must be eliminated to ensure optimisation of all resources for efficiency and profitability. In terms of resources management in production, Taiichi Ohno‟s Lean philosophy has focused more on the material resources with less emphasis on the Human resources, the unpredictable soft system part of production, but there is a growing realisation that there is much more to the human resource aspect to waste and doing more with less in terms of optimisation in lean production philosophy than was originally thought.
Transcript of A ‘Lean’ Study using the Soft Systems Methodology · A ‘Lean’ Study using the Soft Systems...

International Journal of Applied Science and Technology Vol. 1 No. 6; November 2011
68
A ‘Lean’ Study using the Soft Systems Methodology
Ifechukwude K. Dibia
School of Engineering
University of Portsmouth
Anglesea Building, Anglesea Road
Portsmouth PO1 3DJ, United Kingdom.
Hom Nath Dhakal, PhD.
School of Engineering
University of Portsmouth
Anglesea Building, Anglesea Road
Portsmouth PO1 3DJ, United Kingdom.
Spencer Onuh, PhD., MIET FHEA (UK) CEng
The Director/CE office
Centre for Satellite Technology Development
National Space Research & Development Agency
PMB 593, Garki, Abuja, Nigeria.
Abstract
Lean Production System as a concept emphasizes the elimination of waste in order to ensure optimum utilization
of all available resources for the realization of optimum benefit which is doing more with less. This paper looks at
the optimization and waste elimination concept of lean from the human perspective using a case study of a biscuit manufacturing company. The Soft Systems Methodology was used for the study and the findings showed that the
„Leanness‟ in production can only be guaranteed if the Human resources, the one resource that manages every
other resource within the production process is well organised, motivated and adequately managed.
Keywords: Lean Production, Waste, Human Resources, Optimisation.
Introduction
Lean production is an operations management philosophy pioneered by Henry Ford but developed and made
popular in the way it is used today by Eiji Toyoda and Taiichi Ohno Toyota‟s chief Engineer. It was and is still being used as the core of Toyota production system. By definition, “Lean production is an integrated management
system that emphasizes to a great extent the elimination of waste and the continuous improvement of operations
for the optimization of the benefits derived from its immediate use of scarce resources” (Dibia and Onuh, 2010a).
Simply put, Lean is less time, less inventory, less space, less labour and less money or cost for achieving more. This is of course directly in line with the definition of productivity in terms of outputs and inputs but, could be
interpreted more widely as doing good with less resources, materials and energy to achieve ultimate sustainability.
Lean production focuses on reducing waste in a production system. Waste is anything that adds cost, but adds no extra value to a product. While products may differ, typical, the wastes found in a production environment are
quite similar. After years of working to eliminate waste, Toyota, the Japanese automobile manufacturer, identified
Overproduction, Waiting, Transportation, Unnecessary Inventory, Inappropriate Processing, Excess Motion and
Defects as the seven wastes which adversely affect profitability (Ohno, 1988).
Waste must be eliminated to ensure optimisation of all resources for efficiency and profitability. In terms of resources management in production, Taiichi Ohno‟s Lean philosophy has focused more on the material resources
with less emphasis on the Human resources, the unpredictable soft system part of production, but there is a
growing realisation that there is much more to the human resource aspect to waste and doing more with less in terms of optimisation in lean production philosophy than was originally thought.
© Centre for Promoting Ideas, USA www.ijastnet.com
69
Lean and the Human Resource
In 1996, Womack and Jones in their classical „Lean Thinking: Banish Waste and Create Wealth‟, identified an
eighth waste, the waste of the underutilized employees with respect to their ideas and mind. In 1995, Forrester in
her article „Implications of lean manufacturing for human resource strategy‟ looked at the opportunit ies provided
by Lean Production System for potential synergy between the lean processes and the organization‟s people policies. It examined the implications of lean production philosophy on the human resource strategy and policies
within processes and highlighted the major areas of transition. Transition areas identified include scheduling so
that the labour requirement is evened out, organizational style and structure, role and selection in job style and flexibility, training and finally problem solving and innovation which is the expected utilization of employees‟
ideas and minds as stated by Womack and Jones (1996). Alony and Jones (2008) emphasised that the adoption of
Lean manufacturing requires a major change in mindset. From production of large quantities, the organisation
must shift to small batches. Rather than having large safety inventories which act buffer on demand, organisations must retain low levels of „in-process‟ material. Processes must be efficient and reliable to avoid defects.
Movements of people, parts and materials must be minimised. These actions thus assist in eliminating the waiting
time of material, people, and equipment.
Adoption of Lean Production system from an organisational perspective involves many changes. This changes
include structural changes since work need to be organised around product families instead of functional areas. The workforce has to shift from functional divisions into „cells‟. Each cell though in parts, is responsible for the
entire manufacturing of a product in a systems based philosophy which lean is. Thus, it requires a workforce that
has the skill to do more than one specialised task. It requires a Multi-skilled workforce. Moreover, this Multi-
skilled workforce would have to work in cells as a team. The team should be ideally self-directed. The workers need to focus towards achieving goals, meeting targets and continuously improving the process, constantly
striving for perfection.
Alony and Jones (2008) explained that these changes can be difficult to implement. Shifting into work teams
means organisational restricting, which often invokes fear and resistance. Shifting into multi-skilled can also
create resistance in the work place from the workers. Although most advocates of Lean Production system claim
these changes result in an enriched and engaging working environment, studies show the process can be challenging to organisations (Boyer, 1996; Boyer et al., 1997; Nakamura et al., 1998; Power and Sohal, 1997).
The case of DIB Ltd shows the human side that needs to be ultimately looked into during the implementation of
Lean to ensure customer satisfaction, stakeholders‟ profitability and the sustenance of the Lean philosophy. The Case Study
DIB Ltd is a Biscuit manufacturing company. The factory occupies an area of 100m2
which includes the
production plant area and the general administrative block. DIB manufactures branded processed biscuits in two major forms, Soft Biscuits and Hard Biscuits. The Company operates its own distribution centre to facilitate the
shipment of its products directly to retailers although sometimes it sells in larger bulk quantity to whole sellers.
DIB has four major suppliers for its raw materials used for its production.The Company has a total of seventy staff of which fifty five of them are in the production department which has two daily shifts of eight hours each
making up to a total of sixteen hours daily for production. The Soft Biscuit Machine design capacity is
8,000kgs/16hrs while the Hard Biscuit Machine design capacity is 6,400kgs/16hrs.
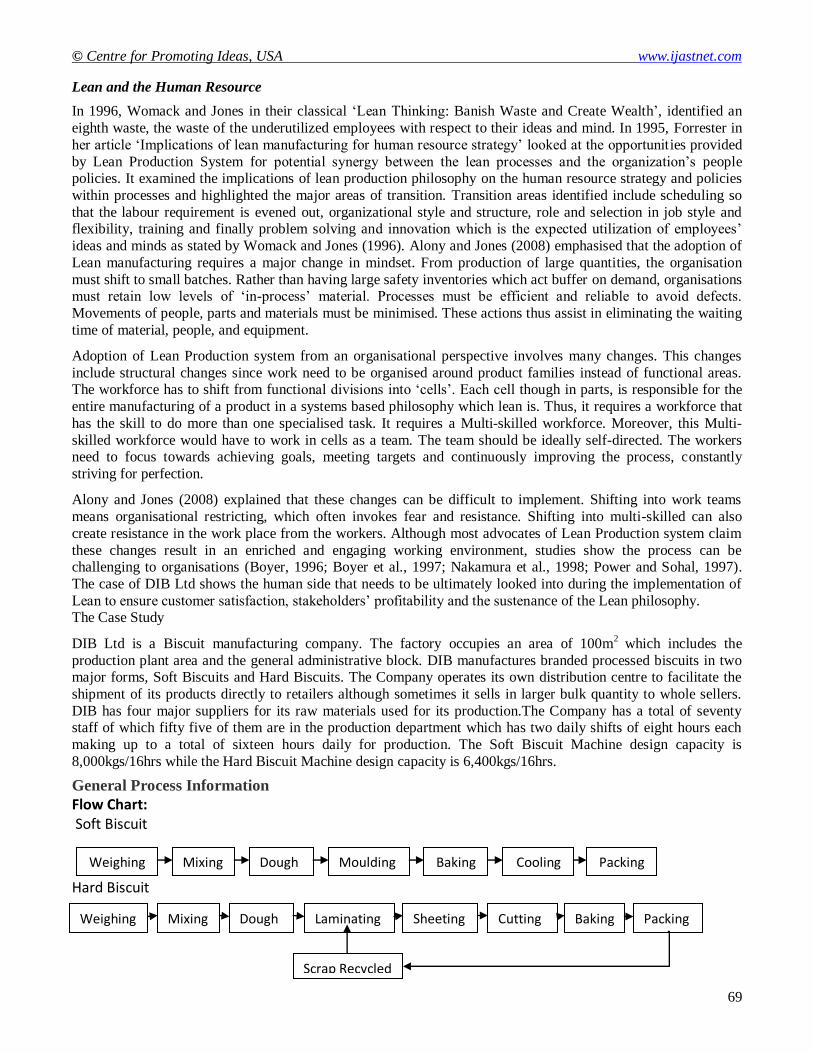
General Process Information
Flow Chart: Soft Biscuit
Hard Biscuit
Weighing Mixing Dough
Weighing
Moulding
Baking Cooling Packing
Weighing Mixing Dough Laminating Sheeting Baking Cutting Packing
Scrap Recycled

International Journal of Applied Science and Technology Vol. 1 No. 6; November 2011
70
Process Description
Each and every ingredient is weighed in accordance with the mixing standard, prior to mixing. However, the
quantity of sugar to be used may be varied. The sugar should be liquefied prior to mixing with the other
ingredients in the mixer. The flour is sifted and the water put through the water chiller. All materials are then placed in the mixing bowl of the universal mixer for mixing.
The dough will then be placed in the dough tab box.
(A) When making soft biscuits, the dough is put into the rotary machine and moulded into round shaped biscuits.
(B) When making hard biscuits, the dough is put into the laminator to be stretched and folded in the form of a
belt. It is then sent through the cutting machine to be cut into rectangular shaped biscuits.
This formed and shaped dough is then sent through the band oven for baking.
The baked biscuits then go down the cooling conveyor.
The cooled biscuits are automatically sent down the working conveyor and packed by the operators manually. The
packages of biscuits are sealed by the heat sealer and the process is thus completed.
Table 1: Manpower Distribution for the Production Process:
Process Person
Weighing of ingredients (including sugar liquefaction and flour sifting) 2
Mixing (universal mixer) (including water measurement and the handing of dough tab box)
2
Moulding (rotary machine) or laminating and sheeting (laminator) and cutting
(cutter) 2
Baking (oven) 2
Cooling (cooling conveyor) 2
Packing (work conveyor) 12
Sealing (heat sealer) 3
Total 25
It takes fifteen minutes for two supervisors to set up the production line which must start production by 8.00am every morning and shot down by 24.00pm every day. Weighing for the first batch takes 15minutes, Mixing
10minutes, Moulding 15minutes, Baking 35minutes, Cooling 10minutes, Packing 25minutes and Sealing
10minutes. After this it becomes a continuous process until the system is shot down. Each pack of biscuit produced weigh 125g and at full capacity, 64,000 packs of Soft Biscuit and 51,200 packs of Hard Biscuit is
produced in a day but due to the fluctuation of demand, only 80% of the production capacity is utilised.
It is a standard production practice in the factory that for every 10,000 packs of Biscuit produced, a sample size of
100 packs of Biscuit is randomly tested for possible defects with records of test results kept for traceability.
The business year of the company ends on the 30th
of June at the end of which all staff are appraised and promotions made from the appraisal by the end of July every year. New staffs are also employed by the first week
of August to fill in areas where the management team perceive some short coming or areas that need
improvement.
It has been observed in the past four years that although sales is generally at its highest in December, production
tend to improve in the last quarter (April, May and June) of its business year. The rate of defective products
reduces while the rate of absenteeism and lateness also reduces. The waiting time at each area or section of the production process also reduces drastically during this time. One major development which has also been
observed is the overproduction that occurs within this period. The total production during this period tends to
always be more than the expected demand. During this period, excessive movement within the production area is also noticed constantly. There is also an increase in the inventory level at the store for both raw materials and
finished goods which do sometimes get into some other spaces meant for other sections and department of the
company.

© Centre for Promoting Ideas, USA www.ijastnet.com
71
The management is currently thinking of expanding and increasing the store area while also carefully looking at
and studying all other production and administrative issues in the production department to ensure the optimum
use of both the human and material resources while ensuring that all sort of waste is eliminated. There are also
regular training and development programmes which are also regularly planned and executed to meet the need of the organisation.
Below are the monthly administrative and production records for the past four years.
Table 2: Total Days of Production for each month from 2005 – 2008
2005 2006 2007 2008
January 21days 22days 22days 22days
February 20days 20days 20days 21days
March 22days 23days 22days 20days
April 21days 19days 20days 22days
May 20days 21days 21days 20days
June 22days 22days 21days 21days
July 21days 21days 22days 22days
August 22days 22days 22days 20days
September 22days 21days 20days 22days
October 21days 22days 23days 23days
November 22days 22days 22days 20days
December 21days 19days 19days 20days
Table 3: Total Available Man-hours for Production for each month from 2005 – 2008
2005 2006 2007 2008
January 9240 9680 9680 9680
February 8800 8800 8800 9240
March 9680 10120 9680 8800
April 9240 8360 8800 9680
May 8800 9240 9240 8800
June 9680 9680 9240 9240
July 9240 9240 9680 9680
August 9680 9680 9680 8800
September 9680 9240 8800 9680
October 9240 9680 10120 10120
November 9680 9680 9680 8800
December 9240 8360 8360 8800
Table 4: Total Number of Staff Absent at the production department for each month from 2005 – 2008
2005 2006 2007 2008
January 3 5 4 2
February 1 2 1 1
March 2 1 4 5
April - 1 1 1
May 1 - 1 -
June - 1 - -
July 2 - 1 2
August 3 4 3 5
September 8 7 7 6
October 6 9 4 5
November 4 5 6 5
December 6 4 5 6
International Journal of Applied Science and Technology Vol. 1 No. 6; November 2011
72
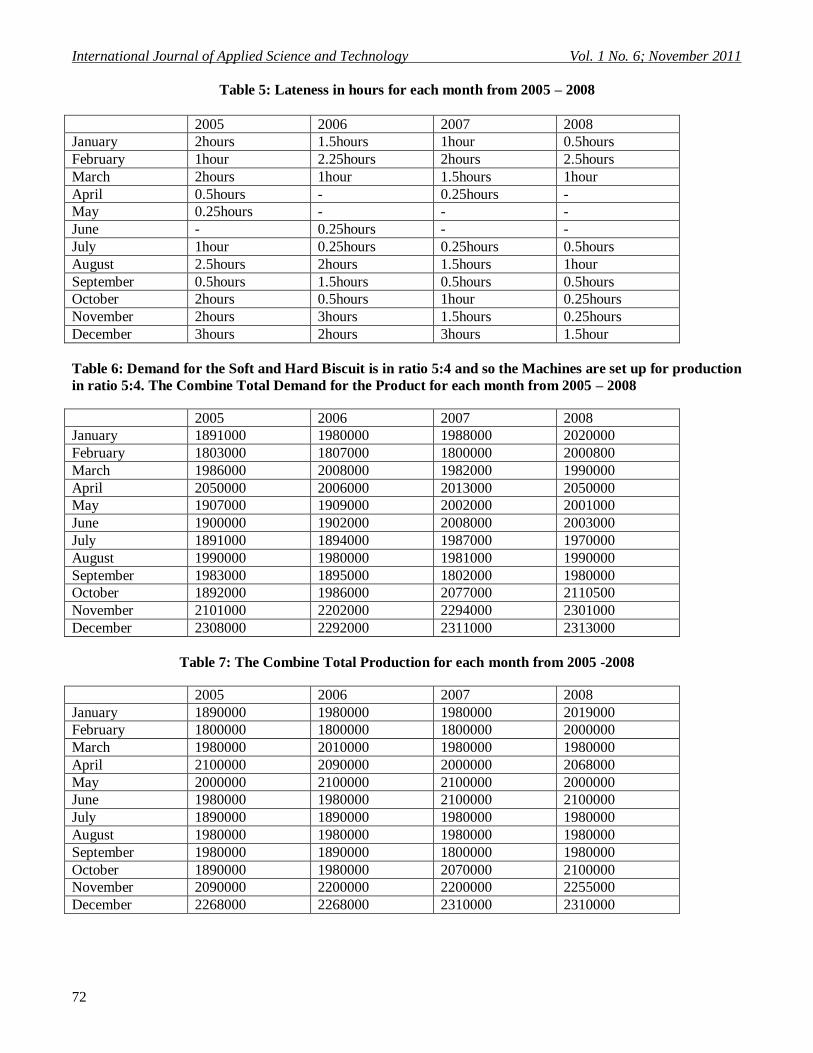
Table 5: Lateness in hours for each month from 2005 – 2008
2005 2006 2007 2008
January 2hours 1.5hours 1hour 0.5hours
February 1hour 2.25hours 2hours 2.5hours
March 2hours 1hour 1.5hours 1hour
April 0.5hours - 0.25hours -
May 0.25hours - - -
June - 0.25hours - -
July 1hour 0.25hours 0.25hours 0.5hours
August 2.5hours 2hours 1.5hours 1hour
September 0.5hours 1.5hours 0.5hours 0.5hours
October 2hours 0.5hours 1hour 0.25hours
November 2hours 3hours 1.5hours 0.25hours
December 3hours 2hours 3hours 1.5hour
Table 6: Demand for the Soft and Hard Biscuit is in ratio 5:4 and so the Machines are set up for production
in ratio 5:4. The Combine Total Demand for the Product for each month from 2005 – 2008
2005 2006 2007 2008
January 1891000 1980000 1988000 2020000
February 1803000 1807000 1800000 2000800
March 1986000 2008000 1982000 1990000
April 2050000 2006000 2013000 2050000
May 1907000 1909000 2002000 2001000
June 1900000 1902000 2008000 2003000
July 1891000 1894000 1987000 1970000
August 1990000 1980000 1981000 1990000
September 1983000 1895000 1802000 1980000
October 1892000 1986000 2077000 2110500
November 2101000 2202000 2294000 2301000
December 2308000 2292000 2311000 2313000
Table 7: The Combine Total Production for each month from 2005 -2008
2005 2006 2007 2008
January 1890000 1980000 1980000 2019000
February 1800000 1800000 1800000 2000000
March 1980000 2010000 1980000 1980000
April 2100000 2090000 2000000 2068000
May 2000000 2100000 2100000 2000000
June 1980000 1980000 2100000 2100000
July 1890000 1890000 1980000 1980000
August 1980000 1980000 1980000 1980000
September 1980000 1890000 1800000 1980000
October 1890000 1980000 2070000 2100000
November 2090000 2200000 2200000 2255000
December 2268000 2268000 2310000 2310000
© Centre for Promoting Ideas, USA www.ijastnet.com
73
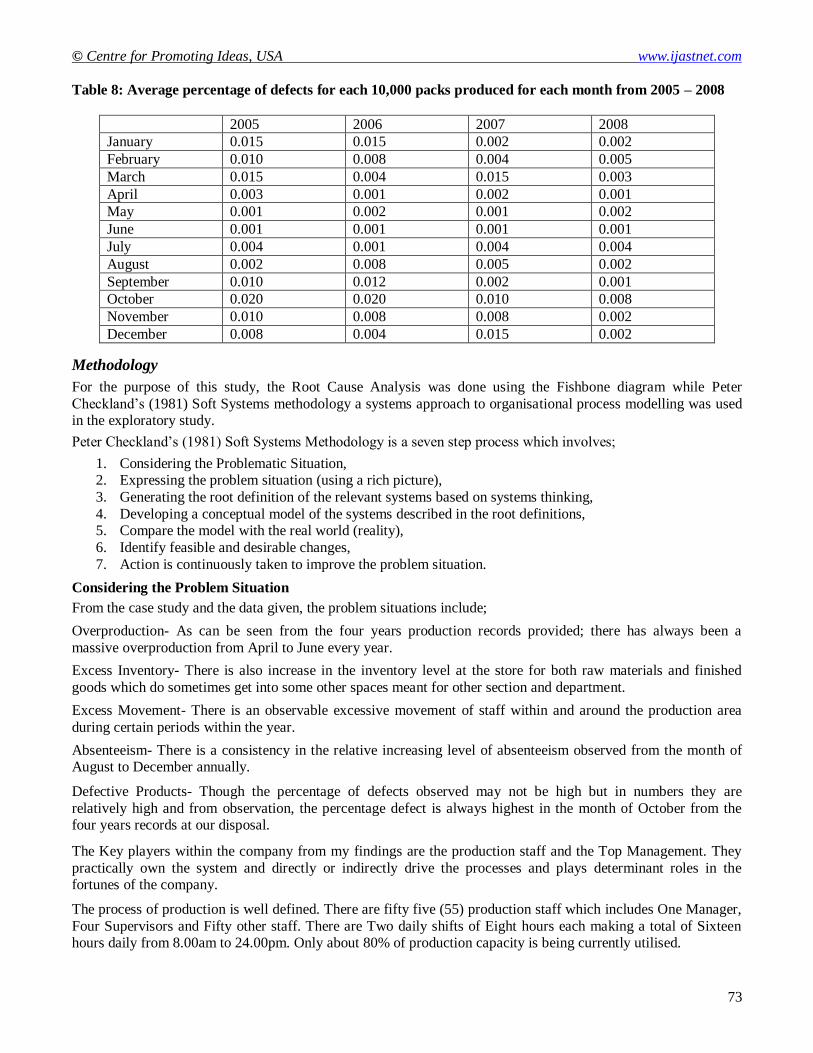
Table 8: Average percentage of defects for each 10,000 packs produced for each month from 2005 – 2008
2005 2006 2007 2008
January 0.015 0.015 0.002 0.002
February 0.010 0.008 0.004 0.005
March 0.015 0.004 0.015 0.003
April 0.003 0.001 0.002 0.001
May 0.001 0.002 0.001 0.002
June 0.001 0.001 0.001 0.001
July 0.004 0.001 0.004 0.004
August 0.002 0.008 0.005 0.002
September 0.010 0.012 0.002 0.001
October 0.020 0.020 0.010 0.008
November 0.010 0.008 0.008 0.002
December 0.008 0.004 0.015 0.002
Methodology
For the purpose of this study, the Root Cause Analysis was done using the Fishbone diagram while Peter
Checkland‟s (1981) Soft Systems methodology a systems approach to organisational process modelling was used in the exploratory study.
Peter Checkland‟s (1981) Soft Systems Methodology is a seven step process which involves;
1. Considering the Problematic Situation, 2. Expressing the problem situation (using a rich picture),
3. Generating the root definition of the relevant systems based on systems thinking,
4. Developing a conceptual model of the systems described in the root definitions, 5. Compare the model with the real world (reality),
6. Identify feasible and desirable changes,
7. Action is continuously taken to improve the problem situation.
Considering the Problem Situation
From the case study and the data given, the problem situations include;
Overproduction- As can be seen from the four years production records provided; there has always been a
massive overproduction from April to June every year.
Excess Inventory- There is also increase in the inventory level at the store for both raw materials and finished
goods which do sometimes get into some other spaces meant for other section and department.
Excess Movement- There is an observable excessive movement of staff within and around the production area
during certain periods within the year.
Absenteeism- There is a consistency in the relative increasing level of absenteeism observed from the month of August to December annually.
Defective Products- Though the percentage of defects observed may not be high but in numbers they are
relatively high and from observation, the percentage defect is always highest in the month of October from the four years records at our disposal.
The Key players within the company from my findings are the production staff and the Top Management. They
practically own the system and directly or indirectly drive the processes and plays determinant roles in the fortunes of the company.
The process of production is well defined. There are fifty five (55) production staff which includes One Manager,
Four Supervisors and Fifty other staff. There are Two daily shifts of Eight hours each making a total of Sixteen hours daily from 8.00am to 24.00pm. Only about 80% of production capacity is being currently utilised.

International Journal of Applied Science and Technology Vol. 1 No. 6; November 2011
74
Root Cause Analysis
Root Cause Analysis is a class of problem solving method aimed at identifying the root cause of the problems or
events. The practise of Root Cause Analysis is predicated on the belief that problems are best solved by attempting to correct or eliminate root causes, as opposed to merely addressing the immediately obvious systems.
By directing corrective measures at root causes, it is hoped that the likelihood of problem recurrence will be
minimized since a complete prevention of recurrence by a single intervention is not always possible. Thus Root Cause Analysis is often considered to be an iterative process, and is frequently viewed as a tool of continuous
improvement.
Root Cause Analysis is not a single, sharply defined methodology; there are different techniques, tools, processes
and philosophies of Root Cause Analysis in existence. For this study, the Root Cause Analysis will be carried out
using one of the most novel techniques the cause and effect diagram known as the “Fishbone” diagram (see figure 1).
WASTE
Excess Movement
Defects
Overproduction
Excess Inventory
Waiting
Transportation
Inappropriate Processing
Poor Organisation No Proper Planning
No Control
Unnecessary Inventory
Wrong Supervision Method
Poor Staff Attitude
Low Staff Moral
Poor Information Flow
Figure 1: Fishbone Diagram

© Centre for Promoting Ideas, USA www.ijastnet.com
75
Expressing the problem situation: Current State Soft Systems Rich Picture
Figure 2: The Current State Soft Systems Rich Picture
Selecting how to View the Situation and Producing Root Definition
In considering the different perspective (see figure 2) from which the situation can be viewed we have the following;
Staffs believe they have to do more at the end of the business year to be promoted.
Staffs have to be seen to be putting more effort to be well appraised at the end of the business year.
There is individual push without control for success at the end of the business year.
Morales are down after appraisal and most staffs are not motivated to put in their best.
There is poor information flow.
Wrong supervisory method currently being used.
No proper checks which in the long run ends up to being counterproductive.
Poor Organisational Structure.
We always run out of store space from April – June
because of over production, but there is always the
big challenge to meet the demand for our product
in November and December. What should we do? Staff are absent or late, too
many defective products
and too much resource
waste. We must stop this
from happening from July
to March (first 9 months of
our business year).
Punctuality, attendance and
general performance always
improve at this period but our
assessment/appraisal is based on
annual performance. What must be
done to change this perception
among staff?
We must be seen working very
hard because we would be
appraised very soon. We must
perform beyond expectation.
I have to stop this yearly over production that
occurs between April and June every year. I also
have to eliminate waste of resources.
I must keep them working at a
constant and consistent rate,
pace at the same level of
commitment as much as possible
Management Team
Human Resource Manager
Production Workers
Production Manager
Production Supervisor We can be late or absent at any other time but not in
April, May or June because it is assessment time.
“The Appraisal” “Judgment” quarter. Time for
promotion.
International Journal of Applied Science and Technology Vol. 1 No. 6; November 2011
76
All these are perfectly valid purposeful perspective, but the basis of Soft System Methodology is the intension to
address all perspectives in a complex whole. Clarity is gained by addressing key perspective separately,
understanding their implications and then using those understanding when seeking to reintegrate these
perspectives into a set of evaluative conclusions and suggestions for future action.
What need to be done next is to select a particular perspective and put it through a very structured and rigorous
model development process developed by Peter Checkland using the mnemonic CATWOE. The particular perspective selected is “There is individual push without control for success at the end of the business year.” This
particular perspective selected will be put through Checkland‟s (1981) model development process using
CATWOE.
C – Customer
A – Actors
T – Transformation
W – Weltanschauung (i.e this transformation is relevant because.....)
O – Owners
E – Environment
The starting point is a Transformation (T). From this particular perspective to know what is actually transformed
from what to what; from input to output.
Transformation: “Individual push without control for success at the end of the business year” will be
replaced by “Collective push for success with adequate supervision to reduce waste and achieve organisational goal”.
Weltanschauug: This transformation is relevant because it will create a sense of belonging and team
spirit which will lead to organisational success.
Customer: In this case the beneficiaries of this transformation are the Production staff and the
Organisation at large.
Actors: The Facilitators of this transformation are the Top Management, The Production Manager and
the Production Team.
Owners: The Organisation.
Environment: Production Sector.
Root Definition
Therefore, a “Root Definition” for the desired transformation will be “A Company owned system of performance
appraisal that will encourage collective push for success with adequate supervision, well organised assessment
and good control mechanism to achieve organisational goal and reduce all forms of waste”.
Developing a Conceptual Model
Activities necessary to carry out this transformation as stated in the root definition to have an all encompassing
and adequate model include;
Determine policy change needed.
Assign teams to shift for collective responsibility.
Define Criteria for assessment.
Decide on feasible measures of assessment.
Identify and evaluate possible measures for job enrichment and job enlargement.
Ensure adequate training and development within the system.
Develop good production control mechanism.
Establish adequate supervision and monitoring within the organisation.
Develop a good reward system.
Applying the process recommended by Peter Checkland, a “Conceptual Model” of the transformation using the root definition is shown in figure 3.

© Centre for Promoting Ideas, USA www.ijastnet.com
77
Figure 3: Conceptual Model
Comparing the Model with the reality
Looking at the conceptual model, it could be seen that „the policy change‟ needed can be made if the management is determined to meet the new „definition of company expectation‟. Workers‟ education about the need for this
change and the benefit of the change is feasible. If awareness on the benefits of the change and its impact on the
company‟s performance and bottom-line profitability are made known to the staff, there would be a sense of responsibility as all would be carried along. The conceptual model is feasible in the „real world‟.
Feasible and desirable changes; Actions for Continuous improvement
The policy change needed should be determined and implemented by the management. Awareness of these
changes and its benefits should be made known to all the staff. They must be carried along to ensure all round success for the company, its customers and all other stake holders. Roles and responsibilities should be clearly
assigned with criteria for assessment and feasible measure for assessment defined while teams should be created
to create a sense of belonging to the whole. Within these teams adequate training should be carried out to meet the
needs of the organization. Possible areas for job enrichment and job enlargement should be identified while people‟s opinions on the workings of the system should be accommodated so that a standard workable and
generally acceptable reward system can be developed.
Develope and test a standard reward system
Accommodatepeoples opinion in
system development
Assign Supervisory roles and
responsibilities
Determine policy change
needed
Ensure adequate training and
development within the system
Define criteria for assessment
Decide on feasible measure
of assesment
Define company expectations and criteria for efficiency and reduction of all waste within the system
Create teams
Identify and evaluate possible measures for Job enrichment and
Job enlargement
Use effect and general response to
determine improvementMonitor and
take controlaction
Educatepeople
Take corrective
action
International Journal of Applied Science and Technology Vol. 1 No. 6; November 2011
78
A feedback mechanism which uses the observations in terms of effect of the policy change and general responses
will be use to determine areas for improvement and possible „policy change‟. The circle goes over and over again
because of the need for continuous improvement.
Discussions
In most organisations where the Lean Production System is practised and also in over eighty percent (80%) of
articles and write-ups on Lean Production System and the seven waste, emphasis is always on „Lean‟ or better put
„Less‟. Less of everything, in terms of having half the manufacturing space, half the investment in tools, half the inventory, half the engineering hours, half the effort and half or even less than half „the time‟. Everybody talks
about achieving „less of everything‟ by eliminating waste due to Over production, Over processing of parts, Long
wait for the next processing step, Unnecessary transportation, Keeping inventory more than necessary, Unnecessary movement and Waste due to Defective parts from production.
Although most research (Callen et al., 2000; Cua et al., 2001; Eroglu and Hofer, 2011; Fullerton and McWatters,
2001; Fullerton et al., 2003; Inman and Mehra, 1992; Jayaram et al., 2008; Martinez and Perez, 2001; Norris et al., 1994; Shah and Ward, 2003; Shah and Ward, 2007; Womack et al., 1990; White, 1993) which are empirical
and functionalist based has considered machines and other constraints as the determinant of leanness, true
„leanness‟ is mainly achieved by a working system based on the ingenuity of the Human resources although less
appreciated by most practitioners. Achieving true leanness is mainly due to the effective and efficient coordination and time management of the Human Resource (the labour force). These are the workers in the
organisation, the Human Resources whose technical know-how, work environment, job satisfaction, strength,
ability, attitude, motivation, mood, joy, happiness, sadness and general well being or not is the key determining factor in ensuring true „Leanness‟.
In the bestselling book on Lean Production System by Womack et al (1990) „The Machine That Changed the
World‟ which is based on the Massachusetts Institute of Technology five million dollar, five year, fourteen
country International Motor Vehicle Program‟s study of the Worldwide auto industry, Lean Production System was seen as a complete system that „welds‟ all activities to ensure the optimum use of all resource at a high speed,
in the shortest of time resulting in the highest and best of output and also the best of returns on investment in
terms of profit. „Man‟ (The Human Resources) was seen as just another factor of production without full consideration that „the man‟ is actually the determining and deciding factor. „The Man‟ (Human Resources)
causes waste and so he is the Ultimate waste if there is waste. „The Man‟, ensures there is no over production, no
over processing of parts, no long wait for the next processing step, no unnecessary transportation, no unnecessary
inventory, no unnecessary movement and no defective parts from production. „The Man‟ is the determining factor, the major factor and so „The Man‟ is the Ultimate face of Lean Production System. Without full
consideration of this „Human face‟ (The Human Resources), Lean Production System if started, cannot be
sustained.
Conclusion
Lean production system implementation requires a lot of effort in ensuring that waste in the production system is reduced and possibly eliminated for optimum benefit. Although in real Lean production practise and as can be
seen from even most writers and analyst on the Lean production System, there is the tendency to forget that in
implementing the Lean production system, the Human Resources „the face‟ behind Lean as a „production system‟
must be fully considered as the eighth possible source of waste and as the ultimate deciding factor in ensuring the „Leanness‟ in a production system.
If the Human Resource is not there to manage and control the system effectively and efficiently, surely nothing will work since the presence of the Human Resource in the Lean production system is what galvanises the system
to work to its optimum level.
As can be seen from the case study, if everything in terms of machines, production process, production layout and
factory layout seems perfect in a manufacturing organisation, it still does not guarantee „Leanness‟ in production or optimisation in production except the Human resource, the one resource that manages every other resources
within the production process is well organised, informed, trained, motivated, managed (Sanchez and Perez, 2001;
Dibia and Onuh, 2010b) and adequately controlled. Also, workers need to work together as a unit, a team to have a sense of belonging to the „whole‟.
© Centre for Promoting Ideas, USA www.ijastnet.com
79
A sense of belonging creates a wonderful atmosphere for achieving anything, and achieving „Leanness‟ is no
exception and so team work is an integral part and a vital tool in achieving „Leanness‟ and optimisation in production.
Finally, it is not all about using the Lean production system to eliminate waste and get the production system to its
optimum level for the benefit of all; it is also about sustaining the systems near perfect performance. The most
difficult part of the Lean production system is its sustainability and this depends ultimately on the Human Resources and not the machines nor the finance in the production system. If the System must be sustained then
the Human Resources must be taken into full consideration at all time.
Taking the human resource factors into consideration at all time in Lean production practice will ensure the reduction and possible elimination of waste in all its forms to achieve optimisation in production and optimum
benefit for all stakeholders. To achieve this, the following is recommended;
Proper organisation and administration
Constant education and reawakening of the awareness for Lean
Effective communication mechanism both vertical and horizontal
Constant and efficient information flow especially within the value stream both internally and externally
Effective human resource management
Internal values culturization
Cooperate team building
Training and constant retraining of staff to meet daily expectation
Real motivation that gives the desired effect
Further Work
Further work could be done to look into the role of the human resources in the extended value stream of production in the Lean production system. The impact of Lean activities on performance could also be looked
into.
Another area that could be looked into is how to measure the alignment of the organizational culture with Lean
principles since as with any other change initiative, Lean implementations differ greatly from one company to the next. Some of the problems and discrepancies can be attributed to differences in market segment, production
processes and competitive and regulatory environment. However, it seems reasonable to suspect that changes as
big as a Lean implementation are greatly influenced by the culture of the company, its values and traditions.
It would be of great value to investigate which aspects of organisational culture are more important than others for a Lean implementation and how to measure them to develop a change management plan based on culture.
Also, considerable effort should be made to research on possible methods that can be used effectively to establish
harmonious work teams in organisations adopting lean production system. The effect and influence of Labour Unionization status on the adoption of lean production system practices in a company or organisation can also be
look into in terms of further research.
Finally a more system based research methodology for the study of lean, its implementation and a benefit which
combines the advantages of the functionalist and interpretive paradigms (Burrell and Morgan, 1979) should be looked into.

International Journal of Applied Science and Technology Vol. 1 No. 6; November 2011
80
References 1. Alony, I. and Jones, M. (2008). Lean supply chains, JIT and Cellular manufacturing – The Human Side. Journal of
Issues in Informing Science and Information Technology, Vol. 5, Page 165-175.
2. Boyer, K.K. (1996). An Assessment of Managerial Commitment to Lean Production. International Journal of
Operation & Production Management, Vol. 16, Issue 9, Page 48-59.
3. Boyer, K.K., Leong, G.K., Ward, P.T., & Krajewski, L.J. (1997). Unlocking the potential of advanced
manufacturing technologies. Journal of Operations Management, 15(4), 331-347.
4. Burrell, G. and Morgan, G. (1979). Sociological Paradigms and Organizational Analysis. Heinemann Education,
London.
5. Callen, J.L., Fader, C. and Krinsky, I. (2000). Just-in-time: a cross-sectional plant analysis. International Journal of
Production Economics Vol. 63, No. 3, Page 277-301.
6. Checkland, P.B. (1981). Systems Thinking, Systems Practice, John Wiley, Chichester.
7. Cua, K.O., McKone, K.E. and Schroeder, R.G. (2001). Relationships between implementation of TQM, JIT and
TPM and manufacturing performance. Journal of Operations Management, Vol. 19, No. 6, Page 675-694.
8. Dibia, I.K. and Onuh, S. (2010a). Lean culturerization: a long term philosophy for full optimization of the human
resource. Proceedings of the World Congress on Engineering and Computer Science (WCECS), USA, Page 1087-
1091.
9. Dibia, I.K. and Onuh, S. (2010b). Lean Revolution and Human Resource Aspects. Proceedings of the World
Congress on Engineering (WCE), London, Vol. 3, Page 2347-2350.
10. Eroglu, C. and Hofer, C. (2011). Lean, leaner, too lean? The inventory performance link revisited. Journal of
Operations Management, Vol. 29, Page 356-369.
11. Forrester, R. (1995). Implication of lean manufacturing for human resource strategy. Work Study, Vol. 44, Issue: 3,
Page 20-24.
12. Fullerton, R.R. and McWatters, C.S. (2001). The production performance benefits from JIT implementation.
Journal of Operations Management Vol. 19, Page 81-96.
13. Fullerton, R.R., McWatters, C.S. and Fawson, C. (2003). An examination of the relationships between JIT and
financial performance. Journal of Operations Management, Vol. 21, No. 4, Page 383-404.
14. Inman, R.A. and Mehra, S. (1992). Financial justification of JIT implementation. International Journal of
Operations & Production Management, Vol. 13, No. 4, Page 32-39.
15. Jayaram, J., Vickery, S. and Droge, C. (2008). Relationship building, lean strategy and firm performance: an
exploratory study in the automotive supplier industry. International Journal of Production Research Vol. 46, No.
20, Page 5633-5649.
16. Nakamura, M., Sakakibara, S. and Schroeder, R. (1998). Adoption of Just-in-Time Manufacturing Methods at U.S.
and Japanese Owned Plants: Some Empirical Evidence. IEEE Transactions on Engineering Management, Vol. 45,
No. 3, Page 230-240.
17. Norris, D.M., Swanson, R.D. and Chu, Y. (1994). Just-in-time production systems: a survey of managers.
Production and Inventory Management Journal, Vol. 35, No. 2, Page 63-66.
18. Ohno, T. (1988). Toyota Production System: Beyond Large-Scale Productivity. Production Press, Cambridge, MA.
19. Power, D.J. and Sohal, A.S. (1997). An examination of the literature relating to issues affecting the human variable
in just-in-time environments. Technovation Vol.17 (11/12), Page 649-666.
20. Sanchez, A.M. and Perez, M.P. (2001). Lean indicators and manufacturing strategies. International Journal of
Operations & Production Management, Vol. 21, Issue 11, Page 1433-1452. 21. Shah, R. and Ward, P.T. (2003). Lean manufacturing: Context, practice bundles, and performance. Journal of
Operations Management, 21(2), 129-149.
22. Shah, R. and Ward, P.T. (2007). Defining and developing measures of lean production. Journal of Operations
Management, Vol. 25, Pages 785-805. 23. White, R.E. (1993). An empirical assessment of JIT in US manufacturers. Production and Inventory Management
Journal, Vol. 34, No. 1, Page 38-42. 24. Womack, J., Jones, D. (2003). Lean Thinking, Banish Waste and Create Wealth in your Corporation, Revised, Free
Press, pp 351-352
25. Womack, J., Jones, D. (1996). Lean Thinking, Banish Waste and Create Wealth in your Corporation. New York:
Simon & Schuster.
26. Womack, J., Jones, D., Roos, D. (1990). The Machine that Changed the World, Rowson Associates, New York,
USA