A leading power and heat company in the Nordic area
41
A leading power and heat company in the Nordic area Investor meetings May 2005 London
Transcript of A leading power and heat company in the Nordic area

A leading power and heat companyin the Nordic area
Investor meetings
May 2005London

11 May 2005 2
Disclaimer
This presentation does not constitute an invitation to underwrite, subscribe for, or otherwise acquire or dispose of any Fortum shares.
Past performance is no guide to future performance and persons needing advice should consult an independent financial adviser.

11 May 2005 3
Fortum's strategy - unchanged
Fortum focuses on the Nordic energy market as a platform for long-term profitable growth
Excel in business performance
Create the leading
power and heat company
Become the energy supplier
of choice

11 May 2005 4
Consistent delivery of strategy Restructuring worth 14 billion in 2000-2005
Strengthened position in the Nordic market– increased hydro and nuclear power
generation– strengthened position in electricity
distribution and retail– foothold in Norway and NW Russia
Disposal of non-core businesses– power and heat businesses outside Nordic
focus market– power plant and transmission engineering
businesses – gas retail and trading businesses– oil businesses separated

11 May 2005 5
Leading market positions in the Nordic area
Electricitydistribution
Powergeneration
Retail sales of electricityHeat
Nro 1 Nro 2

11 May 2005 6
FortumVattenfall
Elsam
others
StatkraftE.ON
A large and fragmented Nordic marketGeneration, 2003
RWE
EON (2002)EnBW
Vattenfall
Steagothers
560 TWh
British Energy
E.ON
RWEScottish&SouthernEdF
others
375 TWh
Source: Eurelectric, Fortum, Company data
363 TWh

6 May 2005Fortum Corporation 7
A competitive market - hundreds of actors
Source: Fortum, Company data
•Finland•Sweden
•Norway•Denmark
•>350 companies •>500 companies•120
•70•2*
•160
•90•180
•80**•160
•~450 companies•70
•120•40
•220
Number of companies
¤ preliminary * 2 major generators; in addition hundreds
of small CHP and wind generators
Distribution14 million customers
Retail14 million customers
Generation378 TWh¤
Top 5 players’ market share, 2004
Fortum
Vattenfall
Nesa
others
Hafslund
E.ON
FortumVattenfall
Hafslund
others
E.ON
Fortum
Vattenfall
Elsam
others
Statkraft
44%
E.ON
64% 68%
** excl. 40 minor transformer associations
Nesa

11 May 2005 8
Today only limited interconnection capacity
Power flows to and from the Nordic marketGWh, 2003
Source: Nord Pool, Finergy
– 17 TWh net power imports to the Nordic countries in 2003
– only ~5% of Nordic demand can currently be met by imports due to limited interconnection capacity
Regional integrated market with limited import capacities
4,900
3,600
2,200
60010
2,600
11,500
200

11 May 2005 9Source: Europrog / Finergy
New capacity will be required
Replacement of ageing capacityIncreasing demandIn order to ensure – long term supply
security– highest efficiency
Stable and predictable development in investment
environment required
Nordic supply/demand
TWh/year
0
100
200
300
400
500
1990 2000 2010E 2020E
Demand
Existing capacity Remaining capacity*Committed new capacity Planned new capacity
86 TWh, of whichWind power 25 TWhRenewable 11 TWhNatural gas 28 TWh
* From capacity in 2000; Assuming normal hydroconditions in 2010/2020

11 May 2005 10
Source: Nord Pool, Fortum
Investments are made on rational financial basis
New capacity requires a long-term price of 30-35 €/MWh
Price signals are necessary for generators' decisions on new capacity
Price signals guide new capacity investments
0
10
20
30
40
50
60
-94 -04-02-00-98-96 -06
€/MWh
ForwardsMay 6, 2005
11 May 2005 11
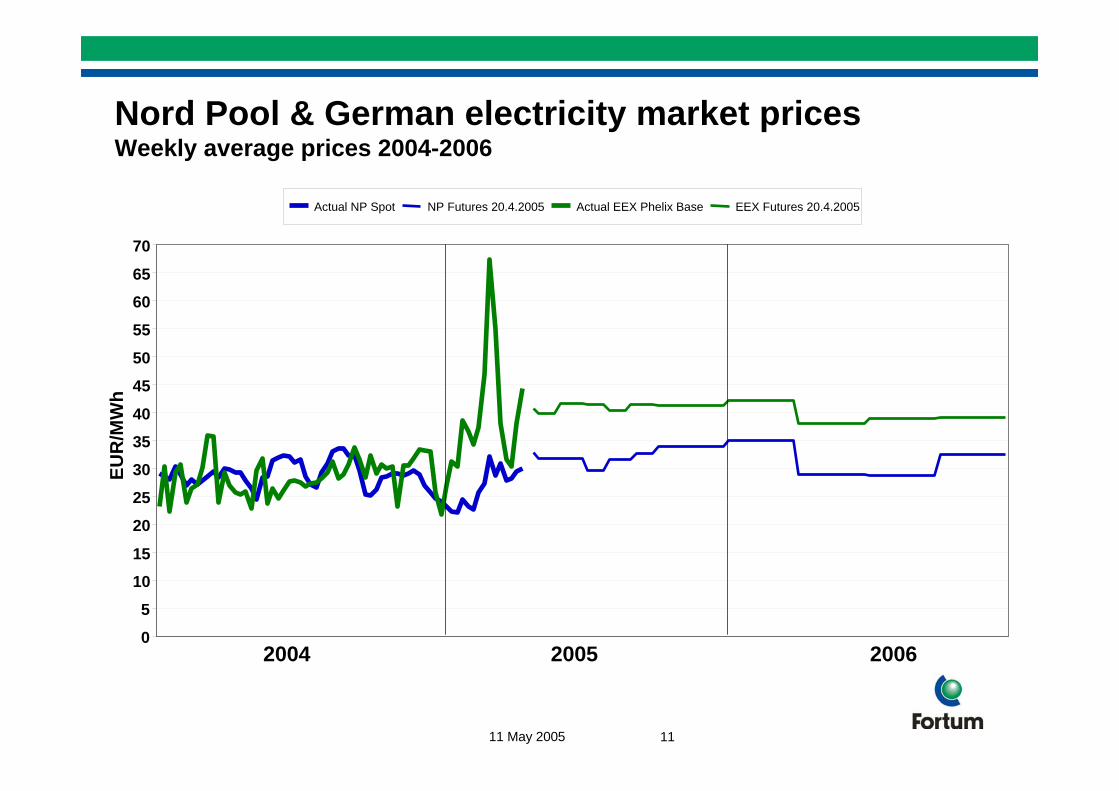
Nord Pool & German electricity market pricesWeekly average prices 2004-2006
0
5
10
15
20
25
30
35
40
45
50
55
60
65
70
EUR
/MW
h
Actual NP Spot NP Futures 20.4.2005 Actual EEX Phelix Base EEX Futures 20.4.2005
2004 2005 2006

11 May 2005 12
Price of EU emission allowances€/tCO2
0
2
4
6
8
10
12
14
16
18
20
Q2 Q3 Q4 Q1 Q2 Q3 Q4 Q1
2003 2004 2005

11 May 2005 13
Russia is an emerging opportunity
Power and heat sector reformStrong growth potentialNeed for investmentsLow valuationsEfficiency improvement potential

11 May 2005 14Source: Fortum, company web pages
Kolenergo1 928
Karelenergo915
Lenenergo3 253
Finland 13 400
NW Russia TGC-1total 6 096 MW*(of which hydro 3197 MW)
* Capacity to be finally included in TGCs may be different. NW Russia total generation capacity 14 354 MW including also generation outside the reform (e.g. nuclear).
TGC-1 established in NW Russia
CapacityMW
Norway 23 000
Sweden 27 500
Denmark 7 900

11 May 2005 15
Lenenergo – a strong foothold for Fortum in NW Russia
Population in key geographicalmarketsMillion
• Largest utility in north-western Russia
• 10 thermal and 6 hydro plants
• Power generation capacity ~3,250 MW and production ~12.4 TWh/a
• Heat generation capacity ~13,900 MW and production ~26.9 TWh/a
• Personnel ~14,300• Fortum's share of the
company 30%
1 2 7
3
Source: Annual report 2003 (Lenenergo figures)

11 May 2005 16
Separation of Oil successfully executed
• Full separation through dividend distribution (85%) and sales of shares (15%)
• Listing of Neste Oil in the Helsinki Stock Exchange• First European IPO since 2000 in which price range
was increased, priced at the top end of the range• Institutional offering 20 times subscribed at top end of
increased range• Share price of Neste Oil up 15% in the first week of
trading, valuing the company at EUR 4.4 billion • Gross proceeds to Fortum approximately EUR 580
million

11 May 2005 17
Good start to the year
• The separation and listing of Neste Oil successfully executed
• Good financial performance despite weaker market drivers
• EUR 404 (407) million operating profit from continuing operations
• Earnings per share EUR 0.28 (0.24) from continuing operations, up by 17%
• Net debt 4,878 million EUR and gearing 71 %. Pro forma net debt EUR 4,027 million and gearing 59%.
Comparison: 2004/Q1 financial results

11 May 2005 18
Operating profit
MEUR Q1/2005 Q1/2004 2004 LTM
Power Generation 222 222 763 763Heat 111 104 218 225Distribution 71 83 234 222Markets 6 16 34 24Other -6 -18 -54 -42Operating profit for: continuing operations 404 407 1 195 1 192 discontinued operations 124 150 721 695Total Fortum Group 528 557 1 916 1 887

11 May 2005 19
Income statementMEUR Q1 2005 Q1 2004
Net sales 1 133 1 129
Expenses -729 -722
Operating profit 404 407
Share of profit of associates and joint ventures 15 4
Financial expenses, net -35 -78
Profit before taxes 384 333
Income tax expense -116 -111
Profit for the period from continuing operations 268 222
Profit for the period from discontinued operations 81 102
Net profit for the period 349 324Of which minority interest 25 20
EPS, Total Fortum Group (EUR) 0.37 0.36EPS, continuing operations (EUR) 0.28 0.24EPS, discontinued operations (EUR) 0.09 0.12

11 May 2005 20
Main changes under IFRS
• Neste Oil accounted as discontinued operations
• Financial instruments valued at fair value and included in the balance sheet
• Nuclear decommissioning liabilities included in the balance sheet as assets and provisions
• A minority interest hydropower structure accounted as interest bearing liability

11 May 2005 21
Accounting of Neste Oil
• Neste Oil accounted as discontinued operations in the income statement and cash flow
• Deconsolidated in the balance sheet• 15% shareholding accounted as assets available for
sale, valued at fair value, EUR 553 million• In Q1, the capital gain from selling the 15%
shareholding, EUR 389 million, is booked in equity. In Q2, it will be booked in the income statement as part of discontinued operations
• Approximately EUR 800 million interest bearing receivable from Neste Oil– The receivable has been paid in the second quarter

11 May 2005 22
Focus on the Nordic area
• The separation and listing of Neste Oil successfully executed– estimated gain on sale of 389 MEUR will be booked in
the income statement in Q2
• Arbitration process going on to buy E.ON Finland shares owned by E.ON– Extended offer to the city of Espoo
• Establishing of TGC-1 in Russia• Finnish fifth nuclear plant (TVO 3) proceeding as
planned
Key strategic steps

11 May 2005 23
0.180.23 0.26
0.31
0.42
0.58*
Good dividend payer
Dividend per shareEUR
1999 2000 2001 2002 2003 2004
* Cash dividend, Neste Oil shares not included
CAGR: 26%
Dividend policy
Fortum Corporation's dividend policy states that the company aims at paying a dividend which corresponds to a payout ratio of 50% to 60% on the average

11 May 2005 24
Outlook
• Annual Nordic electricity consumption predicted to increase by about 1% over the next years
• Power prices in the forward market for 2005 at level 32-33 eur/MWh
• Improved operational efficiency in Fortum• Good position considering possible impacts of
emissions trading• At the beginning of April, Fortum had hedged 60% of
its Nordic Generation sales for the next 12 months at approximately same price level as the achieved Nordic Generation power price during last 12 months

11 May 2005 25
Prerequisites for good performance in place
• Oil separation successfully completed
• Nordic strategy remains unchanged
• Strong financial position
• Prerequisites for future good performance are in place

Supplementary material

11 May 2005 27
Water & snow reservoirs in Norway & Sweden week 16/2005
60
70
80
90
100
110
120
130
140
150
1 5 9 13 17 21 25 29 33 37 41 45 49 53
vara
stos
isäl
tö[T
Wh]
2000 2004 2005 viitetaso

11 May 2005 28
Nordic and German Forward Prices 31.3.2005
24262830323436384042
2005
2006
2007
2008
2009
2010
2011
EUR
0
25
50
75
MW
/day
(ind
icat
ive)
NP & Nordic OTC trading vol. EEX trading vol. NP EEX (German) Forwards
Trading volumes indicative!
Nordic and German forward prices 31.3.2005

11 May 2005 29
EUR million Q1 2005 Q1 2004
Net sales 534 560
Operating profit 222 222
Net assets 6,106 6,087
RONA, % 14.5 14.0
Business units: Generation, Portfolio Management and Trading, Service
+ Production portfolio optimisation and successful hedging - lower market prices for power
Power Generation

11 May 2005 30
EUR million Q1 2005 Q1 2004
Net sales 385 361
Operating profit 111 104
Net assets 2,457 2,373
RONA, % 19.1 18.3
Business units: Heat, Värme
+ positive development of Fortum Värme: internal efficiency improvements, a better fuel mix and good power plant availability
Heat

11 May 2005 31
Distribution
EUR million Q1 2005 Q1 2004
Net sales 202 206
Operating profit 71 83
Net assets 3,113 3,095
RONA, % 10.1 11.3
Business unit: Distribution
+ internal efficiency measures continued- storms in Sweden and Norway

11 May 2005 32
Markets
EUR million Q1 2005 Q1 2004
Net sales 392 419
Operating profit 6 16
Net assets 222 153
RONA, % 11.5 77.6
Business Unit: Markets
+ positive customer inflow- lower volumes, additional costs related to the improvement
actions in customer service

11 May 2005 33
Balance sheetMEUR Mar 31 Dec 31
2005 2004
Non-current assets 13 270 15 213 Oil related financial assets 1 357 -Current assets 1 518 2 354
ASSETS 16 145 17 567
Total equity 6 871 7 650 of which minority interest 171 150Interest bearing liabilities 5 036 5 240Non-interest bearing liabilities 4 238 4 677
EQUITY AND LIABILITIES 16 145 17 567
Gearing (%) 71 67Equity per share (EUR) 7.69 8.62Gearing pro forma (%) 59

11 May 2005 34
Cash flow statement
March 31 March 31 Dec 31MEUR 2005 2004 2 004Operating profit before depreciations continuing operations 521 504 1 595
Non-cash flow items and divesting activities -30 -1 -49
Financial items and taxes -205 -28 -341
Funds form operations continuing operations (FFO) 286 475 1 205
Change in working capital -224 -118 27
Net cash from operating activities continuing operations 62 357 1 232Net cash from operating activities discontinued operations 152 96 526Total cash from operating activities 214 453 1 758Capital expenditures -49 -57 -335Other investing activities 4 -38 -124Investing activities discontinued operations -137 -47 -277Total cash flow after investing activities 32 311 1 022

11 May 2005 35
0
20
40
60
80
100
120
Q1 Q2 Q3 Q4 Q1 Q2 Q3 Q4 Q1 Q2
€/MWh
2003 2004 2005
Nord Pool market power price

11 May 2005 36
Espoon Sähkö's ownership arrangements
2001
September 2001The City sells about 34% of its shares to E.ON (EUR 30/share). E.ON and the City make a shareholders' agreement.
January-March 2005Subscription period of Fortum'scall option
E.ON Finland's current owners :
E.ON Nordic AB 65.6%The City of Espoo 34.2% Other 0.2%
Market value ~ EUR 500 m
2002 2003 2004 2005
Previous events• 1994: IPO of Espoon Sähkö, about 74% of the
shares remain with the City• 1996: the City sells a stake of about 6% on the
stockexchange
• 1999: Länsivoima purchases a stake of about 28%• 2000: Fortum and Länsivoima merge and
Fortum becomes a shareholder in EspoonSähkö
March 2002Fortum sells its stake of about 28% to E.ON.
November 2003E.ON and the City make a new agreement, which is in conflict with the agreement between E.ON and Fortum.
April 2002As part of the Wesertal deal, Fortum receives a call option from E.ON for all shares of E.ON Finland owned by E.ON. The agreement is not contradictory to the previous agreements.
April 2005Extended offer to the city of Espoo

11 May 2005 37
Hydro power 35%Natural gas 1%
Peat 2%
Coal 11%
Others 2%
Nuclear power 47%
Biomass 2%
Fortum’s Nordic power generation 54.4 TWh in 2004
Fortum’s Nordic generation capacity 11,220 MW
Power generation by energy source
11 May 2005 38
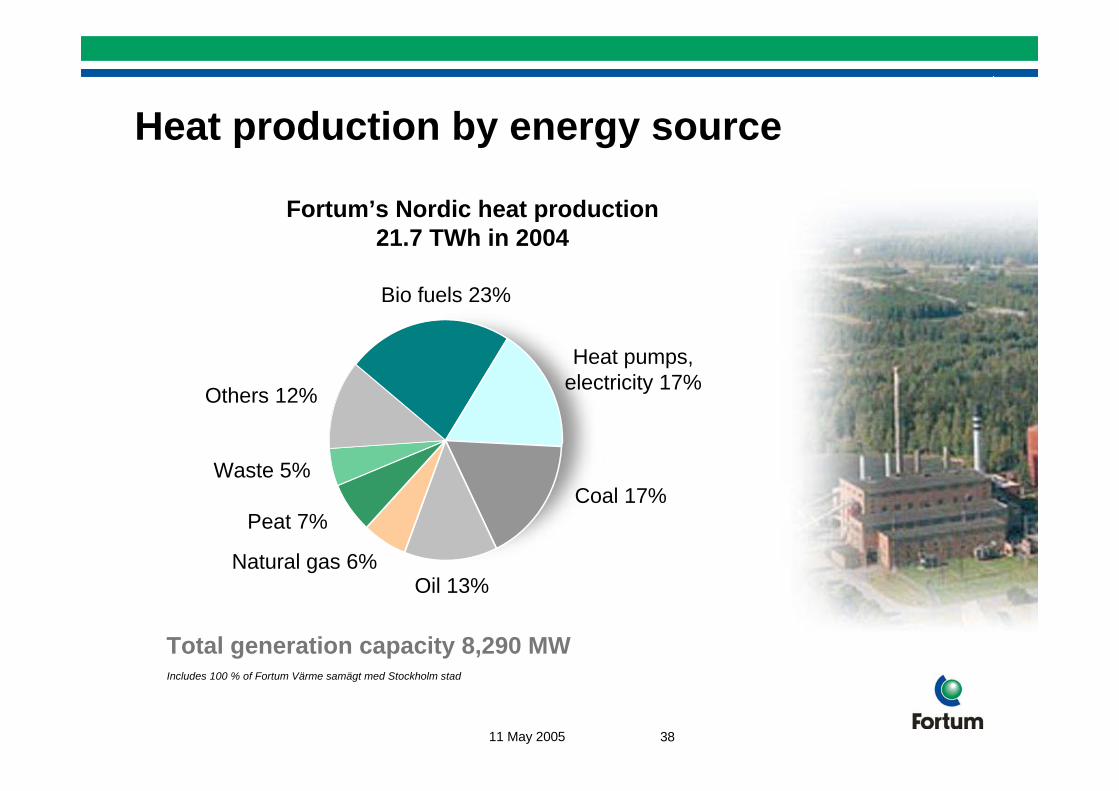
Heat production by energy source
Total generation capacity 8,290 MWIncludes 100 % of Fortum Värme samägt med Stockholm stad
Oil 13%
Peat 7%
Heat pumps, electricity 17%
Waste 5%
Bio fuels 23%
Natural gas 6%
Fortum’s Nordic heat production 21.7 TWh in 2004
Others 12%
Coal 17%

11 May 2005 39
0
50
100
150
200
250
300
350
400
5.1.2001 5.7.2001 5.1.2002 5.7.2002 5.1.2003 5.7.2003 5.1.2004 5.7.2004 5.1.2005
Fortum HEX port folio index DJ600 STOXX Ut ilit ies index
weekly averages 2001-2005 (5.1.2001 = 100)
Quotation of Fortum shares, Hex portfolio and Dow Jones utilities index Divident pay out:
• 0,58 eur cash• Neste Oil shares

11 May 2005 40
A listed company29 April 2005
Market capitalisation EUR 10,3 billionMore than 50,000 shareholdersListed on the Helsinki Stock Exchange
Internationalinvestors 26.1%
Finnish State 58.9%
Other Finnishinvestors 7.9%
Households 5.3%Financial and insuranceinstitutions 1.8%

11 May 2005 41
History
BirkaFortum
1996
1997
1998
Länsivoima
Stora Kraft
Neste
IVO
2000
SkandinaviskaElverk
Gullspång
StockholmEnergi
2002
Østfold
Separation of oil businesses disclosed
Shares inLenenergoShares in Hafslund
2003
2003
2004
Separation of oil businesses through a share dividend and
a sale of shares disclosed