A Latent Class Modeling Approach for Identifying Injury Severity
16
A Latent Class Modeling Approach for Identifying Injury Severity Factors and Individuals at High Risk of Death at Highway-Railway Crossings Naveen ELURU 1 , Morteza BAGHERI 2 , Luis F. MIRANDA-MORENO 3 and Liping FU 4 1 Assistant Professor, McGill University, Department of Civil Engineering & Applied Mechanics, 817 Sherbrooke Street W., Montreal, Quebec, H3A 2K6 ; PH +1-514-398- 6823; FAX +1-514-398-7361; email: [email protected] 2 Assistant Professor, Iran University of Science and Technology, School of Railway Engineering, Tehran, Iran, 16846-13114; email: [email protected] 3 Assistant Professor, McGill University, Department of Civil Engineering & Applied Mechanics, 817 Sherbrooke Street W., Montreal, Quebec, H3A 2K6 ; PH +1- 514- 398-6589; FAX +1-514-398-7361; email: [email protected] 4 Professor, University of Waterloo, Department of Civil Engineering & Environmental Engineering, 200 University Avenue West, Waterloo, Ontario, N2L 3G1; PH +1-519- 888-4567 ext.33984; FAX +1-519-888-4349; email: [email protected] ABSTRACT The growing focus on improving railway freight transportation in North America has resulted in increased attention to safety at highway-railway crossings (HRC). Recently, federal government agencies such as US Federal Railroad Administration (FRA) and Canadian Transportation Safety Board (TSB) have alluded to safety concerns associated with HRC. Safety at HRCs are of considerable importance to the government as well as the public due to the significant economic and emotional damages associated with accidents at HRC. To address these safety concerns, transportation researchers are focusing on developing countermeasures that enhance safety at HRC. Earlier research on HRC safety has employed a risk based approach considering both frequency and consequence; however, there has been very little research examining the consequence of the collision. In this paper, we aim to identify the different factors that influence injury severity of highway vehicle occupants, in particular drivers, involved in a vehicle-train collision. The commonly used approach to modeling vehicle occupant injury severity is the traditional ordered response model. However, the ordered response model restricts the effect of various factors on injury severity to be constant across all accidents. It is possible that accidents might be grouped (clustered) into different segments to differentiate the effects of various factors at the segment level. The current research effort proposes an innovative latent segmentation-based ordered response model to study injury severity. In this case, individuals (drivers) are assigned probabilistically to different segments with probability of getting injured specific to each segment. The validity and strength of the formulated collision consequence model is tested using the United States Federal Railroad Administration database which includes inventory data of all the railroad crossings in the US and collision data at these HRC crossings from 1584 ICTIS 2011 © ASCE 2011 Downloaded 10 Feb 2012 to 129.97.120.253. Redistribution subject to ASCE license or copyright. Visit http://www.ascelibrary.org
Transcript of A Latent Class Modeling Approach for Identifying Injury Severity

A Latent Class Modeling Approach for Identifying Injury Severity Factors and Individuals at High Risk of Death at Highway-Railway Crossings
Naveen ELURU1, Morteza BAGHERI2, Luis F. MIRANDA-MORENO3 and Liping FU
4
1 Assistant Professor, McGill University, Department of Civil Engineering & Applied Mechanics, 817 Sherbrooke Street W., Montreal, Quebec, H3A 2K6 ; PH +1-514-398-6823; FAX +1-514-398-7361; email: [email protected]
2 Assistant Professor, Iran University of Science and Technology, School of Railway Engineering, Tehran, Iran, 16846-13114; email: [email protected]
3 Assistant Professor, McGill University, Department of Civil Engineering & Applied Mechanics, 817 Sherbrooke Street W., Montreal, Quebec, H3A 2K6 ; PH +1- 514-398-6589; FAX +1-514-398-7361; email: [email protected]
4 Professor, University of Waterloo, Department of Civil Engineering & Environmental Engineering, 200 University Avenue West, Waterloo, Ontario, N2L 3G1; PH +1-519-888-4567 ext.33984; FAX +1-519-888-4349; email: [email protected]
ABSTRACT
The growing focus on improving railway freight transportation in North America has resulted in increased attention to safety at highway-railway crossings (HRC). Recently, federal government agencies such as US Federal Railroad Administration (FRA) and Canadian Transportation Safety Board (TSB) have alluded to safety concerns associated with HRC. Safety at HRCs are of considerable importance to the government as well as the public due to the significant economic and emotional damages associated with accidents at HRC. To address these safety concerns, transportation researchers are focusing on developing countermeasures that enhance safety at HRC. Earlier research on HRC safety has employed a risk based approach considering both frequency and consequence; however, there has been very little research examining the consequence of the collision. In this paper, we aim to identify the different factors that influence injury severity of highway vehicle occupants, in particular drivers, involved in a vehicle-train collision. The commonly used approach to modeling vehicle occupant injury severity is the traditional ordered response model. However, the ordered response model restricts the effect of various factors on injury severity to be constant across all accidents. It is possible that accidents might be grouped (clustered) into different segments to differentiate the effects of various factors at the segment level. The current research effort proposes an innovative latent segmentation-based ordered response model to study injury severity. In this case, individuals (drivers) are assigned probabilistically to different segments with probability of getting injured specific to each segment. The validity and strength of the formulated collision consequence model is tested using the United States Federal Railroad Administration database which includes inventory data of all the railroad crossings in the US and collision data at these HRC crossings from
1584ICTIS 2011 © ASCE 2011
Downloaded 10 Feb 2012 to 129.97.120.253. Redistribution subject to ASCE license or copyright. Visit http://www.ascelibrary.org

1997 to 2006. The research effort will shed light on the most important factors that affect the severity of injuries to vehicle occupants involved in collisions. 1. INTRODUCTION
There are over 400,000 highway-railway grade crossings (HRC) in the United States catering to a broad spectrum of road and rail traffic. In spite of the recent safety initiatives that have substantially reduced the number of HRC collisions, the United States Federal Railroad Association (FRA) recorded over 30,000 collisions during the ten year period from 1997 to 2006. Traffic crashes at HRC are often catastrophic and it is of utmost importance to transportation agencies and other stakeholders to identify collision contributing factors and countermeasures to reduce traffic collisions and the resulting consequences.
Collisions occurring at these facilities could result in serious consequences (including death) to roadway vehicle occupants, possible injuries to train passengers, and substantial property damage due to the release of freight cargoes, and delay in freight and highway traffic (Raub 2009). In collisions involving freight rails carrying hazardous materials the consequences can be further exasperated due to release of hazardous materials into the environment. A number of earlier research studies have focused on identifying the contributing factors that affect the occurrence of collisions at HRC (see studies such as Saccomanno et al., 2007; Washington and Oh, 2006; Saccomanno and Lai, 2005). These studies employ or combine different techniques such as factor/cluster analysis, negative binomial regression models, and Bayesian methods. However, collision frequency is only one element of collision risk at HRC. The risk associated with a crossing is typically defined as a function of collision frequency and collision consequence – total risk (Miranda-Moreno, et al., 2009). To consider just frequency as a measure of risk would ignore crossings with a low expected collision frequency, but with potential for severe consequences. Therefore, it is essential that research efforts in safety literature examine the factors associated with the injury severity (consequence) sustained in collisions at HRC. While many previous studies have focused on predicting the frequency of collisions, there is a lack of substantive research that particularly examines the consequence of collisions at HRC.
This paper seeks to fill the gap in safety literature by focusing on the consequence of highway railroad crossings. The current research effort contributes towards this end by examining the influence of a host of exogenous factors on injury severity of vehicle drivers involved in collisions at HRC. Specifically, the focus is on examining the influence of: (1) driver demographics (including gender, age), (2) Characteristics of the vehicle involved in the collision (vehicle type), (3) Crossing characteristics (Annual traffic on the highway, railway traffic), (4) Crossing safety equipment (presence of gates, traffic signals, watchmen etc.) (5) Environmental factors
1585ICTIS 2011 © ASCE 2011
Downloaded 10 Feb 2012 to 129.97.120.253. Redistribution subject to ASCE license or copyright. Visit http://www.ascelibrary.org

(weather, lighting conditions, time of day, etc.), and (6) Crash characteristics (role of vehicle in crash etc.).
In road safety literature, a host of studies have examined driver injury severity (in highway crashes) employing the traditional ordered response mechanism to take into account the inherent ordering of the reported driver injury severity (see for example O’Donnell and Connor 1996; Eluru and Bhat, 2007). In this study we also employ a similar ordered response mechanism but with an important extension of considering latent segmentation (see Bhat 1997 for an example of latent segmentation based approach to unordered response models). In the traditional ordered response model the effect of exogenous variables are assumed to be identical across the entire population, i.e., we are imposing response homogeneity for the entire population. The assumption in most cases is restrictive and might lead to incorrect policy assumption. An interesting question arising out of this limitation is: how do we account for this potential response heterogeneity? An often employed approach in safety literature to address this restriction is the formulation of a random coefficients ordered logit model (see Eluru and Bhat, 2007). However, the random coefficients ordered logit model accounts for unobserved components of heterogeneity. Prior to incorporating mechanisms to capture unobserved heterogeneity it is important to accommodate systematic heterogeneity in the modeling framework. In this research effort, we propose to accommodate this systematic heterogeneity by using a latent segmentation based approach. The latent segmentation based approach probabilistically assigns individuals based on the exogenous variables to different segments. Subsequently, an ordered response model is estimated of each of these latent segments. The latent segmentation based ordered response framework is estimated using data drawn from the Federal Railroad Administration (FRA) Office of Safety Analysis Web Site. The database employed in our analysis provides information on traffic crashes involving rail and motor vehicles for the period 1997-2006.
The rest of the paper is organized as follows: Section 2 provides the details of the methodological issues examined and Section 3 presents the econometric model. Section 4 outlines the data preparation steps and discusses the results of the model estimation. Section 5 concludes the paper. 2. METHODOLOGICAL ISSUES
The dearth of research in modeling injury severity of drivers involved in HRC collisions is particularly surprising considering the fact that a considerable number of research efforts in safety literature devoted to examining injury severity of vehicle drivers on roadway crashes. The statistical approaches employed for examining driver injury severity in roadway crashes are directly applicable to modeling collision consequence at HRC. In our current empirical analysis, we examine driver injury severity employing an ordered response framework. However, we attempt to address
1586ICTIS 2011 © ASCE 2011
Downloaded 10 Feb 2012 to 129.97.120.253. Redistribution subject to ASCE license or copyright. Visit http://www.ascelibrary.org

some important methodological issues relating to existing approaches within the ordered response framework. Typically, the ordered response models impose response homogeneity across the entire population i.e. the effect of exogenous variable is treated to be the same across the entire population. To relax this assumption, research studies have employed the random coefficients ordered response framework. These approaches relax the assumption of response homogeneity by allowing the coefficients to be randomly distributed across the population. The drawback of these approaches is that they entail complicated simulation machinery for estimating the model. Moreover, these approaches enhance the model by accommodating for unobserved heterogeneity as opposed to systematic heterogeneity. It would be very useful to formulate an approach that accommodates for systematic heterogeneity prior to investigating the influence of unobserved heterogeneity. It is in this context that latent segmentation models have been employed (see Bhat 1997 for a similar discussion).
The latent segmentation model assigns individuals probabilistically to segments based on socio-demographics. The latent segmentation model recognizes that individuals in a population are not homogenous and hence can be assigned to different segments probabilistically. Each of these segments has its own injury severity model (an ordered response model in our context). The whole set of exogenous variables are employed as potential determinants in the segmentation choice. The approach begins with model estimation considering two segments. The number of segments is determined by adding one segment at a time until further addition does not enhance the log-likelihood. The approach estimates the coefficients corresponding to individual assignment, segment specific injury severity ordered response component and also the number of segments.
Thus, in the current study we formulate and estimate a latent segmentation based ordered response model. In fact, the authors are not aware of any earlier research effort, not only in safety literature but also in econometric literature in general of a latent segmentation based ordered response model. The econometric underpinning of the latent segmentation ordered response model are described in the next section. 3. ECONOMETRIC FRAMEWORK
The modeling of vehicle driver injury severity is achieved using a latent segmentation based ordered response model. Let us consider S homogenous segments of the driver’s involved in HRC collisions (S is to be determined). The pattern of injury severity within the segment remains identical. However, there are intrinsic differences in the pattern of injury severity across different segments i.e. we have a distinct ordered response model for each segment (1,2,..S).
1587ICTIS 2011 © ASCE 2011
Downloaded 10 Feb 2012 to 129.97.120.253. Redistribution subject to ASCE license or copyright. Visit http://www.ascelibrary.org

Within each segment, we formulate the ordered response model in its traditional form. Let q (q = 1, 2, …, Q) be an index to represent drivers and let k (k = 1, 2, 3, …, K) be an index to represent injury severity. The index k, for example, may take values of “no injury” (k = 1), “injury” (k = 2), and “fatal injury” (k = 3), as in the empirical analysis in the current paper. The equation driver injury severity model is:
qsqsqs xy εα +′=* , kyq = if 1
*k ks q syψ ψ−< < (1)
The equation represents the latent propensity *qsy associated with the injury severity
sustained by driver q in the accident if he were to belong to segment s. This latent propensity *
qsy is mapped to the actual injury severity level qy by the ψ thresholds (
0sψ = −∞ andKsψ = ∞ ) in the usual ordered-response fashion. qx is an (L x 1) column
vector of attributes (not including a constant) that influences the propensity associated with injury severity. α is a corresponding (L x 1)-column vector of coefficients and qε is an idiosyncratic random error term assumed to be identically and independently standard logistic distributed across individuals q. The probability that driver q sustained injury severity k is given by:
1
' '( ) | ( ) ( )k kq s s q s s qP k s x xψ α ψ α
−= Λ − −Λ − (2)
where (.)Λ represents the standard logistic cumulative distribution function. Now we need to determine how drivers are probabilistically assigned to segments. The random utility based multinomial logit structure is employed for the segmentation model. The utility for assigning a driver q to segment s is defined as:
* 'qs s q qsU xβ ξ= + (3)
qx is an (L x 1) column vector of attributes (not including a constant) that influences the propensity associated with injury severity. β is a corresponding (L x 1)-column vector of coefficients and qsξ is an idiosyncratic random error term assumed to be identically and independently Type 1 Extreme Value distributed across individuals q and segment s. Then the probability that driver q belongs to segment s is given as:
'
'
exp( )exp( )
s qqs
s qs
xP
xββ
=∑ (4)
Based on the above discussion, the unconditional probability of individual sustaining injury severity k is given as:
1( ) ( ( ) | )( )
S
q q qss
P k P k s P=
=∑ (5)
The parameters to be estimated in the model are ands sβ α for each s and the number of segments S. The log-likelihood function for the entire dataset is provided below:
1588ICTIS 2011 © ASCE 2011
Downloaded 10 Feb 2012 to 129.97.120.253. Redistribution subject to ASCE license or copyright. Visit http://www.ascelibrary.org

1log( ( ))
Q
L P k−
=∑ (6) It is important to note that the estimation of latent class models using quasi-
Newton routines can be computationally unstable (see Bhat 1997 for a discussion). The estimation of such models requires employing good starting values for the estimation procedure. For our analysis, the log-likelihood function and its corresponding gradient function were coded in Gauss Matrix programming language. 4. DATA 4.1 Data Source
The Federal Railroad Administration (FRA) provides information on the type, causes, consequences, and mitigating circumstances of train collisions experienced annually nation-wide in the US for the period 1975-2010. These data are readily available for downloading from the FRA, Office of Safety Analysis Web Site (http://safetydata.fra.dot.gov/OfficeofSafety/). The US FRA website contains two databases related to HRC: (1) collision records (called “Highway-Rail Grade Crossing Accident/Incident Form F 6180.57”) and (2) inventory database (called “U.S. DOT Crossing Inventory Form”). In this analysis records for the 10-year period from 1997-2006 were employed. The collision database contains information such as driver demographics, vehicle characteristics, the driver actions during collision, and crossing safety infrastructure deployed, The inventory database contains detailed information regarding railway traffic flow, list of crossing safety infrastructure deployed, roadway type classification, highway Annual Average Daily Traffic (AADT), presence and type of advance warning signs etc corresponding to all the crossings in the U.S.. The data sets contain a unique identifier to merge the crossing infrastructure information with the actual collision record. The collision database was merged with appropriate crossing information using this unique identifier.
In this research, the analysis is confined to collisions occurring at public grade crossings on the main railway line. We do not consider collisions occurring at yards, sidings and industrial locations. Further, we focus our attention on the injury severity of the motor vehicle driver only in our analysis. The data assembly process involved removing records with missing and inconsistent information. The final sample compiled, after checking thoroughly for consistency, contains 14,532 observations. The injury severity of each individual involved in a crash is coded on a three-point ordinal scale: (1) No injury, (2) Injury, and (3) Fatal injury. The driver injury severity distribution in the final data sample is as follows: No injury (62.0%), injury (27.6%) and Fatality (10.4%). 4.2 Model specification
This section presents the model estimation results in detail. The variables considered in the empirical analysis include driver demographics, characteristics of the
1589ICTIS 2011 © ASCE 2011
Downloaded 10 Feb 2012 to 129.97.120.253. Redistribution subject to ASCE license or copyright. Visit http://www.ascelibrary.org

vehicle involved in the collision, crossing characteristics, crossing safety equipment, environmental factors, and crash characteristics. The final specification was based on a systematic process of removing statistically insignificant variables and combining variables when their effects were not significantly different. The specification process was also guided by prior research and intuitiveness/parsimony considerations. We should also note here that, for the continuous variables in the data (such as age and time of day), we tested alternative functional forms including linear and spline (or piece-wise linear), and dummy variables for different ranges.
In this research effort, we estimated two different model specifications. First, we estimated the traditional ordered logit (OL) model. Second, we estimated the latent segmentation based ordered logit (LSOL) model. The final specifications of these models were obtained after extensive testing. For the LSOL model the model with two segments offered the best statistical fit. Prior to discussing the model results we compare the performance of the OL and LSOL models. The OL and LSOL models are not nested within each other. Hence, we employ two measures that are suited to comparing non-nested models to determine the model that offers superior statistical fit: (1) Bayesian Information Criterion (BIC)1
and (2) Ben-Akiva and Lerman’s adjusted likelihood ratio (BL) test.
The BIC for a given empirical model is equal to − 2ln(L) + K ln(Q) , where ln(L) is the log-likelihood value at convergence, K is the number of parameters, and Q is the number of observations. The model with the lower BIC value is the preferred model. The BIC values for the final specifications of the OL and LSOL models are 22978 and 22726 respectively.
The BL test statistic (Ben-Akiva and Lerman 1985) is computed as:
{ }2 2
2 1 2 12( ) ( ) ( )L C M Mτ ρ ρ = Φ − − − + − where
2ρ represents the McFadden’s
adjusted rho-square value for the model. It is defined as 2 ( )1
( )i i
iL M
L Cβρ −
= − where
( )iL β represents log-likelihood at convergence for the ith ( )L C model, represents log-likelihood at sample shares and Mi is the number of parameters in the model (Windmeijer, 1995) Φ. The represents the cumulative standard normal distribution function. The BL test computes the probability that we could have obtained the higher
2ρ value for the model with a probability of no larger than τ . The
2ρ values thus
1 The reader will note that we chose to employ BIC because it imposes substantially higher penalty on over-fitting with excess parameters compared to the penalty imposed by Alkaike Information Criterion (AIC). AIC is defined as − 2ln(L) + 2K.
1590ICTIS 2011 © ASCE 2011
Downloaded 10 Feb 2012 to 129.97.120.253. Redistribution subject to ASCE license or copyright. Visit http://www.ascelibrary.org

computed for the OL and LSOL models are 0.111 and 0.135 respectively. The resulting τ value for the comparison of OL and LSOL models is ( 603.8)Φ − = 0.
In our case study, the BIC and the BL test statistics clearly confirm that the LSOL model offers substantially superior data fit compared to the OL model. This validation of our hypothesis indicates that the population of drivers involved in HRC is probabilistically clustered in at least two subpopulations with distinct influence of exogenous variables on injury severity probabilities. Hence, in the following presentation of empirical results we will confine ourselves to a discussion of LSOL model results for the sake of brevity. 4.3 Estimation Results
The LSOL model that offered that best statistical fit consisted of two segments. The model estimation results for the segmentation component and the injury severity component are presented in Table 1.
Table 1: LSOL Model estimates of Vehicle Driver Injury Severity
Estimate t-stats Latent Segmentation Component Propensity to be part of second segment (first segment is the base alternative) Constant -3.4730 -9.330 Age (≤40 years is base) 41 – 64 years 0.2336 2.23 > 64 years 0.6441 5.229 Vehicle Type (Pickup is the base) Sedan -0.3242 -2.066 Minivan -0.4512 -2.685 Time period of the day 6 AM to 9 AM 1.2414 7.021 9 AM to 12 PM 1.4637 8.798 12 PM to 3 PM 1.5237 9.425 3 PM to 7 PM 1.1464 7.574 Weather conditions (Clear weather is base) Rain -0.4186 -2.456 Fog -1.2762 -2.601 Snow -0.7688 -2.410 Temperature ≤32 F 0.1690 1.355 33 – 60 F -0.1867 -2.315 Role of vehicle in the crash (struck the rail is base) Struck by the rail 2.1433 7.195
1591ICTIS 2011 © ASCE 2011
Downloaded 10 Feb 2012 to 129.97.120.253. Redistribution subject to ASCE license or copyright. Visit http://www.ascelibrary.org
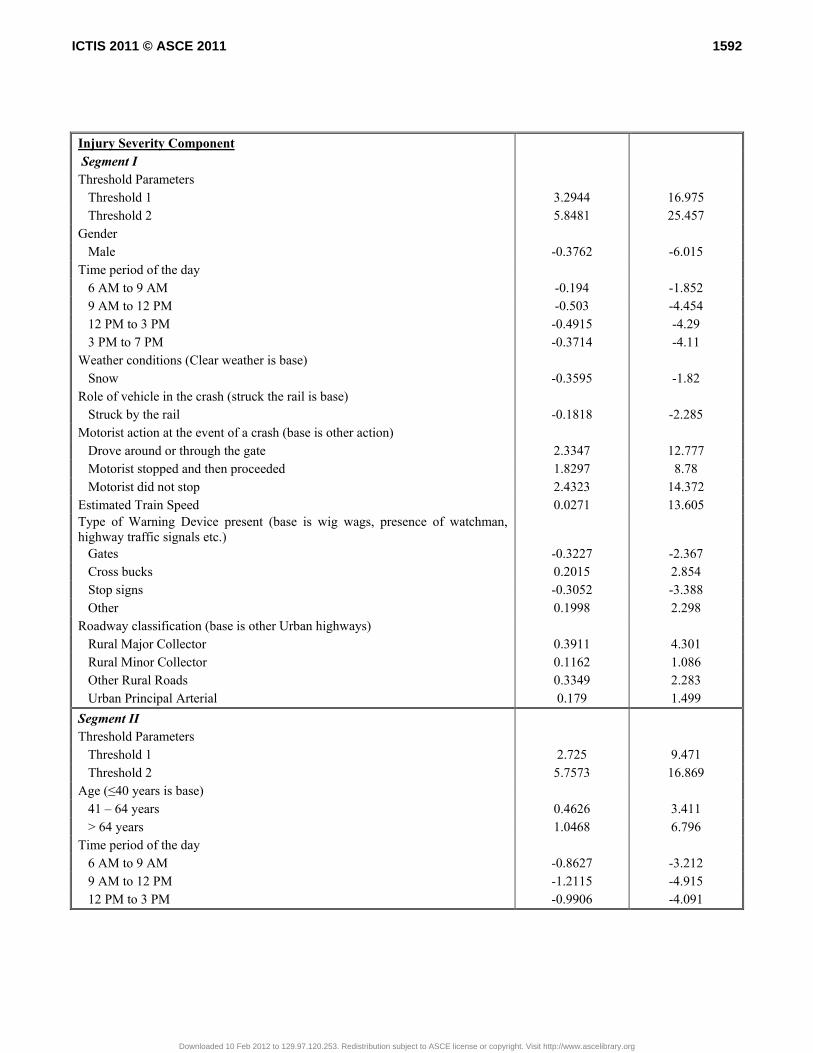
Injury Severity Component Segment I Threshold Parameters Threshold 1 3.2944 16.975 Threshold 2 5.8481 25.457 Gender Male -0.3762 -6.015 Time period of the day 6 AM to 9 AM -0.194 -1.852 9 AM to 12 PM -0.503 -4.454 12 PM to 3 PM -0.4915 -4.29 3 PM to 7 PM -0.3714 -4.11 Weather conditions (Clear weather is base) Snow -0.3595 -1.82 Role of vehicle in the crash (struck the rail is base) Struck by the rail -0.1818 -2.285 Motorist action at the event of a crash (base is other action) Drove around or through the gate 2.3347 12.777 Motorist stopped and then proceeded 1.8297 8.78 Motorist did not stop 2.4323 14.372 Estimated Train Speed 0.0271 13.605 Type of Warning Device present (base is wig wags, presence of watchman, highway traffic signals etc.) Gates -0.3227 -2.367 Cross bucks 0.2015 2.854 Stop signs -0.3052 -3.388 Other 0.1998 2.298 Roadway classification (base is other Urban highways) Rural Major Collector 0.3911 4.301 Rural Minor Collector 0.1162 1.086 Other Rural Roads 0.3349 2.283 Urban Principal Arterial 0.179 1.499 Segment II Threshold Parameters Threshold 1 2.725 9.471 Threshold 2 5.7573 16.869 Age (≤40 years is base) 41 – 64 years 0.4626 3.411 > 64 years 1.0468 6.796 Time period of the day 6 AM to 9 AM -0.8627 -3.212 9 AM to 12 PM -1.2115 -4.915 12 PM to 3 PM -0.9906 -4.091
1592ICTIS 2011 © ASCE 2011
Downloaded 10 Feb 2012 to 129.97.120.253. Redistribution subject to ASCE license or copyright. Visit http://www.ascelibrary.org

3 PM to 7 PM -1.0802 -4.519 Motorist action at the event of a crash (base is other action) Drove around or through the gate 1.9366 9.572 Motorist stopped and then proceeded 0.9417 4.424 Motorist did not stop 1.1831 9.183 Estimated Train Speed 0.1093 16.789 Type of Warning Device present (base is wig wags, presence of watchman, highway traffic signals etc.) Gates -0.4957 -3.256 Other 0.2279 1.554 Maximum Posted Train Speed for the crossing 0.0047 1.438 Railway equipment involved in the crash Moving train car 0.8839 2.646 Number of Locomotive units 0.0565 1.278 Roadway classification (base is other Urban highways) Rural local highway 0.1265 1.177 Log-Likelihood at constants -12896.8 Log-Likelihood at convergence -11104.4 Adjusted rho-square 0.135 Number of observations 14532
4.3.1 Latent Segmentation Component The latent segmentation component determines the probability that a driver is assigned to one of the two latent segments. In our empirical analysis, the first segment is chosen to be the base and the coefficients presented in the table correspond to the utility for the driver to choose segment two (see Equation 3). The results provide interesting insights on the likelihood of assigning individuals to different segments based on the exogenous variables.
The constant term clearly indicates a strong inclination for drivers to be more likely to be assigned to the first segment i.e. the first segment if intrinsically populated by drivers at high risk. Age of the driver has a substantial influence on segment assignment. Specifically, individuals between the years 41 and 64 years are more likely to be assigned to the second segment. The propensity is further increased for individuals 65 and above. The results clearly indicate a clear segmentation of the population based on age. The choice of vehicle type has an impact on how the drivers are assigned to different segments. In particular, the results indicate that drivers using a sedan or a minivan are less likely to be assigned to segment two. The result, though surprising at first sight, is not improbable. The implication of the vehicle type impact is that individual’s choice of vehicles is a precursor to travel behavior. There has been support to this argument in recent safety literature. Paleti et al. (2010) has found relationship between vehicle choice and potential aggressive behavior.
1593ICTIS 2011 © ASCE 2011
Downloaded 10 Feb 2012 to 129.97.120.253. Redistribution subject to ASCE license or copyright. Visit http://www.ascelibrary.org

The environmental conditions considered such as time of day, weather and
temperature conditions exert substantial influence on assigning drivers to different segments. In particular, time of day impacts driver segment assignment in an interesting manner. Collisions occurring during the time period day from 6AM to 7PM are more likely to be assigned to the second segment. At the same time, collisions occurring under inclement weather (rain, fog, snow) are less likely to be assigned to segment two. Within the three weather elements, fog weather has the strongest disinclination while the rain has the lowest disinclination of assigning the driver to segment two. The temperature at the time of the crash also affects the driver assignment. Specifically, the collisions occurring at temperatures below 32°F are more likely to be assigned to segment two while collisions occurring between 32 °F and 60 °F are more likely to be assigned to segment one. The role of the vehicle at the time of the collision also exerts an important influence on segment assignment. If the vehicle driver was struck by the rail, at the time of collision, the collision is very likely to be assigned to segment two.
The individuals in the database are probabilistically assigned to two different segments based on a host of exogenous variables. The first segment can be summarized as collisions that involve younger drivers of age 40 and lower, driving a sedan or a minivan. These crashes are likely to occur during the night, and under inclement weather. Generally, these are drivers at a higher risk compared to those assigned to the second segment. The second segment can be characterized as collisions involving older drivers (41 and above) and driving a pickup. These collisions occur during the day, under clear weather conditions, and mostly with temperatures below 32 °F and involve being struck by the rail. 4.3.2 Injury Severity Component: Segment One
The ordered logit model corresponding to segment one is described in this section. The interpretation of the coefficients follows the usual ordered response frameworks. The positive coefficients represent increased propensity to sustain severe injury while negative coefficients represent reduced propensity to sustain injury.
Within segment one, males are likely to sustain less severe injuries compared to females. This is not surprising, since males are physiologically stronger than females. A similar result has often been reported in safety literature examining driver injury severity in roadway crashes (see Eluru and Bhat 2007, Paleti et al, 2010).
The time period of the day during which the collision occurs influences the likelihood of sustaining injuries. Specifically, we find that all collisions occurring during the day between 6AM to 7PM are likely to result in less severe injuries compared to the time period between 7PM to 6AM. This is potentially because vehicle drivers are less aware of the existence of a railway crossing during the night time due to lack of
1594ICTIS 2011 © ASCE 2011
Downloaded 10 Feb 2012 to 129.97.120.253. Redistribution subject to ASCE license or copyright. Visit http://www.ascelibrary.org

visibility. Within the day time periods, the 6AM to 9AM is less safe compared to other times periods. It is possible that visibility is an issue during early morning periods also.
The presence of snow at the HRC reduces the likelihood of severe injury. The result, though counter intuitive at first glance, is relatively easy to explain. The presence of snow causes the drivers to be cautious and drive slowly and the subsequent collisions occurring during snow result in less severe injuries. A similar result on the influence of snow on driver injury severity has been reported earlier in safety literature (see Eluru and Bhat 2007).
The role of vehicle in the collision and motor vehicle driver action substantially influence the collision consequence. The results indicate that when a train collides into a vehicle the driver is more likely to escape with less severe injuries compared to when a vehicle driver collides with the vehicle. The reasoning behind these results is not entirely clear and would require additional investigation. Drivers that drive around or through the gate or those who do not stop at the HRC are prone to sustain severe injuries in the event of a collision. Drivers that stop and proceed at the time of the collision also sustain severe injuries but less severe than the previously mentioned driver actions. As you would expect, estimated train speed has a positive effect on injury propensity. The faster the train is travelling the severe is the injury to the driver.
The results corresponding to the safety equipment present at the crossing provide interesting insights. The results indicate that the presence of gates and stop signs at the crossing reduce injury severity. However, the presence of other safety equipment or absence of safety equipment result in increased injury severity.
The database did not contain valid information on either vehicle speed at the time of the collision or the posted speed limit on roadways near the crossing. Hence, in our analysis, we employed roadway classification as a proxy for vehicle speed before the collision. The results indicate that, in general, collisions occurring on HRC with rural highways are likely to result in severe injuries compared to the collisions occurring at HRC with urban highways. Among the rural highways, major collector roads and other rural roads lead to more severe crashes while crashes on minor rural collector roads result in least severe injuries. Among urban highways, urban principal arterials results in the most severe collisions.
Thresholds in the ordered response model form the boundary point for the different injury severities. In our first segment, when the latent propensity of the individual is less than 3.2944 the driver sustains no injury. The driver sustains a serious injury when the propensity is between 3.2944 and 5.8481. The driver is fatally injured when the propensity value is greater than 5.8481.
1595ICTIS 2011 © ASCE 2011
Downloaded 10 Feb 2012 to 129.97.120.253. Redistribution subject to ASCE license or copyright. Visit http://www.ascelibrary.org

4.3.3 Injury Severity Component: Segment Two Vehicle driver age has a significant influence on the injury severity of drivers.
Specifically, drivers aged 41 and above are likely to be more severely injured compared to younger drivers. The drivers aged 64 and above are susceptible to more severe injuries. The result is a clear indication of how allowing for two segments enables us to extract out different effects. Vehicle age was not statistically significant for the first segment. The result indicates that injury severity of individual’s likely to be part of the first segment is unaffected by driver age whereas injury severity of individual’s likely to be part of second segment is influenced by driver age. The result provides credence to our hypothesis that exogenous variables have distinct effects on different segments of the population.
The time period of the day during which the collision occurs influences the likelihood of sustaining injuries. Specifically, we find that all collisions occurring during the day between 6AM to 7PM are likely to result in less severe injuries compared to the time period between 7PM to 6AM. The signs of the time of day coefficients are identical to those observed in the time of day coefficients in segment one. However, there is substantial difference in magnitudes of these coefficients. Again, this clearly underlines that influence of exogenous factors on injury severity is not homogenous across the population.
The role of vehicle in the collision variable did not have any influence on the injury severity for segment two. The motor vehicle driver action influence on collision consequence is very similar to the trend observed in segment one. However, the magnitudes of coefficients in segment two are very different from the magnitudes of coefficients observed in segment one. With an increase in the estimated train speed at the event of collision the propensity to sustain severe injuries also increases. This is similar to what we have observed in segment one. However, the reader should note that the magnitude of the coefficient is about 4 times the magnitude of the coefficient in segment one. The result implies that individuals that are part of the segment two are more affected by the train speed at the time of impact.
The presence of crossing control devices provides similar results to segment one. The only difference in this regard is the absence of any significant effect of the stop sign variable on injury severity. The results on the crossing devices clearly suggest a review of existing safety procedures at HRC. Specifically, the results indicate that apart from gates and stop signs, other safety control devices do not play any role in alleviating driver injury severity.
The result corresponding to maximum allowed train speed variable indicates that with increase in train speed limit the injury sustained also increases. The increase in propensity magnitude is however marginal. For instance, for an increase in speed limit
1596ICTIS 2011 © ASCE 2011
Downloaded 10 Feb 2012 to 129.97.120.253. Redistribution subject to ASCE license or copyright. Visit http://www.ascelibrary.org
from 50 to 70 the change in propensity is only 0.094. The railway equipment involved in the collision also affect injury severity component for individuals assigned to segment two. In particular, the results indicate that collision with a moving train car results in a more severe injury to the driver. The increase in number of locomotive units connected to the train also has a positive influence on driver injury severity. As the number of locomotive units increases the kinetic energy transferred to the car at the time of collision would increase leading to more severe injuries. Roadway classification variables in the second segment do not influence injury severity as substantially as they do in the first segment. Only, crashes occurring on local rural highways are susceptible to severe injuries in this segment.
The threshold coefficients for segment two are clearly different from the thresholds in segment one. In fact, the thresholds for the second segment are smaller than those of the first segment. This implies that individuals that are more likely to be assigned to segment two are also more likely to severely injured compared to their counterparts. In the second segment, when the latent propensity of the individual is less than 2.7250 the driver sustains no injury. The driver sustains a serious injury when the propensity is between 2.7250 and 5.7573. The driver is fatally injured when the propensity value is greater than 5.7573.
The impact of exogenous variables on injury severity in both component offer interesting insights. Further, the results clearly highlight that exogenous variables affect injury severity distinctly for the two segments. These results stress the importance of accommodating for such heterogeneity in the model framework employed to compute the impact of exogenous variables on injury severity. Neglecting the presence of such significant heterogeneity will result in incorrect estimates. 5. CONCLUSIONS
This research has attempted to examine the influence of various exogenous factors on the injury severity of motor vehicle drivers involved in HRC collisions. Specifically, the emphasis is on understanding the effect of (1) driver demographics (including gender, age), (2) Characteristics of the vehicle involved in the collision (vehicle type), (3) Crossing characteristics (Annual traffic on the highway, railway traffic), (4) Crossing safety equipment (presence of gates, traffic signals, watchmen etc.) (5) Environmental factors (weather, lighting conditions, time of day, etc.), and (6) Crash characteristics (role of vehicle in crash etc.).
We have proposed an innovative econometrical approach, a latent segmentation based ordered logit (LSOL) model, to accurately determining the influence of exogenous variables on injury severity. . The approach recognizes that influence of exogenous factors on injury severity is not homogenous across the entire population. Hence, it is
1597ICTIS 2011 © ASCE 2011
Downloaded 10 Feb 2012 to 129.97.120.253. Redistribution subject to ASCE license or copyright. Visit http://www.ascelibrary.org

important to accommodate for this response heterogeneity in the modeling framework. Towards this end, the LSOL model probabilistically assigns individuals to different segments and within each segment the individuals are considered to be homogenous. For each of these segments a separate ordered logit model is estimated. The approach endogenously determines the number of segments.
The LSOL model was estimated using data obtained from Federal Railroad Administration (FRA) Office of Safety Analysis Web Site. The collision records for the 10-year period from 1997-2006 were employed in our research. The analysis was confined to drivers involved in collisions occurring at public HRC. The collision records were appended with their corresponding crossing information appropriately.
The model estimation results provide insights into the influence of factors that increase or decrease the collision consequences (levels of driver injury severities). The LSOL model clearly outperforms the traditional ordered logit model thus providing support to our hypothesis that the effect of exogenous variables is not homogenous across the population. The LSOL model offered optimal statistical performance with two latent segments. The segmentation component of the model shows light on the assignment of individuals to the two segments. The results categorize crashes involving younger drivers of age 40 and lower, driving a sedan or a minivan that are likely to occur during the night, and under inclement weather into the first segment. On the other hand, the second segment consisted of collisions involving older drivers (41 and above) and driving a pickup that occur during the day, under clear weather conditions, and mostly with temperatures below 32°F and being struck by the rail. The injury severity results for the two segments are also very different. The exogenous variables influencing injury severity vary across the two segments. To clearly understand the magnitude of the coefficients on the probability of driver injury severity aggregate level elasticity measures are computed. These measures highlight indicate that the variables driver’s age 65 or greater, the vehicle is struck by the rail, motorist actions (including drove around or through the gate, motorist stopped and proceeded, and motorist did not stop), and collision with a moving train car are more likely to exacerbate driver injury severity in the event of highway-railroad crashes. Based on the elasticity computations, we find that OL models computes inaccurate elasticity measures for a number of exogenous variables. These results clearly underscore the importance of allowing for impact of exogenous factors to be flexible across different segments in the data. REFERENCES Ben-Akiva, M. and Lerman, S. R. (1985) "Discrete Choice Analysis: Theory and
Application to Travel Demand"Bhat, C. (1997). "An endogenous segmentation mode choice model with an application
to intercity travel." Transportation Science 31(1): 34-48.
. The MIT Press, Cambridge.
1598ICTIS 2011 © ASCE 2011
Downloaded 10 Feb 2012 to 129.97.120.253. Redistribution subject to ASCE license or copyright. Visit http://www.ascelibrary.org

Eluru, N. and C. R. Bhat (2007). "A joint econometric analysis of seat belt use and crash-related injury severity." Accident Analysis & Prevention 39(5): 1037-1049.
Eluru, N., C. R. Bhat, D. A. Hensher (2008). "A mixed generalized ordered response model for examining pedestrian and bicyclist injury severity level in traffic crashes." Accident Analysis & Prevention 40(3): 1033-1054.
O'Donnell, C. and D. Connor (1996). "Predicting the severity of motor vehicle accident injuries using models of ordered multiple choice." Accident Analysis & Prevention 28(6): 739-753.
Paleti, R., N. Eluru, et al. (2010). "Examining the influence of aggressive driving behavior on driver injury severity in traffic crashes." Accident Analysis & Prevention 42(6): 1839-1854.
Raub, R. (2009). "Examination of Highway-Rail Grade Crossing Collisions Nationally from 1998 to 2007." Transportation Research Record: Journal of the Transportation Research Board 2122(-1): 63-71.
Saccomanno, F. and X. Lai (2005). "A model for evaluating countermeasures at highway-railway grade crossings." Transportation Research Record: Journal of the Transportation Research Board 1918(-1): 18-25.
Washington, S. and J. Oh (2006). "Bayesian methodology incorporating expert judgment for ranking countermeasure effectiveness under uncertainty: Example applied to at grade railroad crossings in Korea." Accident Analysis & Prevention 38(2): 234-247.
Windmeijer F.A.G, Goodness-of-fit measures in binary choice models, Econometric Reviews 14 (1995), pp. 101–116
1599ICTIS 2011 © ASCE 2011
Downloaded 10 Feb 2012 to 129.97.120.253. Redistribution subject to ASCE license or copyright. Visit http://www.ascelibrary.org