
“A Land Full of Issuance…”: Fundamentals of Bond … presentations/Bond Proceeds... ·...
41
© PFM 0 “A Land Full of Issuance…”: Fundamentals of Bond Proceeds Investment PFM Asset Management LLC 1200 Fifth Ave. Suite 1220 Seattle, WA 98101 206.264.8900 pfm.com Luke Schneider, CFA, Director Duncan Brown, Senior Managing Consultant
Transcript of “A Land Full of Issuance…”: Fundamentals of Bond … presentations/Bond Proceeds... ·...

© PFM 0
“A Land Full of Issuance…”:Fundamentals of Bond Proceeds Investment
PFM Asset
Management LLC
1200 Fifth Ave.
Suite 1220
Seattle, WA 98101
206.264.8900
pfm.com
Luke Schneider, CFA, Director
Duncan Brown, Senior Managing Consultant

© PFM 1
So…You Have a Big (or Small!) Capital Project to Fund

© PFM 2
Sources of Project Funding
• Develop a conservative yet reliable project construction time table
• Potential sources of funding:
– Accumulated revenues/reserves
– Ongoing revenues during construction period
– Grants and fundraising
– Debt financing:
• Low-interest State loans (PWTF, SRF, CERB, etc.)
• State LOCAL program
• Federal loans (e.g., USDA-RD)
• Bank loans
• Municipal bonds (publicly offered)

© PFM 3
When to Think About Investments?
• Developing “net” costs in Funding Plan
– Critical when determining how much to raise/borrow
• Investment environment may influence number and timing of debt issues
– May also influence debt structure (e.g., relative benefit of “draw-down” feature)
• When bond documents are being drafted
– Definition of “permitted investments”
– Allows time to implement the investment “game plan” at bond closing

© PFM 4
Why Is Having a Strategy Important?
Increases the potential for higher project fund earnings:
• Reduce “net” project costs and/or mitigate unplanned costs
– Potential to unburden cash reserves if the project is not 100% financed
• Act as a set aside for future/potential arbitrage rebate liability
– More likely in other interest rate environments
• Important to consider the upside of higher earnings
– Where/how can we apply excess funds?

© PFM 5
Factors Influencing Plan of Finance & Investment Decisions
• Project draw schedule
• Type of bonds and related funds
– Voted GO bonds vs. all other types
– Debt Service Reserve Fund
– Refunding escrow
• Permitted investments
– State law
– Bond documents
– Investment policies
• Prevailing and expected investment/rate environment
• Anticipated arbitrage rebate requirements

© PFM 6
Investment of Various Accounts in Normal Yield Curve Environment
0.0%
0.5%
1.0%
1.5%
2.0%
2.5%
3.0%
3.5%
4.0%
Debt Service Reserve Account
Advance Refunding Escrow
Current Refunding Escrow +
Debt Service Fund
Construction Fund + CAPI
Subject to
Arb Rebate
Subject To Yield Restriction
No Rebate Restrictions
Potentially No Rebate Restrictions
Equity Funds
Source: Bloomberg. As of March 31, 2017. See important disclosures at the end of this presentation.

© PFM 7
Factor: Permitted Investments
Investments determined by:
• Federal Tax Code & Arbitrage Rebate Regulations
• State Statutes
• Investment Policies (sometimes)
• Bond Covenants (bond ordinance or resolution)
• Bond Insurer Requirements (sometimes even if new bonds are not insured—right of prior
insurer to consent to document changes)

© PFM 8
Sample Permitted Investments
• Short-term Investments
– Local Government Investment Pools
– Overnight Repurchase Agreements
• Open-market Securities
– U.S. Treasuries & Direct Obligations (e.g., Treasury Notes, Bills)
– Federal Agency Securities (e.g., Fannie Mae & Freddie Mac)
– Commercial Paper (e.g., General Electric Capital Corp., Toyota)
– Corporate Notes
• Structured Investments
– Guaranteed Investment Contracts (GICs)
– Flexible Repurchase Agreements (Flex Repos)
– Forward Delivery Agreements (FDAs)

© PFM 9
Developing an Appropriate Investment Strategy
Active
Management
Passive
Strategies
Regulations
Consider rebate rules
and possible
exceptions
State Law
Compliance with
investment statutes
and policies
Bond Covenants
Compliance with bond
indenture and tax
code elections
Market Conditions
Consider absolute
and relative level of
interest rates
Bond Yield
Evaluate bond yield
relative to current
market rates
Cash Flow
Consider draw
schedule and timing
of cash flows
Liquidity Needs
Provide liquidity to
meet expected and
unforeseeable draws
Yield Restriction
Consider any current
or pending
requirements
Investment
Analysis

© PFM 10
Active Management vs. Passive Strategies
• Ideal for funds with expansive permitted investments or uncertain liquidity needs
• Strive to enhance investment earnings and manage risk via ongoing active portfolio management
– Capitalize on changes in sector yield spreads
– Competitively shop the market for cheap securities while ensuring adequate liquidity
– Manage duration of portfolio based upon relative value of different portions of the yield curve and
changing market conditions
– Adhere to both client and internal credit standards
• Ideal for funds with conservative, straight-forward permitted investments and predictable liquidity
needs
• Options include:
– One-time purchase of fixed-income portfolio
– Structured investments
Passive Strategies
Active Management

© PFM 11
Active Management Process
Relative value analysis
Quantitative security
analysis
Individual issue selection
Issuer credit research
Horizon analysis
Yield/return comparison
Strategies
To Add Value
Sector
allocation
Duration
management
Maturity
distribution
Yield curve
placement
Industry
selection
Issue selection
Portfolio Construction and Management
Employ both strategies to add value to portfolios
Entity
Objectives and
Policies
Macro-economic
conditions
Interest rates and trends
Inflation expectations
Credit outlook
Asset class expectations
Yield curve structure
Economic forecasts
Political factors
Top-down Analysis
Bottom-up Analysis
© PFM 12
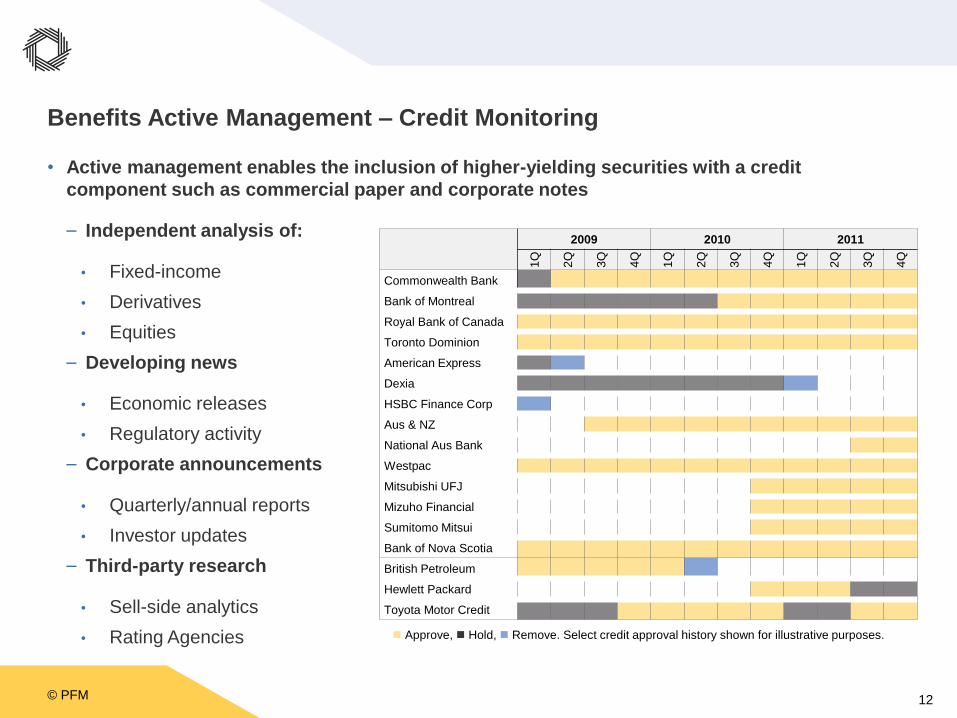
Benefits Active Management – Credit Monitoring
• Active management enables the inclusion of higher-yielding securities with a credit
component such as commercial paper and corporate notes
– Independent analysis of:
• Fixed-income
• Derivatives
• Equities
– Developing news
• Economic releases
• Regulatory activity
– Corporate announcements
• Quarterly/annual reports
• Investor updates
– Third-party research
• Sell-side analytics
• Rating Agencies
2009 2010 2011
1Q
2Q
3Q
4Q
1Q
2Q
3Q
4Q
1Q
2Q
3Q
4Q
Commonwealth Bank
Bank of Montreal
Royal Bank of Canada
Toronto Dominion
American Express
Dexia
HSBC Finance Corp
Aus & NZ
National Aus Bank
Westpac
Mitsubishi UFJ
Mizuho Financial
Sumitomo Mitsui
Bank of Nova Scotia
British Petroleum
Hewlett Packard
Toyota Motor Credit
Approve, Hold, Remove. Select credit approval history shown for illustrative purposes.

© PFM 13
Project Funds

© PFM 14
Project Fund Draw Schedule
• Project proceeds typically spend within 3 years
• Average life is approximately 1–1½ years
Average “life”
Time
“Typical” Project Fund Expenditure
Pattern

© PFM 15
If Draw Schedule Is Uncertain…
• Analyze historical capital spending patterns
• Structure investments around conservative estimates
• Build in additional liquidity
• Invest in securities that can be easily liquidated
• Rebalance based on changes in cash flows and/or market conditions
© PFM 16
If Draw Schedule Is Fairly Certain…
• Ladder investments, targeted to specific cash flow needs
• Monitor periodically to determine if actual expenditures are in line with expected project fund draws
• Rebalance based on changes in cash flows and/or market conditions
© PFM 17
Typical Investments for Project Funds
• Liquidity Vehicle:
– Local Government Investment Pool
• Structured fixed-income portfolio
• Structured investment product/contract
• Combination strategy

© PFM 18
Typical Investments for Project Funds
• Convenient
• Typically overnight liquidity
• Rate dependent
• Inherently taking view that rates will rise during construction period
Time1 yr 2 yr
Projected expenditures

© PFM 19
Portfolio Strategy
• Laddered to match project fund schedule
• Fixed rate of interest for life of the security
• Reinvestment risk if draw schedule is delayed
• Interest rate risk if security must be sold prior to maturity
• Inherently taking view that rates will not rise quickly during construction period
Time1 yr 2 yr
Projected expenditures
Projected maturities

© PFM 20
Yield Environment as of March 31st, 2017
Source: Bloomberg BVAL yield curves for Treasury, Corporate and Commercial Paper, TradeWeb for Federal Agency yields. 3 and 6 month corporate yields
from commercial paper; A-1+ for AA and A-1 for A. As of 03/31/17.
Source: WA LGIP daily yield as of 3/31/17 .http://www.tre.wa.gov..
Maturity WA LGIP TreasuryFederal
AgencyAA Corporate A Corporate
A1/P1
Commercial
Paper
Liquidity 0.82%
3-Month 0.75% 0.87% 0.96% 1.12% 1.08%
6-Month 0.90% 0.95% 1.12% 1.34% 1.30%
1-Year 1.02% 1.09% 1.35% 1.53%
2-Year 1.26% 1.37% 1.65% 1.85%
3-Year 1.49% 1.61% 1.94% 2.14%
5-Year 1.92% 2.02% 2.41% 2.61%

© PFM 21
Summary
• Understand the project expenditure
needs
• Strategize about investment options
during bond issuance process
• Assess current market environment
• Implement strategy
• Monitor proceeds throughout the life
of the project and restructure, if
needed
© PFM 22
Refunding Escrows

© PFM 23
Refunding Escrow Securities – “SLGS”
• SLGS = “State and Local Government Series” securities issued by the U.S. Treasury, commonly used in refunding escrows
• SLGS are subscribed for, not competitively procured; can be custom-tailored for particular refunding bond issues
• Availability of SLGS Program is based on the government’s borrowing capability—debt ceiling debate
• SLGS Program was suspended on March 15, 2017
P R E V I O U S S L G S S U S P E N S I O N S
May 15, 2002 – July 8, 2002 54 days
February 19, 2003 – May 27, 2003 97 days
October 19, 2004 – November 22, 2004 34 days
February 16, 2006 – March 17, 2006 29 days
September 27, 2007 – September 28, 2007 24 hours
May 6, 2011 – August 2, 2011 88 days
December 28, 2012 – February 5, 2013 40 days
May 17, 2013 – October 17, 2013 152 days
February 7, 2014 – February 14, 2014 7 days
March 13, 2015 – November 3, 2015 235 days
March 15, 2017 – ?????????????? ??????

© PFM 24
Considerations for Refunding Bonds
• So long as the SLGS window is closed, issuers contemplating refunding bonds will need to
consider alternative approaches to funding the escrow
• Permissible escrow securities are typically governed by prior bond documents, potentially
including bond insurance agreements
• Cash
– No interest rate benefit to issuer—high “negative arbitrage”
– Tax concerns for advance refunding transactions
• Open-market securities (“OMS”), typically Treasuries
– Generally higher-yielding than SLGS
– Must be obtained through specific bidding process; availability may be a concern for smaller
issuers / transactions
• Another approach: economic defeasance, with proceeds invested in the LGIP
– LGIP generally not a permitted escrow security, so both refunding and refunded bonds would
be legally outstanding at the same time
© PFM 25
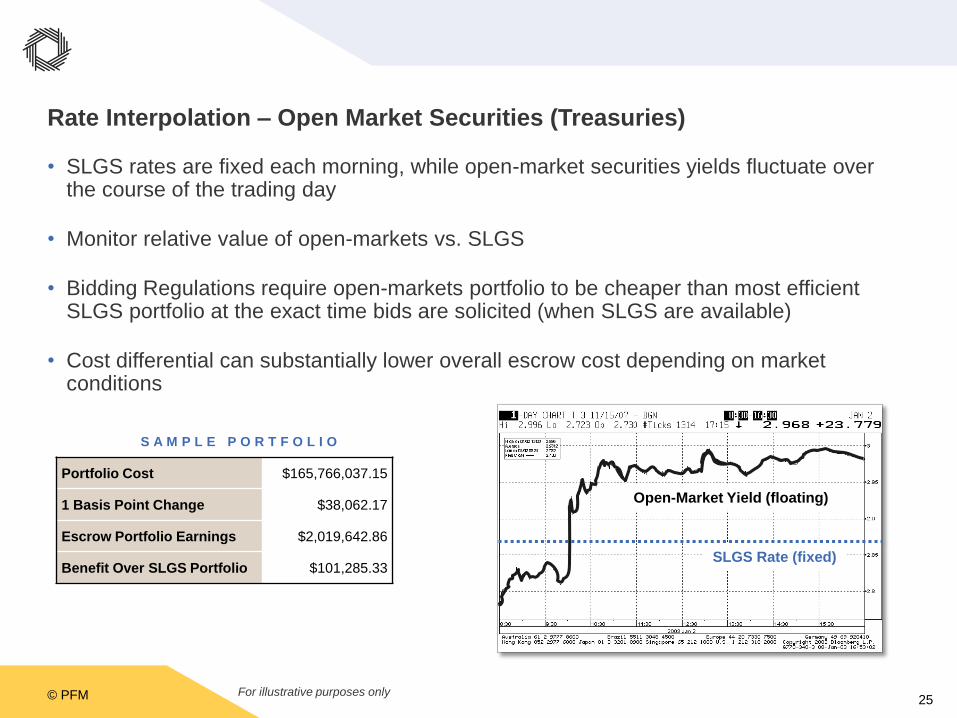
Rate Interpolation – Open Market Securities (Treasuries)
• SLGS rates are fixed each morning, while open-market securities yields fluctuate over the course of the trading day
• Monitor relative value of open-markets vs. SLGS
• Bidding Regulations require open-markets portfolio to be cheaper than most efficient SLGS portfolio at the exact time bids are solicited (when SLGS are available)
• Cost differential can substantially lower overall escrow cost depending on market conditions
For illustrative purposes only
Portfolio Cost $165,766,037.15
1 Basis Point Change $38,062.17
Escrow Portfolio Earnings $2,019,642.86
Benefit Over SLGS Portfolio $101,285.33
S A M P L E P O R T F O L I O
SLGS Rate (fixed)
Open-Market Yield (floating)

© PFM 26
U.S. Government Sponsored Enterprises (“Federal Agencies”)
• Various spreads to Treasuries depending on location on the yield curve
• Are not full faith and credit obligations of the U.S. Government
• Supply continues to decrease as balance sheets are downsized
• Finding large blocks of Federal Agencies at favorable yields can be difficult, if not impossible
G S E s
Government Sponsored Enterprises (“GSEs”), often referred to as “Federal
Agencies,” include debt securities of:
• Fannie Mae (FNMA)
• Freddie Mac (FHLMC)
• Federal Home Loan Bank System (FHLB)
• Federal Farm Credit System (FFCB)

© PFM 27
U.S. Government Guaranteed Securities
• Supply decreasing, in large part, because of purchases for defeasance escrows
• Can be 5 to 20 basis points cheaper than comparable T-STRIPS or T-Notes
• Good match for fixed-liability portfolios (i.e., non-trading accounts such as escrows)
• Liquidity and bid/ask spread not a prominent concern
R E F C O R P s
Resolution Funding Corporation Interest STRIPS
A I D B o n d s
Agency for International Development Bonds

© PFM 28
Capturing Value with Open-Market Securities
• Seldom, if ever, does one broker win all securities
• Security-by-security trades often beat “all-or-none” bidding
– Captures highest yield and establish fair market value on each security
– Ability to reject individual securities if they do not produce savings v. SLGS (if available)
S E C U R I T Y M A T U R I T Y
T O T A L C O S T
B R O K E R # 1 B R O K E R # 2 B R O K E R # 3 B R O K E R # 4 B R O K E R # 5
TSTRIPS-I 11/15/2013 $5,919,228.04 PASS $5,914,781.40 $5,914,788.22 $5,910,143.80
RSTRIPS-I 10/15/2018 $5,376,921.60 PASS $5,364,998.40 $5,375,420.16 $5,351,485.44
RSTRIPS-I 4/15/2019 PASS PASS $429,125.76 $431,313.08 $427,334.80
RSTRIPS-I 10/15/2019 $5,198,955.00 PASS $5,116,736.85 $5,133,125.85 $5,135,311.05
RSTRIPS-I 4/15/2020 PASS PASS $274,886.65 $284,001.90 $282,668.70
RSTRIPS-I 10/15/2020 $5,056,662.00 PASS $4,970,567.16 $4,941,712.23 $5,018,220.09
RSTRIPS-I 4/15/2021 PASS PASS $133,237.00 $138,426.60 $136,840.60
RSTRIPS-I 10/15/2021 $4,906,075.00 PASS $4,840,498.75 $5,056,851.80 $5,020,906.30
DEALER LOT TOTAL $26,457,841.64 - $27,044,831.97 $27,275,639.84 $27,282,910.78
Difference between Best Dealer Lot: N/A N/A $(48,796.45) $(279,604.32) $(286,875.26)
T O T A L C O S TH I G H / L O W
C O S T D I F F E R E N T I A L
A V G . / L O W
C O S T D I F F E R E N T I A L
B E S T D E A L E R / A C T .
C O S T D I F F E R E N T I A L
$26,996,035.52 $466,324 $230,757 $48,796
S A M P L E S E C U R I T Y - B Y - S E C U R I T Y P R O C U R E M E N T R E S U L T S

© PFM 29
Reserve Funds

© PFM 30
Comparison of Operating and Reserve Funds
OPERATING FUNDS RESERVE FUNDS
Market, Credit, and
Tracking Error
Market, Credit, and
Replenishment
Relative
(Beat the benchmark)
Absolute
(Avoid negative returns)
Relatively Static
(Percentage of benchmark)
Dynamic
(Unconstrained)
RETURN TARGET
MEASURES OF RISK
DURATION TARGET
Investment Policy
Liquidity Needs
Investment Policy
Liquidity Needs
Valuation Methodology
CONSTRAINTS

© PFM 31
Reserve Fund Investment Considerations
Investment Decision Factor Considerations
Market Outlook Does the strategy account for the interest rate outlook?
Risk ManagementIs interest rate risk exposure based on the investment
valuation methodology and frequency?
Replenishment RequirementsIf investment values decline, must the Reserve Fund be
replenished?
Opportunity CostsAre there yield enhancement opportunities within your risk
management parameters?
Arbitrage Rebate ComplianceWere rebate complexities and liability expectations
considered?
Accounting Method Is the DSRF a commingled fund or in separate accounts?

© PFM 32
Strategy Development – Risk Tolerance
• Strategy is always viewed within the context of:
– Valuation requirements
– Likelihood that reserve will need to be accessed due to debt service fund deficiency
– Entity's willingness or ability to replenish any shortfalls
Valuation at cost
Valuation at market with
buffer
Annual valuation at market
Semi-annual valuation at market
Monthly/ quarterly valuation at market
just past valuation upcoming valuation
+ –Portfolio’s ability to take interest risk

© PFM 33
Breakeven Analysis
• Forward curves used to determine economic indifference between various investment
horizons
5-year Initial Investment vs. 2-year Interim with 3-Year Breakeven
5 years
2 years 3 years
1.85%
1.20% 2.36%
-
500,000
1,000,000
1,500,000
2,000,000
2,500,000
0 1 2 3 4 5
Net
Inte
rest
Earn
ings
Investment Horizon, Years
5-year Investment
2-year Interim
3-year Breakeven
Rates as of January 6, 2017.

© PFM 34
Sensitivity Analysis
• It is important to thoroughly evaluate the impact of interest rate changes and design
strategies to mitigate interest rate risk
– The target duration is developed to protect the portfolio against the impact of rising
rates while seeking higher yields available from longer maturities
• Short time to valuation date warrants conservative duration positioning with extension
trades once the valuation occurs
2-year TreasuryYield of 1.203% / Duration of 1.95 (as of January 6, 2017)
10-year TreasuryYield of 2.434% / Duration of 8.94 (as of January 6, 2017)
Change in Interest
RatesMarket Value
Change in Market
Value
Change in Interest
RatesMarket Value
Change in Market
Value
-1.0% $ 10,196,534.49 $ 196,534.49 -1.0% $ 10,928,451.85 $ 928,451.85
-0.5% $ 10,097,663.54 $ 97,663.54 -0.5% $ 10,452,701.63 $ 452,701.63
0.0% $ 10,000,000.00 $ - 0.0% $ 10,000,000.00 $ -
0.5% $ 9,903,526.14 $ (96,473.86) 0.5% $ 9,569,161.43 $ (430,838.57)
1.0% $ 9,808,224.56 $ (191,775.44) 1.0% $ 9,159,064.40 $ (840,935.60)
© PFM 35
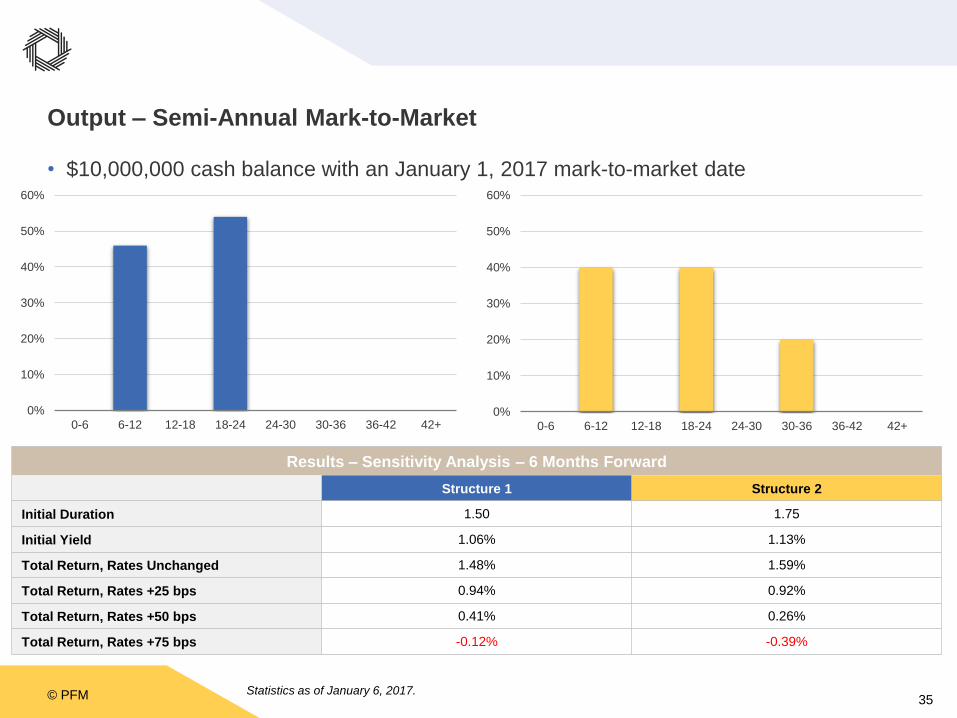
Output – Semi-Annual Mark-to-Market
• $10,000,000 cash balance with an January 1, 2017 mark-to-market date
Statistics as of January 6, 2017.
Results – Sensitivity Analysis – 6 Months Forward
Structure 1 Structure 2
Initial Duration 1.50 1.75
Initial Yield 1.06% 1.13%
Total Return, Rates Unchanged 1.48% 1.59%
Total Return, Rates +25 bps 0.94% 0.92%
Total Return, Rates +50 bps 0.41% 0.26%
Total Return, Rates +75 bps -0.12% -0.39%
0%
10%
20%
30%
40%
50%
60%
0-6 6-12 12-18 18-24 24-30 30-36 36-42 42+0%
10%
20%
30%
40%
50%
60%
0-6 6-12 12-18 18-24 24-30 30-36 36-42 42+

© PFM 36
Structured Investments

© PFM 37
Types of Structured Investments
• Uncollateralized Guaranteed Investment Contracts
– Generically referred to as GICs - unsecured pledge to pay principal and interest on investment;
historically provided by insurance companies or banks
• Collateralized Guaranteed Investment Contracts
– Referred to as Collateralized GICs - pledge to repay principal and interest is secured by collateral
posted to a third-party custodian
• Repurchase Agreements
– Referred to as Repo, Flex Repo, Term Repo - agreement to purchase securities and resell back to
counterparty in the future at a guaranteed yield; typically provided by broker-dealers and banks
• Forward Delivery Agreements
– Referred to as Forward Purchase (Purchase and Sale) Agreements, FPAs, FDAs - agreement
stipulating the outright purchase of securities from a counterparty* through time; typically provided by
broker-dealers and banks
*Counterparties (“providers”) vary depending on agreement type

© PFM 38
Comparison of Structured Investment Agreements
FDAGuaranteed Investment
ContractRepurchase Agreement
Security for
InvestmentPurchased securities
Promissory note from
counterparty
Collateral held at 3rd
party custodian
Mechanism for
Interest
Payments
Difference between
purchase price and par
amount of securities
Credited to account Credited to account
Credit Risk
Limited to underlying
deliverables; very low if
UST
Depends on agreement
counterparty
Depends on agreement
counterparty; collateral
reduces concerns subject
to “J”-Risk
Bankruptcy
Considerations
None – clean
bankruptcy opinion is
market standard
Subject to clawback and
bankruptcy stay
Intended to be exempt;
however, clean
bankruptcy opinion not
possible
Other Risks
Mark-to-market risk
(auditors) and
performance risk
Overnight bankruptcy risk
– no collateral
“J”-Risk – interpretation
of structure under
Bankruptcy Code

© PFM 39
Thank You

© PFM 40
Disclosures
This material is based on information obtained from sources generally believed to be
reliable and available to the public; however, PFM Asset Management LLC cannot
guarantee its accuracy, completeness, or suitability. This material is for general information
purposes only and is not intended to provide specific advice or a specific
recommendation. All statements as to what will or may happen under certain
circumstances are based on assumptions, some but not all of which are noted in the
presentation. Assumptions may or may not be proven correct as actual events occur, and
results may depend on events outside of your or our control. Changes in assumptions may
have a material effect on results. Past performance does not necessarily reflect and is not
a guaranty of future results. The information contained in this presentation is not an offer to
purchase or sell any securities.


