
A kinetic study of electrochemical lithium insertion in ... · PDF fileThe kinetics of the...
7
Electrochimica Acta 56 (2011) 10016–10022 Contents lists available at SciVerse ScienceDirect Electrochimica Acta j ourna l ho me pag e: www.elsevier.com/locate/electacta A kinetic study of electrochemical lithium insertion in nanosized rutile -MnO 2 by impedance spectroscopy S. Bach a,b,∗ , J.P. Pereira-Ramos a , P. Willmann c a Institut de Chimie et des Matériaux Paris Est, GESMAT, UMR 7182 CNRS-Université Paris XII, 2 rue Henri Dunant 94320 Thiais, France b Université d’Evry Val d’Essonne, Bd F.Mitterrand, Departement Chimie, 91025 Evry Cédex, France c Centre National d’Etudes Spatiales, 118 avenue Edouard Belin, 31401 Toulouse Cedex 9, France a r t i c l e i n f o Article history: Received 1 July 2011 Received in revised form 24 August 2011 Accepted 25 August 2011 Available online 9 September 2011 Keywords: Lithium batteries Rutile -MnO2 Nanomaterial Li transport Electrochemical impedance a b s t r a c t The kinetics of the electrochemical lithium insertion reaction in nano-sized rutile -MnO 2 has been investigated using ac impedance spectroscopy. The experimental kinetic data are obtained for a rutile compound synthesized by ball-milling the powder produced from the heat treatment of manganese nitrate salts. The results are discussed as a function of the Li content for 0 < x < 0.6 and the number of cycles in the 4.1–2 V window. From a comparison with data obtained on the micro-sized oxide, an improved kinetics is found with D Li values for the apparent chemical diffusion coefficient of lithium much higher by one order of magnitude than in microsized oxide. Impedance behaviour of the ball-milled rutile -MnO 2 vs cycles demonstrates a new system takes place from the second cycle, characterized by a sig- nificant improvement of Li diffusion by a factor 5 and a cathode impedance which decreases by a factor 2, remaining thereafter unchanged during cycling. © 2011 Elsevier Ltd. All rights reserved. 1. Introduction In the field of cathode materials for secondary lithium bat- teries, manganese oxides have unique and important advantages over other transition metal oxides due to their low toxicity, good capacity and inexpensive cost. Manganese oxides exist in vari- ous polymorphic forms and are made of MnO 6 octahedra, these basic units being linked by sharing edges and corners to give rise to different types such as -, -, -, and -types. For instance the hollandite form exhibits (2 × 2) while -MnO 2 also called pyrolusite exhibits a rutile structure which contains the narrow- est (1 × 1) channels. -MnO 2 contains domains of intergrown -MnO 2 and ramsdellite MnO 2 with larger channels (2 × 1) and -MnO 2 is characterized by a three dimensional network of chan- nels. The lowest size of the channels available for Li transport in the -MnO 2 oxide framework makes this electrode material can- not provide much capacity. Indeed it has been found that the Li uptake inserted chemically or electrochemically into crystallized -MnO 2 does not exceed 0.3 Li per mole of oxide at room tem- perature [1,2], and nearly 1 Li at temperatures around 100 ◦ C and 150 ◦ C [3,4]. ∗ Corresponding author at: Institut de Chimie et des Matériaux Paris Est, GESMAT, UMR 7182 CNRS-Université Paris XII, 2 rue Henri Dunant 94320 Thiais, France. E-mail address: [email protected] (S. Bach). Very recently, nanostructured materials have stimulated numerous works reporting the positive effect of the nanosized oxide particles mainly because of their substantial advantages in terms of mass transport [5–10]. Several groups have reported that at room temperature nanometer-sized [11–14] and mesoporous [15,16] -MnO 2 show a higher electroactivity towards Li insertion than the conventional bulk oxide with a maximum Li uptake in the range 0.66–0.92 per MnO 2 unit in the first discharge. -MnO 2 nanomaterials with different morphologies have been synthesized via a hydrothermal route using Mn(NO 3 ) 2 solutions [11], mixtures of KMnO 4 and MnCl 2 [12] or by hydrothermal persulfate treat- ments of solid precursors like MnO and Mn 2 O 3 [13] or by simple heating a mixture of Mn(NO 3 ) 2 and acetylene black [14]. However, in spite of the afforded improvements, the electrochemical data available on nanosized and mesoporous -MnO 2 only consist in the discharge–charge profile for one or several cycles and cycling data obtained in various voltage windows such as 4.5–1.5 V, 5–1 V, 4–1.5 V, 4.5–1 V. Even when the stark difference for the behaviour of bulk and nanosized -MnO 2 is reported as being caused by kinetics, no work has focused on the kinetic of the electrochemical Li inser- tion reaction in nanosized -MnO 2 [11–16]. Li diffusion process in the active material is essential for a good understanding of the cath- ode performance. This lack of kinetic data on nanosized rutile MnO 2 prompted us to investigate using ac impedance spectroscopy the kinetics of the Li insertion process into nanosized rutile MnO 2 pre- pared for the first time by ball-milling. The results reported here 0013-4686/$ – see front matter © 2011 Elsevier Ltd. All rights reserved. doi:10.1016/j.electacta.2011.08.118
Transcript of A kinetic study of electrochemical lithium insertion in ... · PDF fileThe kinetics of the...

Ab
Sa
b
c
a
ARRAA
KLRNLE
1
tocobttpe��ntnu�p1
U
0d
Electrochimica Acta 56 (2011) 10016– 10022
Contents lists available at SciVerse ScienceDirect
Electrochimica Acta
j ourna l ho me pag e: www.elsev ier .com/ locate /e lec tac ta
kinetic study of electrochemical lithium insertion in nanosized rutile �-MnO2
y impedance spectroscopy
. Bacha,b,∗, J.P. Pereira-Ramosa, P. Willmannc
Institut de Chimie et des Matériaux Paris Est, GESMAT, UMR 7182 CNRS-Université Paris XII, 2 rue Henri Dunant 94320 Thiais, FranceUniversité d’Evry Val d’Essonne, Bd F.Mitterrand, Departement Chimie, 91025 Evry Cédex, FranceCentre National d’Etudes Spatiales, 118 avenue Edouard Belin, 31401 Toulouse Cedex 9, France
r t i c l e i n f o
rticle history:eceived 1 July 2011eceived in revised form 24 August 2011ccepted 25 August 2011vailable online 9 September 2011
a b s t r a c t
The kinetics of the electrochemical lithium insertion reaction in nano-sized rutile �-MnO2 has beeninvestigated using ac impedance spectroscopy. The experimental kinetic data are obtained for a rutilecompound synthesized by ball-milling the powder produced from the heat treatment of manganesenitrate salts. The results are discussed as a function of the Li content for 0 < x < 0.6 and the numberof cycles in the 4.1–2 V window. From a comparison with data obtained on the micro-sized oxide, an
eywords:ithium batteriesutile �-MnO2
anomateriali transportlectrochemical impedance
improved kinetics is found with DLi values for the apparent chemical diffusion coefficient of lithium muchhigher by one order of magnitude than in microsized oxide. Impedance behaviour of the ball-milled rutile�-MnO2 vs cycles demonstrates a new system takes place from the second cycle, characterized by a sig-nificant improvement of Li diffusion by a factor 5 and a cathode impedance which decreases by a factor2, remaining thereafter unchanged during cycling.
© 2011 Elsevier Ltd. All rights reserved.
. Introduction
In the field of cathode materials for secondary lithium bat-eries, manganese oxides have unique and important advantagesver other transition metal oxides due to their low toxicity, goodapacity and inexpensive cost. Manganese oxides exist in vari-us polymorphic forms and are made of MnO6 octahedra, theseasic units being linked by sharing edges and corners to give riseo different types such as �-, �-, �-, and �-types. For instancehe hollandite form exhibits (2 × 2) while �-MnO2 also calledyrolusite exhibits a rutile structure which contains the narrow-st (1 × 1) channels. �-MnO2 contains domains of intergrown-MnO2 and ramsdellite MnO2 with larger channels (2 × 1) and-MnO2 is characterized by a three dimensional network of chan-els. The lowest size of the channels available for Li transport inhe �-MnO2 oxide framework makes this electrode material can-ot provide much capacity. Indeed it has been found that the Liptake inserted chemically or electrochemically into crystallized
-MnO2 does not exceed 0.3 Li per mole of oxide at room tem-erature [1,2], and nearly 1 Li at temperatures around 100 ◦C and50 ◦C [3,4].∗ Corresponding author at: Institut de Chimie et des Matériaux Paris Est, GESMAT,MR 7182 CNRS-Université Paris XII, 2 rue Henri Dunant 94320 Thiais, France.
E-mail address: [email protected] (S. Bach).
013-4686/$ – see front matter © 2011 Elsevier Ltd. All rights reserved.oi:10.1016/j.electacta.2011.08.118
Very recently, nanostructured materials have stimulatednumerous works reporting the positive effect of the nanosizedoxide particles mainly because of their substantial advantages interms of mass transport [5–10]. Several groups have reported thatat room temperature nanometer-sized [11–14] and mesoporous[15,16] �-MnO2 show a higher electroactivity towards Li insertionthan the conventional bulk oxide with a maximum Li uptake inthe range 0.66–0.92 per MnO2 unit in the first discharge. �-MnO2nanomaterials with different morphologies have been synthesizedvia a hydrothermal route using Mn(NO3)2 solutions [11], mixturesof KMnO4 and MnCl2 [12] or by hydrothermal persulfate treat-ments of solid precursors like MnO and Mn2O3 [13] or by simpleheating a mixture of Mn(NO3)2 and acetylene black [14]. However,in spite of the afforded improvements, the electrochemical dataavailable on nanosized and mesoporous �-MnO2 only consist inthe discharge–charge profile for one or several cycles and cyclingdata obtained in various voltage windows such as 4.5–1.5 V, 5–1 V,4–1.5 V, 4.5–1 V. Even when the stark difference for the behaviour ofbulk and nanosized �-MnO2 is reported as being caused by kinetics,no work has focused on the kinetic of the electrochemical Li inser-tion reaction in nanosized �-MnO2 [11–16]. Li diffusion process inthe active material is essential for a good understanding of the cath-
ode performance. This lack of kinetic data on nanosized rutile MnO2prompted us to investigate using ac impedance spectroscopy thekinetics of the Li insertion process into nanosized rutile MnO2 pre-pared for the first time by ball-milling. The results reported here
ca Acta 56 (2011) 10016– 10022 10017
aL
2
2
ipmdsf
2
3ms
2
(etmt(migftmcct
eEqcstcr
3
dwpfw7rs(tma
80706050403020
Inte
ns
ity
2 Thet a
a : Mic rosi zed ma teria l
11
0
101
200
11
1
21
0
211
22
0
31
0
301,1
12
b : Nanosized MnO2
after ball -milli ng
Fig. 4. The first discharge curves of nanosized �-MnO2 at C/20(Fig. 4b) show a flat discharge plateau between 2.9 and 2.7 V.At room temperature, the comparison of the electrochemical
S. Bach et al. / Electrochimi
re discussed as a function of the lithium content x in nanosizedixMnO2 (0 < x ≤ 0.60) and cycles.
. Experimental
.1. Powder preparation
The procedure used to obtain nanometric pyrolusite �-MnO2ncludes two steps. �-MnO2 was first prepared by thermal decom-osition of Mn(NO3)2·6H2O at 300 ◦C during 5 h. The latter is namedicrosized material in the text. During this decomposition, oxi-
ation occurs leading to the formation of �-MnO2 [11,14,17]. In aecond step the latter was ground in a planetary ball mill at 500 rpmor 1 h, using tungsten balls and an agate jar.
.2. Structural characterization
XRD diffraction experiments were performed with a Inel Cps00 diffractometer using the Cu K� radiation (� = 1.54056 A). Theorphology of the sample has been examined with a Philips XL 30
canning electron microscope.
.3. Electrochemical measurements
The electrolyte used was 1 mol L−1 LiPF6 in ethylene carbonateEC) and DiEthyl carbonate (DEC) solution (1:2, v/v). The workinglectrode consisted of a stainless steel grid (12 mm diam., 0.2 mmhickness) with a geometric area of 1 cm2 on which the cathode
aterial was pressed (5 t/cm2). The cathode was made of a mix-ure of active material (80 wt%), acetylene black (7.5 wt%), graphite7.5 wt%) and teflon as binder agent (5%). The film is obtained by
ixing the oxide powder, carbon and teflon. Electrochemical stud-es were carried out in two-electrode cells (Swagelok® type) for thealvanostatic measurements and cycling tests. In that case a lithiumoil was used both as reference and auxiliary electrode. Galvanos-atic experiments were made with a MacPile apparatus. For GITT
easurements, each electrode was discharged by the application ofathodic current (100 �A) for 1 h. After this interval, the dischargeurrent was switched off and the potential of the electrode allowedo equilibrate up to voltage remained less than 0.2 mV for 1 h.
Impedance measurements were performed using a three-lectrode cell in the frequency range 4 × 10⁴–7 × 10⁻³ Hz with an.G.G. 273A apparatus connected with a Solartron SI 1255 fre-uency analyser driven by an IBM computer. The reference andounter electrodes consisted respectively of a lithium wire in aeparated compartment and a high surface gold wire. The excita-ion signal was 10 mV peak to peak. The equilibrium potential wasonsidered to be reached when the drift in open circuit voltageemained less than 0.2 mV for 1 h.
. Results and discussion
Fig. 1 shows the XRD diffraction patterns of the prepared pow-er compared with that of the starting compound (Fig. 1). Thehole pattern can be indexed on the basis of a �-MnO2 rutile singlehase (space group P42/mnm). The lattice parameters calculatedrom XRD data are a = 4.381 A and c = 2.877 A in good agreementith those of the starting material (a = 4.398 A and c = 2.873 A, JCPDS
1-0071). In the �-MnO2 rutile structure, each metal atom is sur-ounded by six oxygen atoms and octahedral share edges to formingle chains of octahedral extending along the c axis, giving a
1 × 1)-tunnel structure (Fig. 2). The broader peaks found for allhe diffraction lines of the nanosized powder prepared by ball-illing technique suggest a smaller grain size, corresponding to nanosized material. The mean crystallite size calculated from the
Fig. 1. Comparison of the X-ray diffraction patterns (Cu K�) of (a) the microsizedmaterial and (b) the nano-sized �-MnO2.
XRD pattern using Scherrer’s equation for (1 1 0) and (1 0 1) planeis 40 nm and 35 nm, respectively against few micrometers for thestarting material.
From SEM images (Fig. 3c and d), it can be seen the starting pow-der consists of large aggregates of ≈10 �m made of agglomeratedtaping micrometric grains with a rough surface. Compared to Fig.3c, the ball-milled sample exhibits smaller particles with an homo-geneous particle size distribution, in the range 100–200 nm (Fig. 3aand b). The particles seem to be interlocked and large voids appearwhich can promote an excellent soaking of the oxide material inthe electrolyte allowing then a high surface area to be available forelectrochemical experiments.
A comparison of the first discharge–charge profiles for themicrosized and the nanosized rutile �-MnO2 is reported in
Fig. 2. Crystal structure along the 0 0 1 direction of rutile �-MnO2. Mn is located inoctahedral sites.

10018 S. Bach et al. / Electrochimica Acta 56 (2011) 10016– 10022
nO2 (
bhi(cifo
Fad
Fig. 3. SEM micrographs of the nano-sized �-M
ehaviour between bulk and nanosized rutile clearly outlines theigher specific capacity exhibited by the nanosized compound,
.e. 190 mAh g−1 corresponding to a Li uptake of 0.62Li/�-MnO2Fig. 4b), about six fold greater than that found for the commer-
−1
ial �-MnO2 with only 30 mAh g (Fig. 4a). This capacity values in good accord with that found for �-MnO2 nanorods obtainedrom the hydrothermal persulfate treatments of various manganesexides [13] and nanotubes [12] or mesoporous �-MnO2 [16]. Larger1.5
2
2.5
3
3.5
4
4.5
0.70.60.50.40.30.20.10
1.5
2
2.5
3
3.5
4
4.5
0.70.60.50.40.30.20.10
200150100500
x in Lix
-MnO2
Specific Ca pacit y (mAh.g-1
)
a : C/20
Microsized
b : C/20
Nano sizedc : C/10
Nano sized
E v
s (
Li/L
i+)/
V E vs
(Li/L
i+ )/V
GITT Nanosized
ig. 4. Comparison of the first discharge–charge profiles of microsized (a: C/20)nd nano-sized rutile �-MnO2 (b: C/20; c: C/10) at room temperature. Inset: OCVischarge curve obtained from GITT measurements.
a and b) and the microsized material (c and d).
values near 1 Li per mole of oxide are reported in some cases for�-MnO2 nanocrystals/acetylene black composites [11] and meso-porous crystalline �-MnO2 [15]. Even at C/10, the specific capacityobtained with the ball-milled compound is much higher with120 mAh g−1 (Fig. 4c). Such an increase of the electrochemicalreactivity of �-MnO2 as the size of the crystallite decreases is inagreement with other works [11–14] and has been also reported inthe case of mesoporous �-MnO2 [15,16].
The charge process occurs in one step with a quasi-voltageplateau located around 3.2 V and then a continuous voltage increasefor Li extraction up to 4 V. As expected from previous works, an irre-versible capacity of 0.15 F/mol of oxide is observed correspondingto the trapping of 0.15 Li ions in the structure (Fig. 4b).
Cycling experiments for the nanosized �-MnO2 have been per-formed as a function of the C rate with the cycling limits 4.1–2 V(Fig. 5). After the irreversible capacity loss observed for the first
0
0.1
0.2
0.3
0.4
0.5
0.6
0.7
0
50
100
150
200
4035302520151050
x i
n L
i xβ-
Mn
O2
Sp
ec
ific C
ap
ac
ity/ m
Ah
g-1
Number of cycles
Nanosized C/20
Nanosized C/10
Nanosized C/2
Micr osized C/20
Fig. 5. Evolution of the Faradaic yield and the specific capacity for micro and nano-sized �-MnO2 as a function of the number of cycles and C rate performed in the4.1–2 V potential range.

S. Bach et al. / Electrochimica Acta 56 (2011) 10016– 10022 10019
1.5
2
2.5
3
3.5
4
4.5
0.70.60.50.40.30.20.10
200150100500
E v
s (
Li/
Li+
)/V
x in Lixββ-MnO
2
Specifi c Ca pacit y/ mAh g-1
1st
Cycle
[2-35]Th
Cycle
Fa
cctvaovbcfi1ItIsilcLtcew[
htaLoo1(asatttiali
80706050403020
Inte
ns
ity
2 Th eta
110
101
200
111
211
220
310
301
,11
2
a
b
c
+
311
+
+
where Vm is the molar volume of the compound
ig. 6. Comparison of the discharge–charge profiles of the nanosized rutile �-MnO2
t C/20 rate for cycles 1, 2, 5, 10, 20 and 35.
ycle, whatever the discharge–charge rate applied, an excellentapacity retention is observed at least for 35 cycles. Indeed, athe lowest rate (C/20), the capacity first declines from its initialalue of ≈185 mAh g−1 to remain stable from the second cyclet 150 mAh g−1. A similar attractive stability of the capacity isbtained even at a higher discharge rate (C/10) with a capacityalue of 90 mAh g−1 over at least 40 cycles. The excellent reversibleehaviour for the Li insertion reaction into nanosized �-MnO2an be directly seen in Fig. 6 where all the discharge–charge pro-les vs cycles 2–35 recorded at C/20 rate superimpose to deliver50 mAh g−1 without any capacity variation and any polarization.
t is noteworthy to observe that there is a significant change inhe discharge–charge profile vs cycles (shape, working voltage).ndeed, from the second cycle, the discharge–charge curves clearlyhow the same S-shape with a higher discharge potential (3.10 Vnstead of 2.8 V in the first discharge) and the disappearance of thearge hysteresis phenomenon seen in the first cycle. These newharacteristics seem to indicate that after the first cycle, furtheri intercalation takes place in a “new” host lattice correspondingo Li0.15MnO2 without any further phase transformation. Stableapacity values in the range 150–200 mAh/g can be found in lit-rature for cycling experiments performed in different voltageindows in the case of nanosized and mesoporous compounds
11–16].In order to get more information about the stability of the
ost lattice, we have compared XRD experiments for an elec-rode of nanosized �-MnO2 before cycling, after first dischargend after 35 cycles at C/20 (Fig. 7). For the discharged sample �-i0.6MnO2 the XRD pattern is not modified except a small shiftf some peaks showing a very low expansion of the a parameterf 4.424 A against 4.389 A for the pristine material, i.e. less than%, while the c parameter of 2.866 A is unchanged. After cyclingFig. 7c) all the typical diffraction peaks of the rutile structure stillppear with a slight intensity decrease and with no evidence of atructural transformation to spinel LiMn2O4 or other phases, the
and c lattice parameters of the cycled material being close tohat of the starting one with values of 4.426 A and 2.876 A, respec-ively. The present finding shows that lithium insertion progressesopotactically retaining the initial structure framework of �-MnO2n the potential window 4.1–2 V. Insertion of lithium ions provokes
weak expansion of the lattice parameter along these tunnelseading to a stress in the particle which is more easily releasedn a nanosized particle than in a large particle. Larger capacities
Fig. 7. (a) X-ray diffraction patterns for the nanosized rutile �-MnO2 (a), after firstdischarge (b) and after 35 cycles at C/20 rate (c) (+: graphite and stainless steel grid).
obtained in the enlarged cycling limits like 5–1 V as in [14] are pos-sible to be reached at the expense of a capacity decrease due to theemergence of the LiMn2O4 spinel phase.
The XRD data available on lithiated �-MnO2 are not detailedand are rather contradictatory. XRD experiments performed onnanosized �-MnO2 [14] indicate that Li insertion results in theemergence of a new tetragonal phase from x = 0.25 with the samesymmetry and a structure very close to that of the pristine material.A limited expansion of the lattice perpendicular to the (1 × 1) tunnelis found with the a parameter increasing by 3% while the c param-eter remains constant. However the new peaks of this tetragonalphase would be located with 2 theta shifts of a few degrees whichcannot account for an expanded phase with the same symmetry.In the case of mesoporous �-MnO2 a significant increase of the aparameter by 13% is surprisingly reported with a slight contractionof the c parameter [15]. From the present XRD data, Li insertion innanosized �-MnO2 proceeds through a solid solution process for0 < x ≤ 0.65.
Fig. 8 shows impedance diagrams obtained for x in the range0.1 ≤ x ≤ 0.5 in Lix�-MnO2. In a first approach, the Nyquist dia-grams do not significantly change with the lithium uptake. Threefrequency regions are observed. First, a well defined semi-circlewith a characteristic frequency f* of 280 Hz is always observedwith the same shape and magnitude and corresponds to the chargetransfer process. The charge transfer resistance, Rct is found to bealmost constant (60 �) with the lithium content x, showing thekinetics of the charge transfer does not significantly change with x.The exchange current density, j0, obtained with that known for Liinsertion compounds (j0 = RT/FRctS) is 0.45 mA/cm2 in good accordwith values reported on various cathodic materials [18–22]. In themedium-low frequency range (1.5 Hz–10−2 Hz), well defined War-burg regions are obtained, i.e. regions characterized by a straightline with a phase angle of 45◦ from the real axis. The Warburg regioncorresponds to a frequency range where the kinetics of the systemis almost entirely limited by the rate of the chemical diffusionalprocess in the host material under semi-infinite conditions.
The numerical values of the apparent chemical diffusion DLi arecalculated [23] using Eq. (1), when the angular frequency of the acpertubation ω � 2DLi/L2:
DLi =[
Vm(dE/dx)x
F√
S
]2
(1)
(=33.20 cm3 mol−1), S is the apparent geometric surface areaof the electrode (2 cm2) and (dE/dx)x is the slope, at fixed x, ofthe equilibrium potential composition curve (inset Fig. 4); L is the

10020 S. Bach et al. / Electrochimica Acta 56 (2011) 10016– 10022
0
50
100
150
200
250
250200150100500
-Z(i
m)/
(W)
-Z(i
m)/
(W)
-Z(i
m)/
(W)
-Z(i
m)/
(W)
300 Hz
0.2Hz
0.02Hz
a
0
50
100
150
200
250
300
350
350300250200150100500
Z(re)/W Z(re)/W
0.04Hz
1.5Hz
280Hz
c
0
50
100
150
200
250
250200150100500
300Hz
0.5Hz
0.02Hz
b
0
50
100
150
200
250
300
350300250200150100500
0.04Hz
1.0Hz
280Hz
d
in Lix�
mcsdooZciii
Fap
Z(re)/W
Fig. 8. AC impedance diagrams for various values of x
aximum length of the diffusion pathway (cm). In the presentase, determining L unambiguously is rather difficult. The 45◦
traight line is therefore considered as a criterion for semi infiniteiffusion behaviour, although this cannot be proven further basedn the frequency values. The analysis of the Warburg impedancef the system plotted in the complex plane −ZIm = Aω−1/2 orR = Aω−1/2 allows to get the Warburg prefactor A and then toalculate DLi for different x values. Fig. 9 illustrates the continuous
ncrease of A vs x in Lix�-MnO2. According to Eq. (1), this trendndicates a decrease in the apparent chemical diffusion DLi, when xncreases. More precisely, the evolution of the values for DLi vs x in0
20
40
60
80
100
120
543210
-Z(I
m)/
W
ω-1/2
A = 23.0 (x=0. 1)
A = 48.1 ( x=0 .4)
A = 30.9 (x=0. 2)
A = 49.0 ( x=0. 5)
A = 40.2 (x=0.05 )
ig. 9. Evolution of the imaginary part of the Warburg impedance—Zim vs ω−1/2
s a function of x in nanosized lithiated Lix�-MnO2 and evolution of the Warburgrefactor A vs x.
Z(re)/W
-MnO2, (a) x = 0.1, (b) x = 0.2, (c) x = 0.4 and (d) x = 0.5.
Lix�-MnO2 is reported in Table 1. Two sets of data are evidencedwith high DLi values for low lithium contents (x ≤ 0.2), between2 × 10−10–5 × 10⁻¹⁰ cm2 s−1. Then DLi slightly decreases to reachlower values around 1.2 × 10⁻¹⁰ cm2 s−1 before being stabilizedin the Li composition range 0.2 < x ≤ 0.5. The slower kinetics of Litransport evidenced for x ≥ 0.4 make the electrochemical perfor-mances of the material is affected when the C rate increases as itcan be observed on the discharge curves (Fig. 5). The Li transportis highly anisotropic since it occurs along the c direction in thesmall (1 × 1) tunnels where repulsive Li–Li interactions increase.This can explain the decrease of DLi with x insofar the rigid three-dimensional tunnel structure of the compound remains practicallyunchanged during Li accommodation (Fig. 7). Li transport is foundto be slower than in nanosized rutile TiO2 [22] by one order ofmagnitude for x = 0.2 and by half a decade for x = 0.5. The valuesreported in the present work are the first one for a nanosizedrutile MnO2. Using the Basu and Worrel’s potentiometric method
and the surface value as the apparent geometric surface area ofsimilar composite electrodes, lower values have been found for DLi(≈6 × 10⁻¹¹ cm2 s−1 for 0.02 ≤ x ≤ 0.08) in the microsized �-MnO2phase derived from Mn(NO3)2 precursor [2].Table 1Evolution of DLi vs the Li content x in Lix�-MnO2.
x in Lix�-MnO2 DLi (cm2 s−1 × 10⁻¹⁰)
0.05 1.80.1 5.40.2 3.00.4 1.20.5 1.2
S. Bach et al. / Electrochimica Acta 56 (2011) 10016– 10022 10021
0
50
100
150
200
200150100500
Rct
=60W
Rct
=80W
0
500
1000
1500
2000
2500
25002000150010005000
-Z(I
m)/
W -Z(I
m)/
W
Z(re)/W
Z(re)/W
10-3
Hz
10-3
Hz
F(
rs(stsbsettifm
eT
Ft
0
20
40
60
80
100
-Z(I
m)/
ω-1/2
A=20 .6 (2nd Cycle )
A=48.1 (1st
Cyc le)
A=17 .2 (2 0th
Cycle)
Li0.4
β-MnO2
0
20
40
60
80
100
543210
-Z(I
m)/
W
ω-1/2
A=20 .6 (2nd Cycle )
A=48.1 (1st
Cyc le)
A=17 .2 (2 0th
Cycle)
Li0.4
β-MnO2
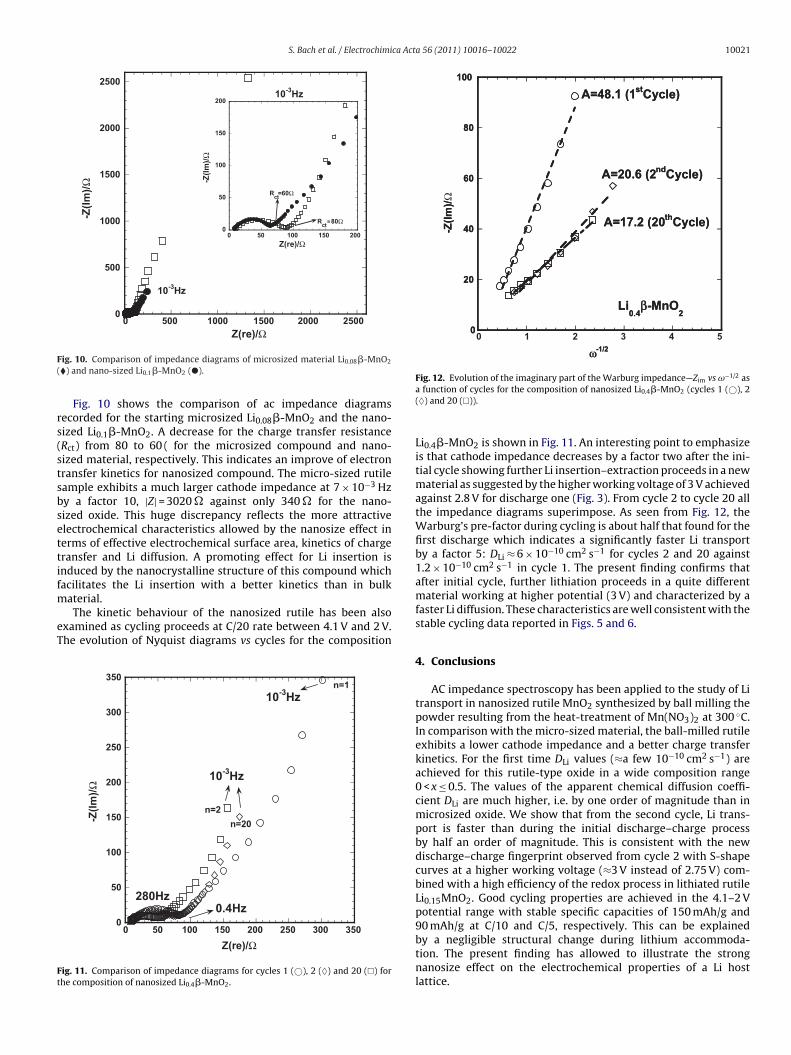
Fig. 12. Evolution of the imaginary part of the Warburg impedance—Zim vs ω−1/2 as
ig. 10. Comparison of impedance diagrams of microsized material Li0.08�-MnO2
�) and nano-sized Li0.1�-MnO2 (�).
Fig. 10 shows the comparison of ac impedance diagramsecorded for the starting microsized Li0.08�-MnO2 and the nano-ized Li0.1�-MnO2. A decrease for the charge transfer resistanceRct) from 80 to 60 ( for the microsized compound and nano-ized material, respectively. This indicates an improve of electronransfer kinetics for nanosized compound. The micro-sized rutileample exhibits a much larger cathode impedance at 7 × 10⁻³ Hzy a factor 10, |Z| = 3020 � against only 340 � for the nano-ized oxide. This huge discrepancy reflects the more attractivelectrochemical characteristics allowed by the nanosize effect inerms of effective electrochemical surface area, kinetics of chargeransfer and Li diffusion. A promoting effect for Li insertion isnduced by the nanocrystalline structure of this compound whichacilitates the Li insertion with a better kinetics than in bulk
aterial.
The kinetic behaviour of the nanosized rutile has been alsoxamined as cycling proceeds at C/20 rate between 4.1 V and 2 V.he evolution of Nyquist diagrams vs cycles for the composition
0
50
100
150
200
250
300
350
350300250200150100500
-Z(I
m)/
W
Z(re)/W
10-3
Hz
10-3
Hz
0.4Hz280Hz
n=1
n=2
n=20
ig. 11. Comparison of impedance diagrams for cycles 1 (©), 2 (♦) and 20 (�) forhe composition of nanosized Li0.4�-MnO2.
a function of cycles for the composition of nanosized Li0.4�-MnO2 (cycles 1 (©), 2(♦) and 20 (�)).
Li0.4�-MnO2 is shown in Fig. 11. An interesting point to emphasizeis that cathode impedance decreases by a factor two after the ini-tial cycle showing further Li insertion–extraction proceeds in a newmaterial as suggested by the higher working voltage of 3 V achievedagainst 2.8 V for discharge one (Fig. 3). From cycle 2 to cycle 20 allthe impedance diagrams superimpose. As seen from Fig. 12, theWarburg’s pre-factor during cycling is about half that found for thefirst discharge which indicates a significantly faster Li transportby a factor 5: DLi ≈ 6 × 10⁻¹⁰ cm2 s−1 for cycles 2 and 20 against1.2 × 10−10 cm2 s−1 in cycle 1. The present finding confirms thatafter initial cycle, further lithiation proceeds in a quite differentmaterial working at higher potential (3 V) and characterized by afaster Li diffusion. These characteristics are well consistent with thestable cycling data reported in Figs. 5 and 6.
4. Conclusions
AC impedance spectroscopy has been applied to the study of Litransport in nanosized rutile MnO2 synthesized by ball milling thepowder resulting from the heat-treatment of Mn(NO3)2 at 300 ◦C.In comparison with the micro-sized material, the ball-milled rutileexhibits a lower cathode impedance and a better charge transferkinetics. For the first time DLi values (≈a few 10−10 cm2 s−1) areachieved for this rutile-type oxide in a wide composition range0 < x ≤ 0.5. The values of the apparent chemical diffusion coeffi-cient DLi are much higher, i.e. by one order of magnitude than inmicrosized oxide. We show that from the second cycle, Li trans-port is faster than during the initial discharge–charge processby half an order of magnitude. This is consistent with the newdischarge–charge fingerprint observed from cycle 2 with S-shapecurves at a higher working voltage (≈3 V instead of 2.75 V) com-bined with a high efficiency of the redox process in lithiated rutileLi0.15MnO2. Good cycling properties are achieved in the 4.1–2 Vpotential range with stable specific capacities of 150 mAh/g and
90 mAh/g at C/10 and C/5, respectively. This can be explainedby a negligible structural change during lithium accommoda-tion. The present finding has allowed to illustrate the strongnanosize effect on the electrochemical properties of a Li hostlattice.
1 ica Act
R
[
[
[[
[[[[[[[
1365.
0022 S. Bach et al. / Electrochim
eferences
[1] D.W. Murphy, F.J. Salvo, J.N. Carldes, J.V. Waszczak, Mater. Res. Bull. 13 (1978)1395.
[2] M.M. Thackeray, A. Kock, L.A. Picciotto, J. Power Sources 26 (1989) 355.[3] B. Zachau-Christiansen, K. West, T. Jacobsen, S. Skaarup, Solid State Ionics 70–71
(1984) 401.[4] S. Bach, Thesis, Paris VI University, 1991.[5] E. Baudrin, S. Cassaignon, M. Koelsch, J.-P. Jolivet, L. Dupont, J.-M. Tarascon,
Electrochem. Commun. 9 (2007) 337.[6] Y.S. Hu, L. Kienle, Y.G. Guo, J. Maier, Adv. Mater. 18 (2006) 1421.[7] M. Anji Reddy, M. Satya Kishore, V. Pralong, V. Caignaert, U.V. Varadaraju, B.
Raveau, Electrochem. Commun. 8 (2006) 1299.
[8] H. Qiao, Y. Wang, L. Xiao, L. Zhang, Electrochem. Commun. 10 (2008) 1280.[9] A.R. Armstrong, G. Armstrong, J. Canales, R. Garcia, P.G. Bruce, Adv. Mater. 17(2005) 862.10] C. Jiang, I. Honma, T. Kudo, H. Zhou, Electrochem. Solid State Lett. 10 (2007)
A127.
[
[[
a 56 (2011) 10016– 10022
11] F. Cheng, J. Zhao, W. Song, C. Li, H. Ma, J. Chen, P. Shen, Inorg. Chem. 45 (2006)2036.
12] M. Yang, P. Ni, Y. Li, X. He, Z.-H. Liu, Mater. Chem. Phys. 124 (2010).13] I.Y. Kim, H-W. Ha, T.W. Kim, Y. Paik, J.-H. Choy, S.-J. Hwang, J. Phys. Chem. C
113 (2009) 21274.14] W. Tang, X. Yang, Z. Liu, K. Ooi, J. Mater. Chem. 13 (2003).15] F. Jiao, P.G. Bruce, Adv. Mater. 19 (2007) 657.16] J.-Y. Luo, J.-J. Zhang, Y.-Y. Xia, Chem. Mater. 18 (2006) 5618.17] W.H. Baur, Acta Crystallogr. 32 (1976) 2200.18] S.K. Mohapatra, J. Electrochem. Soc. 125 (1978) 284.19] G. Pistoia, J. Power Sources 125 (1983) 307.20] C. Leger, S. Bach, P. Soudan, J-P. Pereira-Ramos, Solid State Ionics 176 (2005)
21] S. Franger, S. Bach, J. Farcy, J.P. Pereira-Ramos, N. Baffier, Electrochim. Acta 48(2003) 891.
22] S. Bach, J.P. Pereira-Ramos, P. Willmann, Electrochim. Acta 55 (2010) 4952.23] C. Ho, I.D. Raistrick, R.A. Huggins, J. Electrochem. Soc. 127 (1980) 343.


![Lithium Electrochemical Tuning for Electrocatalysis€¦ · the interlayer of materials,[12] such as layered transition metal dichalcogenides (e.g., MoS 2) and lithium transition](https://static.fdocuments.net/doc/165x107/6061bb8d1b6ca92a3150bd5c/lithium-electrochemical-tuning-for-electrocatalysis-the-interlayer-of-materials12.jpg)

