A Hybrid Simulation and Hands-On Experimentation for ...
14
Georgia Southern University Georgia Southern University Digital Commons@Georgia Southern Digital Commons@Georgia Southern Electrical & Computer Engineering, Department of - Faculty Research & Publications Electrical and Computer Engineering, Department of 4-2015 A Hybrid Simulation and Hands-On Experimentation for Electric A Hybrid Simulation and Hands-On Experimentation for Electric Machines Laboratory Machines Laboratory Youakim Kalaani Georgia Southern University, [email protected] Rami J. Haddad Georgia Southern University, [email protected] Bikiran Guha Georgia Southern University, [email protected] Follow this and additional works at: https://digitalcommons.georgiasouthern.edu/electrical-eng-facpubs Part of the Electrical and Computer Engineering Commons Recommended Citation Recommended Citation Kalaani, Youakim, Rami J. Haddad, Bikiran Guha. 2015. "A Hybrid Simulation and Hands-On Experimentation for Electric Machines Laboratory." ASEE Southeastern Section Conference Gainesville, FL. source: http://asee.cs.southern.edu/openconf2015/modules/ request.php?module=oc_program&action=summary.php&id=61 https://digitalcommons.georgiasouthern.edu/electrical-eng-facpubs/24 This conference proceeding is brought to you for free and open access by the Electrical and Computer Engineering, Department of at Digital Commons@Georgia Southern. It has been accepted for inclusion in Electrical & Computer Engineering, Department of - Faculty Research & Publications by an authorized administrator of Digital Commons@Georgia Southern. For more information, please contact [email protected].
Transcript of A Hybrid Simulation and Hands-On Experimentation for ...

Georgia Southern University Georgia Southern University
Digital Commons@Georgia Southern Digital Commons@Georgia Southern
Electrical & Computer Engineering, Department of - Faculty Research & Publications
Electrical and Computer Engineering, Department of
4-2015
A Hybrid Simulation and Hands-On Experimentation for Electric A Hybrid Simulation and Hands-On Experimentation for Electric
Machines Laboratory Machines Laboratory
Youakim Kalaani Georgia Southern University, [email protected]
Rami J. Haddad Georgia Southern University, [email protected]
Bikiran Guha Georgia Southern University, [email protected]
Follow this and additional works at: https://digitalcommons.georgiasouthern.edu/electrical-eng-facpubs
Part of the Electrical and Computer Engineering Commons
Recommended Citation Recommended Citation Kalaani, Youakim, Rami J. Haddad, Bikiran Guha. 2015. "A Hybrid Simulation and Hands-On Experimentation for Electric Machines Laboratory." ASEE Southeastern Section Conference Gainesville, FL. source: http://asee.cs.southern.edu/openconf2015/modules/request.php?module=oc_program&action=summary.php&id=61 https://digitalcommons.georgiasouthern.edu/electrical-eng-facpubs/24
This conference proceeding is brought to you for free and open access by the Electrical and Computer Engineering, Department of at Digital Commons@Georgia Southern. It has been accepted for inclusion in Electrical & Computer Engineering, Department of - Faculty Research & Publications by an authorized administrator of Digital Commons@Georgia Southern. For more information, please contact [email protected].

2015 ASEE Southeast Section Conference
© American Society for Engineering Education, 2015
A Hybrid Simulation and Hands-On Experimentation for Electric Machines Laboratory
Bikiran Guha, Rami J. Haddad, Youakim Kalaani Electrical Engineering Department
Allen E. Paulson College of Engineering and Information Technology Georgia Southern University
Abstract
In this paper, we presented a hybrid approach to integrate hands-on experimentation with virtual simulation environment in an Electric Machines course. This was achieved by using Lab-Volt’s LVSIM-EMS software as a platform for the virtual simulation environment. The use of this simulation software allowed students to freely experiment and test various circuit designs before they actually conduct any physical experimentations. This hybrid approach helped promote lab safety and also avoid damaging the equipment due to random testing. In addition, it allowed for more student-centric experiments with less hazardous lab environment. A new experiment to derive the equivalent-circuits of a transformer was developed to implement and assess this new approach. We qualitatively assessed the impact of this laboratory setup using a survey questionnaire. Furthermore, pre and post assessments were used to quantitatively assess the impact of this hybrid approach. Results indicated that using this virtual simulation environment coupled with physical experimentation increased the students’ level of understanding of topics taught and also reduced equipment damage and maintenance cost. This conclusion was inferred as a result of our statistical analysis conducted for both cases.
Keywords
Simulation, Experimentation, Electric Machines.
Introduction
Instructional Laboratories have been an essential component in engineering education to solidify concepts learned in the classroom1. Lab experimentations also add the practical hands-on experimental skills addressed by ABET accreditation dealing with student learning outcomes2. Electric Machines course is one of the fundamental courses in Electrical Engineering programs and it is usually offered with an accompanied or standalone laboratory3. Electric Machines labs often use high power and 3-phase voltage equipment which limit the students’ ability to explore different settings due to safety considerations and close supervision4,5. This limitation was the main reason to introduce students to a software package to simulate the experiments as a pre-lab assignment before using the physical lab equipment. As a result, the students had the freedom to learn on their own without having to be concerned with personal safety or equipment damage due to high voltage. In addition, the software package helped students identify the proper way to carry out the experiment and learn from their mistakes. Consequently, students were able to learn faster since performing the simulation reinforced their understanding of the topic being covered.
2015 ASEE Southeast Section Conference
© American Society for Engineering Education, 2015
In recent years, the idea of using simulation software as an instructional tool has been gaining popularity in various universities across the nation. Software such as PSpiceTM and Flash were used to show animations of flux distribution in order to help students grasp the principles of electric machines and transformers6. Although these animations can help reinforce theoretical concepts, they are not designed to enhance the student understanding of the experimental setup. A web-based virtual electrical machines laboratory7 was developed using Adobe’s Captivate and mathematical models coded in JavaScript to simulate the behavior of the machines. This lab oriented software had a set of experiments related to DC machines in which students had to connect the components and visualize the results. LabVIEW software has also been used to simulate virtual experiments8,9 where students can perform proper circuit design and determine the operating characteristics of different machines. Therefore, virtual experiments help students to form a mental image of the circuit block diagram which can be translated into a physical model. It is a common practice that students are prone to make mistakes when conducting lab experiments which in high power labs can compromise safety or damage equipment. Lab-Volt simulation software was used before to replicate the exact lab environment10, however, it was not used as a pre-lab simulation tool to prepare for the physical experimentations. This paper presented a hybrid model using Lab-Volt simulation software to complement hands-on experimental hardware in a high power electric machines laboratory. A detailed example to experimentally derive the equivalent circuit of a transformer using simulation software and hardware is also presented.
Course Model
The proposed model is implemented in a 4-credit Electric Machines course with 3-hour lectures and 2-hours lab per week. This is a junior level course that is designed to cover the basic concepts of electric machines and transformers. Different types of DC/AC motors and generators are introduced including single-phase and 3-phase transformers. The course objectives are as follows:
1- Analyze the operation characteristics of series, shunt, and compound DC generators. 2- Analyze the operation characteristics of series, shunt, and compound DC motors. 3- Derive the equivalent circuits of a transformer and analyze its performance. 4- Derive the equivalent circuits of induction motors and analyze their operating
characteristics. 5- Derive synchronous machine models and analyze their operating characteristics.
The laboratory component associated with this course is designed to support instruction and validate learned concepts. Lab-Volt’s Electromechanical Systems Simulation Software (LVSIM-EMS) was chosen as the simulation platform in this study because it has all the features needed to simulate the actual lab environment11. The software contains images of all the electromechanical laboratory equipment that students need to interact with on the computer screen. Students can set up the required equipment into the workstation, make necessary connections, and verify the operation of the machines without actual hardware. LVSIM-EMS
2015 ASEE Southeast Section Conference
© American Society for Engineering Education, 2015
uses sophisticated mathematical models to simulate the operation of various EMS devices like the power supplies, motors, generators, transformers, electrical, and mechanical loads. Some of its most interesting features are:
Mimics the operation of the actual equipment using virtual modules. Mechanically connect machine modules using a timing belt. Metering instruments display voltage, current, powers, torque, speed, efficiency. Phasor analyzers and multi-channel oscilloscopes display waveform signals. Measured data is tabulated and used to generate graphs as needed.
The laboratory experiments used in this course are as follows:
Laboratory I: (3-Phase Power Measurement) In this experiment, the students will determine active and reactive power of balanced 3-phase circuits using both the two-wattmeter and three-wattmeter methods. (week-1 Simulation, week-2 Hardware)
Laboratory II: (Prime Mover and Brake Operation) In this experiment, students will use a Four-Quadrant Dynamometer/Power Supply to understand the operation of the prime mover and the brake. In prime mover mode, the opposition torque of the machine which is driven by the prime mover is measured. In brake mode, the output torque of the drive motor is measured using the dynamometer. (week-3 Simulation, week-4 Hardware).
Laboratory III: (Separately excited, shunt and compound DC generators) In this experiment, the students will learn the main operating characteristics of separately-excited, shunt and compound DC generators. They will become familiar with the relations between output voltage, speed and torque of a DC generator. (week-5 Simulation, week-6 Hardware).
Laboratory IV: (Separately excited, shunt and compound DC motors) In this experiment, students will learn to visualize the main operating characteristics of separately-excited, shunt and compound DC motors. They will become familiar with the relations between output voltage, speed and torque of the machine. (week-7 Simulation, week-8 Hardware).
Laboratory V: (Distribution Transformers) In this experiment, students will learn the basic concepts of distribution transformers. Throughout the experiment, the students will be measuring line voltages and currents and will observe how a distribution transformer behaves under various loading scenarios. (week-9 Simulation, week-10 Hardware).
Laboratory VI: (Transformer equivalent circuit design) In this experiment, students will derive the equivalent circuit of a single phase transformer using open-circuit and short-circuit tests. The experiment is used as an example in this paper and it is discussed in details in the next sections. (week-11 Simulation, week-12 Hardware).
Laboratory VII: (Voltage and current relationships) In this experiment, students will determine the voltage and current ratios of 3-phase transformers in both delta-wye and wye-delta configurations. The measurements of the primary and secondary voltages in such configurations will demonstrate the phase shift between incoming and outgoing sides of the transformer. (week-13 Simulation, week-14 Hardware).

2015 ASEE Southeast Section Conference
© American Society for Engineering Education, 2015
Laboratory VIII: (Three phase squirrel cage induction motor) In this experiment, students will learn the operating characteristics of a squirrel cage induction motor and plot graphs which depict the relationships between the motor voltage, current and torque. (week-15 Simulation, week-16 Hardware).
Experimental vs. Simulation Implementation
The goal of this experiment is to derive the equivalent circuit of a single-phase transformer using open-circuit and short-circuit tests. Students were asked to design the experiment and write the setup procedure. In this experiment, the students were asked to design the experiment and write the setup procedure for a 60VA, 120/208V, multi-purpose Lab-Volt transformer module.
The equivalent circuit of a transformer is usually used to determine various aspects of the transformer’s operation such as efficiency and maximum fault currents. To simplify calculations, the equivalent circuit is typically transferred to one side of the transformer using impedance reflection techniques. The simplified equivalent circuit of a transformer depicted in Figure 1 is referred to the primary side. As shown, V1 and V2 are the primary and secondary voltages, I0 is the No-Load current, I1 is the primary current and I2 is the secondary current referred to the primary side. Rm and Xm represent the core loss resistance and the magnetizing reactance respectively. Rp and Xp represent the total windings resistance and the total leakage reactance respectively. Rm and Xm are obtained from the open-circuit test measurements while Rp and Xp are obtained from the short-circuit test measurements.
Figure 1- Simplified transformer equivalent circuit
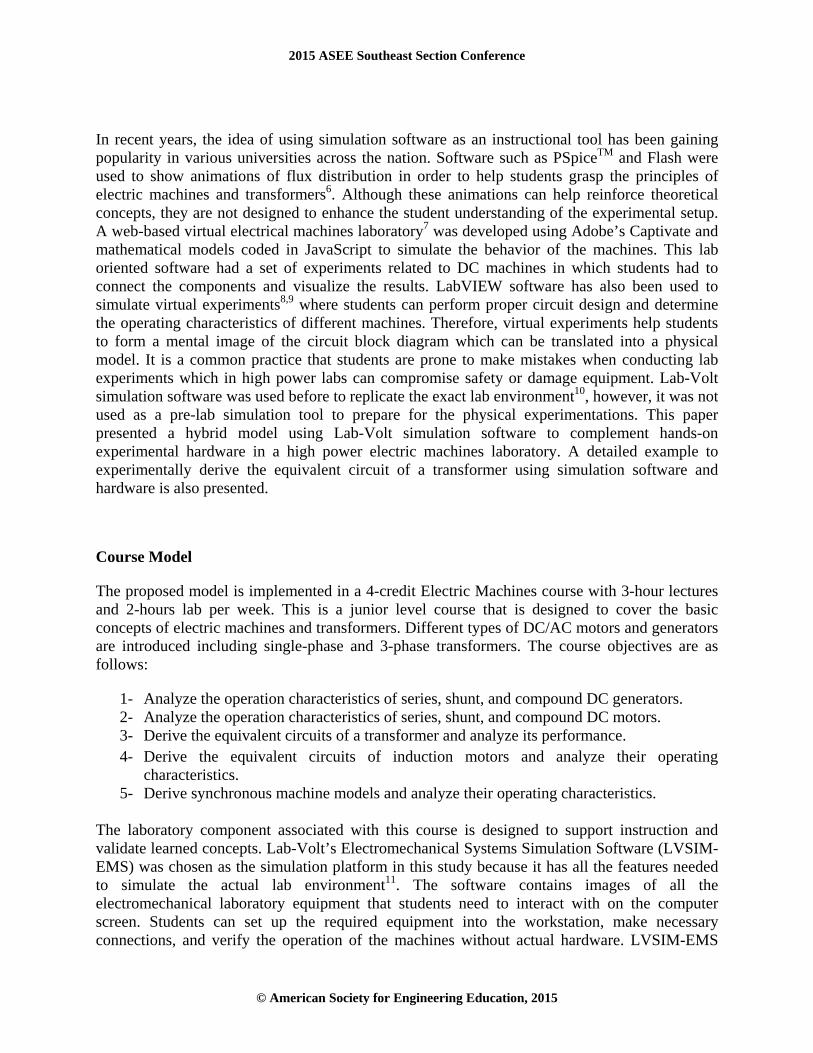
The setups shown in Figure 2, parts (a) and (b), represent the open-circuit test conducted using both simulation and actual hardware. For the open-circuit test, one side of the transformer is open circuited while the rated voltage is applied on the low voltage (LV). As shown, the inputs from the 120V power supply are connected to terminals 1 and 2 of the transformer. Meters E1 and I1 on the Data Acquisition module measure the voltage and the current on the LV side. Real power and reactive power measure the eddy currents and hysteresis losses directly. From these measurements, Rm and Xm can be derived by:
where subscript oc stands for open-circuit, VOC: Applied rated voltage, IOC: No-Load current
2015 ASEE Southeast Section Conference
© American Society for Engineering Education, 2015
POC: Measured real power, QOC: Measured reactive power
It should be noted that the data acquisition module provides real and reactive power values directly from the voltage and current measurements.
(a) (b)
Figure 2- Open circuit test setup in (a) Simulation software (b) Actual hardware
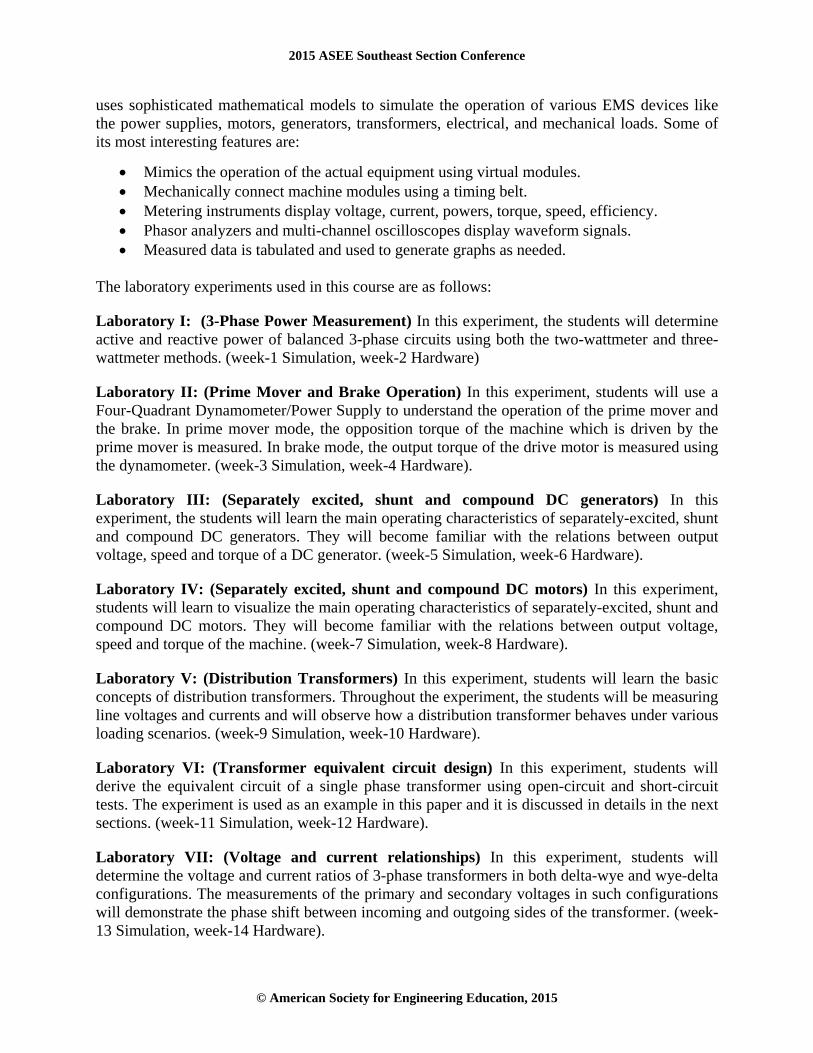
Similarly, Figure 3, part (a) and (b), show the setup for the short-circuit test conducted for both virtual and actual hardware respectively. In this test, the LV side of the transformer (terminals 1 and 2) is shorted and the input power is applied to the high voltage (HV) side (terminals 3 and 4). E1 and I1 are measured on the HV side. Vsc is set to a lower value so that Isc does not exceed the rated value of the transformer.
(a) (b)
Figure 3- Short circuit test setup in (a) Simulation software (b) hardware
The real power measured (Psc) represents the ohmic losses and the reactive power (Qsc) represents the leakage losses. Rp and Xp can be derived as:
where Psc, Qsc, and Isc are the short-circuit test measurements.
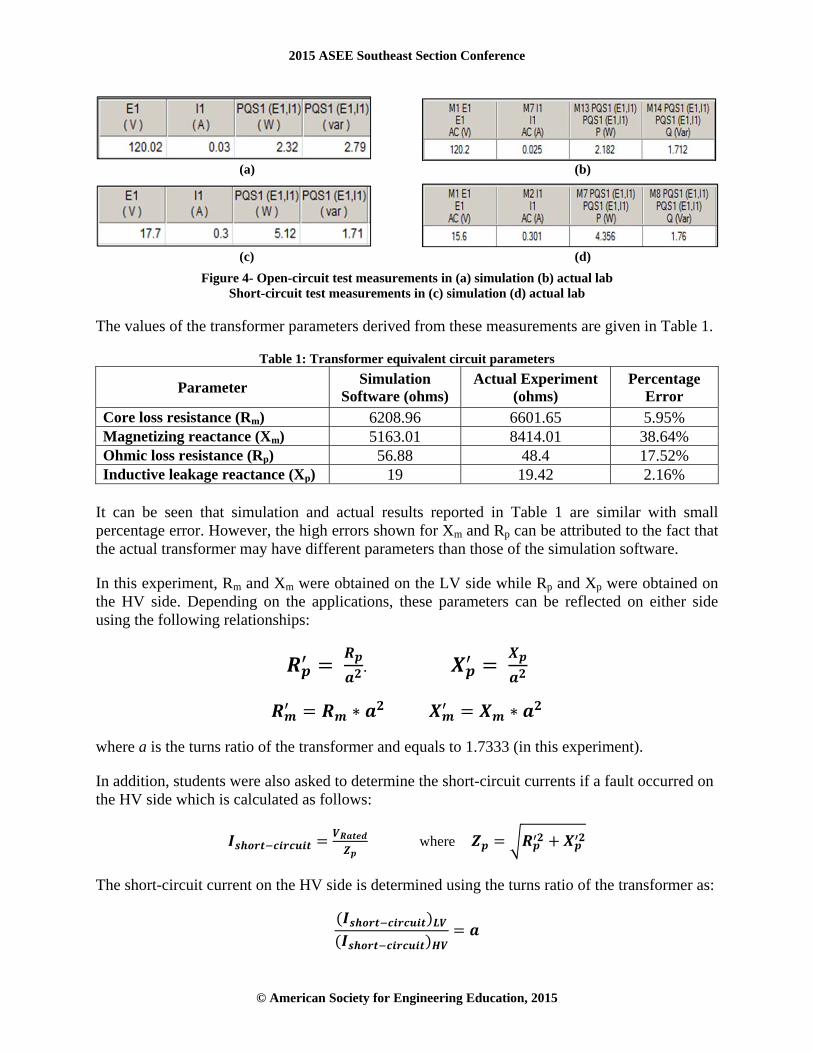
Figure 4 shows the measurements obtained from conducting the simulation as well as the actual lab experiment. As shown, both results were found to be comparable.
2015 ASEE Southeast Section Conference
© American Society for Engineering Education, 2015
(a) (b)
(c) (d)
Figure 4- Open-circuit test measurements in (a) simulation (b) actual lab Short-circuit test measurements in (c) simulation (d) actual lab
The values of the transformer parameters derived from these measurements are given in Table 1.
Table 1: Transformer equivalent circuit parameters
Parameter Simulation
Software (ohms) Actual Experiment
(ohms) Percentage
Error Core loss resistance (Rm) 6208.96 6601.65 5.95% Magnetizing reactance (Xm) 5163.01 8414.01 38.64% Ohmic loss resistance (Rp) 56.88 48.4 17.52% Inductive leakage reactance (Xp) 19 19.42 2.16%
It can be seen that simulation and actual results reported in Table 1 are similar with small percentage error. However, the high errors shown for Xm and Rp can be attributed to the fact that the actual transformer may have different parameters than those of the simulation software.
In this experiment, Rm and Xm were obtained on the LV side while Rp and Xp were obtained on the HV side. Depending on the applications, these parameters can be reflected on either side using the following relationships:
.
∗ ∗
where a is the turns ratio of the transformer and equals to 1.7333 (in this experiment).
In addition, students were also asked to determine the short-circuit currents if a fault occurred on the HV side which is calculated as follows:
where
The short-circuit current on the HV side is determined using the turns ratio of the transformer as:
2015 ASEE Southeast Section Conference
© American Society for Engineering Education, 2015
Finally, the efficiency and the voltage regulation of the transformer were determined by connecting a purely resistive load on the HV side so that rated current is drawn from a 120V source connected to the LV side using the following equations:
%
∗
% ∗
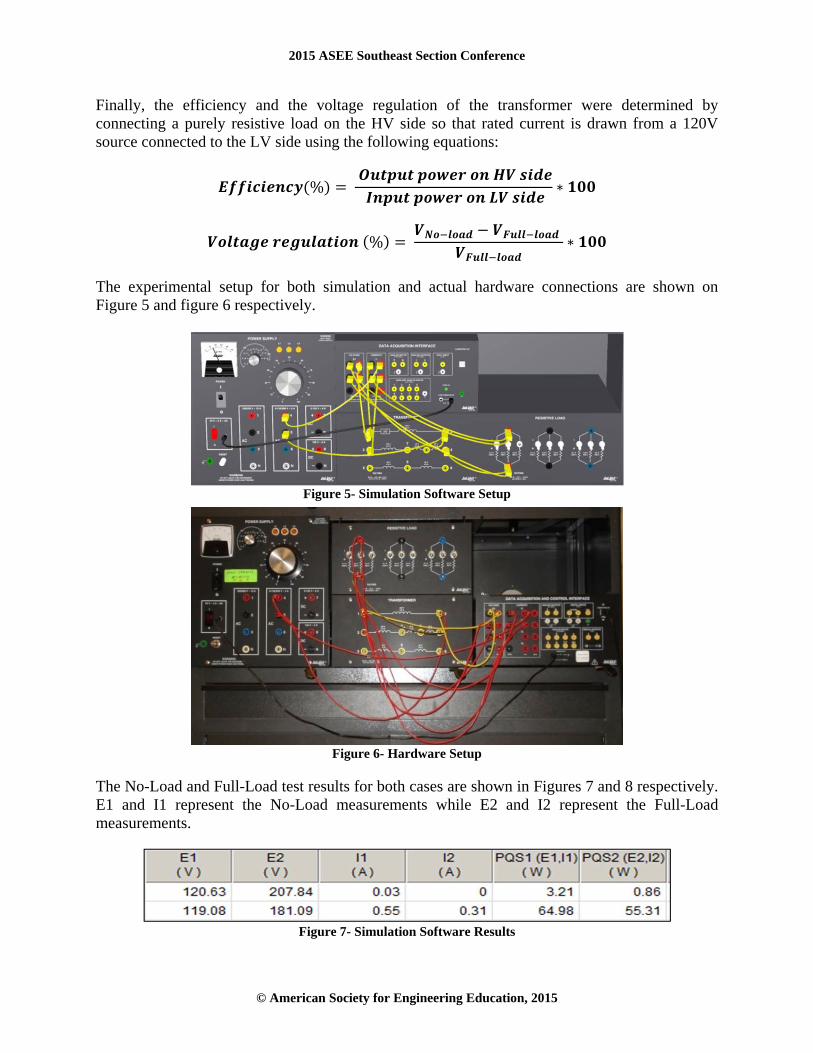
The experimental setup for both simulation and actual hardware connections are shown on Figure 5 and figure 6 respectively.
Figure 5- Simulation Software Setup
Figure 6- Hardware Setup
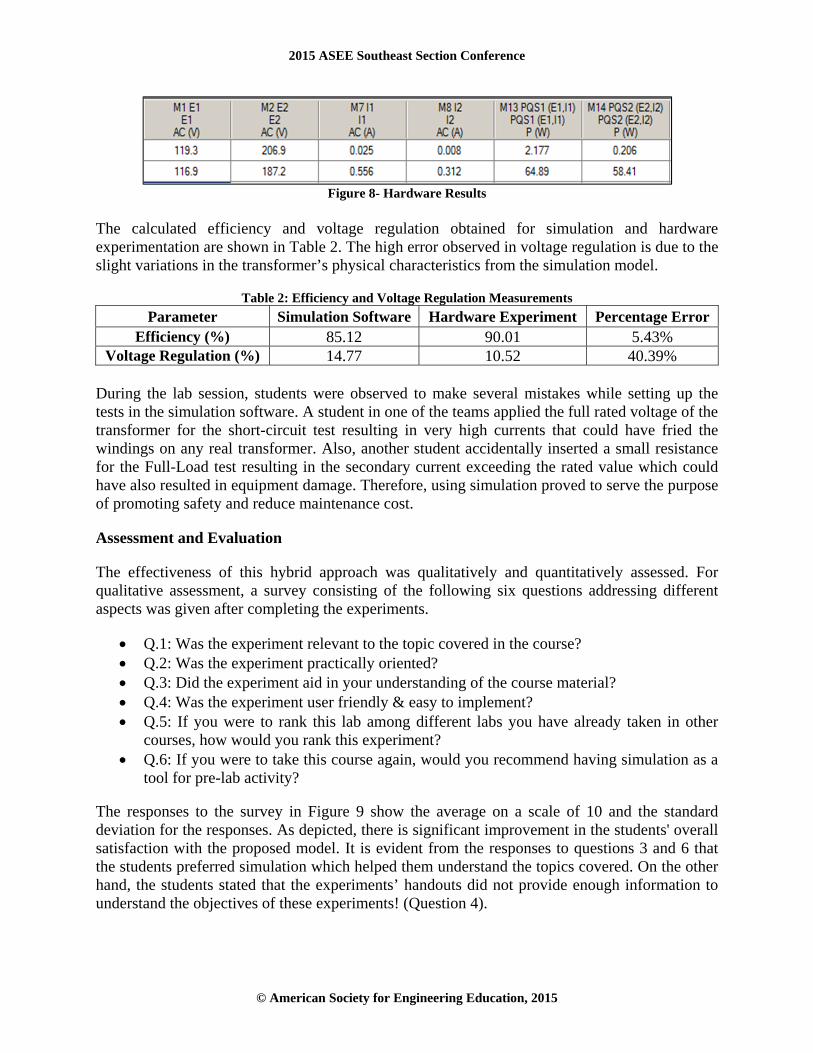
The No-Load and Full-Load test results for both cases are shown in Figures 7 and 8 respectively. E1 and I1 represent the No-Load measurements while E2 and I2 represent the Full-Load measurements.
Figure 7- Simulation Software Results
2015 ASEE Southeast Section Conference
© American Society for Engineering Education, 2015
Figure 8- Hardware Results
The calculated efficiency and voltage regulation obtained for simulation and hardware experimentation are shown in Table 2. The high error observed in voltage regulation is due to the slight variations in the transformer’s physical characteristics from the simulation model.
Table 2: Efficiency and Voltage Regulation Measurements
Parameter Simulation Software Hardware Experiment Percentage Error Efficiency (%) 85.12 90.01 5.43%
Voltage Regulation (%) 14.77 10.52 40.39% During the lab session, students were observed to make several mistakes while setting up the tests in the simulation software. A student in one of the teams applied the full rated voltage of the transformer for the short-circuit test resulting in very high currents that could have fried the windings on any real transformer. Also, another student accidentally inserted a small resistance for the Full-Load test resulting in the secondary current exceeding the rated value which could have also resulted in equipment damage. Therefore, using simulation proved to serve the purpose of promoting safety and reduce maintenance cost.
Assessment and Evaluation
The effectiveness of this hybrid approach was qualitatively and quantitatively assessed. For qualitative assessment, a survey consisting of the following six questions addressing different aspects was given after completing the experiments.
Q.1: Was the experiment relevant to the topic covered in the course? Q.2: Was the experiment practically oriented? Q.3: Did the experiment aid in your understanding of the course material? Q.4: Was the experiment user friendly & easy to implement? Q.5: If you were to rank this lab among different labs you have already taken in other
courses, how would you rank this experiment? Q.6: If you were to take this course again, would you recommend having simulation as a
tool for pre-lab activity? The responses to the survey in Figure 9 show the average on a scale of 10 and the standard deviation for the responses. As depicted, there is significant improvement in the students' overall satisfaction with the proposed model. It is evident from the responses to questions 3 and 6 that the students preferred simulation which helped them understand the topics covered. On the other hand, the students stated that the experiments’ handouts did not provide enough information to understand the objectives of these experiments! (Question 4).

2015 ASEE Southeast Section Conference
© American Society for Engineering Education, 2015
Figure 9- Results of the Student Survey
For the quantitative analysis, the students' performance was assessed using pre and post exams. Figure 10 demonstrates the normal distribution fit for the performance of a total of 15 students in a pre and post exams related to deriving the transformer equivalent circuit.
Figure 10- Fitting the Pre & Post Exam Grades into Normal Distributions A thorough statistical analysis of the results was conducted using the Minitab statistics software12. The null hypothesis indicating no statistical difference between the pre and post exam grades was assumed. To test this hypothesis, the General Linear Model was used to analyze the data with probability criterion for 1% (p=0.01) significance level. If the analysis generated a p-value less than the 0.01, then the null hypothesis would be rejected meaning that the proposed model is in fact useful. The response variable was the students' grades obtained in pre- and post- exams. The first factor is the treatment effect modeled by the difference in the pre and post exam
0
2
4
6
8
10
Q.1 Q.2 Q.3 Q.4 Q.5 Q.6
Scale
Survey Questions
Average Std Dev
100.0
50.0
01.0
51.0
02.0
52.0
03.0
53.0
2- 0 2 4 6 8 01 2
8.467 1.506 153.933 2.658 15
Mean StDev N
G
ytisneD
sedar
PmaxE
bal-erPbal-tso
H lamroN
sedarG fo margotsi
2015 ASEE Southeast Section Conference
© American Society for Engineering Education, 2015
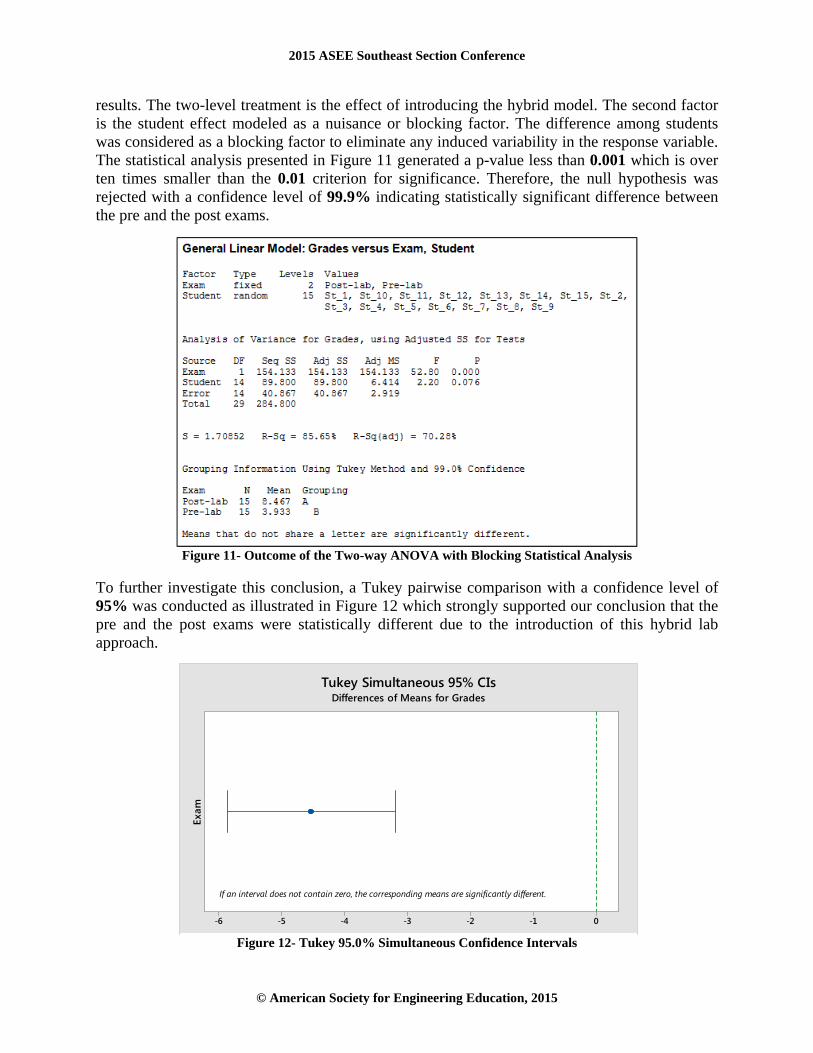
results. The two-level treatment is the effect of introducing the hybrid model. The second factor is the student effect modeled as a nuisance or blocking factor. The difference among students was considered as a blocking factor to eliminate any induced variability in the response variable. The statistical analysis presented in Figure 11 generated a p-value less than 0.001 which is over ten times smaller than the 0.01 criterion for significance. Therefore, the null hypothesis was rejected with a confidence level of 99.9% indicating statistically significant difference between the pre and the post exams.
Figure 11- Outcome of the Two-way ANOVA with Blocking Statistical Analysis
To further investigate this conclusion, a Tukey pairwise comparison with a confidence level of 95% was conducted as illustrated in Figure 12 which strongly supported our conclusion that the pre and the post exams were statistically different due to the introduction of this hybrid lab approach.
Figure 12- Tukey 95.0% Simultaneous Confidence Intervals
0-1-2-3-4-5-6
Exam
If an interval does not contain zero, the corresponding means are significantly different.
Tukey Simultaneous 95% CIsDifferences of Means for Grades

2015 ASEE Southeast Section Conference
© American Society for Engineering Education, 2015
To test the model's goodness of fit, the probability plot of the grades was generated as shown in Figures 13 and 14. The data points in Figure 13 relatively follow the straight line generating a p-value over 0.05 and a low adjusted Anderson-Darling statistic (AD). This implied that the pre-exam grades were normally distributed. However, the post-exam grades illustrated in Figure 14 exhibited a p-value less than 0.05 and a relatively high AD statistic. This is another indication that the post-exam grades were no longer normally distributed with an impact not only on the grades’ mean but also on the students’ overall grade distribution.
Figure 13- Probability Plot of Pre-Exam Grades
Figure 14- Probability Plot of Post-Exam Grades
Conclusions
In this paper, a hybrid approach was presented to integrate hands-on experimentation with a virtual simulation environment for an Electric Machines Lab. We discussed the details of the experimental procedure and the assessments of student’s performance before and after conducting the experiment. It was shown that using simulation as a training tool served the
151050-5
99
95
90
80
706050403020
10
5
1
Mean 3.933StDev 2.658N 15AD 0.265P-Value 0.642
Grades
Perc
ent
Probability Plot of GradesNormal - 95% CI
Exam = Pre-lab
151050-5
99
95
90
80
706050403020
10
5
1
Mean 8.467StDev 1.506N 15AD 0.767P-Value 0.036
Grades
Perc
ent
Probability Plot of GradesNormal - 95% CIExam = Post-lab

2015 ASEE Southeast Section Conference
© American Society for Engineering Education, 2015
purpose of promoting safety and avoiding equipment damage. It also rendered the experiments more student-centric by encouraging students to experiment risk-free and learn from their own mistakes. Assessment results have shown that students’ understanding of the topic covered was highly reinforced after completing the experiment which encourages the extension of this approach to other courses in the future. In addition, this study highlighted the importance of a hybrid experimentation approach using simulation Even thought, the Lab-Volt’s Electromechanical Systems Simulation Software (LVSIM-EMS) can be used as a standalone simulation platform without the need for the Lab-Volt hardware; working with both provided the optimal results. The simulation labs can be used as a pre-lab component for any electric machines course. It is also recommended that proper training on how to use the software tool should be provided to students prior to the actual experiments. In addition, students should also be encouraged to set their own experiments instead of following the step-by-step instructions provided by the software user guide as a way to develop the student creativity and design skills.
References
1 L. D. Feisel and A. J. Rosa (2005), “The Role of the Laboratory in Undergraduate Engineering Education,” Journal of Engineering Education, vol. 94, pp. 121-130, Jan. 2005.
2 R. M. Felder and R. Brent. (2003), “Designing and Teaching Courses to Satisfy the ABET Engineering Criteria,” Journal of Engineering Education, vol. 92, pp. 7–25, Jan 2003
3 J. Park, (2012), “Design and Implementation of a Fundamental Electric Machine Laboratory Using Industrial Devices”, Proceedings of 2012 Annual Conference of American Society for Engineering Education.
4 C. Martin, H. Hedesiu, L. Szabo, B. Tataranu, F. Jurca and C. Oprea (2006), “Electrical Machines Virtual Laboratory: Grid Connection of a Synchronous Generator”, 12th International Power Electronics and Motion Control Conference, pp.1709-1714, Aug.-Sept. 2006.
5 H. Aintablian and J. Spurlin, (1996), “Development of an Undergraduate Electrical Machines Laboratory”, Conference Record, Southcon/96., pp.265-268, Jun. 1996.
6 C. Yeh and M. Rathod (2001), “Enhanced Electric Machines and Power Course”, Proceedings of 2001 Annual Conference of American Society for Engineering Education.
7 N. Gong, B. Butz, L. Bai and S. Biswas (2014), “A Realistic Intelligent Multimedia Virtual Laboratory for Power Engineering”, Proceedings of 2014 Annual Conference of American Society for Engineering Education.
8 R. Belu (2010), “Virtual Laboratory for Study of the Electric Machines Parameters and Characteristics”, Proceedings of 2010Annual Conference of American Society for Engineering Education, 2010.
9 K. Chen and A. Stankovic (2007), “Building a Modern Power Electronics and Electric Machines Laboratory”, Proceedings of 2007Annual Conference of American Society for Engineering Education.
10 Y. Kalaani and A. Azad (2002), “Teaching Electric Machines and Power Electronics: Emphasis and Challenges”, Proceedings of 2002 Annual Conference of American Society for Engineering Education.
11 Lab Volt - LVSIM-EMS Software (2013). [Computer software], Festo Didactic Inc. https://www.labvolt.com/solutions/6_power_energy/
12 Minitab 17 Statistical Software (2010). [Computer software]. Minitab, Inc. http://www.minitab.com/en-us/
Bikiran Guha
Bikiran Guha is currently a graduate student and a lecturer in the Department of Electrical Engineering at Georgia Southern University. He received his B. Tech. degree in Electrical Engineering from West Bengal University of Technology, Kolkata, India. His research interests

2015 ASEE Southeast Section Conference
© American Society for Engineering Education, 2015
include power systems applications in smart grid, interconnection of renewable energy resources and engineering education.
Rami J. Haddad
Rami J. Haddad is currently an Assistant Professor in the Department of Electrical Engineering at Georgia Southern University. He received his B.S. degree in Electronics and Telecommunication Engineering from the Applied Sciences University, Amman, Jordan, his M.S. degree in Electrical and Computer Engineering from the University of Minnesota, Duluth, MN, and his Ph.D. degree from the University of Akron, Akron, OH. His research focuses on various aspects of optical fiber communication/networks, broadband networks, multimedia communications, multimedia bandwidth forecasting and engineering education.
Youakim Kalaani
Youakim Kalaani is an Associate Professor of Electrical Engineering in the Department of Electrical Engineering at Georgia Southern University. Dr. Kalaani received his B.S. degree in Electrical Engineering from Cleveland State University (CSU). He graduated from CSU with M.S. and Doctoral degrees in Electrical Engineering with concentration in power systems. Dr. Kalaani is a licensed professional engineer (PE) and an ABET Program Evaluator (PA). He is a member of IEEE and has research interests in distributed power generations, optimization, and engineering education.