A human adventure and a technological · PDF fileinherent to their business. ... cash...
158
A human adventure and a technological success
Transcript of A human adventure and a technological · PDF fileinherent to their business. ... cash...

A human adventure anda technological success
�

�Table of contents02 I Message from the Chairman04 I International presence06 I Vision and strategy16 I Offshore22 I Towage & Salvage25 I Bulk28 I Results & performance32 I Corporate Governance

01
BOURBON is recognized and esteemed as a major international player in marine services, with a serviceoffer in three segments: offshore oil and gas, towage and salvage, and bulk shipping. From vessel designto operation, in each of these segments, BOURBON is developing an expertise based on service quality,safety, technological innovation, professional rigor and a long-term relationship with its clients.
With its fleet of over 300 vessels managed and in operation, BOURBON is implementing an ambitiousinvestment strategy (1.45 billion euros over 5 years).
Present in more than 25 countries and faithful to the pioneer spirit that has driven its growth, BOURBONrelies on the talents, diversity and corporate spirit of nearly 4,700 employees to win new global marketswith high added value services and technologies.
�Profile
A major international player in marine services
Three Divisions, three specialties
Backed by a fleet of more than 350 vessels in operation or underconstruction at the end of March 2007,Bourbon Offshore assists oil operatorsaround the world by offering thema broad range of modern offshoreresources and services, particularly in thehigh-growth deepwater offshore market.
Through its companies Les Abeilles and Les Abeilles International, BOURBONis one of the world's leading towageoperators. With a fleet of 83 tugs in operation or under construction, this Division guarantees its customers the best marine safety conditions and assists them in controlling the risksinherent to their business.
Setaf Saget manages a fleet of modernbulk carriers and transports for its customers nearly 20 million tons of dry bulk products, on every ocean on the planet and to all destinations.
Offshore Division Towage & Salvage Division Bulk Division
� � �

02
From audacious challenger to leader in modern offshore oiland gas marine services
Jacquesde ChateauvieuxChairman and Chief Executive Officer
�Message from the Chairman
In 2006, with revenues of 717.6 millioneuros (+16.8% compared to 2005 withconstant scope of consolidation), BOURBONturned in a very strong performance. The Offshore Division has posted +30% in average annual growth over four years. The growth in profits primarily reflects the increase in daily rates, the growth in the fleet, and the income from sales of offshore vessels. Operating income totaled 181.4 million euros, up 44.2%. Net income group share amounted to 152.9 million euros and compares favorablywith the result in 2005 (excluding the gainon the sale of the Vindémia stock). In this context, a dividend of 0.60 euro per share (+20%) will be paid out and one bonus share for every ten held will be allotted to shareholders.
With 31 vessels delivered in 2006,BOURBON's overall growth under the 2003-2007 plan is a reflection of its policyto make major investments in the fleet.The Offshore Division's objectives for growth,profitability, and financing were fully achievedwithin a favorable economic context. In linewith the plan, the asset disposals and thecash generated by the operations havefinanced the investments and dividenddistributions at the level planned. The successof this first plan has clearly been driven bythe remarkable work performed bythe women and men of BOURBON aroundthe world. Their commitment has reducedour rate of accidents with work shutdownby nearly 25%. Their professionalism in commissioning innovative vessels and their responsible attitude and team effortform the crucial foundation for makingBOURBON the preferred company of our customers.
Early in 2006, we announced the BOURBONHorizon 2010 plan, with the following main objectives over the next 4 years (2007-2010):• average growth of 12% a year in revenues,including 20% in the Offshore Division;• an investment of 1.45 billion euros in vessels, 85% of which are intended for the offshore fleet; • an objective for 2010 of a gross return onaverage capital employed of 16%,corresponding to a margin of gross operatingincome to revenues of 40%.

03
KEY DATES IN THE GROWTH OF BOURBON
1948 Set-up of Sucreriesde Bourbon, which rapidlybecomes the leading sugargroup on La Réunion.
1989 Groupe Bourbondiversifies its activities in thefood-processing business, thenin retail and marine services.
1996 Purchase of Les Abeillesand Setaf Saget.
1998 Groupe Bourbon is listed for trading on the Second marché ofthe Paris Stock Exchange.
2001 The group refocuseson marine services andgradually withdraws from its non-strategic operations.
2005 Groupe Bourbonreaffirms its marine identity and becomes BOURBON.
2006 BOURBON completesits strategic plan a year ahead of schedule and announces its news goals in the BOURBONHorizon 2010 plan.
2007 BOURBON confirms its leadership positionin modern offshore oil and gas marine services, with a fleet of an average age of 6.5 years.
We believe the assumptions for growth in the offshore market are realistic and prudent.The orders placed with shipyards guaranteethe successful completion of the investmentplan in terms of both price and delivery. High service prices and customer willingnessto commit to long-term contracts are bothpositive factors in achieving our objectives.This is why most of our efforts are todayfocused on the mobilization and training ofthe human resources needed around the world. Finally, in a context of higher costsfor equipment, service providers andpersonnel, our efforts will continue to focuson controlling costs. The strategy is clear, themarket is growing, and the implementation of the BOURBON Horizon 2010 strategicplan is under control.
Given the changes in our industry,BOURBON's positioning is unique in themarket for offshore oil and gas marineservices. In just a few years, BOURBON hasmade massive investments to become a leader in the deepwater offshore market.The new plan is geared to continuing ourincrease in market share in this segment, but also to acquire a strong position in thecontinental offshore segment by offeringcustomers our next generation fleet toreplace the obsolete vessels in the market,most of which were built between 1974 and 1984.As a result, BOURBON has set a targetto commission 1 new vessel every 12 daysover for four years. The innovative and highlyproductive vessels for customers are built inseries in competitive shipyards. This strategyensures real industrialization and greateravailability of our fleet, along with anoptimum cost price.
The men and women of BOURBON areenthusiastic and legitimately proud of servingthe world's most demanding customers usingthe most modern fleet.
We must, however, remain prudent workingat sea and vigilant when circumstancesdisrupt operations and endanger our crews.The tragic accident of the Bourbon Dolphincost the lives of eight of our colleagues. More than ever, safety remains a priority for BOURBON. Thus, as soon as thecircumstances and reasons for this tragedyhave been identified, we will ensure that all necessary measures are taken by theentire offshore industry so that such an accident will not occur again. By placing people at the center of ouradventure, we will find strength in our solidarity.

04
Corporate offices,offices, sites andsubsidiaries
* Rigdon Marine: a company in whichBOURBON holds a stake.
�With a global presence, BOURBON offers to all of its customers a recognized and valued experience andexpertise. BOURBON operates locally in more than 25 countries, close to its customers, meeting their expectationsand the most specific requirements.
�International presence
International influence

05
4,685employeesworldwide
79%of revenues generatedoutside France
Presentin more than
25 countries
CONTINUED GROWTH
■ The year 2006 was highlighted by the development of new sites and an extension of local partnerships, a reflection of the group's policy of ongoing deployment in thestrategic regions where its customers are located. The set-up of two new subsidiaries,Bourbon Gulf in Qatar and Bourbon Offshore Triangle in Egypt, along with BOURBON'spartnership with Naviera Tamaulipas in Mexico and Rigdon Marine in the United Statesillustrate the group's goal to provide a local response to the expectations and moststringent technical and safety requirements of its customers around the world.
�
Strong local roots with customers

�Vision and strategy
06
AFTER ADVANCING IN JUST A FEW YEARSFROM ITS POSITION AS AUDACIOUSCHALLENGER TO ITS POSITION AS LEADER IN MODERN OFFSHORE OIL AND GASMARINE SERVICES, BOURBON ISDEVELOPING A UNIQUE STRATEGY TO INTENSIFY ITS LEADERSHIP IN A HIGH-GROWTH SECTOR.

The Horizon 2010 plan�At the end of 2006, BOURBON had completed its 2003-2007 strategic plan one year ahead of schedule,
by implementing an investment program of over one billion euros. The new Horizon 2010 strategic plan wasannounced early in 2006.
Objective
+12%annual growth in revenues
Objective
1 vesseldelivered every 12 days
07
Abeille Spartel and Abeille Malabata, during their arrival at the Tangiers Med site, whose
commercial opening is scheduled for July 1, 2007.
| Ambitious objectivesBy 2010, BOURBON is targeting:
• revenue growth of 12% per year, including +20% for the Offshore Division with a doubling of the number of vessels;
• a ratio of EBITDA (gross operating income)to average capital employed of 16% in 2010;
• investments of 1.45 billion euros, 85%of which will be dedicated to the OffshoreDivision and generally self-financed.
| A buoyant environmentSector indicators suggest a very favorable marketover the next 5 to 7 years in modern offshore oil and gas services. In addition to the internationaloil companies, which are investing to maintaintheir reserves, state-owned companies in theemerging countries are establishing positions in the market and changing the situation.Deepwater offshore is expanding to meetincreased consumption and offset the decline of existing fields, with the anticipation of a growthrate of 8 to 12% per year. At the same time, the continental offshore market, faced with the need to replace its fleet, which is now old and technically obsolete, is expected to grow by at least 16% a year. In this context of strongdemand, access to the marine services market is limited by two factors: first, the bottleneck at the main equipment suppliers and shipyardsand, second, the shortage of qualified humanresources to man the modern vessels.
| A unique positioning Against this backdrop, BOURBON isimplementing a unique strategy, withoutequivalent among its rivals. By capitalizing onthe assets of its current fleet and investment in rapid and steady growth, BOURBON intendsto transform its main competitive advantage into a decisive edge. This strategy is primarilybased on the following components:
• massive investments in modern vessels,including offshore vessels, tugs or bulk carriers:Bourbon Offshore's next generation fleet will be able to operate in both the deepwater and continental offshore segments. By targetingthe old vessel replacement market, BOURBONwill be the sole operator in the market in a position to offer continental offshorecustomers the technological excellence of deepwater offshore;

• a search for optimized costs, withan absolute priority given to compliance withBOURBON's safety and operational standards,primarily through the construction in series of innovative vessels in shipyards located in competitive countries;
• an ambitious recruitment and trainingprogram to double the workforce of the OffshoreDivision by 2010, and the gradual application of BOURBON training standards.
| True partnershipsBOURBON's partnership policy is the foundation for its international growth and is based on:
• all types of partners — state-ownedoil companies, the offshore industry, port operators, local groups, sector experts, etc.
• legal and contractual structures adaptedto the local context, from wholly-ownedsubsidiaries to collaboration with agents or brokers, and including majority, 50/50 or minority partnerships, with or without vessel ownership.
This principle increases the local componentand offers global flexibility and customizedservices adapted to the needs of theinternational, regional or local markets.
08
1.45billion euros in investments by 2010
�Vision and strategy
4 KEY FACTORS FOR SUCCESS
SAFETY ■ Safety is the common thread thatruns through all of BOURBON'sknowledge and expertise; it is theguiding spirit behind the organizationand management of the company interms of operating procedures as wellas personal attitudes.
INNOVATION■ Technological choices and innovativeconcepts for vessels offering highproductivity.
HUMAN RESOURCES■ International recruitment, trainingand development, personal satisfactionand growth are BOURBON's threeassets that will help it to achieve itstarget to double the number of officersand seamen in the Offshore Division by 2010.
COST CONTROL■ A homogeneous fleet built in series,generating a positive cycle of costcontrol in construction, operations and maintenance.
�

The next generation fleet: performance through production in series
X-Bow™a system that improveshandling at sea and reduces dragresistance
Diesel-electrican economical and environmentallyfriendly propulsion method
�Innovation in the BOURBON fleet is based on two key points: first, an innovative design resulting fromdeepwater offshore experience which has led to a next optimized generation of multi-use and high-performancevessels and, second, the principle of series construction, a highly innovative concept in offshore construction.
| Technology and performanceWith its next generation fleet, BOURBON offers its customers high-performancetechnological solutions for productivity, safety and environmental protection. The series, which were ordered in 2006 and 2007, will again improve the already high standard for the equipment and quality of the BOURBON fleet.
• 24 PSV and 54 AHTS, new generation, GPA design vessels, will be delivered graduallyuntil 2011. Intended for deepwater and continental offshore, they are equipped with the latest technologies. The diesel-electricpropulsion and the DP2 dynamic positioning give them greater maneuverability and optimized carrying capacity to operate under the best safety conditions.
• A series of 4 Ulstein PX105 MACS PSV, supplyvessels with a deadweight of 4,400 tons, offersthe benefits of major innovations: X-Bow™ inverted bow; the PG-MACS™ system (MultiApplication Cargo Solution), which increases hold storage capacities and offers tank versatility;the positioning of engine exhaust at the waterline,which eliminates the chimney and allows a 360-degree panoramic view from the bridge.This series, which has been certified “Clean design” by the DNV company, meets the highest requirements for quality, environment and comfort.
• 20 multi-purpose tugs under construction,including 4 with 100 tons of bollard pull, whichare powerful, compact and highly maneuverablethanks to their azimuth 360-degree propellers,can be operated at offshore and onshore Energy terminals.
09
Left:The inverted bow of the Bourbon Orca,
an AHTS vessel delivered in 2006 and named vessel of the year.
Right:Automated vessel management system,
terminal on the bridge.

10
| Series production and cost control The principle of building innovative vessels in series in countries with competitive costs, like China, leads to lower costs overall, i.e.:
• a reduction of 15 to 30% in constructioncosts, while complying with quality and safetystandards through an original cooperative effortamong naval architects, equipment vendors,experienced shipyards and BOURBON to share expertise;
• standardization of training in order to guarantee an equivalent level around the world: crew training on simulators,harmonization of skills, enhanced expertisethrough the sharing of best practices;
• lower maintenance and service costs:industrialization of maintenance services,reduced parts inventories, optimized responsetimes, easy replacement during technicalshutdowns, and more.
The first two hulls of the GPA 654 series ordered in China, with delivery scheduled in the first half of 2008.
CleanClassA classification that meets the most stringent environmentalcriteria
�Vision and strategy
BOURBON ORCA, A “REVOLUTIONARY” AHTS
■ The Orca is a “Clean class” AX-104vessel that offers multiple innovations:automated work quarterdeck equippedwith the SAHS system (Safe AnchorHandling System), inverted X-Bow™,diesel-electric propulsion associatedwith azimuth thrusters. This vessel hasjust revolutionized the standards foroffshore oil and gas service vessels interms of safety, navigational comfort,fuel savings and the reduction of gasemissions. Delivered in 2006, it hasbeen a success with the customer andwas named “Ship of the Year” by theNorwegian magazine Skipsrevyen.
�

■ Dynamic positioning training center ■ Dynamic positioning training school vessel ▲ Anchor handling operations simulator
Recruitment and training: an ambitious program
�By 2010, Bourbon Offshore will double its work force by recruiting nearly 3,000 seamen. To meet thischallenge with the highest standards for quality and excellence, BOURBON, which is the leading recruiter of Frenchmerchant marine officers, is developing an international recruitment and training program.
In a context marked by a shortage of officers, the recruitment challenge cannot be separatedfrom training needs. Convinced that shipownersmust be the drivers in modernizing marinetraining, BOURBON has initiated a deliberatelyproactive approach, based on the innovativeconcept of public-private partnership and on a training mechanism extended to all its recruitment regions. The goal is to establishand guarantee BOURBON training standards for crews and officers.
| Two Bourbon Offshore trainingcenters in Marseilles and Manila After initiating in Marseilles, in 2004, and in partnership with local and nationalinstitutions, the first training center for dynamicpositioning was made accessible to allshipowners and seamen. BOURBON is intensifying its efforts by creating the BOURBON-Hydro offshore oil trainingcenter. This center will be fully operational by the end of 2007 and will offer, in addition to the existing programs (DP1, HL02, Safety,etc.), simulator anchor handling training to supplement the training already offered inNorway by the center at the University Collegeof Aalesund. In Manila in the Philippines, a center identical to the center in Marseilles will open in 2008. These three centers will allow BOURBON to guarantee a uniformtraining policy in the main recruitment and operational zones.
| Three school vesselsThree BOURBON school vessels will help to speed up training in the operational zones.Currently planned in West Africa and LatinAmerica, they can be moved to Asia or any other
region that requires them. They are genuinemobile training centers designed to ensuremaximum flexibility in meeting BOURBON's global training needs.
| A policy of training in BOURBON standardsThe BOURBON training policy is designed in accordance with the group's internationalstandards and adapted to the local context. As a result, in the absence of certified localstructures, Angolan officers study in the bestschools in South Africa, while Nigerian officerscan be trained in dynamic positioning in Singapore. The group also supports localtraining centers, like the GEPMARE privatemarine training school in Cameroon.
TRAINING EVERYWHERE IN THE WORLD�
11
168
3,034
2,694
2,378
3,490
2003 2004 2005 2006
+15%
BOURBON staff in the marine divisions:

Safety: a state of mind�Safety, in both operating procedures and personal attitudes, is at the very core of quality and performance.
BOURBON structures its organization and management around safety using a global approach, standardizedprocedures and equipment, and a top-down organization to strengthen the “safety spirit” of its crews.
| Three key components of the Safety policy Placed under the authority of the group's QHSE(Quality, Health, Safety and Environment)Director, who reports directly to the ExecutiveCommittee, BOURBON's safety program is based on three primary components:
• the implementation of a global safetymanagement system in all subsidiaries,through an ongoing improvement process that continually enhances the experience gained and ensures the application of the same procedures and the use of the samedocumentation on board any vessel inoperation; the safety standards of the offshorefleet are being gradually extended to allDivisions in order to guarantee customers the most stringent safety standards for any service offered;
• technological choices that lead to improvedoperating methods and a better work environment; the next generation fleet is equipped with innovative, in-series systemsthat ensure better control of the vessel duringoperations, improve bridge and equipmentergonomics, and facilitate the application of safety procedures;
* Tanker Management Self Assessment.
12
�Vision and strategy
TMSA*,a stringent safetystandard applied by BOURBON
TOOLS FOR HOMOGENEOUSAND CONSISTENT FLEETMANAGEMENT: “ULYSSES”
■ The QHSE module of the “Ulysses”fleet management application, which isdedicated to safety, combines in a singledata base the instruction documents forthe safety management system and theincident reports. This tool offers accessto reliable data updated in real time,thus accelerating feedback. After a testphase, the “Ulysses” system is graduallybeing deployed to all the bases and theoffshore fleet. This consistency toolhelps users, officers and base managersto change the way they work to adopt a homogeneous methodology thatmakes a significant improvement to safety.
�

13
SECURE ANCHOR HANDLING 100% AUTOMATED
■ Developed in partnership with ODIM and Ulstein Design, the SAHSsystem (Safe Anchor Handling System) used on the Bourbon Orca will revolutionize vessel safety for anchor handling operations. Thanksto the aft deck equipped with two powerful mobile cranes mountedwith articulated grappling hooks, remote activated video surveillancesystem and mobile platform system, anchor handling can now beperformed without a human presence during the dangerous phases,thus eliminating any risk from handling the equipment or cable failure.
�• crew awareness and training, so that the daily behavior of each crew member reflects a concern for safety; in order to adapt to thediversity of cultures in its subsidiaries and crews,the group is implementing a very flexibleapproach, based on the empowerment of localteams by adapting to the specific features of each geographical area.
| A "top-down" organizationA permanent team of operational and safetytraining captains travels worldwide to list needs,set up safety teams, and coordinate training. In each zone in which BOURBON operates, a safety manager implements action programsand ensures the application of specificprocedures adapted to the operating region.With a unit of about fifteen persons dedicatedto safety matters, who are backed by a “top-down” management structure,BOURBON relies on the training of captains,officers and shore base managers, who thentrain the crews and regularly lead onboardworkshops. To do this, they have very concretetools (QHSE charter, safety induction booklet,follow-up tables, films, posters, stickers, etc.)relayed by the “4C Safety” communicationsplan that facilitates information feedback.
Each subsidiary organizes safety meetingsintended to establish the relationship betweenmanagement and crews in order to develop the safest work procedures. At the internationallevel, the safety committee consists of the mainsafety managers in the subsidiaries andcoordinates all actions. Finally, a yearly seminaris held to all safety officers in all Divisions.
Left: Crew preparing for an anchorhandling operation.
Right:Crews working to transfer crates.

Sustainable development: an approach evolving around historical values
�The ethical behavior of BOURBON and respect for its values contribute every day to the developmentof the group. A number of actions have already been initiated in the field. Concerned about meeting thechallenges for the planet and the need for fair development that is both sustainable for the environment and socially responsible; the BOURBON Executive Committee has appointed a working group with the goalof designing a sustainable development policy adapted to its businesses. The quality of our relations with our customers and partners, the quality of our human resources and management, our ability to control risksand our respect for the environment, the quality of our corporate governance and organization are all decisive factors for BOURBON's future.
14
| Governance: a priority for transparency BOURBON is working to integrate gradually the bestcorporate governance practices and its executivesaim to serve as examples of the greatest possibletransparency, as demonstrated by:
• a reasonable policy for executive compensation;
• stock options granted to a wide circle of over450 beneficiaries;
• the establishment of compensation and audit committees that rely on internal control
and rigorous risk monitoring;
• the inclusion of independent directors on theBoard of Directors. These efforts to promotetransparency in management and informationwere recognized in 2006 by the “Mid-CapCorporate Governance” prize awarded by AGEFI.
| BOURBON employees: no growth without sharing Respect for cultural differences is one of BOURBON's key values, arising from its origins on the Reunion Island. This is one of its growth drivers, along with cooperation,empowerment and solidarity. In light of theprojected 60% increase in the number of BOURBON employees by 2010, employeesatisfaction, combined with personal andprofessional growth, is a defining objective ofthe company's human resource management:
• a priority on local recruitment in all its operatingregions, with recognition of national certificationsand sharing of responsible positions;
• access to homogeneous training in BOURBONstandards for all employees worldwide;
• career advancement based on merit withoutdiscrimination,
• signature, in 2006, of the Charter of BusinessCommitment to Equal Opportunity in Education,with a diversity Charter planned in 2007.
THE BOURBON VALUES
BOURBON's success is founded on shared values.■ Professional, because the demand for quality, the appropriation of new technologies, ongoing training, the search for perfect control ofthe business are the keys to reliable service and customer satisfaction. ■ Responsible, because our future successes will depend on ourattention to safety, quality, health, and respect for the environment.Those successes are backed by the responsibility and independence of management.■ Enthusiastic, because enthusiasm is an intense emotion thatallows every person to grow in the performance of his mission andcommunicates the desire to excel. ■ United, within BOURBON, and towards its partners, suppliers,customers and the like… because it is together that we will find theresources to achieve the most ambitious of our shared goals.
�
�Vision and strategy

15
| Local development: partnership and solidarity BOURBON's international growth is taking place in large part in the emerging countries(west coast of Africa, Asia, Latin America, etc.)primarily through joint ventures with localpartners, within a framework of shared expertiseand benefits, and with a concern for providingmaximum local content. Through its behavior,BOURBON aims to do its part, within its sphereand as far as possible, to reduce North-Southinequalities, i.e. by recruiting and training localcrews, extending health cost coverage tofamilies, providing financial and logistical supportfor local projects and initiatives, promoting ship building in local shipyards, and more.
| Environment:formalizing our practices The following three major factors influence the environmental footprint left by BOURBON's operations:
• its young and modern fleet, which offers the latest developments in equipment and is in line with the highest standards;
• the growing share of diesel-electric propulsionon board the offshore vessels, which reducesgas emissions by lowering consumption by about 20%, or even more depending on the type of operations. The order book for newvessels will help to emphasize these two factorsin the coming years;
• a major in-house campaign to increaseemployee awareness of environmentally friendlypractices, soon to be launched by BOURBON,which will focus on employees recycling and reducing waste at source. BOURBONalready implements a voluntary safety policyand intends to extend it to the environment,
targeting gradual ISO 14001 certification for its various entities. Finally, actions to protect the coastline, property and persons in theservice of the French Navy are the daily tasks of the tugs of Les Abeilles International and theanti-pollution vessels of Bourbon Offshore Surf,the Alcyon, Ailette and Argonaute. In 27 years,nearly 750 operations have been carried out.
SIGNATORY OF THE BLUE CHARTER
■ BOURBON is a signatory of the Blue Charter of French shipowners,which sets forth 5 commitments: • to continually improve the safety andquality of the vessels • to protect the marine and coastal environment • to guarantee good living and working conditions for crews • to governcompanies with transparency and good ethical practice • to be unitedwithin the marine community.
�

�Offshore
16

A unique positioningin the offshore market
�A leader in offshore oil and gas marine services, Bourbon Offshore assists its customers to develop their operations all over the world by offering them a broad range of services and next generation, powerful and multi-purpose vessels, adapted to the demands of both deepwater and continental offshore. With its focus on safety and operational standards, Bourbon Offshore guarantees a high and consistent level of quality.
156next generationvessels (average age:3.9 years)
149vessels underconstruction at theend of March 2007
17
Left: Bourbon Mistral, a supply vessel (PSV) with invertedbow of Bourbon Offshore Norway, “Clean class”.
Right:Crew working to transfer crates to a platform.
| A multi-purpose, modern and high-performance fleet With 156 next generation modern offshorevessels and 149 vessels on order, to meet the technological revolution taking place todayin the offshore businesses, Bourbon Offshorehas a full line of vessels for deepwater andcontinental offshore services. Its fleet is one of the most modern on the market:
• Multi Purpose Supply Vessels (MPSV), which perform multiple maintenance operationson the oil fields and offer sophisticated featuressuch as dynamic positioning, fire-fighting,deepwater handling, and helicopter platforms;
• Anchor Handling Tug Supply Vessels(AHTS), which move and install oil platforms.Equipped with powerful engines and winches,they tow drilling rigs, position and raise anchors,and deploy a variety of oil productionequipment;
• Platform Supply Vessels (PSV), which supplyoffshore facilities. In addition to their vast cargodeck area, which allows the transport of all kindsof equipment, they offer very large below deck storage capacities for specialized drillingproducts and fuel;
• terminal tugs, dedicated to assistance andoperations at offshore oil and gas terminals;
• Fast Supply Intervention Vessels (FSIV),to provide emergency supplies and transportresponse teams;
• Crew Boats, which carry personnel to the oil sites.

�Offshore
18
6.5 yearsis the average age of the 193 operatingvessels (3.9 years for the modernoffshore fleet)
A trail-blazer in safety and environmentalrequirements, BOURBON anticipates marketchanges and insists on going beyond currentstandards and regulations in order to offer its oil customers the highest standards of quality.Equipped with the most innovative technologies,the flagships of the fleet are proof of thatcommitment: new more efficient hulls like the inverted bow (Ulstein X-Bow™ design), thesecure anchor handling systems, diesel-electricpropulsion, exhaust treatment systems, doublehulls to contain environmental damage in theevent of accidental leaks. These innovations,already installed on Bourbon Orca and the PSVs Bourbon Mistral and Bourbon Monsoon, have earned the “Clean” and “Clean design”classifications. By applying to the marine sectoran industrial concept proven over years inaeronautics, BOURBON is homogenizing its fleet with long-term commitments to partnershipyards. These series orders optimize both the delivery times and the quality of the vessels
– each unit under construction benefits from the experience acquired, which then allowsstreamlined management and maintenance. In line with its strategic plan, Bourbon Offshorecommissioned 31 new vessels in 2006.
| A complete service offer The Offshore Division crews, who are highlyqualified for each of their missions, operate all ship classes in deepwater and continentaloffshore. The fleet of 193 operating vessels,which will be gradually expanded by the 149 vessels on order or under construction at the end of March 2007, offers extendedavailability to our customers. In line with its leading-edge spirit, BOURBON has developedan expanded line of services, based on vesselsdesigned for highly technical operations andexperienced crews trained in the extremelydemanding businesses of deepwater offshore.By listening to its customers, BOURBON assiststhem in their development and regularly
Operating Vessels under Total As %vessels construction of the fleet
156 112 268 88%
37 0 37 12%
193 112 305 100%
Modern offshore
Traditional offshore
TOTAL
The Bourbon Offshore fleet at December 31, 2006

19
BOURBON OFFSHORE GAIA,AN EXPERT IN DEEPWATER OPERATIONS
■ The high-growth deepwater offshore segment requires radically newmaintenance operations at depths that can reach 1,800 meters andmore. A specialist in inspection, maintenance and repair services (IMR),Bourbon Offshore Gaia intervenes very early in the operations, adaptsthe vessels to the specific demands of their missions, performs theoperational engineering and manages the operations at the customer'srequest. Thanks to close collaboration with the other subsidiaries ofBourbon Offshore, like in Angola with Sonasurf, Bourbon Offshore Gaiais a service provider able to propose to the majors of the oil industry a complete offer that includes both engineering and services.
From left to right:. The AHTS Bourbon Surf preparing for a platformscraping operation in the North Sea.
. Transfer of crates to the Athena at sea in Congo.
. Luzolo, an AHTS with 165 tons of bollard pull, near a semi-submersible platform in Angola.
expands its service offer. As a result, thesubsidiary Bourbon Logistics Indonesia, set up at the end of 2005 in partnership with a majorlocal player, will offer its oil customers starting in 2007 the logistical services essential to theiractivity: jetty services, office and accommodationinfrastructures, dry docking, storage areas,handling equipment, and more.
| Proximity and true partnership:two key assets For about fifteen years, the offshore oil markethas been undergoing a structural change, withan increase in national and local state-ownedoperators alongside the historical majors. Familiar with both types of operators,BOURBON knows how to adapt to theirdifferent corporate cultures. The internationalgiants, the majors and supermajors of the oilindustry, today represent more than 50% of therevenues of the Offshore Division with newcustomers. The Division's customers alsoinclude more state-owned companies, likePetrobras in Brazil, Sonangol in Angola and even, since 2006, Pemex in Mexico and ONGC (via Transocean) in India. Operating all over the world, close to its local or international customers, BourbonOffshore is developing close cooperation with these customers. To better adapt to each regional context, Bourbon Offshore has always favored a true partnership with local, private and public companies.
These partnerships, based on pooled capital,expertise and management, guarantee the best conditions for integration in the country. They generate synergies in multiple areas:technical expertise and skills, knowledge of the field, human resources, etc. Since 1999,Sonasurf in Angola has been an historic exampleof the success of this policy, which hascontinued and which led in 2006 to thecreation of two joint ventures: Bourbon OffshoreAsia in Singapore and Naviera BourbonTamaulipas in Mexico.
�
376.6million euros in revenues (+35.8%) in 2006

SONASURF, AN HISTORIC SUBSIDIARY
■ Created in 1999 in a joint venture with Sonangol, the Angolanstate-owned oil company, Sonasurf has bet on synergies and thedevelopment of local expertise to drive its rapid growth. The trainingof Angolan seamen and officers is one of the decisive factors in itssuccess. Sonasurf, which today has 47 modern vessels, like theBourbon Jade, an MPSV dedicated to deepwater inspection,maintenance and repair work, operates under long-term contractswith all the oil companies present in Angola: BP, Chevron, Exxon,Sonangol P&P and Total.
�
20
| Safety: a priority The foundation of its operational organization isthe Bourbon Offshore safety and environmentalprotection management system, certified ISO9001 version 2000, which is based on fourbasic principles:
• executive commitment,
• training and qualification of employees,
• risk analysis, work preparation and the application of procedures specific to each operation,
• the selection of environmentally friendlyequipment that is safe to use and easy to service.
In order to offer its customers the highest safetystandards in the market, Bourbon Offshore hasset a new requirement to apply to its fleet thebest practices of the safety standard for oil tankvessels, by complying with the TMSA (TankerManagement Self Assessment). In addition to procedures, a safety culture is a crucialelement in the behavior of each employee in the Offshore Division. As a result, every dayevery person contributes individually to reachthe target of “zero accidents, zero incidents”.The general use of the safety managementsystem, the standardization of equipment and operations, the extension of the scope of procedures, and the training of crews allincreased the safety performance of BourbonOffshore in 2006. Supported by an internationalinternal communications campaign on the B Safe theme launched in 2005, all themeasures taken obtained results and reducedthe incident rate for 1 million hours worked(TRIR: Total Recordable Injury Rate) by 75%,from 10.6 in 2003 to 2.21 in 2006.
�Offshore
16persons dedicated to safety in 2006

3,313Offshore workforce in 2006 (+33%)
21
| Highly-skilled and united menand women around the world BOURBON's Offshore Division had 3,313seamen, officers and office staff at the end of 2006, who reflect its international presenceand its historic policy of local recruitment. A mosaic of geographic and cultural origins,skills and experiences, the diversity of theBourbon Offshore personnel is its strength andwealth. In 2006 alone, 828 new employeesjoined the Division, 96% of whom are seamen.The strong growth in the business will mean the recruitment and training of about 3,000new seamen between 2007 and 2010.BOURBON is meeting this new challenge by adopting an ambitious human resources strategy that can guarantee the same skill levelto everyone, at the level of service quality whichthe company is committed to offering itscustomers as well as guaranteeing its safetyrequirements. Committed to the developmentof local expertise to meet international quality standards, Bourbon Offshore provides or supplements the training course for its employees from all backgrounds. As a result,all crews in the Offshore Division are qualifiedas seamen as defined by the international STCW 95 convention.
In addition to these fundamentals, BourbonOffshore is implementing a process tostandardize training. The two anchor handlingoperations simulators, developed incollaboration with the Offshore Simulator Center in Aalesund, Norway, are an illustrationof that commitment. This technical training will allow crews in Norway, France and the Philippines to experience all maneuvers in a near real-time situation and prepare, in complete safety, for the most delicateoperations they may have to perform at sea.
From left to right:
. Simulation of anchor handling operations: a captain in training at the rear command station on an AHTS.
. Bourbon Apsara, an AHTS with 120 tons of bollard pull, a series of 5 vessels.
. Transfer of experience by a Chief Engineer to a student officer during a maintenance operation on a propulsion engine.
Breakdownof the Offshore Division staff
Asia6%
Africa35%
French territories26%
* Brazil and Mexico
SouthAmerica*
17%
OtherEuropeancountries
3%
Norway13%

�Towage & Salvage
22

Towage, assistance and salvage: a culture of customer service
�Through its subsidiaries Les Abeilles and Les Abeilles International, BOURBON ranks among the worldleaders in towage, assistance and salvage. Backed by its experience and success, and supported by the dynamicperformance of its teams, the Division is investing in the future by building on its expertise. Primarily operatingon the French coast and in French ports, it intends to export its knowledge to the world's major port zones and international terminals.
45,000missions per year
23
Left:Transfer of a towline
on board an ASD (Azimuth Stern Drive) tug.
Right:The sea tugs Abeille Bourbon
and Abeille Liberté during a salvage operation in the English Channel.
| Towage and assistanceLes Abeilles carries out its towage and assistanceoperations in France, on the African coasts andin the Indian Ocean. Intent on providing a quality of service worthy of its most demanding customers, and on beingable to respond at any time in compliance withthe safety criteria that have made its reputation,Les Abeilles has experienced teams andmodern tugs available seven days a weekaround the clock. Les Abeilles has adapted to change by making significant investments to replace its fleet and adapt its tools. The portof Le Havre is a reflection of this policy, with 7 tugs replaced since 2000 at BOURBON'sinitiative. It currently has the most modern fleetand will benefit from the new constructionprogram. Particularly active in the ports of Le Havre, Nantes Saint-Nazaire, Marseilles-Fosand Dunkerque, the expertise of Les Abeilles is reflected in international tenders awarded, like the one for the port of TangiersMediterranean where commercial operationsunder a 25-year contract will begin in 2007.
Benefiting from the expertise acquired at thegas terminals of Fos-sur-Mer and Montoir-de-Bretagne and the synergies developed withBOURBON's Offshore Division, Les Abeilles is expanding and optimizing its towage solutionsfor the Energy terminals.
| Salvage and coastal protection Les Abeilles International specializes in theprotection of the marine environment, salvageand assistance at sea. Under a contract with the French Navy since 1976, Les AbeillesInternational monitors 3,120 km of coastline. Its high level of expertise is based on 110 experienced employees trained incoordinating exceptional operations. Its 5 vesselsconduct assistance missions and escort ships in trouble, sometimes under extreme conditions.
129.7million euros in revenues (+12.9%) in 2006

24
THE CONVERGENCE OF TOWAGE AND OFFSHORE
■ In response to the development of offshore and onshore oil and gasterminals by the majors in the oil industry, BOURBON is expandinginter-division synergies. To assist ever larger oil and gas tankers,Bourbon Offshore has six tugs with 70 to 100 tons of bollard pull,including the newest, the Bourbon Rhode and Bourbon Rhesos. The BOURBON fleet will be gradually enhanced with 20 new multi-purpose, very powerful tugs which will expand its response capabilityat the Energy terminals for the benefit of its customers.
�
Left:The fleet of Les Abeilles Le Havre tugs ready to respond 24/7.
Right:The Captain on the bridge of a harbour tug in operation.
A member of the International Salvage Union(ISU), Les Abeilles International has a thoroughknowledge of the modern techniques used to fight pollution in a marine environment:installation of floating booms, spreadingdispersant, pumping, etc. Commissioned in 2005, the tugs Abeille Bourbon and AbeilleLiberté are equipped with the latest generation of equipment and offer the technicalspecifications of solid, fast, high-performance andmaneuverable vessels, even in bad weather. Experienced in all assistance techniques, the teams are in contact with salvage stations,and can be ready to respond in 20 minutes. For salvage operations, a dedicated crew,coordinated by a Salvage Master, is created in liaison with a set of partners (salvageprofessionals, naval architects, suppliers of special additional equipment, etc.).
| New challenges, new vesselsIn order to guarantee optimum services overtime in complete safety and to anticipateinternational developments, the BOURBONTowage & Salvage Division regularly expandsand replaces its fleet by combining leading-edgetechnologies and more powerful vessels. The Les Abeilles fleet, consisting of 67 tugs, was expanded early in 2007 with 4 new tugs in the port of Tangiers Mediterranean. It will beexpanded again with the delivery of 12 newtugs, currently on order, which will graduallycommission by 2008. BOURBON has plannedto invest a total of 100 million euros in thisDivision under the Horizon 2010 plan and is projecting annual growth of about 4% in the business.
| Safety and progress For many years, the Division has adoptedprocedures that strengthen the four fundamentalsof quality, health, safety and environmentalprotection. ISO certified in 1999, and applyingthe directives of the International SafetyManagement (ISM) code to control human andenvironmental risks, in 2004 Les Abeilles earnedISO 9001 version 2000 certification, whichguarantees that the service provided to thecustomer is in compliance. This ambitious policyis now leading Les Abeilles to adopt theparticularly stringent standards of the offshore oil and gas industry and its preventive methodsto analyze and evaluate operational risks.
�Towage & Salvage
40.9million euros in EBITDA (+46.7%) in 2006
67tugs in operation and 16 on order at the end of 2006

�Bulk
25
An international playerin dry bulk cargo

�Bulk
�Specializing for more than 35 years in dry bulk international shipping, Setaf Saget, a BOURBONsubsidiary, carries every year to the four corners of the world on 5,000 to 70,000-ton ships nearly 20 million tons of various solid bulk materials: wood, coal, fertilizers, grain, ore, cement products, etc.Managing a modern fleet of bulk carriers, both owned and under commercial control, Setaf Sagetparticipates in the growth of its industrial customers within long-term contractual relations, and is expanding its business to the rapidly growing markets of China and India.
Nearly 20million tons shipped in 2006
26
An international player in dry bulk cargo
I A high value-added service offer focused on the customer The diverse skills offered by Setaf Saget means a custom response to the specific expectations of customers: freight market analysis, study ofport features, cargo quotations, transport offers,consulting and legal assistance, chartering of all categories of bulk carriers, supervision of,loading and unloading operations. Based in France, and operating in North America and Asia, Setaf Saget has structured its organization to offer local service to its customers and respond to requests as quicklyas possible, guaranteeing ongoing tracking of theservices. Setaf Saget manages the everyday
and the unexpected with the same level of responsiveness, constantly keeping time, costs and the quality of its services in its sights for its customers.
I A modern and powerful fleetSetaf Saget manages a large fleet of modernbulk carriers on all the oceans of the world,demonstrating its reliability and efficiency. In addition to its owned fleet, with an averageage of 3 years, Setaf Saget operates a fleetunder management, providing its customerswith a broad range of vessel sizes adapted to all types of requests. In 2006, Setaf Saget

6owned bulk carriers
27
Left to right:. 18 m3 buckets adapted to all types of cargo, from iron ore to grains.
. All the vessels are specially equipped to load wood on deck.
. Unloading coal using the vessel's cranes and buckets (20,000 tons/day).
■ In order to reduce bulk carrierlayovers in port and optimize loadingand unloading rates, the entire fleetoperated by Setaf Saget is equippedwith large capacity cranes and grabs(20,000 tons/day).
HIGH-PERFORMANCE EQUIPMENT FOR OPTIMIZEDOPERATIONAL TIMES
�announced orders from a cement carrier for30,000 tons deliverable in 2008 and two 53,000-ton bulk carriers. Under the Horizon 2010 plan, BOURBON aims to invest120 million euros in the Bulk Division for the construction of 5 vessels.
I A reliable and responsible player Shipping is safe, saves energy and is respectfulof the environment, at every step in the chainand for the benefit of all. Setaf Saget contributesto that chain, ensuring that the company and its service providers provide the best protectionfor the persons and goods shipped. In eachoperation, the crews follow rigorous proceduresin compliance with the International SafetyManagement (ISM) code. Setaf Saget carefullycomplies with international and local regulations,port and terminal requirements to ensure the safety of the merchandise shipped. Finally, the vessels owned by Setaf Saget haveequipment to reduce emissions of pollutants.

�Results & performance
28

Exceptional growth in the group's results
�In 2006, BOURBON posted excellent results, primarily driven by the growth in the operations of the Offshore Division, whose revenues increased by 35.8%. EBITDA totaled 277.6 million euros andBOURBON's operating income was 181.4 million euros. At the end of 2006, the ambitious investmentprogram under the 2003-2007 plan was fully achieved, with 1.2 billion euros in marine services.
29
(in M€) (in M€)(in M€)
(in M€)
Revenues
..
..
..
.
.
.
.
Operating income (EBIT) Net income Group share
Cash flows from operatingactivities (excludingoperations to be sold)
Breakdownof revenues by Division
Breakdown of revenues by geographical region
BulkTowage & Salvage
* pro forma figures net gain on Vindémia

�Results & performance
30
. (in M€)
(in M€)
(in M€)
Breakdownof gross investmentsby Division
Capital employedby Division (excluding Corporate)
Gross investmentsChange in the Bourbon Offshore fleet
Change in Bourbon Offshore revenues
(averageannual growth)
(in number of vessels)
BulkTowage & Salvage
BulkTowage & Salvage
* French GAAP
,

0
10
20
30
40
50
60
1999 2000 2001 2002 2003 2004 2005 2006
March 27,2007
October 21, 1998 Initial public offering
31
Investor Relations
Patrick Mangaud33, rue du Louvre75002 Paris
| Market data
Historical data2006 2005 2004
Number of shares as at 31st December 50 195 528 25 045 577 24 612 000
Share price (in euros)
- higher 53.25 74.10 37.51
- lower 34 36.39 22.00
- latest 41.63 73.95 36.13
Market capitalization as at 31st December(millions of euros) 2 090 1 852 889
Net earnings per share (in euros) 3.05 8.31 3.85
Dividend per share for the year (in euros) 0.60 1.00 0.56
Total dividend (millions of euros) 30.12 25.05 13.78
Adjusted data *2006 2005 2004
Share price (in euros)
- higher 53.25 37.10 18.76- lower 34 18.20 11.00- latest 41.63 36.98 18.07Net earnings per share (in euros) 3.05 4.16 1.93Dividend per share for the year (in euros) 0.60 0.50 0.28
* For comparability purposes, the figures were adjusted following the doubling of the number of shares in the company on June 1, 2006.
Shareholder'scalendar
May 10, 2007Publication of 1st quarter 2007 revenues
May 29, 2007Shareholders' Meeting
August 9, 2007Publication of 2nd quarter 2007 and 1st half 2007 revenues
August 30, 2007Press Conference: “1st half 2007 results”
November 8, 2007Publicationof the information on 3rd quarter 2007
�
�
�
�
�
| The BOURBON share (from 10/21/1998 to 03/27/2007)
www.bourbon-online.com
Tel: +33 (0)1 40 13 86 09Fax: +33 (0)1 40 28 40 31

ChristianLefèvreExecutive Vice PresidentandChief Operating Officer
Jacques d’Armandde ChateauvieuxChairman and Chief Executive Officer
LaurentRenardExecutive Vice PresidentandChief Financial Officer
| Committees of the Board of Directors
The Board of Directors is assisted in preparingits work by two special committees.
Compensation CommitteeThis committee advises and issuesrecommendations on the compensation and pension of the Chairman and the othercorporate officers, and on stock option plans. It met once in 2006 with 100% attendance.
• Marc Francken (Chairman)• Henri d’Armand de Chateauvieux• Dominique Sénéquier
Audit CommitteeThe mission of this committee is to assist the Board of Directors to ensure the quality of the internal control and the reliability of the information provided to both stockholders and the financial markets. It met three times in fiscal 2006 with an attendance rate of 78%.
• Victoire de Margerie (Chairman)• Dominique Sénéquier• Roger Wright
Corporate Governance| Executive Committee at December 31, 2006
| Board of Directors
Jacques d’Armand de ChateauvieuxChairman of the Board of Directors,Chief Executive Officer
Christian MunierExecutive Vice President (until June 30, 2006)
Christian d’Armand de Chateauvieux
Henri d’Armand de Chateauvieux
Guy Dupont *
Marc Francken *
Victoire de Margerie *
Dominique Sénéquier
Roger Wright *
* Independent directors
�
32

BOURBON SIMPLIFIED ORGANIZATIONAL CHART
Offshore Division
�
Towage & Salvage Division
�
Bulk Division
�
Design, copywriting and production:Photographs : AFP/Marcel Mochet, Marine nationale/Johann Guiavarch, Harald Valderhaug, BOURBON all rights reserved.

www.bourbon-online.com
Head office: 33, rue du Louvre - 75002 Paris - FranceTel: +33 (0)1 40 13 86 16 - Fax: +33 (0)1 40 28 40 31
Marseilles office: 148, rue Sainte - 13007 Marseille - FranceTel: +33 (0)4 91 13 08 00 - Fax: +33 (0)4 91 13 08 06

2006 Financial Report Summary

Contents
Management report04 Activities and Highlights05 Results from Activities09 Corporate Governance15 Risk Management21 Employment Information22 BOURBON SA and its Stockholders24 Proposals of the Board of Directors27 BOURBON SA five-year financial summary28 Table summarizing the delegations of authority and the powers granted by the annual meeting to the Board of
Directors as applied to capital increases
Consolidated financial statements30 Consolidated Balance Sheet for the year ended at December 31, 200631 Consolidated Income Statement32 Consolidated Cash Flow Statement34 Consolidated Statement of Changes in Stockholders’ equity38 Notes to the Consolidated Financial Statements
38 Accounting policies and methods49 Significant information concerning the year ended December 31, 200654 Notes to the consolidated financial statements82 Segment reporting85 Other information
95 Statutory Auditors’ report on the consolidated financial statements for the year ended December 31, 2006
Report of the Chairman of the Board of Directors98 Report of the Chairman of the Board of Directors on the modus operandi of the Board of Directors and on internal
control procedures104 Statutory Auditor’s report on the report of the Chairman of the Board of Directors
Other legal and financial information106 General Information on BOURBON SA and its capital116 Trademarks, licences, patents, real properties, plant and equipment117 Annual information document
105
97
29
03

BOURBON 2006 Financial report I 3
Management
ReportContents
4 I Activities and Highlights
5 I Results from Activities
9 I Corporate Governance
15 I Risk Management
21 I Employment Information
22 I BOURBON SA and its Stockholders
24 I Proposals of the Board of Directors
27 I BOURBON SA five-year financial income statement
28 I Table summarizing the delegations of authority and the powers granted by the annual meeting to the Board of Directors as applied to capital increases

4 l BOURBON 2006 Financial report
1.1 MARKET CONTEXT IN2006/HIGHLIGHTS
In 2006, BOURBON posted excellent results, largely influencedby the Offshore business, which benefited from a favorableeconomy due to the resumption of capital expenditures by oilcompanies and the efforts made to boost production fromexisting fields. For example, 15 floating units and 460 wellheads were installed in 2006.
2006 also saw an increase in the number of the OffshoreDivision’s customers, reflecting both the growth of the supermajors, BP and Shell, and the arrival of new customers inNigeria, Equatorial Guinea, Mexico, Malaysia and India. At thesame time, new partnerships and operations were developedin the United States, Mexico, Qatar and Egypt.
In addition, the Towage & Salvage Division is now faced withthe arrival of a foreign competitor at the Port of Le Havre.
Finally, our policy of shifting our focus to the “marine” businessresulted in 2006 in new deals in non-strategic holdings,particularly the disposal of our stake in the company “Brasseriesde Bourbon”.
1.2 MAJOR EVENTS OCCURRING SINCETHE FISCAL YEAR-END
• BOURBON still holds a 30% interest in the Vindémia capital,for which it holds option to sell the share to Groupe Casino in2007, 2008 and 2009. When releasing its annual financialstatements on March 15, 2007, Groupe Casino announced avaluation of the Vindémia Put which could not be determinedon the basis of the closeout of the Vindémia annual financialstatements for 2006 on which the Vindémia Supervisory Boardhad not yet made its required decision.Believing that the difference in the valuation of such strike priceis “significant enough”, BOURBON reacted to theannouncement of this valuation immediately by issuing a pressrelease.
• In addition, a contract of sale for our 65% stake in thesubsidiary Espace Bourbon Thang Long was signed withVindémia. The deal was completed on February 19, 2007.
• In order to back our progress in terms of investments, a neworder of three series of modern offshore service vessels(46 vessels) was placed in late February 2007 for more than560 million euros.
1 Activities and Highlights
Management report

BOURBON 2006 Financial report I 5
2.1 CONSOLIDATED RESULTS
End of Dec.End of Dec. End of Dec. 2005
(in € millions) 2006 (*) 2005 (*) Change published
Revenues 717.6 614.4 + 16.8 1,022.0
Gross operating income (EBITDA) 277.6 207.4 + 33.8 240.3
Operating income (EBIT) 181.4 125.8 + 44.2 148.2
Net gains on equity interests sold and income fromdiscontinued operations 11.7 111.2 94.1
Net income 164.9 215.0 – 23.3 215.0
Net income, group share 152.9 205.0 – 25.4 205.0
Net income, group share (excluding the capital gainfrom Vindémia) 152.9 111.0 + 37.7 111.0
(*) Revenues are presented in accordance with IFRS 5 “Non-current assets held for sale and discontinued operations’’
For the first time since the decision to refocus on its marine services business, BOURBON recorded 2006 results that reflectexclusively its scope as a “pure player” in marine services.
BOURBON benefit from growth in the offshore oil and gas marine services sector (up 35.8%) in 2006: BOURBON postedrevenues of 717.6 million euros, up 16.8% over the previous year.
EBITDA amounted to 277.6 million euros, up 33.8%, after taking into account the 19 million euros profit on sales of vessels duringthe year.
Operating income was also up at 181.4 million euros (up 44.2%) as a result of the following:– the expansion of the fleet and improved offshore oil and gas market conditions;– a solid performance for towage and salvage;– the increase in cargo rates that began to produce effects in the second half of the year.
In 2006, the net gains on equity interests sold and income from discontinued operations reflect the disposal of the “Piriou” and“Brasseries de Bourbon” stakes as well as the income from non-strategic operations in the process of being sold. The 89.5%decline compared with 2005 can be explained by the net capital gain on the sale of Vindémia booked in 2005 for 94.1 millioneuros.
Net income group share excluding Vindémia capital gain rose by 37.7% to, 152.9 million euros.
At end 2006, the 2003-2007 strategic investment plan was completed one year ahead of schedule. Over the last four years,revenues for the Offshore Division have risen 30% per year (35% at constant exchange rates), and the ambitious 1.2 billioneuros investment program in marine services also slightly exceeded the target.
2 Results from Activities
Management report

6 l BOURBON 2006 Financial report
2.2 ACTIVITIES OF THE DIVISIONS
BOURBON is engaged in marine operations in three Divisions.
2.2.1 Offshore Division
End of Dec. End of Dec.(in € millions) 2006 2005 Change
Revenues 376.6 277.2 + 35.8
Gross operating income (EBITDA) 185.1 115.6 + 60.1
% of revenues 49.2 41.7
Operating income (EBIT) 112.8 58.5 + 92.9
% of revenues 30.0 21.1
Revenues in the Offshore Division amounted to 376.6 million euros, up 35.8% compared to 2005.
Renewed contracts and those for the 31 new vessels commissioned benefited from a very strong market.
The oil environment, which was favorable on the coast of West Africa, particularly in Angola and Nigeria, accounted to a largeextent for our revenue growth. The year 2006 also saw the start-up of our new joint venture in Mexico, Naviera BourbonTamaulipas, which was 49% consolidated starting in April 2006, and the start-up of our operations in Asia. In the North Sea also,prices rose to very high levels.
EBITDA amounted to 185.1 million euros (up 60.1% compared to 2005) and includes the profit generated by the sale of oldvessels for 19 million euros. Excluding the sale of vessels, our ratio of EBITDA to revenues amounted to 44.1% versus 41.8% in2005.
Operating income totaled to 112.8 million euros, up sharply compared to 2005, with an increase of 92.9%.
Gross capital expenditures amounted to 404.2 million euros, up 31.7% compared to 2005, reflecting the major investmentprogram.
2.2.2 Towage & Salvage Division
End of Dec. End of Dec.(in € millions) 2006 2005 Change
Revenues 129.7 114.9 + 12.9
Gross operating income (EBITDA) 40.9 27.9 + 46.7
% of revenues 31.6 24.3
Operating income (EBIT) 27.0 15.6 + 73.1
% of revenues 20.8 13.6
The Towage & Salvage Division generated revenues of 129.7 million euros, up 12.9% compared to 2005.
EBITDA amounted to 40.9 million euros and grew by 46.7% in 2006. This growth was driven primarily by the following:– a full-year of operations taken into account for the sea-going tugs “Abeille Bourbon” and “Abeille Liberté” on salvage and
coastal protection missions;– port activity which remained strong in French ports, particularly at Marseille-Fos and Nantes Saint-Nazaire;– strong activity in African ports generated by the positive conditions for offshore oil and gas marine services in the region.
Manangement report

BOURBON 2006 Financial report I 7
Gross investments totaled 32.3 million euros and included expenditures involving the tugs and pilot boats that will be in operationin 2007 under the towage concession agreement in the port of Tangiers Mediterranean in Morocco.
2.2.3 Bulk Division
End of Dec. End of Dec.(in € millions) 2006 2005 Change
Revenues 169.2 182.9 – 7.5
Gross operating income (EBITDA) 38.9 53.1 – 26.7
% of revenues 23.0 29.0
Operating income (EBIT) 35.0 50.1 – 30.1
% of revenues 20.7 27. 4
The Bulk Division had revenues of 169.2 million euros, down 7.5% from an exceptional year in 2005. Volumes shipped totaled15.7 million tons in a context of mix trends in cargo rates: down 37% from 2005 in the first half of the year, and up 44% in thesecond half of the year 2006 compared with the same six-month period in the previous year.
EBITDA totaled 38.9 million euros, down from 53.1 million euros in 2005, i.e. a difference of 26.7%. Fluctuations in cargo ratesin the market explain the fluctuations in gross margin affecting primarily directly owned vessels and vessels under long-termcharter agreements. Setaf Saget customer contract policy, based on long-term relations, generates a “delayed effect” of about sixmonths.
After an exceptional year in 2005, the Group recorded a very satisfactory operating income in 2006 (operating margin fromrevenues of 20.7%).
2.3 BOURBON SA PARENT COMPANY RESULTS
The policy of shifting focus to the “marine” business resulted in 2006 in new deals in non-strategic holdings, particularly thedisposal of our stake in the company Brasseries de Bourbon.
In addition, to participate in the financing of our fleet modernization program, a short-term loan agreement was signed for 100million euros.
The services rendered to subsidiaries yielded revenues of 1.3 million euros, including 0.9 million euros in technology transfers toVietnam.
The company had financial income of 13.2 million euros, up 3.5 million euros compared to 2005. Repayment at the end of 2005of the syndicated loan enabled us to reduce our financial expenses by 3.6 million euros. At the same time, the financial incomefrom investments and payments on the debit balance of current accounts increased by 1.2 million euros. In addition, the changein financial provisions had a positive effect on financial income (up 2.3 million euros), and foreign exchange differencescontributed 0.7 million euros. However, the dividends received were down by 4.3 million euros.
Non-recurring income consisted of a capital gain on asset disposal for 0.6 million euros and the negative balance from operationson treasury stock buyouts (0.3 million euros).
No expense referred to in articles 39.4 and 223 quater of the GTC [General Tax Code] was detected.
Management report

8 l BOURBON 2006 Financial report
2.4 METHOD OF PRESENTATION OF THE ANNUAL STATEMENTS:DISCONTINUED OPERATIONS (IFRS 5)
Vindémia (Retail Business)
The group continues the process of withdrawing from the Retailbusiness, after the sale of 36.66% of the Vindémia companyto Groupe Casino in 2005 (“first put”).
Under the agreements entered into with Groupe Casino, thesale (“second put”) of the remaining interest, i.e. 30%, may beheld between 2007 and 2009. As of December 31, 2006, it ishighly probable that BOURBON will exercise the “second put”before the end of the first half of 2007, thus ending itsoperations in the Retail sector.
As a result, at December 31, 2006, the equity interests in theRetail associates, which have been consolidated using theequity method since October 1, 2005, were accounted for inaccordance with IFRS 5 in the consolidated financialstatements.
The Vindémia sub-group assets held for sale amounted to 99.4million euros at December 31, 2006. The group share of netincome for the year corresponds to a profit of 11 million euros.
In this context, the group also initiated in 2006 the sale of itsVietnamese subsidiary Espace Bourbon Thang Long (ashopping mall in Hanoi), which was finalized in February 2007.At December 31, 2006, this company was recognized inaccordance with IFRS 5.
Hotel Assets
In addition, in connection with the shift in focus to purelymarine operations, the group decided to sell all its hotelproperties on Reunion Island. Exclusive talks are nowunderway, and the sale is expected to take place no later thanthe first half of 2007. Therefore, the entities concerned wereaccounted for in accordance with IFRS 5 in the consolidatedfinancial statements.
Manangement report
2.5 PROSPECTS FOR THE FUTURE:PRINCIPAL TRENDS
In 2007, BOURBON, and specifically the Offshore Division, willreap the full-year benefit of the vessels delivered in connectionwith the 2003-2007 investment plan. It will continue its capitalexpenditures under the new investment plan to accommodatethe many new orders already placed in 2006.
Concerning the Offshore Division, the year 2007 should bringgrowth in our new regions like Asia and Mexico, and also theregions we tend to favor like the West African coast with Nigeriaand Angola.
Putting our tug and pilot boats to use under our concessioncontract with Tangiers Mediterranean should prove beneficialfor the Towage & Salvage Division, which can also look forwardto the brisk market in towage and assistance observed in theports early in the year.
The Bulk Division should benefit from high cargo rates.
BOURBON’s results will continue to be influenced byfluctuations in the euro/US dollar parity.
In terms of asset disposals, “the second Vindémia put” can beexercised starting in 2007. In addition, the disposal program forother non-strategic assets will be continued.

In 2006, BOURBON continued to improve its corporate governance. The Audit and Compensation committees met regularlyduring the year.
In terms of corporate governance, BOURBON complies with the legal requirements set forth in the law on the New EconomicRegulations (NRE) and also takes into account the recommendations contained in the AFEP/MEDEF report, which gives anoverview of the corporate governance principles in force.
3.1 CHAIRMAN AND CHIEF EXECUTIVE
In its May 31, 2002 meeting, the Board of Directors approved combining the positions of Chairman of the Board and ChiefExecutive Officer performed by Jacques d’Armand de Chateauvieux; that decision has not been amended since then.
Jacques d’Armand de Chateauvieux was assisted in 2006 by Christian Munier, Christian Lefèvre and Laurent Renard. Thus thefollowing people comprised the Management of BOURBON:• Jacques d’Armand de Chateauvieux, Chairman and Chief Executive Officer;• Christian Munier, Director, Executive Vice President until June 30, 2006;• Christian Lefèvre, Executive Vice President;• Laurent Renard, Executive Vice President.
3.2 COMPOSITION OF THE BOARD OF DIRECTORS
(*) Stockholders’ meeting
Date first appointed
Date termexpires
Positions held outside the group
Jacques d’Armand deChateauvieux
DOB: 02.13.1951
Director
Chairman & Chief Executive Officer
10.14.1977
SM (*) held toapprove the
statements forthe year ended
12.31.2006
- Chairman of Jaccar
- Chairman of CBo Territoria
- Chairman of Sapmer
- Member of the AXA Supervisory Board
- Director, Sinopacific Shipbuilding
Christian Munier
DOB: 12.10.1950
DirectorExecutive Vice President(until 06.30.2006)
06.18.1999
SM (*) held toapprove the
statements for the year ended
12.31.2007
- Chairman CDM2 SAS
- Member and Chairman of the SupervisoryBoard of SAS Financière du Pladen (since07.26.2006)
- Member of the Supervisory Board of Lesmoteurs Baudouin SA (until 09.30.2006)
- Director, Bonnasse Lyonnaise de Banque SA
- Director, Finadvance
BOURBON 2006 Financial report I 9
3 Corporate Governance
Management report

Date firstappointed
Date term expires
Positions held outside the group
Christian d’Armand deChateauvieux
DOB: 11.09.1947
Director
Cousin of the Chairmanand CEO
06.29.1990
SM (*) held toapprove the
statements for the year ended
12.31.2007
- Chairman & CEO of Ch. de Chateauvieux &Associés SA
- Chairman and CEO of Legrand Filles & Fils SA
- Manager, Les Armands SCI
- Manager, Le Petit Vasouyard SARL
Henri d’Armand deChateauvieux
DOB: 08.17.1947
Director
Member of the CompensationCommitteeBrother of the Chairman and CEO
05.25.1987
SM (*) held toapprove the
statements for the year ended
12.31.2007
- Chairman, Mach-Invest SAS
- Director, Sapmer
Victoire de Margerie
DOB: 04.06.1963
Director
Chairperson of the AuditCommittee
06.08.2004
SM (*) held toapprove the
statements for the year ended
12.31.2006
- Director and member of the Ipsos CompensationCommittee
- Director and member of the Ciments FrançaisAudit Committee
Guy Dupont
DOB: 08.25.1944
Director 06.18.1999
SM (*) held toapprove the
statements for the year ended
12.31.2007
- Chairman of the Economic Interest Group (EIG)Bois Rouge Gestion (until August 2006)
- Chairman of the EIG Cerf (until August 2006)
- Chairman of Distillerie de Savanna SAS(until August 2006)
- Chairman of Eurocanne SAS (until August 2006)
- Chairman of Sucrerie de Bois Rouge SAS(until August 2006)
- Director, CBo Territoria
- Director, Brasseries de Bourbon SA
- Director, Sucre Austral
- Director, Sapmer
- Director of the Economic Interest Group Gema(until March 2006)
- Director, ICV Mascareignes
- Director, Loiret & Haentjens SA(until March 2006)
- Director of the EIG Rhums Réunion(until March 2006)
- Manager, SAS GVS
- Manager, SCI Orion
10 l BOURBON 2006 Financial report
Manangement report

BOURBON 2006 Financial report I 11
Date firstappointed
Date term expires
Positions held outside the group
Marc Franken
DOB: 01.08.1946
Director
Chairman of the CompensationCommittee 05.25.2000
SM (*) held toapprove the
statements for the year ended
12.31.2008
- Honorary Chairman of Gevaert NV (Belgium)
- Chairman of Union Remorquage et Sauvetage(Belgium)
- Chairman of Technum-Tractebel (Belgium)
- Director, Nederlands Loodswezen bv(Netherlands)
- Director, VETC (Belgium)
- Director, Vum Media (Belgium)
- Director, Vlaams Economisch Verbond (Belgium)
- Director, Nautinvest (Belgium)
- Director, Asbl de Warande (Belgium)
- Member of Lieven Gevaert Fonds – KoninklijkeVlaamse – Ingenieurs Vereniging –Fuggersocieteit – De Warande – Orde Van denPrince
Dominique Sénéquier
DOB: 08.21.1953
Director
Member of the Audit Committee
Member of the CompensationCommittee
09.08.2003
SM (*) held toapprove the
statements for the year ended
12.31.2008
- Chairperson of Matignon Développement 1 SAS
- Chairperson of Matignon Développement 2 SAS
- Chairperson of Matignon Développement 3 SAS
- Chairperson of the Management Board of AXAIM Private Equity SA
- Chairperson of the Management Board of AXAIM Private Equity Europe SA
- Chairperson of Pikanter 4
- Chairperson of the Supervisory Committee ofAXA Private Equity Germany GmbH
- Chief Executive, AXA Chile Private Equity 1 b SAS
- Manager, AXA Private Equity Secondaries Ltd.
- Director AXA IM Secondaries AssociatesManagement Ltd.
- Director, AXA Private Equity Funds of FundsManager II Ltd.
- Director, AXA Private Equity Primary Ltd.
- Director, AXA Private Equity SL Management Ltd.
- Director, AXA Private Equity Asia
- Director, PE Asia Manager Ltd.
- Director, AXA IM LBO Management Ltd.
- Director, AXA IM LBO Management III Ltd.
- Member of AXA Alternative Participations Sicav –AXA Alternative Participations Sicav II
- Member of the Supervisory Committee of AXAPrivate Equity US
Management report

12 l BOURBON 2006 Financial report
Manangement report
Date firstappointed
Date term expires
Positions held outside the group
Roger Wright
DOB: 05.25.1952
Director
Member of the Audit Committee
09.13.2004
SM (*) held toapprove the
statements for the year ended
12.31.2008
- Chairman and CEO ofArsenal Investimentos (Brazil)
- Director, Klabin (Brazil)
- Director, Gradiente Electronics (Brazil)
- Director, TAM Airlines (Brazil)
- Member of the Brazilian Institute of Volunteerism
3.3 COMPENSATION OF THE CORPORATE OFFICERS
3.3.1 Compensation of the Chairman of the Board of Directors and the Executive Vice Presidents
Compensation of the corporate officers is set by the Board of Directors upon advice from the Compensation Committee andconsists of a fixed portion and a variable portion.
The fixed compensation paid to the Chairman and Chief Executive Officer, Jacques d’Armand de Chateauvieux, who runs theJaccar Company, BOURBON’s lead holding company, has been unchanged since the increase approved by the Board of Directorsin its March 22, 2004 meeting. This compensation is 360,000 euros (excluding taxes). His variable compensation is calculatedon the basis of 1% of the consolidated net income for the prior year, capped at 750,000 euros (excluding taxes).
The compensation of the Executive Vice Presidents proposed by the Compensation Committee and approved by the March 20, 2006meeting of the Board of Directors includes a fixed portion and a variable portion calculated on the basis of 0.5 per 1,000 of theprior year’s consolidated net income; in addition, they receive compensation for any positions held in the group outsideBOURBON SA.
The table below shows the gross annual compensation paid to the corporate officers in euros:
(gross amounts in €) 2006 2005
Jacques d’Armand de Chateauvieux
Fixed compensation 360,000 360,000
incl. billing for services 360,000 360,000
Variable compensation 750,000(**) 750,000(*)
Total 1,110,000 1,110,000
Christian Munier (officer until 06.30.2006)
Fixed compensation 160,948 421,000
incl. billing for services(1) 150,277 332,000
Compensation for positions held in the group outside of BOURBON SA 50,669 43,000
Total 211,617 464,000
Christian Lefèvre (officer since 12.05.2005)
Fixed compensation 307,615 153,020
incl. billing for services(2) 150,000
Variable compensation 76,445(**)
Compensation for positions held in the group outside of BOURBON SA 53,905 32,027
Total 437,965 2 000 185,047

Management report
BOURBON 2006 Financial report I 13
(gross amounts in €) 2006 2005
Laurent Renard (officer since 12.05.2005)
Fixed compensation 221,000 200,200
Variable compensation 76,445(**)
Compensation for positions held in the group outside of BOURBON SA 18,753
Total 316,198 2 000 200,200
(1) Payment for services rendered to the company CDM2, of which Christian Munier is the principal stockholder.(2) Payment for services rendered to the company Marine, of which Christian Lefèvre is the principal stockholder.(*) Compensation paid in 2006 for 2005.(**) Compensation paid in 2007 for 2006.
No supplemental retirement plan was granted by BOURBON to the corporate officers, and no in-kind benefits other than acompany car provided for each of the two Executive Vice Presidents (Christian Lefèvre and Laurent Renard).
Laurent Renard’s original employment contract includes a provision for benefits in the event he is dismissed following a changein control of BOURBON.
3.3.2 Stock Options
No stock options were granted to the corporate officers during 2006.
On December 27, 2006, the Chairman and CEO exercised the 34,364 stock purchase options granted by the September 10, 2001meeting of the Board of Directors at the price of 5.645 euros per share. On December 28, 2006, a “shared gift” of these shareswas made among his children.
3.3.3 Director’s fee
The members of the Board of Directors are paid as sole compensation director’s fees totaling 200,000 euros in accordance withthe decision by the Combined Annual and Special Stockholders’ meeting of May 23, 2006 for the year 2005 and subsequentyears, to be distributed according to the following terms:• fixed compensation of 5,000 euros;• variable compensation reflecting the attendance rate, in the amount of 2,000 euros for each meeting attended, includingattendance at the different committee meetings.
Under these terms, the amount paid to the members of the Board of Directors in 2006 totaled 101,000 euros.

14 l BOURBON 2006 Financial report
2006 2005
Current members of the Board of Directors
Jacques d’Armand de Chateauvieux 11,000 17,000
Christian d’Armand de Chateauvieux 9,000 15,000
Henri d’Armand de Chateauvieux 11,000 17,000
Guy Dupont 9,000 13,000
Marc Francken (1) 11,000 11,000
Victoire de Margerie 17,000 19,000
Christian Munier 11,000 17,000
Roger Wright (1) 13,000 13,000
Former member of the Board of Directors
Jean-Marc Brebion 9,000 17,000
Total 101,000 2 000 139,000
(1) The amounts allocated to foreign Directors correspond to the gross amounts paid.
3.4 FEES PAID TO THE STATUTORY AUDITORSAND TO THE MEMBERS OF THEIR NETWORKS
EurAAudit CRC Deloitte Touche Tohmatsu
Amount Percentage Amount Percentage(in € thousands) 2006 2005 2006 2005 2006 2005 2006 2005
Audit
Auditing network and certification ofconsolidated and statutory accounts
Parent company 63 58 33% 30% 66 50 19% 23%
Consolidated subsidiaries 128 126 67% 65% 253 168 74% 77%
Other ancillary assignments and otherauditing engagements
Parent company – 9 – 5% – – – –
Consolidated subsidiaries – – – – – – – –
Sub-total 191 193 100% 100% 319 218 93% 100%
Other services
Legal, tax, corporate – – – – 8 – 2% –
Other – – – – 17 – 5% –
Sub-total – – – – 25 – 7% 0%
TOTAL 191 193 100% 100% 344 218 100% 100%
After reviewing the situation with regard to the term of office of the statutory auditors, we hereby specify that no term of officeexpires at this stockholders’ meeting.
Manangement report

BOURBON 2006 Financial report I 15
As far as the Company is aware, there are no exceptional factsor disputes that could have a material effect on the business,the results, the financial position or the assets of BOURBON orits subsidiaries.
BOURBON’s aim is to ensure that the entire internal controlsystem can, insofar as possible, prevent any risks to which it isexposed. With this in mind, a “cartography of risk” process wasdeveloped during 2005.
To design this, a dedicated team was established by Division(Offshore, Towage & Salvage, and Bulk) as well as atmanagerial level at corporate headquarters. An inventory ofrisks was prepared as thoroughly as possible, along with theassociated controls, then categorized by type. On a case-by-case basis, probabilities of occurrence and potential impactwere assessed. The risks identified were then ranked based ontheir possible frequency (from frequent to improbable) andtheir impact (negligible to catastrophic) which would require acrisis unit to respond immediately with an action plan.
The Management of each Division is responsible for forwardingthe mapping to the different units, as well as action plans andcontrol and follow-up procedures.
The cartography of risk was updated in 2006.
The type and ranking of these risks are considered strategic andconfidential. Nevertheless, the principal risk factors are outlinedbelow.
4.1 RISKS RELATED TO BOURBON’SBUSINESS ACTIVITIES
In the three businesses in which BOURBON is engaged inmarine services, there are major barriers to entry due to thepositions acquired over time, the capital intensity of theequipment, the expertise of the employees and familiarity withthe administrative and political constraints of the differentoperating segments.
For Offshore oil and gas marine services, the service offeringis based both on experienced and qualified employees trainedin every assignment and on a full range of recent modernvessels, which makes it possible to offer each customergenuine customized service.
Today, all BOURBON’s subsidiaries are in the process of hiringand expanding their human resources at a time when there isa structural shortage of merchant marine officer graduates. Tomeet its needs, BOURBON makes its staff the focus of itsstrategy and follows an ambitious human resources policy.
Thanks to its strong investment capacity and its technical andtechnological expertise acquired during more than 30 years ofexperience, the BOURBON Offshore Division is able to respondto:• the genuine technological revolution in the offshore oil andgas businesses, by operating one of the most up-to-date andmulti-purpose fleets;• the expectations of the modern offshore market – both“continental” (depths of less than 200 meters) and“deepwater” (depths of up to 3,000 meters).
The demand for offshore oil and gas services is dependent onthe willingness of customers to invest. Oil and gas prices on theworld markets have a significant influence on capitalexpenditures in this sector. Thus, a prolonged decline in oil andgas prices can reduce the ability of BOURBON’s customers toinvest in new developments. At the same time, an increase inthose same prices slows the demand for derivatives. Capitalspending in the oil industry can also be influenced by thefollowing factors:• the rate of discovery and development of new oil and gasreserves;• the global demand for energy;• the global demand for petrochemical products;• local political and economic conditions.
A reduction in capital expenditures in the oil industry due to anyof the above factors, or for any other reason, could reduceBOURBON’s ability to increase or maintain its profits.
BOURBON ranks among the leaders in offshore oil and gasmarine services and operates in more than 20 countries.
The group’s international presence, and the increase in itscustomer base somewhat dilutes the risk of dependence. Thelarger customer base reflects in particular the increased weightof the super majors BP and Shell and the arrival of newcustomers, specifically in Nigeria, Mexico and Equatorial Guinea.In 2006, only two customers (Total and Exxon) accountedindividually for more than 10% of the revenues of the OffshoreDivision.
4 Risk Management
Management report

16 l BOURBON 2006 Financial report
In addition, charter agreements for vessels are mainly contractslasting from six months to eight years, with staggered expirationdates.
For harbor towage, this activity, which until now has been ahighly regulated activity, is based on the granting of approvalsby the port authorities (French ports) and/or concessions(African ports).
For assistance and salvage, the excellent reputation of “LesAbeilles International” is based on a contractual relationship ofmore than 20 years with the French Navy during which projectshave been carried out under the most difficult conditions toprotect the marine environment using tugs fitted with moderntechnical equipment and highly involved professional crews.
For bulk shipping, the subsidiary Setaf Saget, which hasspecialized in dry bulk marine shipping for more than 35 years,operates at sea all over the world with a fleet of 60 up-to-datebulk carriers, six of which are directly owned, and offers itscustomers customized services by proposing a full range ofhigh value-added logistics services. The Bulk Division’s level ofactivity is contingent on the extent of world trade and thegrowth of the global economy as well as the volatility of cargorates (“Baltic supramax” index). A severe decline in world tradecould reduce the demand for bulk carriers. However, with thequality of its directly owned fleet, the Division is in a position todevelop new markets.
4.2 INDUSTRIAL ANDENVIRONMENTAL RISKS
BOURBON’S activities involve mainly the marine and shippingareas, which are especially highly regulated.
As a service company, BOURBON is not directly responsible forindustrial processes, except for operating its marine equipment.Nevertheless, BOURBON applies the rules outlined by itsprincipals whenever its vessels come near their infrastructures,e.g. port facilities or military zones.
The laws and decrees of the flag State and the coastal State setthe regulatory framework applicable to marine activities.
National rules refer mainly to a set of agreements drawn upunder the auspices of the International Maritime Organization(IMO) which was mandated by the UN to deal with subjectsspecific to maritime navigation.
The main international standards are listed below:– the SOLAS convention (international convention to
safeguard human life at sea) contains mainly the technicalprovisions to be observed for the design, construction andoutfitting of vessels;
– the STCW convention (International Convention onStandards of Training, Certification and Watchkeeping forSeafarers) lists the requirements for qualifying crews;
– the MARPOL convention (Marine Pollution) lists all thefactors concerning pollution prevention, both from thevessel and from its cargo;
– the COLREG convention (Collision Regulations), whichdefines the rules of navigation.
These agreements refer to codes and manuals prepared by theIMO, supplemented by resolutions from its specializedcommittees. The ISM code (International Safety Management)is a central component of it and defines the basics formanagement and safety in shipbuilding companies, on boardand at the corporate office.
The rules pertaining to the transport of hazardous goods arecontained mainly in the IMDG code (International MaritimeDangerous Goods), which contains information on theprecautions to be taken for packing, storage on board, handling,loading and unloading.
The area of maritime labor is also covered by agreementsdrafted by the International Labor Organization.
Nations sign on to the general version of these conventions,sometimes incorporating a few specific terms, particularly forsmall vessels. States have the responsibility of applying themand stopping infractions.
The task of making certain that regulations are implementedand followed by shipowners is usually delegated by the Statesto independent agencies, known as classification societies.Their area covers the audit of the organizations, supervision ofconstruction and periodic visits to the operating vessels. Themain classification companies are members of an association,the IACS, which sees to it that rules and actions are consistent.The authority granted to the classification companies iscontingent on formal approvals issued by the States.
BOURBON believes it is important to follow scrupulously therules in force and whenever possible, attempts to take theinitiative to improve its organization and its methods in order toreach or outperform the standards required more quickly.
BOURBON stays abreast of any new information in this areaand updates all data concerning regulations at the corporateoffice and on board its vessels.
The risks of environmental damage stem mainly from thepresence of the vessel in its environment and anyconsequences of accidents related to the cargo or to thenavigation. Although it is not possible to cancel out completelythe impact of shipping operations, BOURBON does try to
Management report

BOURBON 2006 Financial report I 17
improve the situation by using technical solutions andinfluencing the behavior of the stakeholders.
BOURBON believes that accidents are avoidable throughprevention and that it is possible to prevent pollution. Trainingand drills are used to prepare the staff as well as possible tomeet emergency situations.
The QHSE (Quality, Health, Safety and Environment)Department is responsible for ensuring that the workingmethods and practices based on the above principles arepassed down to all BOURBON employees.
BOURBON’s activities are not prone to any specific natural risksother than those related to maritime navigation.
4.3 LEGAL RISKS AND INSURANCE
The activities of offshore services have a contractual basis thatincludes a best endeavors obligation and a principle of waivinglegal actions among the parties.
In terms of harbor towage, the tug provides its towing force tothe towed vessel, and barring gross negligence on its part inexecuting this obligation, it is exempt from any liability.
Concerning the bulk shipping activity, the obligations of theinternational carrier are governed by the internationalagreements that define the liability of the shipper and thecarrier.
The group is active worldwide. Therefore, the companies arerequired to obey the law and the regulations applicable tothem locally, particularly in maritime, customs and taxquestions.
The diversity of the customers and geographical areas in whichBOURBON operates limits the risks of recovering tradereceivables and reduces the political risks.
Insurance
BOURBON has taken out a comprehensive insurance policy forthe entire managed fleet, which covers any risks, damage, orliability concerning it stemming from its contractualcommitments and its activities:• in terms of marine risks, the group covers risks of injury andequipment damage, ordinary risks and risks of war under aworldwide all-risk policy;• in terms of vessel owner/operator, the group belongs toP & I Clubs, members of the International Group of P & I Clubs,such as the Shipowners, the UK Club, the Skuld and the Gard.
In addition to the above coverage, BOURBON has a civil liabilitypolicy (operations, post-construction and professional)designed to guarantee any risks not directly related to amaritime contract and hence not covered by the P & I Clubs.This is an “umbrella” policy that covers any difference inconditions. BOURBON also has liability insurance to cover theliability of the management as de facto or legal corporateofficers.
Insurance Management
Concerning the fleet, it is combined under a single policywhenever possible (exception: the local requirement forinsurance/reinsurance in some countries; organizationalconstraints). The goal is to cut costs and to centralize themanagement of issues relating to risk analysis, verification toensure coverage is in line with risks and negotiating long-termcontracts that give a better view of insurance expenses.
The deductibles for bodily injury and equipment damagepolicies taken out with first rate insurers (including AllianzGlobal Corporate and Specialty, Groupama and Axa) are low forthe Towage & Salvage Division (30,000 euros), very low formost of the Offshore Division (15,000 euros), and specific forthe Bulk Division (150,000 US dollars).
The P & I guarantee gives BOURBON full civil liability coverageas a shipowner and operator. The deductibles are low (on theorder of 10,000 euros).
BOURBON does not have a “loss of hire” guarantee for anyrisks incurred if a vessel is damaged and taken out of servicefor repair.
Management report

18 l BOURBON 2006 Financial report
The deductibles for these kinds of guarantees are generally around 14 days, which is very close to the average duration of therepair work. The civil liability policy taken out with Axa Corporate Solutions and Groupama Transport (two lines of coverage), offersa total of 22 million euros, with a maximum deductible of 30,000 euros.The liability insurance for executives was taken out with AIG. The amount of the coverage is 19.1 million euros. For reasons ofconfidentiality, BOURBON prefers not to publish the amount of the premiums paid.
No insurance captive was established within the group.
4.4 FINANCIAL RISK MANAGEMENT: OBJECTIVES AND POLICY
The group’s risks are the interest rate risk on cash flow, liquidity risk, currency risk and credit risk. The Board of Directors hasreviewed and approved the management policies for each of these risks. The policies are summarized below.
Interest Rate Risk on Cash Flows
The group’s exposure to the risk of variations in interest rates is related to the group’s medium and long-term variable rate financialdebt. BOURBON regularly monitors its exposure to interest rate risk. This is the responsibility of the Group Treasury manager whoreports to the Executive Vice President – Finance and Administration.
The group’s policy is to manage its interest liability using a combination of fixed-rate and variable-rate borrowings. To keep overallcosts down, the group sets up interest rate swaps through which it exchanges, at specified intervals, the difference between fixedcontract rate and variable interest amounts calculated by reference to the agreed notional principal amounts.
These swaps are assigned to hedge the borrowings. As of December 31, 2006, after consideration of the interest rate swaps,approximately 56% of the group’s medium or long-term debt is contracted at a fixed interest rate.
The following table shows the group’s net exposure to variable rates before and after risk management, based on the hedges inplace as well as the sensitivity of the group’s income before taxes (related to the changes in fair value of the monetary assetsand liabilities) to a reasonable change in interest rates; all other variables remaining constant.
At December 31, 2006> 1 year to
(in € thousands) < 1 year < 5 years > 5 years Total
Variable-rate assets 184,292 – – 184,292
Variable-rate liabilities (386,653) (441,711) (317,774) (1,146,139)
Net variable-rate position before hedging (202,361) (441,711) (317,774) (961,847)
Hedges 67,190 218,194 175,521 460,906
Net variable-rate position after hedging (135,171) (223,517) (142,253) (500,941)
Sensitivity to a 1% increase in rates before hedging (2,024) (4,417) (3,178) (9,618)
Sensitivity to a 1% increase in rates after hedging (1,352) (2,235) (1,423) (5,009)
Sensitivity to a 1% decrease in rates before hedging 2,024 4,417 3,178 9,618
Sensitivity to a 1% decrease in rates after hedging 1,352 2,235 1,423 5,009
As of December 31, 2006, if interest rates on borrowings had been 1% higher or lower, the group’s cost of net debt would havebeen 5 million euros higher or lower.
Management report

BOURBON 2006 Financial report I 19
Currency Risk
Objectives
The group’s policy is to reduce as much as possible theeconomic risk related to foreign currency fluctuations over themedium term. Furthermore, the group aims to minimize theimpact of the US dollar volatility on the annual operatingincome.
Cash flows from operating activities
The main foreign currency risks on operations are listed below:For the Offshore Division, BOURBON invoices a large portion(about 68%) of its services in US dollars. The group has anatural foreign exchange hedge thanks to the payment ofexpenses in the same currency (representing about 20% ofrevenues). The policy is to maximize this natural hedge.
The residual risk is partially hedged in the short term by usingforward US dollar sales and/or currency puts. On the unhedgedportion, and over time, the Offshore Division is directly exposedto foreign currency risks, particularly on the US dollar.
The Bulk Division, mainly in US dollars (revenues and costs) isbooked in the US dollar functional currency. Therefore, themargin realized in US dollars is not hedged.
For the Towage & Salvage Division, expenses are essentially inthe same currencies as revenues (mainly euro or CFA franc).Hence, the foreign currency risk is insignificant.
For the sugar business in Vietnam, expenses are for the mostpart in the same currencies as revenues. Foreign currency riskis, therefore, limited to the effect of translation in euros in the
Management report
BOURBON consolidated statements and to the accountingeffects on stockholders’ equity.
Long-term cash flows
PolicyIn the case of vessels acquired in a foreign currency, the policyis to partially hedge foreign exchange currency risk during theconstruction period by entering into forward currency purchasecontracts.The policy is to finance these acquisitions in the currency inwhich the corresponding charters will be paid by thecustomers. However, in order to avoid accounting exchangedifferences in the countries outside the euro zone and the USdollar zone (particularly, in Norway, Brazil and Mexico), theentities finance their investments in their functional currency.
Current practiceAs an exception, early in 2004, it was decided to abandon thispractice temporarily and to convert most of the loans from USdollar to euros. This was done to recognize the unrealizedforeign exchange gains booked in 2003.Since then, most of the new borrowings (outside Norway)have been contracted in euros. When the euro/US dollar paritypermits, these borrowings will be converted into US dollars andsubsequent acquisitions will be financed in US dollars.
The table below shows the sensitivity of the group’s pre-taxincome (tied to changes in the fair value of the monetary assetsand liabilities) to a reasonable modification in exchange ratesagainst euro after currency hedging (all other variables heldconstant)
12.31.2006 Effect on incomeNet position Net position
(in € thousands) Monetary Monetary before after Of a 1% Of a 1%assets liabilities hedging Hedging hedging increase decrease
BRL 1,672 1,306 365 365 (4) 4
MXP 1,559 628 931 931 (9) 9
NOK 47,594 196,165 (148,571) 90,499 (58,072) 575 (587)
USD 141,647 132,045 9,602 9,602 (95) 97
VND 18,983 2,572 16,412 16,412 (162) 166
Other currencies 7,241 5,179 2,062 2,062 N/S N/S
Total 218,696 337,895 (119,199) 90,499 (28,700) 305 (311)
Please note that forward currency hedges on future transactions do not appear in this table insofar as the item hedged is not yeton the balance sheet.
Risk on the price of suppliesThe group’s exposure to price risk is minimal.

20 l BOURBON 2006 Financial report
Credit Risk
The group maintains commercial relations only with thirdparties with proven financial stability. The group’s policy is toverify the financial health of all customers that wish to obtaincredit payment terms. Furthermore, the group monitorscustomer balances continually and, therefore, the group’sexposure to any unrecoverable receivables is not significant.
The group has not subscribed a credit insurance typeagreement.
Concerning the credit risk on the group’s other financial assets,i.e. cash and cash equivalents, available-for-sale financial assetsand certain derivative instruments, the group works only withtop-ranking banks.
Liquidity Risk
The group’s financing is conducted within the framework of agroup policy implemented by the Finance and AdministrationDepartment. This policy involves self-financing the investmentprogram by using asset disposals and generating sustainedoperating cash flows thanks to the strategy of long-termcontracts, particularly in the Offshore Division.
Cash management is coordinated at the group’s operationalheadquarters. Financière Bourbon, a general partnershiporganized as a cash-pooling unit, offers its services to most ofthe group’s operational subsidiaries. Under a cash agreementwith Financière Bourbon, those entities benefit from activesupport in managing their flows, their foreign currency andinterest rate risks, their operational risks, and their short andmedium-term debt, in accordance with the various laws inforce locally.
In 2005, BOURBON took out a syndicated loan of 320 millioneuros. As of December 31, 2006, the outstanding loan amountwas 315.2 million euros. The balance of 4.8 million euros wasreleased during the first quarter of 2007.
In addition, the group holds unused short-term credit linesrepresenting 95 million euros as of December 31, 2006.
The payment schedule of long-term financial debt appears innote 3.14 of the notes to the consolidated financial statements.
In addition to the traditional covenants associated with such acorporate loan, some covenants specific to the 320 millioneuros loan require BOURBON to ensure that vessels arefinanced but not mortgaged be available to the lender. IfBOURBON was to exceed certain financial ratios contained inthis contract, BOURBON would also require, at the lender’soption, to grant mortgages on those same vessels(unmortgaged portion) on a priority basis and/or on other
Management report
vessels in the BOURBON fleet in addition, until it reestablishedthose same ratios to the lender’s satisfaction. No earlyrepayment is required under these financial covenants.
The other loans taken out by the group do not contain anycontractual provisions, which, if violated, would have asignificant impact on the group’s financial statements.
Stock Risk
The group’s equity portfolio consists of money market fundswith a volatility coefficient of less than 0.5. In addition, theseinvestments are made solely for the purpose of managingshort-term cash excess. Therefore, the sensitivity of the group’sincome to any impairment of these assets is negligible. Thusthe group’s exposure to stock risk is minimal.
4.5 OTHER PARTICULAR RISKS
Ship-building
One of the keys to success lies in providing our customers withcutting-edge vessels at competitive prices. BOURBON isdeveloping concepts for new generation vessels (diesel-electricpropulsion, DP2, etc.). It has them produced in quantities atcompetitive shipyards, which are located mainly in China, butalso in India and Nigeria, in order to achieve economies ofscale. BOURBON selects a limited number of shipyards, hencethere is a certain dependence on them. Failure by any of theseshipyards to meet a deadline could reduce BOURBON’s abilityto meet customer needs.
Business in Emerging Countries
BOURBON continues to do part of its business in emergingcountries. The risks associated with running a business in thosecountries can include political, economic, social or financialinstability. BOURBON attempts to conduct its business so as tohedge against those political or economic risks or risks ofconflict. However, BOURBON may not be able to hedgeagainst those risks and may also be faced with problemsconducting its business in such countries, which could have animpact on its results.
Cost Control
In a competitive environment, customer satisfaction requiresgood cost control. Having new vessels produced in quantitiesenables the group to follow a proven and profitable economicmodel for cost reductions in building and maintenance.

BOURBON 2006 Financial report I 21
5 Employment Information• The year 2006 saw sharp growth in the workforce – up 20% over the prior year (salaried employees of the group).
12.31.2006 12.31.2005
Managers 269 242
Employees and workers 1,298 1,002
Seamen
– Crew 1,666 1,476
– Officers 1,140 928
TOTAL 4,373(*) 3,648(*)
(*) Salaried employees of the group (not including affiliates).
The quality of the group’s services and the success of any ambitious growth plan depend in large part on BOURBON’s ability toattract and retain the loyalty of skilled employees and to maintain a level of training that constantly results in improved standards.
• A number of BOURBON vessels include new seamen in training as part of the crews of the new vessels entering the fleet. Theseinvestments in training are the main focus of our Human Resources policy. BOURBON provides every new employee with thetraining and logistics needed to complete his or her training. Therefore, BOURBON has developed action plans to ensure thathiring is done on an international basis and to actively continue its training policy at all levels. This is a worldwide training policy,and, regardless of the region, local managers must be able to offer on-the-job training to their seamen to help them obtain furthercertification.Thus, in 2006, the decision was made to develop two simulators – one in France and the other in the Philippines – for modernoffshore anchor-handling operations. These simulators confirm the relevance of new tools to the new operating procedures inoffshore oil and gas marine services. They help to standardize the training worldwide for all the BOURBON crews in a context inwhich the fleet is becoming increasingly standardized.Furthermore, BOURBON has elected to embark on a new path of “public-private” partnerships, which are an exceptional way tosupport and develop the excellence of French training and its international reach. Thus BOURBON participated in the financing ofa training center devoted to offshore oil and gas marine services, specializing in dynamic positioning.
• Moreover, the combined annual and special stockholders’ meeting of June 7, 2005 granted authority to the Board of Directorsto grant stock options to employees entitling them to subscribe for new shares in the company and/or to purchase outstandingshares in the company from purchases made by it up to 5% of the company’s capital stock.In this context, the Board of Directors, in its December 5, 2005 and its December 4, 2006 meetings, granted two tranches ofoptions to the BOURBON employees who played a major role in successfully achieving the company’s five-year objectives.
Management report

6.1 CAPITAL STOCK AND BREAKDOWN
As of December 31, 2006, the capital stock was set by law at 31,832,347 euros divided into 50,113,610 shares of the sameclass. As of that date, the total number of outstanding shares (entitling the holder to a dividend when earnings are appropriatedfor 2006) amounted to 50,195,528, because of the 81,918 shares issued when stock options were exercised between March20, 2006 (date of the last report on stock options exercised by the Board of Directors) and December 31, 2006. In its March 19,2007 meeting, the Board of Directors noted the corresponding capital increase.
The following table reflects the changes in the stockholder base, showing the stockholders now holding at least 5% of the capital:
Position as of 12.31.2006% of the
Number of % of the votingStockholders shares capital rights
Jaccar (*) 11,919,960 23.75 23.77
Schroders 2,523,062 5.03 5.03
Treasury stocks 43,936 0.09 –
Employees 474,107 0.94 0.94
Public 35,234,463 70.19 70.26
TOTAL 50,195,528 100.00 100.00
(*) Jaccar: the Jacques d’Armand de Chateauvieux family.
In addition, as of December 31, 2006, the employee stockholding base through the FCPE (fonds commun de placementd’entreprise) “Bourbon Expansion” included 851 persons for 474,107 shares, or 0.94% of the capital.
6.2 DIVIDENDS PAID FOR THE PAST THREE YEARS
We hereby report the dividends paid for the past three years and the corresponding tax credits as listed below:
Net Tax credit Total amountNumber dividend per share distributed
of shares per share (individual) in €
2003 7,032,000 1.40 0.70 9,844,800
2004 24,612,000 0.56(*) – 13,782,720(***)
2005 25,045,577 1.00(**) – 25,045,577
(*) Dividend eligible for an allowance of 50% for individuals with their tax residence in France, pursuant to article 158-3-2° of the General Tax Code.(**) Dividend eligible for an allowance of 40% for individuals with their tax residence in France, pursuant to article 158-3-2° of the General Tax Code.(***) Aside from the dividends paid in cash in 2005, the BOURBON stockholders received an in-kind dividend of 32.5 million euros in the form of a CBo Territoriastock pay-out.
6 BOURBON SA and its Stockholders
22 l BOURBON 2006 Financial report
Management report

BOURBON 2006 Financial report I 23
Management report
6.3 OPERATIONS PERTAINING TO THESTOCK OF THE COMPANY
6.3.1 Stock Buyback Program by the Company
As of December 31, 2006, the company owned 43,936shares, or 0.09% of the capital, through CM CIC Securities, theinvestment services company responsible for market-makingunder the AFEI charter.
It is furthermore specified that neither CM CIC Securities, asmarket maker, nor the company dealt in derivatives withBOURBON stock.
6.3.2 Operations carried out by Executives onBOURBON Stock
Aside from the stock options exercised as described in § 3.3.2above, we hereby inform you that in fiscal year 2006, thefollowing transactions were brought to our attention:
Jacques d’Armand de Chateauvieux, Chairman and ChiefExecutive Officer, acquired on the market, through thecompany Jaccar holding:• 37,500 shares of BOURBON on June 13, 2006,• 62,500 shares of BOURBON on June 14, 2006.
6.3.3 Stock Options Granted to Employees
The combined annual and special stockholders’ meeting ofJune 7, 2005 granted authority to the Board of Directors, in itstwenty-first special resolution, to grant, one or more times, tothe employees or to some of them or to some categories ofemployees or corporate officers, as defined by law, of thecompany or affiliates thereof as defined under articleL 225–180 of the French Commercial Law “Code decommerce”, options entitling the holder to subscribe for newstock in the company and/or to purchase outstanding stock inthe company from purchases made by it.
Under this authority, in its December 4, 2006 meeting, theBoard of Directors decided to open a fifth plan of 43,200 stockoptions that can be exercised from December 4, 2009 toDecember 3, 2011 at the price of 40.05 euros.
In all, in fiscal year 2006, the number of options granted to theten employees (excluding corporate officers) receiving thelargest option allocations amounted to 19,800.
We further inform you that during the year ended, some non-officer employees subscribed for shares from stock optionsexercised by the company. The ten largest amounts exercisedwere: 40,428 share purchase options at the price of 5.645euros (the option exercise conditions were adjusted to reflectthe two-for-one split in the number of shares comprising thecompany’s capital, as decided by the special stockholders’meeting of May 23, 2006).

24 l BOURBON 2006 Financial report
Management report
7.1 APPROPRIATION OF EARNINGS/DIRECTORS’ FEES
The following proposals shall be made to the stockholders’ meeting:
• to appropriate the earnings for the year as follows:
Profit for the year €14,655,838.56
Allocation to the legal reserve by withholding 5% from the profit for the year, limited to the amount needed to fully fund the legal reserve, i.e.: €61,711.81
The balance, i.e.: €14,594,126.75
Plus retained earnings, i.e.: €16,053.00
Forming a distributable profit in the amount of: €14,610,179.75(distributed in full to the stockholders as dividends)
• to supplement the amount of the dividend thus paid out from the profit for the year, with the sum of 15,507,137.05 euroswithheld from the item “Other reserves”, at the discretion of the company, the total amount of which (209,121,414.34 euros)will thus be reduced to the sum of 193,614,277.29 euros.
The total amount of the dividend paid out shall thus be set at:
Distribution in full of the distributable profit, i.e.: €14,610,179.75
Withholding from the item “Other reserves”, i.e.: €15,507,137.05
Total : €30,117,316.80
The dividend as set above amounts to 0.60 euro per share; it shall be paid out on or after June 1, 2007;Under the company’s share buyback program, treasury stock does not entitle the holder to dividends. The sum corresponding tounpaid dividends will therefore be booked under “Retained earnings”.This dividend will qualify the holder to an allowance of 40% applicable to individuals who are tax residents of France, i.e. 0.24euro per share; legal entities do not qualify for any allowance.There is no dividend distributed for this meeting, other than the dividend mentioned above, which may or may not be eligible forthe 40% allowance mentioned in paragraph 3, section 2 of article 158 of the General Tax Code.
• to set from January 1, 2007 the total maximum amount of the directors’ fees allocated to the Board of Directors at 200,000euros for fiscal year 2006 and subsequent years.
7.2 SITUATION WITH REGARD TO THE TERMS OF OFFICE OF THE DIRECTORS
The terms of Directors of Victoire de Margerie and Jacques d’Armand de Chateauvieux expire with this annual general meeting;for anyone wishing to renew their term, a proposal will be made to the stockholders’ meeting to renew their terms of office foranother three-year period, i.e. until the annual stockholders’ meeting scheduled in 2010 to approve the statements for the yearended December 31, 2009.
In its meeting scheduled for May 29, 2007, after the annual meeting is held, the Board of Directors will decide on the renewal ofJacques d’Armand de Chateauvieux’s term of office as Chairman and Chief Executive Officer.
7 Proposals of the Board of Directors

BOURBON 2006 Financial report I 25
Management report
7.3 TREASURY STOCKBUYBACK PROGRAM
It shall be resolved that the annual stockholders’ meeting:
• terminate the current stock buyback program approved by thecombined annual and special meeting of May 23, 2006;
• authorize a new treasury stock buyback program for thecompany.
7.4 CAPITAL INCREASE BY CAPITALIZATIONOF PART OF THE ITEM “ADDITIONAL PAID-IN CAPITAL”;GRANT OF ONE SCRIP ISSUE TO STOCKHOLDERS FOR EVERY 10 SHARES OUTSTANDING AS OF THE DATE OF THE MEETING
It shall be resolved that the annual stockholders’ meeting:
• increase the capital stock by 3,188,437.72 euros to raise itfrom 31,884,382.26 euros to 35,072,819.98 euros bycapitalizing part of the item “additional paid-in capital”. Thiscapital increase will be carried out by issuing 5,019,552 scripissues awarded free of charge to stockholders at the rate of onenew share for ten already held.The amount of the capital increase, as well as the number ofnewly issued shares, shall be supplemented, as the case maybe, by the necessary sum in the event of any capital increasereported during the implementation of the present decisionthat is carried out following the exercise of stock options by therecipients thereof, subject to the option for the Board ofDirectors to suspend temporarily the rights of the optionholders so that the operation can be completed.The new shares shall bear interest from January 1, 2007 andwill be combined with the old shares after the 2006 dividendis paid on them.Fractional shares shall be neither transferable nor negotiableand the corresponding shares shall be sold; the proceeds fromthe sale shall be allocated to the holders of the rights no laterthan thirty days after the whole number of shares belonging tothem is registered in their account.
• give full powers to the Board of Directors:– to implement the decision by the stockholders’ meeting
as soon as it is over,– to adjust the final amount of capitalization of reserves
taking into account the number of shares comprisingthe capital stock on the date this decision isimplemented,
– to suspend temporarily if necessary the exercise of therights of stock subscription optionees in order to allowthe operation to be completed,
– thereafter to take any and all measure to preserve therights of the optionees under the conditions set forth byarticle 174-10 of the decree of March 23, 1967,
– In general, to take any and all measures necessary forthe proper execution of the decision made by thestockholders’ meeting.
Therefore, it shall be resolved that the stockholders’ meetingamend article 7 of the bylaws on the capital stock (subject toadjustment of the final amount of the capital increase asstipulated).
7.5 OTHER AMENDMENTSTO THE BYLAWS PROPOSEDTO THE MEETING
ARTICLE 14 – Organization and deliberations of the Board
II – Meetings of the Board
The Board of Directors shall meet as often as warranted bythe interests of the company, at the invitation of its chairman.Furthermore, if the Board has not met for more than twomonths, a number of Directors comprising at least one third ofthe members of the Board may ask the Chairman to convenea meeting on a given agenda.The chief executive may also ask the Chairman to convene ameeting of the Board of Directors on a given agenda.The Board shall meet at the corporate office or at any otherplace in the same city and shall be chaired by its chairman or,if the chairman is unable to attend, then any memberdesignated by the Board to chair the meeting. It may meet atany other place with the agreement of the majority of theDirectors.A ledger shall be kept which shall be signed by the Directorsattending the Board meeting.In accordance with the laws and regulations on the conditionsfor holding meetings of the Board of Directors, meetings maybe held by videoconference or by any othertelecommunications method. An internal regulation drawnup by the Board of Directors shall define the practicalprocedures for using these methods.

26 l BOURBON 2006 Financial report
Management report
IV – Representation
Any Director may, by letter, facsimile, e-mail, or telegram,assign another Director to represent him or her at a workingmeeting.For the same meeting, each Director may have only one of theproxies received by applying the foregoing paragraph.These provisions shall apply to the permanent representativeof any legal entity serving as Director.
The rest remains unchanged
ARTICLE 15 – Powers of the Board of Directors
II – Organization of the work of the Board of Directors
The Chairman of the Board of Directors shall organize anddirect the work of the Board, and shall report on it to thestockholders’ meeting and shall implement its decisions. Heshall see to it that the management structure operatesproperly and that the Directors are able to perform theirmission.
The rest remains unchanged.
ARTICLE 19 – Convening Stockholders’ Meetings
Stockholders’ meetings shall be convened under theconditions set by law and the bylaws. They shall be held at anylocation specified in the meeting notice.
Any stockholder, regardless of the number of shares held, mayparticipate, in person or by proxy, in the meetings, by providingproof of identity and ownership of the shares, in the form ofeither registration or as booking in the bearer accountsheld by an authorized intermediary no later than the thirdbusiness day preceding the meeting at zero hours,Paris time.The registration of or booking of the shares in the bearershare trading account kept by the certified intermediaryshall be noted by an affidavit attesting to share ownershipissued by the intermediary as an appendix to the vote bymail ballot or proxy or to the application for anadmission card.Once a stockholder has already voted by mail, sent in aproxy or applied for an admission card, no other methodmay be chosen for participating in the meeting.In the absence of the chairman and unless other provisionsare made to the contrary, the meeting shall be chaired by theDirector especially appointed by the Board. If a Director is notdelegated, then the meeting shall elect its chairman.
The rest remains unchanged.
7.6 GRANT OF SCRIP ISSUESOUTSTANDING ORTO BE ISSUED TO SALARIEDEMPLOYEES OF THE GROUP
The annual meeting will be asked to grant authority to theBoard of Directors, in accordance with and under theconditions set forth by articles L 225-197-1 to L 225-197-5 ofthe French Commercial Law “Code de commerce”, to grant,one or more times, to the salaried employees of the companyor some categories thereof and/or to the executives named inarticle L 225-197-1 II of the French Commercial Law, as well asto the salaried employees and to the executives of thecompanies and the affiliated economic interest groups underthe conditions set forth in article L 225-197-2 of the FrenchCommercial Law, scrip issues in the company, eitheroutstanding or to be issued.
*
* *
The draft resolutions submitted to you refer to the main pointsof this report. We would very much appreciate it if you wouldapprove them. Thanking you for your trust in us,
The Board of Directors.

BOURBON 2006 Financial report I 27
Management report
Description 2006 2005 2004 2003 2002
Capital stock at year-endCapital (in € thousands) 31,884 31,267 31,267 26,801 26,801
Number of ordinary shares outstanding 50,195,528 (1) 25,045,577 24,612,000 7,032,000 7,032,000
Number of shares with preferred dividends(without voting rights) outstanding 0 0 0 0 0
Maximum number of future shares tobe issued 0 0 0 0 0
– by converting bonds 0 0 0 0 0
– by exercising subscription rights 1,067,578 602,226 684,727 0 0
Operation and profit/loss for the year(in € thousands)Revenues excluding taxes 1,204 1,534 1,175 1,305 1,458
Net income before income tax, employeeprofit-sharing, depreciations and provisions 10,546 164,024 40,892 16,258 22,923
Income tax (4,411) (2,331) 17,341 6,690 4,327
Employee profit-sharing for the year 0 0 0 0 0
Net income after income tax, employee profit-sharing, depreciations and provisions 14,656 181,000 39,162 (472) 2,355
Distributed net income 30,117 (2) 25,046 (4) 13,783 9,845 7,595
Earnings per share (in €)Net income after income tax, employeeprofit-sharing but before depreciationsand provisions 0.30 6.45 2.37 3.26 3.88
Net income after income tax, employeeprofit-sharing, depreciations and provisions 0.29 7.23 1.59 (0.07) 0.33
Dividend per share 0.60 1.00 (4) 0.56 1.40 (5) 1.08 (5)
PersonnelAverage salaried workforce during the year – – – – –
Employee welfare contributions and similarcharges (social security, employeeorganizations, etc.) – – – – –
(1) or 50,113,610 shares + 81,918 stock options exercised as of 12/31/2006.(2) or 0.60 euro per share according to the proposal by the Board of Directors on 03/19/2007.(3) or 24,612,000 shares + 433,577 stock options exercised as of 12/31/2005.(4) or 1.00 euro per share according to the proposal by the Board of Directors on 03/20/2006 and before the two-for-one split.(5) for 7,032,000 shares (compared with 25,045,577 in 2005).
BOURBON SA five-year financial summary

28 l BOURBON 2006 Financial report
Management report
Table summarizing the delegations of authority and thepowers granted by the annual meeting to the Board ofDirectors as applied to capital increases (*)
Date of the annual meeting Type of delegation Duration Use during 2006
Combined annual andspecial stockholders’ meetingof 06.07.2005
Authority granted to theBoard of Directors to grant,one or more times, stockoptions entitling the holdereither to subscribe for newshares in the companyand/or to purchaseoutstanding shares frompurchases made by it.
Thirty-eight months, i.e.until 08.06.2008.
The Board of Directors’meeting of 12.04.2006decided to grant 43,200 newstock options in the companyto be issued under a capitalincrease.
These stock options may beexercised from December 4,2010, the start of the 5thyear of the allotment anduntil December 3, 2012, theend of the 6th year of theallotment.
(*) The above table includes the delegations in the process of being validated and their use in fiscal year 2006.

BOURBON 2006 Financial report I 29
Consolidated
financial statementsContents
30 I Consolidated balance sheet for the year ended December 31, 2006
31 I Consolidated income statement
32 I Consolidated cash flow statement
34 I Consolidated statement of changes in stockholders’ equity
38 I Notes to the consolidated financial statements
95 I Statutory Auditors’ report on the consolidated financial statementsfor the year ended December 31, 2006

30 l BOURBON 2006 Financial report
Consolidated financial statements
(in € thousands) Notes 2006 2005
Goodwill 3.1 14,185 2,327
Intangible assets 3.2 5,861 8,564
Property, plant and equipment 3.3 - 3.4 1,641,698 1,373,070
Investments in associates 3.5 10,904 99,000
Non-current financial assets 3.6 97,799 71,098
Deferred tax assets 3.16 6,476 6,900
Total non-current assets 1,776,923 1,560,958
Inventories and work in progress 3.7 14,035 13,344
Trade and other receivables 3.8 194,260 167,569
Tax receivables – –
Current financial assets 3.8 18,212 16,428
Other current assets 3.8 9,602 8,417
Cash and cash equivalents 3.9 269,683 232,261
Total current assets 505,792 438,019
Non-current assets classified as held for sale 2.2 134,445 –
TOTAL ASSETS 2,417,160 1,998,977
Capital 31,884 31,267
Share premium 49,145 44,281
Consolidated reserves, group share (including profit for the year) 739,524 631,296
Total stockholders’ equity, group share 820,553 706,844
Minority interests 52,875 53,670
Total stockholders’ equity 873,428 760,514
Borrowings and financial liabilities 3.14 902,362 731,989
Employee benefit obligations 3.13 14,968 14,114
Other provisions 3.13 12,479 13,188
Deferred tax liabilities 3.16 40,742 41,393
Other non-current liabilities 4,594 2,585
Total non-current liabilities 975,145 803,269
Borrowings and bank loans (< one year) 3.14 383,168 292,915
Provisions (< one year) 3.13 1,127 384
Trade and other payables 142,538 127,374
Tax liabilities 3,626 4,821
Other current liabilities 13,129 9,701
Total current liabilities 543,588 435,195
Liabilities directly associated with non-current assetsclassified as held for sale 2.2 24,999 –
Total liabilities 1,543,732 1,238,464
TOTAL LIABILITIES AND STOCKHOLDERS’ EQUITY 2,417,160 1,998,977
Consolidated balance sheet for the year endedDecember 31, 2006

2005(in € thousands) Notes 2006 2005 Published
Revenues 4 717,640 614,461 1,022,021
Costs of goods and services sold 4.1 (387,514) (362,311) (726,411)
General and administrative costs 4.1 (53,601) (44,819) (55,302)
Increases and reversals of amortization, depreciation and provisions 4.1 (96,187) (80,699) (91,300)
Other operating expenses and income 4.1 1,045 (849) (849)
Operating income 181,383 125,783 148,159
Cost of net debt 3.15 (30,345) (21,816) (24,751)
Other financial expenses and income 3.15 3,510 9,908 11,048
Income from current operations before income tax 154,548 113,875 134,456
Income tax 3.17 (5,355) (10,158) (18,741)
Share in income/(loss) of associates 3.5 4,042 42 5,115
Net income before net gains on equity interests sold and netincome from discontinued operations 153,235 103,759 120,830
Net gains on equity interests sold 3,820 94,096 94,096
Net income from discontinued operations 2.2 7,876 17,071 –
Net income 164,931 214,926 214,926
Group share 152,891 205,039 205,039
Minority interests 12,040 9,888 9,888
Net earnings per share 5.2.1 3.05 4.15 4.15
Diluted net earnings per share 5.2.2 3.03 4.08 4.09
Net earnings per share – excluding income from discontinued operations 5.2.1 2.89 3.81 4.15
Diluted net earnings per share – excluding income from discontinuedoperations 5.2.2 2.87 3.75 –
Net earnings per share – income from discontinued operations 5.2.1 0.16 0.35 –
Diluted net earnings per share – income from discontinued operations 5.2.2 0.16 0.34 –
Net earnings per share – excluding gains on equity interests sold andincome from discontinued operations 5.2.1 2.82 1.90 2.25
Diluted net earnings per share – excluding gains on equity interests soldand income from discontinued operations 5.2.2 2.80 1.87 2.21
Net dividend per share 0.60(1) 0.50(2) 0.50(2)
(1) Recommendation of the Board of Directors on March 19, 2007.(2) After the 2-for-1 stock split on June 1, 2006.
BOURBON 2006 Financial report I 31
Consolidated financial statements
Consolidated income statement

(in € thousands) 2006 2005
Consolidated net income 164,931 214,926
Share in income/loss of associates (15,005) (5,115)
Tax expenses/income 5,342 23,991
Net amortization, depreciation and provisions 97,576 96,845
Gains and losses from changes in fair value (4,257) (1,893)
Calculated income and expenses related to stock options and similar benefits 1,994 1,011
Gains and losses on disposals (25,675) (94,336)
Income tax paid (5,197) (15,865)
Cash flow 219,709 219,564
Effect of changes in working capital (11,776) 7,496
Dividends received (50) (517)
Cost of net debt 30,654 24,751
Cash flows from operating activities (A) (**) 238,537 251,294
Acquisition of consolidated companies, net of cash acquired (20,318) (7,676)
Sale of consolidated companies, including cash transferred – 222,375
Effect of other changes in the consolidation scope – (64,081)
Payments for property, plant and equipment and intangible assets (466,257) (358,538)
Proceeds from disposal of property, plant and equipment and intangible assets 169,971 3,524
Payments for acquisition of long-term financial assets (66) (3,724)
Proceeds from disposal of long-term financial assets 9,465 276
Dividends received 50 517
Changes in loans and advances granted (29,160) 33,791
Cash flows from investing activities (B) (**) (336,315) (173,536)
Capital increase 5,481 2,620
Capital repayment (445) (3,469)
Net sales (acquisition) of treasury shares (269) 321
Proceeds from borrowings 397,585 475,824
Repayments of borrowings (292,047) (443,268)
Dividends paid to parent company stockholders (25,046) (13,783)
Dividends paid to minority interests (1,569) (1,148)
Net interest paid (30,654) (24,751)
Cash flows from financing activities (C) (**) 53,036 (7,654)
Effect of changes in exchange rates (**) (13,332) 5,381
Effect of changes in accounting principles – –
Change in net cash (A) + (B) + (C) (**) (58,074) 75,485
Cash at beginning of period 83,553 8,068
Cash at end of period (*) (**) 25,479 83,553
Change in cash (58,074) 75,485
32 l BOURBON 2006 Financial report
Consolidated financial statements
Consolidated cash flow statement

BOURBON 2006 Financial report I 33
Consolidated financial statements
(in € thousands) 2006 2005
(*) including:
– Marketable and other securities 90,030 14,257
– Cash and cash equivalents 180,971 218,004
– Bank overdrafts (245,522) (148,708)
(**) including discontinued operations:
Cash flows from operating activities 3,806 25,534
Cash flows from investing activities (11,849) (57,104)
Cash flows from financing activities 8,429 (2,935)
Effect of changes in exchange rates (132) –
Change in net cash 254 (34,506)
Cash at beginning of period 1,063 35,569
Cash at end of period 1,317 1,063
Change in net cash 254 (34,506)

YEAR 2006
Capital and related reserves
Share PremiumShare and reserves Reclassification
Consolidated
Capital related to on of treasuryreserves,
(in € thousands) share capital sharesgroup share
Stockholders’ equity at December 31, 2005 31,267 44,281 (310) 452,864
2005 earnings 205,039
Stockholders’ equity at January 1, 2006 31,267 44,281 (310) 657,903
Cash flow hedge (IAS 39)
Change in currency translation adjustments
Reclassification of treasury shares (2,095)
Total income and expenses for the yearrecognized directly as stockholders’ equity – – (2,095) – 2006 earnings
Total income/expenses for the year – – (2,095) – Capital increase 617 4,864
Dividends paid by the parent company in 2006 (25,046)
Capital repayment
Recognition of share-based payments 1,994
Other changes
Stockholders’ equity at December 31, 2006 31,884 49,145 (2,405) 634,851
The other changes in minority interests are primarily related to the spin-off of the EIDSURF company (€-5.6 m) and the purchaseof the minority interests in Bourbon Offshore II AS and Bourbon Offshore II KS (€-3.3 m).
The capital repayment represents the share of the minority stockholders in the capital repayment of the Vietnamese subsidiary51% held by the group.
34 l BOURBON 2006 Financial report
Consolidated financial statements
Consolidated statement of changes in stockholders’ equity

Unrealized or deferred gains/losses
Change in Change in fair Net income,Total Total
Currency fair value of value of group sharestockholders’ Minority consolidated
translation available-for-sale hedgingequity, group interests stockholders’
adjustments investments derivativesshare equity
(28,624) – 2,327 205,039 706,844 53,670 760,514
(205,039) – –
(28,624) – 2,327 – 706,844 53,670 760,514
7,007 7,007 7,007
(26,523) (26,523) (1,891) (28,414)
(2,095) (2,095)
(26,523) – 7,007 – (21,611) (1,891) (23,502)152,891 152,891 12,040 164,931
(26,523) – 7,007 152,891 131,280 10,149 141,429 5,481 5,481
(25,046) (1,571) (26,617)
– (445) (445)
1,994 1,994
– (8,928) (8,928)
(55,147) – 9,334 152,891 820,553 52,875 873,428
BOURBON 2006 Financial report I 35
Consolidated financial statements

YEAR 2005
Capital and related reserves
Share Share Premium Reclassification
Capital and reservesof treasury
Consolidated
related toshares
reserves
(in € thousands) share capital
Stockholders’ equity at December 31, 2004 31,267 44,281 (262) 471,377
2004 earnings 101,361
Stockholders’ equity at January 1, 2005 31,267 44,281 (262) 572,738
Financial instruments – 1st time adoption of IFRS
Cash flow hedge (IAS 39)
Change in currency translation adjustments
Reclassification of treasury shares (48)
Total income and expenses for the yearrecognized directly as st. equity – – (48) – 2005 income (loss)
Total income and (expenses) for the year – – (48) – Capital increase 2,620
Dividends paid by the parent company in 2005 (46,271)
Capital repayment (3,511)
Recognition of share-based payments 1,011
Stockholders’ equity at December 31, 2005 31,267 44,281 (310) 526,587
36 l BOURBON 2006 Financial report
Consolidated financial statements
Consolidated statement of changes in stockholders’ equity

Unrealized or deferred gains/losses Of which:
Currency Change in fair Change in fair Net Total
translation value of value of hedging income stockholders’ Group Minority
adjustments available-for-sale derivativesequity share interests
investments
(77,208) 101,361 570,816 525,507 45,309
(101,361) –
(77,208) – – – 570,816 525,507 45,309
(11,244) (11,244)
13,571 13,571
18,644 18,644
(48)
18,644 – 2,327 – 20,923 214,926 214,926
18,644 – 2,327 214,926 235,849 2,620
(46,271)
(3,511)
1,011
(58,564) – 2,327 214,926 760,514 706,844 53,670
Consolidated financial statements
BOURBON 2006 Financial report I 37

38 l BOURBON 2006 Financial report
Consolidated financial statements
Notes to theconsolidated financial statements
1. Accounting policies and methods p. 382. Significant information concerning the
year ended December 31, 2006 p. 493. Notes to the consolidated financial
statements p. 544. Segment reporting p. 825. Other information p. 85
1 ACCOUNTING POLICIES AND METHODS
1.1 General information
The consolidated financial statements for fiscal year 2006 wereapproved by the BOURBON Board of Directors on March 19,2007. BOURBON is an incorporated company registered inFrance, the shares of which are listed for trading on EUROLISTCompartment A.
1.2 Basis of preparation of the consolidated financial statements
The consolidated financial statements include the financialstatements of BOURBON SA and its subsidiaries at December31 of each year. The financial statements of the subsidiaries areprepared over the same reference period as those of theparent company, on the basis of homogeneous accountingpolicies.
Statement of compliance
BOURBON consolidated financial statements for the yearended December 31, 2006 have been prepared in accordancewith the International Financial Reporting Standards (IFRS), asadopted in the European Union.
The IFRS include the IFRS, the International AccountingStandards (IAS) and the interpretations of the InternationalFinancial Reporting Interpretations Committee (IFRIC) and theStanding Interpretations Committee (SIC).
The standards and interpretations used to prepare theconsolidated financial statements at December 31, 2006 arethose published in the Official Journal of the European Union,the application of which is mandatory as of December 31,2006.
Pursuant to Article 28 of European Regulation 809/2004 ofApril 29, 2004, the following information is included byreference:
• The consolidated financial statements for the year endedDecember 31, 2005 and the auditors’ report on thosestatements, provided in the registration document filed on May15, 2006 with the Autorité des Marchés Financiers (on pages25-75 and pages 76-77 respectively).• The consolidated financial statements for the year endedDecember 31, 2004 and the auditors’ report on thosestatements, provided in the registration document filed June 3,2005 with the Autorité des Marchés Financiers (pages 45-72and 73 respectively).
Consolidated financial statements – Bases of preparation
The group’s consolidated financial statements have beenprepared on the historical cost basis, with the exception ofderivative instruments and available-for-sale financial assets,which are measured at fair value. The consolidated financialstatements are presented in thousands euros, and are roundedoff to the next highest thousand when the amount after thedecimal point is equal to or greater than €500.
The subsidiaries are consolidated from the effective date ofacquisition, which is the date on which the group obtainscontrol, until the date on which this control ceases to beexercised.
Minority interests represent the share of profit or loss and netassets which are not held by the group. They are presented inthe income statement and in stockholders’ equity on theconsolidated balance sheet separately from the group’s shareof income/loss and stockholders’ equity.
All intercompany balances and transactions as well as theincome, expenses and gains or losses included in the bookvalue of assets which come from internal transactions, are fullyeliminated.
As required by IAS 1, the assets are presented as current assetson the consolidated balance sheet when they meet one of thefollowing criteria:• the expected liquidation date is less than twelve months orless than the group’s normal business cycle;• they are essentially held for transaction purposes.
All other assets are classified as non-current assets.

BOURBON 2006 Financial report I 39
Liabilities are presented as current liabilities on theconsolidated balance sheet when they meet one of thefollowing criteria:• the expected settlement date is less than twelve months orless than the group’s normal business cycle;• they are essentially held for transaction purposes; • the group does not hold an unconditional right to deferpayment at least for the period of twelve months after closing.
All other liabilities are classified as non-current liabilities.
1.3 Adoption of the new and revised standards
The accounting policies applied as of December 31, 2006 areconsistent with those of the previous year.
However, during the year, the group adopted the new IFRSstandards and amendments as well as the IFRIC interpretationspresented below. The adoption of these standards andinterpretations had no impact on the group’s financialstatements. However, they can generate additional notes.
• IAS 19 Amendment – Employee benefits;• IAS 21 Amendment – Effects of changes in foreign exchangerates;• IAS 39 Amendment – The Financial instruments: recognitionand measurement;• IFRIC 4 - Determining whether an arrangement contains alease.
Interpretations IFRIC 5 and IFRIC 6 are not applicable to thegroup’s operations and businesses as of this date.
In addition, the group has elected not to apply the followingstandards and interpretations early:
• IFRS 7 Financial instruments: Disclosures;• IAS 1 Amendment – Presentation of financial statements;• IFRIC 7, IFRIC 8 and IFRIC 9.
The principal effects of these changes are presented below.
IAS 19 Employee benefits
As of January 1, 2006, the group adopted the amendment toIAS 19. In particular, the group used the option which allowsaccounting for actuarial variances, during the period in whichthey occur, not as income/loss for the period, but directly instockholders’ equity. The adoption of this amendment had noimpact on the group’s financial statements atDecember 31, 2006.
IAS 21 Effect of changes in foreign exchange rates
As of January 1, 2006, the group adopted the amendments toIAS 21. As a result, all foreign exchange differences resultingfrom a monetary element that is part of the group’s netinvestment in a foreign operation are recognized as a distinctcomponent of stockholders’ equity in the consolidated financialstatements, whatever the currency in which the monetaryelement is denominated. This change had no significantimpact, either at December 31, 2006 or December 31, 2005.
IAS 39 Financial instruments:recognition and measurement
Amendment concerning financial guarantee contracts (issuedin August 2005) – This amendment modified the scope ofapplication of IAS 39 in order to recognize financial guaranteecontracts that are not considered insurance contracts initially atfair value, and to value them at the higher of two amounts: theamount determined by applying IAS 37 “Provisions, ContingentLiabilities and Contingent Assets”, and the amount recognizedinitially minus, when necessary, cumulative amortization anddepreciation accounted for in accordance with IAS 18“Revenue”.
This amendment had no impact on the financial statements.
Amendment concerning Cash Flow Hedge Accounting ofForecast Intragroup Transactions (issued in April 2005) – Thisamendment modifies IAS 39, so as to allow the treatment of ahighly probable intragroup transaction, denominated in aforeign currency, as a hedged item in a cash flow hedgerelation, since the transaction is denominated in a currencyother than the functional currency of the entity participating inthe transaction and the risk related to the foreign currency willaffect the consolidated income statement. This amendmenthad no impact on the financial statements.
Amendment related to the Fair Value Option (published inJune 2005) – This amendment modifies IAS 39 and limits theuse of the option to designate a financial asset or a financialliability as having to be measured at fair value; the variations arebooked in the income statement. Insofar as the group had notused this option in the past, this amendment has no impact onthe financial statements.
IFRIC 4 Determining whether an arrangement contains a lease
As of January 1, 2006, the group adopted this interpretationwhich provides comments allowing determination of whetherarrangements are, or contain, leases that must be recognizedin accordance with IAS 17. The adoption of this interpretationhad no material impact for the group, either at December 31,2006 or December 31, 2005.
Consolidated financial statements

40 l BOURBON 2006 Financial report
Consolidated financial statements
1.4 Use of estimates and assumptions
Preparation of the financial statements in accordance with theconceptual framework of the IFRS involves the use ofestimates, assumptions and assessments that affect theamounts presented in those financial statements. Theseestimates are based on past experience and on other factorsconsidered to be reasonable given the circumstances. As theassumptions and assessments used and the circumstancesexisting on the date the statements are established may proveto be different in reality, the future results achieved may differfrom the estimates used.
The principal assumptions concerning future events, and othersources of uncertainty related to the use of estimates on theclosing date, changes in which during a year could generate arisk of a change in the net book value of assets and liabilities,are presented below.
Retirement benefits
The cost of defined benefit plans and other post-employmentmedical coverage benefits is determined on the basis ofactuarial valuations. Those valuations are based onassumptions about discount rates, salary increase rates,mortality rates, and the probability of employment in the groupat the time of retirement. Because of the long-term nature ofsuch plans, the uncertainty of those estimates is significant. Thenet liabilities (long-term portion) funded for these benefitsgranted to employees as of December 31, 2006 was €14.6 m(€13.9 m in 2005). More details are provided in note 3.13.
Financial instruments measured at fair value
For most of the instruments traded over the counter, thevaluation is made using models that use observable marketdata. For example, the fair value of interest rate swaps isgenerally determined using rate curves based on the marketinterest rates observed on the closing date. The fair value offorward currency purchases is calculated by reference tocurrent forward exchange rates for contracts with similarexpiration profiles. The discounting future cash flows method isused to value other financial instruments.
Impairment test on goodwill
At least once a year, the group assesses whether it is necessaryto depreciate goodwill by using impairment tests (see note1.5.2). Those tests require an estimate of the useful value ofthe cash generating units to which the goodwill is allocated. Inorder to determine this useful value, the group must estimatethe future cash flows expected from each cash generating unitand an appropriate discount rate in order to calculate thepresent value of these cash flows.
Impairment test on assets
Intangible assets with definite useful life and property, plantand equipment are tested for possible impairment as soon asthere is any indication that the assets may be impaired (seenotes 1.5.5 and 1.5.6), i.e. when events or specificcircumstances indicate a risk of impairment loss. In order toconduct these tests, non-current assets are grouped into cashgenerating units and their net book value is compared to therecoverable value of said units. Recoverable value is defined asthe higher of the useful value or the fair value (net of disposalcosts). In order to determine the useful value, the group mustestimate the future cash flows expected from each cashgenerating unit and an appropriate discount rate to calculatethe present value of such cash flows.
Foreign exchange rate assumptions
In its various estimates, particularly during impairment tests ongoodwill and assets, the group makes assumptions aboutforeign exchange rates, for example to determine the futurecash flows expected from each cash generating unit.
1.5 Summary of the main accounting policies
1.5.1 Foreign currency translation
The consolidated financial statements are disclosed in euros,which is the functional and presentation currency of the parentcompany. The functional currency of the foreign subsidiaries isgenerally the local currency. If the majority of the transactionsand costs are executed in a different currency, that currency isused. Based on this principle, the functional currency of theBulk subsidiaries of the group is the US Dollar instead of thelocal currency, which is the euro.
The accounts of subsidiaries with a functional currency differentfrom euro are translated by applying the closing rate method:• balance sheet items, with the exception of stockholders’equity, which are maintained at the historical rate, areconverted at the year-end exchange rate;• items on the income statement are translated at the averagerate for the period;• the currency translation adjustment is included inconsolidated stockholders’ equity and does not affectincome/loss.

BOURBON 2006 Financial report I 41
Foreign currency transactions are initially booked in thefunctional currency at the exchange rate prevailing on the dateof the transaction. On the closing date, monetary assets andliabilities denominated in foreign currencies are translated intothe functional currency at the exchange rate prevailing on theclosing date. All exchange differences are recognized in theincome statement, with the exception of those related toborrowings in foreign currencies which constitute a hedge ofthe net investment in a foreign operation. These differences aretransferred directly to stockholders’ equity until the disposal ofthe investment; on that date, they are recognized asincome/loss.
Pursuant to IAS 21, goodwill is expressed in the functionalcurrency of the holding companies, then translated at theclosing rate (IAS 21.47).
1.5.2 Business combinations and goodwill
Business combinations (IFRS 3) are recognized using thepurchase method. This method implies the recognition at fairvalue of the identifiable assets (including intangible assets notpreviously recognized) and identifiable liabilities (includingcontingent liabilities, with the exception of future restructurings)of the companies acquired.
The goodwill arising on a business combination is initiallyrecognized at cost, which represents the excess of theacquisition cost over the group’s interest in the net fair value ofthe identifiable assets, liabilities and contingent liabilities. Afterthe initial recognition, goodwill is measured at cost lessaccumulated impairment losses. For the purpose ofimpairment tests, the goodwill acquired in a businesscombination is, as of the acquisition date, allocated to each ofthe cash generating units likely to benefit from the synergies ofthe business combination. For BOURBON, the cash generatingunits correspond to the three businesses of thegroup:,Offshore, Towage & Salvage and Bulk. Impairment testsare performed once there are indices of a loss of value and atleast once a year.
When subsidiaries are sold, the difference between the saleprice and the net asset sold plus accumulated currencytranslation adjustments and the net value of the goodwill isrecognized in the income statement.
1.5.3 Negative goodwill
Negative goodwill represents the surplus between the group’sinterest in the fair value of the assets, liabilities and contingentliabilities acquired over the acquisition cost, on the acquisitiondate.
It is booked directly as income/loss during the acquisitionperiod.
1.5.4 Equity interests in joint ventures
The group holds equity interests in joint ventures. A jointventure results from a contractual agreement under which twoor more parties agree to conduct an economic activity underjoint control. An entity under joint control is a joint venture,involving the creation of a separate entity in which each co-entrepreneur holds an equity interest. The group recognizes itsinterest in a jointly controlled entity using proportionatelyconsolidation. The group consolidates line by line its share inall assets, liabilities, income and expenses of the jointlycontrolled entity. The financial statements of the jointlycontrolled entity are established for the same reference periodas those of the parent company, using homogeneousaccounting methods. Adjustments are made to harmonize anydifferences in accounting policies.
When the group contributes or transfers an asset to a jointlycontrolled entity, the share of the gain or loss resulting from thistransaction is recognized according the substance of thetransaction. When the group acquires assets of the jointlycontrolled entity, the group recognizes its share of the profitrealized on the transaction by the jointly controlled entity onlyon the date on which the said assets are sold to anindependent third party.
The joint venture is consolidated proportionately until the dateon which the group ceases to have joint control of the entity.
1.5.5 Intangible assets
Intangible assets acquired separately are initially reported atcost. The cost of an intangible asset acquired within a businesscombination is its fair value on the acquisition date. After theinitial accounting, intangible assets are carried at cost less anyaccumulated amortization and accumulated impairment losses.Internally-generated intangible assets are recognized asexpenses when they are incurred.
The group assesses whether the useful life of an intangibleasset is finite or indefinite.
Intangible assets with a finite useful life are amortized over theireconomic useful life and are subject to an impairment testwhen there is an indication that the intangible asset isimpaired.
The amortization period and method for amortizing anintangible asset with a finite useful life are reviewed at least atthe closing of each year. Any change in the expected useful lifeor the expected rate of consumption of the future economicbenefits representing the asset is accounted for by modifyingthe amortization period or method, as applicable, and suchchanges are treated as changes in estimates. The amortizationexpense for intangible assets with a finite useful life is booked
Consolidated financial statements

42 l BOURBON 2006 Financial report
Consolidated financial statements
on the income statement in the appropriate expense categorydepending on the function of the intangible asset.
The amortization periods of the main intangible assets are:• software: 3 years;• leasehold rights, over the period of the concessions: 38 to 50years.
At BOURBON, intangible assets with an indefinite useful life arebusiness goodwills which are identifiable by activity. Theircarrying amount is essentially based on port operating rights.Impairment loss is booked when its recoverable valuecalculated on the basis of criteria such as revenues andprofitability becomes less than the carrying amount. Theseassets are not amortized.
1.5.6 Property, plant and equipment
Property, plant and equipment are booked at cost afterdeducting accumulated depreciation and any accumulatedimpairment losses.
The residual values, useful lives and depreciation methods arereviewed at each year-end and changed if necessary.
Vessels
A) Gross value
Property, plant and equipment consist primarily of vesselsvalued on the date they are included in the group’s assets atcost, i.e. the cost incurred to commission the asset for theprojected use.
The cost of a tangible asset consists of the purchase price paidto a third party (including customs duties and non-recoverabletaxes, but net of discounts and commercial rebates obtainedfrom the supplier), plus the following acquisition costs:• directly attributable costs incurred to bring the asset into
working condition for the planned use;• installation costs;• mobilization costs to the operating location;• sea trial costs;• legal documentation costs;• professional fees (architects, engineers);• commissions,• costs for interim loans directly intended to finance theacquisition of the asset.
A tangible asset may include several components with separatelife cycles or rates of depreciation. In this case, the mainelements of the asset are identified and recognized separatelyusing the component-based approach.
At BOURBON, each vessel consists of two components:• a “vessel” component;• an “overhaul” component.
An overhaul consists of maintenance operations performed atregular intervals, based on a long-term plan designed to meetclassification requirements, international conventions orregulations.
At the acquisition date, the value of the “vessel” component isthe total cost price of the asset minus the “overhaul” component;this component is equal to the first overhaul of the vessel.
B) Depreciation
Depreciation is calculated on the basis of the gross value of thecomponent less its residual value.
Residual value is the expected selling price (less selling costs)which the group would obtain today from the sale of this assetat the end of its use by the group.
The depreciable amount of the “vessel” component is equal toits gross value in the consolidated accounts less its residualvalue. As the “overhaul” component has a zero residual value,its depreciable amount corresponds only to its gross value inthe consolidated accounts.
Each component is then depreciated using the straight-linemethod over its useful life.
Useful life is defined according to the expected utility of theasset for BOURBON based on the use planned by the group.
The main useful lives of the “vessel” component used atBOURBON are the following:• for the Offshore Division: between 8 and 20 years,• for the Towage & Salvage Division: between 20 and 30 years,• for the Bulk Division: 20 years.
The useful life of the “overhaul” component of a vesseldepends on the multi-year maintenance schedule for thevessel.
Moreover, if there are indications of impairment, an impairmenttest is then performed on the group of assets (Cash GeneratingUnit) by comparing its net book value with the recoverablevalue of the corresponding CGU; the recoverable value isdefined as the higher of the useful value and the fair value (netof selling costs). At BOURBON, the CGUs are based on theoperational segmentation used by management to determinethe group’s strategy.

BOURBON 2006 Financial report I 43
Other property, plant and equipment (excluding vessels)
Property, plant and equipment, other than the vessels andinvestment property, are carried at cost as defined by IAS 16 §16. These assets consist of a single component.
The depreciable amount of the other tangible assets is equal totheir purchase price; their residual value being zero, with theexception of certain buildings for which there is a residualvalue.
Other assets are depreciated using the straight-line methodover their useful life.
The main useful lives for property, plant and equipment,excluding vessels, are as follows:• construction and buildings: between 8 and 40 years,• technical facilities: between 10 and 15 years,• other property, plant and equipment: between 2 and 10years.
Investment properties
The investment properties held by the group are recognized inthe consolidated accounts at historical cost and depreciatedusing the straight-line method over 40 years.
1.5.7 Investments in associates
The group’s equity interests in its associates are recognizedusing the equity method.
An associate company is an entity over which the group hassignificant influence. Investments in associates are recognizedas assets on the balance sheet for the part of stockholders’equity they represent. The goodwill on an associated companyis included in the book value of the equity interest.
1.5.8 Investments and other financial assets
Financial assets included in the scope of application of IAS 39are classified as “financial assets at fair value through profit orloss”, as “loans and receivables”, as “held-to-maturityinvestments”, or as “available-for-sale financial assets”. Wheninitially recognized, financial assets are measured at fair valueplus transaction costs, in the case of investments which are notrecognized at fair value through profit or loss. Initially, the groupanalyzes the possible existence of embedded derivatives in thecontracts. Embedded derivatives are separated from the hostcontract if the contract is not recognized in its entirety at fairvalue through profit or loss, and if analysis shows that theeconomic features and the risks of the embedded derivativesare not closely related to those of the host contract.
The group determines the classification of its financial assets atthe time of initial recognition and reviews this classification ateach yearly closing when this is authorized and appropriate.
All “normalized” purchases and sales of financial assets arerecognized on the transaction date, i.e. the date on which thegroup agrees to purchase the asset. “Normalized” purchases orsales are purchases or sales of financial assets under a contract,the terms of which require the delivery of the asset within theperiod generally defined by the regulations or by a conventionon the market in question.
Financial assets at fair value through profit or loss
The category of “financial assets at fair value through profit orloss” includes, financial assets held for trading purposes andfinancial assets designed at the initial accounting as financialassets at fair value through profit or loss.
As of December 31, 2006 and December 31, 2005, nofinancial assets were recognized at fair value through profit orloss.
Loans and receivables
Loans and receivables are non-derivative financial assets, withfixed and determinable payments, which are not listed on anactive market. After initial recognition, loans and receivables aremeasured at amortized cost using the effective interest ratemethod, less, if applicable, an impairment loss. The amortizedcost is calculated by taking into account any initial additional costor discount, and includes commissions which are an integralpart of the effective interest rate, as well as transaction costs.
Gains and losses are recognized as income/loss when theloans and receivables are derecognized or depreciated andthrough the mechanism of amortized cost.
Held-to-maturity investments
Held-to-maturity investments are non-derivative financialassets, with fixed and determinable payments and a fixedmaturity, which the group has the positive intent and the abilityto hold to maturity. After initial recognition, held-to-maturityinvestments are measured at amortized cost. As of December31, 2006 and December 31, 2005, the group had no financialassets accounted for in the category of held-to-maturityinvestments.
Available-for-sale financial assets
Available-for-sale financial assets are non-derivative financialassets which are designated as being available for sale andwhich are not classified in any of the following three categories:
Consolidated financial statements

44 l BOURBON 2006 Financial report
Consolidated financial statements
“financial assets at fair value through profit or loss”, “held-to-maturity investments”, or “loans and receivables”.
After initial recognition, available-for-sale financial assets aremeasured at fair value, and the gains and losses on such assetsare booked directly as stockholders’ equity in a separate line(“Unrealized net gains”) until the investment is derecognized oruntil the investment is identified as being subject toimpairment, in which case the cumulative gain or losspreviously booked as stockholders’ equity is then included inprofit or loss.
The fair value of the investments that are actively traded onorganized financial markets is determined by reference to themarket prices published on the closing date. For investmentsfor which there is no active market, fair value is determinedusing valuation techniques. Such valuation techniques include:using recent arm’s length market transactions betweenknowledgeable, and willing parties, reference to the current fairvalue of another instrument that is substantially the same,discounted cash flow analysis and option pricing models. Ifapplicable, fair value is assessed on the basis of the proportionof stockholders’ equity held. The assessment may also take intoconsideration the following parameters, to the extent that theycan be reliably measured:• potential unrealized gains, particularly property gains,• prospects for profitability.
Impairment of financial assets
On each closing date, the group assesses whether a financialasset or a group of financial assets is impaired.
Assets carried at amortized cost
If there is objective evidence that an impairment loss on loansand receivables carried at amortized cost has been incurred,the amount of loss is measured as the difference between theasset’s carrying amount and the present value of estimatedfuture cash flows (excluding future credit losses that have notbeen incurred), discounted at the financial asset’s originaleffective interest rate (i.e. the effective interest rate computedat initial recognition). The carrying amount of the asset shall bereduced through the use of an allowance account. The amountof loss shall be recognized in profit or loss.
The group first assesses whether objective evidence ofimpairment individually exists for individually significantfinancial assets, as well as, individually or collectively bases, forfinancial assets which are not individually significant. If itdetermines that there are no objective evidence ofdepreciation for a financial asset considered individually, in asignificant or non-significant amount, this asset is included in agroup of financial assets presenting similar credit riskcharacteristics, and this group of financial assets is subject to a
collective impairment test. Assets subject to an individualimpairment test, for which impairment is recognized orcontinues to be recognized, are not included in a collectiveimpairment test.
If the amount of the impairment decreases during asubsequent year, and if this decrease can be objectively tied toan event that occurred after recognition of the impairment, theimpairment previously recognized is reversed. A reversal ofimpairment is booked as income/loss provided the book valueof the asset does not become greater than the amortized coston the date the impairment is reversed.
For trade receivables, impairment is recognized when there isan objective indication (such as a probability of bankruptcy orsignificant financial difficulties for the debtor) that the group willbe unable to recover the amounts owed under the contractualterms of the invoice. The book value of the trade receivable isreduced using a valuation allowance account. Impairedoutstanding amounts are recognized as a loss when they aredeemed unrecoverable.
Available-for-sale financial assets
If an asset available for sale is impaired, an amount calculatedas the difference between its acquisition cost (net of anyrepayment of principal and any depreciation) and its currentfair value, less any impairment previously booked asincome/loss, is transferred from stockholders’ equity toincome. Impairment on equity instruments may not result in areversal booked as income. Impairment on debt instruments isreversed as income if the increase in the fair value of theinstrument may be objectively related to an event that occurredafter recognizing the impairment in the income statement.
1.5.9 Inventories and work in progress
Inventories are measured at the weighted-average cost methodfor raw materials and at the production cost for work inprogress and finished goods.
When the production cost of finished goods is greater than theselling price at the inventory date, impairment is recognized inorder to reduce the value of the inventories to their netrealizable value.
1.5.10 Cash and cash equivalents
Cash and cash equivalents consist of cash on hand and inbanks, short-term deposits and marketable securities. Cash andcash equivalents are recorded at fair value.

BOURBON 2006 Financial report I 45
1.5.11 Non-current assets held for sale and discontinued operations
Non-current assets held for sale
Pursuant to the provisions of IFRS 5, non-current assets (ordisposal groups) and the related liabilities are classified as“held for sale” if their carrying amount will be recoveredprimarily through a sale transaction rather than continuing use.This classification implies that the assets (or disposal groups)intended for sale are available for immediate sale, in theirpresent condition, and that the sale is highly probable.
The high probability of the sale is assessed on the basis of thefollowing criteria: management has initiated an asset (ordisposal groups) disposal plan and a program to find a buyerand finalize the plan has been launched. In addition, the assetsmust be actively marketed for sale at a reasonable price inrelation to their fair value. The sale of the assets (or disposalgroups) is assumed to take place within one year from the dateof being classified as assets held for sale.
Non-current assets (or disposal groups) intended to be soldand classified as held for sale are measured at the lower oftheir previous carrying amount and fair value less costs to sell.They are no longer depreciated as of the date they areclassified as assets held for sale.
Discontinued operations
A discontinued operation is an activity or a significantgeographic region for the group which is either being sold orclassified as an asset held for sale. The items of the incomestatement and the cash flow statement for these discontinuedoperations or operations being sold are presented on specificlines of the financial statements for all periods presented. As aresult, certain elements of the income statement and the cashflow statement for the previous year are restated in order topresent comparative information for these discontinuedoperations.
1.5.12 Treasury shares
When the group purchases its own equity instruments(treasury shares), they are deducted from stockholders’ equity.No profit or loss is booked in the income statement at the timeof the purchase, sale, issue or cancellation of the group’s equityinstruments.
1.5.13 Provisions
Provisions are recognized when the group has a presentobligation resulting from a past event, when it is probable thatan outflow of resources embodying economic benefits will benecessary to settle the obligation, and when the amount of theobligation can be reliably estimated.
If the effect of the time value of the money is significant, theprovisions are discounted on the basis of a pre-tax rate whichreflects the risks specific to the liability, if any. When theprovision is discounted, the increase in the provision related tothe passage of time is recognized as a borrowing cost.
1.5.14 Employee benefits
Employee benefits include retirement indemnities, seniorityawards, incentives and profit-sharing.
Retirement benefits
Group employees receive retirement indemnity in addition tothe legal retirement benefits in effect in the countries in whichthey are employed.
Pursuant to IAS 19 “Employee benefits”, retirement benefitobligations are measured using the projected unit creditmethod. Under this method, the valuation of the commitmenttakes into consideration the pension rights that the employeewill have acquired on the date of his retirement. However, thecommitment is allocated proportionately between theemployee’s seniority on the calculation date, taking intoaccount the ratio between the employee’s current seniority andhis seniority projected at retirement date.
These calculations include the following assumptions:• Retirement age: legal age prevailing in each country,• Average life expectancy: based on the mortality table
applicable to each country,• Discount rate,• Inflation rate,• Turn-over: established for each company, using the average
turn-over observed over the last five years,• Assumptions on salary increases,• Calculation of the rights based on collective agreements or
specific agreements in force in each entity/country.
In accordance with the option offered by the amendment toIAS 19 “Actuarial gains and losses, group plans anddisclosures,” the group has elected to account for its actuarialdifferences directly in stockholders’ equity.
Consolidated financial statements

46 l BOURBON 2006 Financial report
Consolidated financial statements
Incentives
Incentives are based on the company’s performance,measured primarily by the increase in revenues and operatingmargins.
There are two application methods: the first consists ofapplying the coefficient of increase for each individual to thesalary he received during the last six months, with the bonuspaid every six months.
The second method, calculated annually, incorporates aprogressive bonus by salary category. The amount of the bonusis, therefore, calculated by applying the correspondingpercentage to the annual payroll. One part is then distributeduniformly among the employees and the other one is distributedin proportion to the gross salaries for the reference year.
Where the bonus is deposited to the Company Savings Plan(Plan d’Epargne Entreprise-PEE), an employer’s contribution of20% is granted.
Profit-sharing
The legal profit-sharing, which is blocked for five years, isfunded to an independent organization.
Stock option plans
The cost of equity-setlled share-based payment transactions withemployees, granted after November 7, 2002, is measured at thefair value of the equity instruments granted at the grant date.
This cost is recognized as personnel expenses as a contra entryto an equivalent increase in stockholders’ equity, using thestraight-line method over the vesting period. This period endson the date on which the employees obtain an unconditionalright to the instruments (“the rights acquisition date”).
The cumulative expense recorded for these transactions at theend of each year until the rights acquisition date takes intoaccount the group’s best estimate, on that date, of the numberof equity instruments that will be acquired.
When these options are exercised by the beneficiaries,BOURBON will increase its capital and the shares issued at thattime will be remitted to the beneficiaries. The exercise pricereceived by the group will be booked as cash as a contra entryto the corresponding capital increase.
1.5.15 Financial liabilities
Financial liabilities include borrowings and financial debts, tradepayables, derivative instruments and other current and non-current liabilities.
All borrowings are initially recorded at fair value less directlychargeable transaction costs.
After the initial accounting, interest-bearing loans are measuredat amortized cost, using the effective interest rate method.
Profits and losses are recorded on the income statement whenthe debts are derecognized, and through the amortized costmechanism.
Derivative instruments are carried at their fair value at theclosing date. The accounting methods for derivativeinstruments are described in note 1.5.19.
1.5.16 Finance leases
Assets held under finance leases are recognized as assets ofthe group when the terms of lease transfer substantially thegroup most of the risks related to ownership of the asset. Theseassests are measured at the fair value or, if lower, at the presentvalue of the minimum lease payments. The asset isdepreciated using the group’s depreciation methods as definedin note 1.5.6.
1.5.17 Revenue recognition
Revenue arising in the course of the ordinary activities isrecognized when it is probable that the future economicbenefits will flow to the group and when the amount ofrevenue can be measured reliably. Revenue is measured at thefair value of the consideration received, excluding discounts,rebates, other taxes on sales and customs duties.
Revenues include chartering revenues and related services,towage and assistance services and the revenues from thesugar business, less the discounts granted.
The following specific recognition criteria must also be met forrevenue to be recognized:
Sale of goods
Revenue is recognized when the significant risks and rewardsof ownership of the goods have been passed to the buyer,normally upon delivery of the goods.
Bulk
Revenue arising from the Bulk shipping business is recognizedby reference to the stage of completion of the voyage at theclosing date.

BOURBON 2006 Financial report I 47
1.5.18 Current income tax and deferred tax
The income tax expense for the year includes:• the current income tax expense less tax credits and tax lossesactually used;
• deferred tax, booked in the consolidated financial statementsbased on the tax situation of each company.Deferred taxes result from:
– temporary differences between taxable profit andaccounting profit;
– consolidation restatements and eliminations;– and tax deficits that can be carried forward, which are
likely to be recovered in future.
These taxes are calculated and adjusted using the balancesheet liability method in its broadest sense. Deferred tax assetsand liabilities are not discounted.
Deferred tax and current income tax relating to items bookeddirectly as stockholders’ equity are recognized as stockholders’equity and not in the income statement.
1.5.19 Derivative instruments and hedge accounting
The group uses derivative instruments such as forward exchangecontracts, interest rate swaps, cross currency swaps and exchangeoptions to manage its exposure to movements in interest ratesand foreign exchange rates. These derivative instruments areinitially recognized at fair value on the date on which the contractstake effect and are subsequently measured at fair value.Derivative instruments are booked as assets when the fair valueis positive and as liabilities when the fair value is negative.
All gains and losses from changes in the fair value of thederivative instruments which are not classified as hedginginstruments are recognized directly in the income statement forthe year.
The fair value of buying forward exchange contracts iscalculated by reference to the current forward exchange ratesfor contracts with similar maturities. The fair value of interestrate swaps is generally determined using rate curves based onthe market interest rates observed on the closing date.
For the purposes of hedge accounting, hedges are classified as:• fair value hedges when they hedge the exposure to changes
in the fair value of a recognized asset or liability, or a firmcommitment (except for the exchange risk);
• cash flow hedges when they hedge the exposure to variabilityin cash flows that is attributable either to a specific riskassociated with a recognized asset or liability, or to a highlyprobable forecasted transaction or to the exchange risk on afirm commitment;
• hedges of a net investment in a foreign operation.
The hedge on the foreign currency risk of a firm commitmentis recognized as a cash flow hedge.
Inception of a hedge relationship, the group formallydesignates and documents the hedge relationship to which thegroup wants to apply the hedge accounting and the objectivedesired for risk management hedge strategy. Thedocumentation includes the identification of the hedginginstrument, the item or transaction hedged, the nature of therisk being hedged and how the group will assess theeffectiveness of the hedging instrument in offsetting theexposure to the changes in fair value of the item hedged orcash flows attributable to the hedged risk. The group expectsthat the hedge will be highly effective in offsetting changes infair value or in cash flows. The hedge is assessed on anongoing basis in order to demonstrate that it has actually beenhighly effective during all the years covered by the financialstatements for which it has been designated.
The hedging instruments that meet the strict criteria for hedgeaccounting are recognized as follows:
Fair value hedges
Fair value hedges are hedges on the group’s exposure tochanges in the fair value of a recognized asset or liability or anunrecognized firm commitment, or an identified portion of suchfinancial assets or liabilities, which is attributable to a specific riskand which can affect the result for fair value hedges.
The gain or loss on the hedged item attributable to the hedgedrisk adjusts the carrying amount of the item hedged, thehedging instrument is remeasured at fair value, and theresulting gains and losses are recognized for the two items onthe income statement.
When an unrecognized firm commitment is designated as ahedged item, the subsequent cumulative change in the fairvalue of the firm commitment attributable to the hedged risk isaccounted for as an asset or a liability, and the correspondingprofit or loss is recognized on the income statement. Thechanges in the fair value of the hedging instrument are alsoaccounted for as income/loss. The group ceases to use hedgeaccounting if the hedge instrument reaches maturity or is sold,terminated or exercised, if the hedge no longer meets thecriteria for hedge accounting, or when the group revokes thedesignation.
Consolidated financial statements

48 l BOURBON 2006 Financial report
Consolidated financial statements
Cash flow hedge
A cash flow hedge is a hedge on the exposure to changes in cash flow attributable to a specific risk associated with a recognizedasset or liability or a highly probably planned transaction, which can affect the results. The profit or loss corresponding to theeffective part of the hedging instrument is recognized directly as stockholders’ equity whereas the ineffective part is recognizedas income/loss.
The amounts recognized directly as stockholders’ equity are reclassified into profit or loss for the period in which the hedged itemaffects the result.
If the hedging instrument reached maturity, is sold, terminated or exercised without being replaced or renewed, or if its designationas a hedging instrument is revoked, the amounts previously recognized as stockholders’ equity are maintained as such until theexecution of the planned transaction. If the transaction is no longer planned, this amount is recognized as income/loss.
1.6 Translation of the financial statements of the foreign subsidiaries
The exchange rates used for the year ended December 31, 2006 are as follows:
Average rate for the Closing rate at Closing rate at Currencies year 2006 12/31/2006 12/31/2005
AON Angolan Kwanza 109.301 105.720 95.577
BRL Brazilian Real 2.736 2.816 2.761
CFA CFA Franc CFA 655.957 655.957 655.957
CFP CFP Franc CFP 119.265 119.265 119.265
CHF Swiss Franc 1.573 1.607 1.555
EGP Egyptian pound 7.461 7.521
MGA Madagascar Ariary 2,775.887 2,683.84 2,591.320
MGF Madagascar Franc 11,406.449 12,081.100
MUR Mauritian Rupee 40.121 43.787 36.183
MXP Mexican Peso 14.0329 14.323
NGN Nigerian Naira 166.401 169.222 153.231
NOK Norwegian Kroner 8.047 8.238 7.985
QAR Qatari Rial 4.685 4.795
SCR Seychelles Rupee 6.900 7.598 6.149
SGD Singapore Dollar 1.994 2.020
USD US Dollar 1.256 1.317 1.180
VND Vietnamese Dong 20,653.287 21,126.400 18,834.400
BOURBON 2006 Financial report I 49
Consolidated financial statements
2 SIGNIFICANT INFORMATION CONCERNING THE YEAR ENDED DECEMBER 31, 2006
2.1 Changes in consolidation scope
The main companies consolidated for the first time in 2006 are:
Les Abeilles Tanger Med (Set-up – fully consolidated)Delba Operadora de Servicios Ltda (Set-up – proportionately consolidated)Bourbon Offshore Triangle (Set-up – fully consolidated)Bourbon Gulf (Set-up – proportionately consolidated)Naviera Bourbon Tamaulipas (Acquisition – proportionately consolidated)Servicios y Apoyos (Set-up – proportionately consolidated)Bourbon Offshore Asia (Set-up – fully consolidated)Bourbon Logistics Indonesia (Set-up – fully consolidated)Bourbon Capital Elec USA (Set-up – fully consolidated)EPD Asia Group Ltd (Set-up – proportionately consolidated)EPD Yangzhou Ltd (Set-up – proportionately consolidated)
In addition, the Eidsurf company, 51%, then 50% held by BOURBON, was split into two companies: Surf Viking AS, now whollyowned by the group, and Viking Surf AS, which is not consolidated as the shares of this company are not owned by the group.The impact of this operation on the group’s accounts is not significant.
The shares of Brasseries de Bourbon held by the group at December 31, 2005 were sold in 2006. Other changes in consolidationscope primarily concern Diamant Express (liquidation), Mahe Cruise Ltd (liquidation) and Opale Shipping (which was merged intothe company Bourbon Maritime).
The list of the consolidated companies is provided in note 5.7.
2.2 Discontinued operations
Vindémia (Retail business)
The group continues the process of withdrawing from the Retail business, after the sale of 36.66% of the Vindémia company toGroupe Casino in 2005 (“first put”).
Under the agreements entered into with Groupe Casino, the sale (“second put”) of the remaining interest, i.e. 30%, may be heldbetween 2007 and 2009. As of December 31, 2006, it is highly probable that BOURBON will exercise the “second put” beforethe end of the first half of 2007, thus ending its operations in the Retail sector.
As a result, at December 31, 2006, the equity interests in the Retail associates, which have been consolidated using the equitymethod since October 1, 2005, were accounted for in accordance with IFRS 5 in the consolidated financial statements.
The Vindémia sub-group assets held for sale amounted to €99.4 m at December 31, 2006. The group share of net income forthe year corresponds to a profit of €11 m.
In this context, the group also initiated in 2006 the sale of its Vietnamese subsidiary Espace Bourbon Thang Long (a shoppingmall in Hanoi), which was finalized in February 2007. At December 31, 2006, this company was recognized in accordance withIFRS 5.

50 l BOURBON 2006 Financial report
Consolidated financial statements
Hotel assets
In addition, in connection with the shift in focus to purely marine operations, the group decided to sell all its hotel properties onReunion Island. Exclusive talks are now underway, and the sale is expected to take place no later than the first half of 2007. Thesaid companies are the following:
• Recif SAS• Villas du Lagon• Motel Les Brisants• SEHB
As a result, these entities are classified in the consolidated financial statements at December 31, 2006 as being held for sale.
Effect of the discontinued operations on the financial statements
The results for all the activities held for sale are shown below for the year ended and for 2005:
(in € thousands) 2006 2005
Revenues 29,133 407,560
Cost of sales and general costs (27,832) (374,583)
Amortization/depreciation/provisions (3,645) (10,601)
Cost of net debt (304) (2,935)
Other financial income and expenses (453) 1,140
Share in income/(loss) of associates 10,963 5,073
Income from discontinued operations before taxes 7,862 25,654
Tax (Expenses)/Income 14 (8,583)
Net income from discontinued operations 7,876 17,071
In 2004, the key financial data for these operations was as follows:• Revenues: €557.0 m• Operating income: €37.2 m• Net income: €18.8 m

BOURBON 2006 Financial report I 51
Consolidated financial statements
Investments in associates of the Retail business and well as the principal groups of assets and liabilities of the companies EBT, Recif,Villas du Lagon, Motel Les Brisants and SEHB, classified as held for sale at December 31, 2006, are as follows:
(in € thousands) 12.31.2006
Assets
Intangible assets 3,461
Property, plant and equipment 9,022
Investments in associates 99,401
Other debtors 20,303
Cash and cash equivalents 2,258
Non-current assets classified as held for sale 134,445
Liabilities
Other creditors 7,911
Liabilities bearing interest 17,088
Liabilities directly associated with non-current assets classified as held for sale 24,999
Net assets directly associated with activities held for sale 109,446
The change in cash for these companies is as follows:
(in € thousands) 12.31.2006
Cash at beginning of year 1,063
Cash at year end 1,317
Change in cash 254
Cash flows for the entities held for sale are presented in the consolidation cash flow statement.
2.3 Sale of fiscal EIGs (French tax leases)
During the year, the group sold all the shares it held in eight fiscal EIGs (economic interest grouping) to a financial institution.Those EIGs had been created in 2006 and, at December 31, 2006, each of them owned one vessel. This agreement wasapproved by the Ministry of the Economy and Finance, which allows the financial institution to benefit from the tax advantagearising from the EIGs that own and lease vessels. This tax advantage granted by the government is, however, conditional onmaintaining the vessels under the French flag for a period of eight years.
The main provisions of these agreements are as follows:
The vessels are hired to the group for a period of five years and six months, with an irrevocable commitment to purchase at theend of the lease period. This commitment is only for the vessels and not for the shares of the EIGs, for which no buyback by thegroup is planned.
The agreements contain no restriction limiting the use of the vessels by the group.
The group realized a gain of €3,993 k on the sale of the shares in the EIGs.
The financial institution, via the EIGs, is transferring back to the group a portion of the tax advantage from which it will benefitduring the vessel lease period in the form of a reduction on the leasing fees for the vessels.

52 l BOURBON 2006 Financial report
Consolidated financial statements
As the group no longer has control over the sold EIGs, these transactions were recognized in the consolidated financial statementsin accordance with interpretation SIC 27. As a result:
As the group benefits from all the risks and rewards of the ownership of the vessels under the leasing agreements signed, thevessels were carried as assets at December 31, 2006. They are depreciated over their useful life, which is 20 years.
A debt was recognized as a liability on the balance sheet equal to the present value of the minimum lease payments, whichincludes the payments to be made to exercise the irrevocable commitments to purchase at the end of the leasing period. It is infact certain that the group will exercise these commitments, since the French flag requirement is for a period of eight years. Onthe contract start date, the present value of the minimum lease payments is lower than the fair value of the vessels.
The difference between the present value of the minimum lease payments and the fair value of the vessels represents the taxadvantage transferred back to the group by the financial institution. For all eight vessels, it totals €17,965 k and was recognizedas a liability on the balance sheet. It will be booked as income using the straight-line method over eight years, which is theminimum period required for maintaining the French flag in order to obtain government approval of these agreements. Theamount booked as operating income for 2006 was €1,124 k.
The gain realized on the sale of the shares of the EIGs (€3,993 k) is also deferred using the straight-line method over eight years.
The tables below summarize the effects of these transactions on the group’s financial statements at December 31, 2006.
Effect on the consolidated income statement:
(in € thousands) 2006
Restatement of vessels under finance lease (1,272)
Leasing advantage for the year 1,124
Gain on the sale for the year 374
Net impact at December 31, 2006 226
Effect on the consolidated balance sheet:
(in € thousands) 12.31.2006
Net value of the vessels held under finance leases 99,433
Borrowings – remaining principal amount 82,740
Balance of the leasing advantage spread over eight years 16,840
Balance of the gain on sale spread over eight years 3,619

BOURBON 2006 Financial report I 53
Consolidated financial statements
2.4 Interests in joint ventures and purchase of minority interests
2.4.1 Naviera Bourbon Tamaulipas
On April 1, 2006, the group acquired 49% of the stock capital of Naviera Bourbon Tamaulipas. As of December 31, 2006, thiscompany is proportionately consolidated.The goodwill generated through this acquisition was €4,597 k, calculated as follows:
Naviera(in € thousands) Bourbon Tamaulipas
Acquisition cost of the shares 19,576
Statutory net equity of the company 32,070
Restated net equity of the company 30,569(*)
Fair value of net assets acquired 14,979
Goodwill 4,597
(*) Restatement of the vessels held by the company in accordance with the group’s accounting policies.
2.4.2 Minority interests in Bourbon Offshore II AS and Bourbon Offshore II KS
On July 1, 2006, the group acquired 24.5% of Bourbon Offshore II AS and 22.05% of Bourbon Offshore II KS, raising its stakein these companies to 100%.
The goodwill generated through the purchase of minority interests was measured as follows:
Bourbon(in € thousands) Offshore II AS
Acquisition cost of the shares 1,073
Share of net assets acquired 386
Goodwill 687
Bourbon(in € thousands) Offshore II KS
Acquisition cost of the shares 9,640
Fair value of net assets acquired 3,066
Goodwill 6,574
2.4.3 Information on companies proportionately consolidated
The list of the proportionately consolidated entities is provided in note 5.7.2.The main aggregates for these companies are presented in the table below:
(in € thousands) 12.31.2006 31.12.2005
Non-current assets 50,307 42,508
Current assets 11,437 4,336
TOTAL 61,744 46,844
Non-current liabilities 41,696 35,279
Current liabilities 15,417 7,603
TOTAL 57,113 42,882

54 l BOURBON 2006 Financial report
Consolidated financial statements
3 NOTES TO THE CONSOLIDATED FINANCIAL STATEMENTS
3.1 Goodwill
At December 31, 2006, the net balance of the goodwill totaled €14,185 k, broken down as follows:
Gross Net (in € thousands) value Impairment value
01.01.2005 48,520 – 48,520
Goodwill on acquisitions – – –
Disposals – – –
Impairment – – –
Currency translation adjustment – – –
Change in consolidation scope (46,193) – (46,193)
Reclassification and other changes – – –
12.31.2005 2,327 – 2,327
Goodwill on acquisitions 4,597 – 4,597
Disposals – – –
Impairment – – –
Currency translation adjustment – – –
Change in consolidation scope 7,261 – 7,261
Reclassification and other changes – – –
12.31.2006 14,185 – 14,185
The accounting method is detailed in note 1.5.2.
Goodwill has been allocated to the following CGUs:• Towage & Salvage for €1,648 k• Offshore for €12,537 k
Based on the profitability of these activities, no impairment was recognized as of December 31, 2006.
2006 increases are explained in note 2.4.

BOURBON 2006 Financial report I 55
Consolidated financial statements
3.2 Intangible assets
Intangible assets can be analyzed as follows:
Gross Amortization Net(in € thousands) value and impairment value
01.01.2005 19,126 (6,530) 12,596
Acquisitions 241 (976) (735)
Disposals (156) 129 (27)
Change in consolidation scope (7,568) 3,256 (4,312)
Currency translation adjustment 949 (176) 773
Reclassification and other changes 269 – 269
12.31.2005 12,861 (4,297) 8,564
Acquisitions 2,812 (1,085) 1,727
Disposals (357) 94 (263)
Change in consolidation scope 12 (6) 6
Currency translation adjustment (329) 88 (241)
Reclassification and other changes (184) 250 66
Reclassification as held for sale (4,890) 892 (3,998)
12.31.2006 9,925 (4,064) 5,861
The change in the gross value of the intangible assets is as follows:
Other AdvancesR&D Concessions, Leasehold Business intangible and
(in € thousands) costs patents rights goodwill assets installments Total
01.01.2005 44 3,941 224 1,119 13,797 1 19,126
Acquisitions – 178 1 – 33 29 241
Disposals – (37) – (21) (97) (1) (156)
Change in consolidation scope – (1,721) (224) 115 (5,738) – (7,568)
Currency translation adjustment 1 38 – – 908 2 949
Reclassification and otherchanges – (1) – – 270 – 269
12.31.2005 45 2,398 1 1,213 9,173 31 12,861
Acquisitions – 867 1 – 1,230 714 2,812
Disposals – (20) – – (337) – (357)
Change in consolidation scope – 1 – – 11 – 12
Currency translation adjustment (1) (33) – – (292) (3) (329)
Reclassification and otherchanges (44) (167) – – 55 (28) (184)
Reclassification as held for sale – (90) – (168) (4,632) – (4,890)
12.31.2006 – 2,956 2 1,045 5,208 714 9,925
As of December 31, 2006, the business goodwills are carried at initial cost due to the group’s performance.

56 l BOURBON 2006 Financial report
Consolidated financial statements
Amortization and impairment on intangible assets is as follows:
Other AdvancesR&D Concessions, Leasehold Business intangible and
(in € thousands) costs patents rights goodwill assets installments Total
01.01.2005 (44) (3,346) – (751) (2,389) – (6,530)
Acquisitions – (253) – – (723) – (976)
Disposals – 37 – 2 90 – 129
Change in consolidation scope – 1,590 – 228 1,438 – 3,256
Currency translation adjustment (1) (39) – – (136) – (176)
Reclassification and otherchanges – – – – – – –
12.31.2005 (45) (2,011) – (521) (1,720) – (4,297)
Acquisitions – (398) – – (687) – (1,085)
Disposals – 20 – – 74 – 94
Change in consolidation scope – (1) – – (5) – (6)
Currency translation adjustment 1 33 – – 54 – 88
Reclassification and otherchanges 44 236 – – (30) – 250
Reclassification as held for sale – 32 – 91 769 – 892
12.31.2006 – (2,089) – (430) (1,545) – (4,064)
3.3 Property, plant and equipment
Property, plant and equipment totaled €1,641,698 k as of December 31, 2006, including €1,680 k for investment propertiesdetailed in note 3.4, and €1,640,018 k in other tangible assets, broken down as follows:
Gross Net(in € thousands) value Depreciation value
01.01.2005 1,540,369 (288,481) 1,251,888
Acquisitions 358,713 (89,490) 269,223
Disposals (14,489) 6,377 (8,112)
Impairment – (2,476) (2,476)
Change in consolidation scope (268,861) 102,353 (166,508)
Currency translation adjustment 32,407 (5,068) 27,339
Reclassification and other changes 1,066 (1,030) 36
12.31.2005 1,649,205 (277,815) 1,371,390
Acquisitions 455,696 (92,446) 363,250
Disposals (71,581) 27,424 (44,157)
Impairment – – –
Change in consolidation scope (4,014) (816) (4,830)
Currency translation adjustment (45,117) 9,256 (35,861)
Reclassification and other changes (16) (652) (668)
Reclassification as held for sale (12,507) 3,401 (9,106)
12.31.2006 1,971,666 (331,648) 1,640,018
Over fiscal year 2006, interim borrowing costs capitalized in the cost of the vessels amounted to €8,163 k.

BOURBON 2006 Financial report I 57
Consolidated financial statements
Details of gross property, plant and equipment:
PropertyVessels Other plant and Advances
Technical and tangible equipment and(in € thousands) Land Buildings facilities overhauls assets in progress installments Total
01.01.2005 58,034 154,375 194,695 975,112 59,376 95,627 3,150 1,540,369
Acquisitions – 453 930 187,708 800 157,267 11,555 358,713
Disposals (610) (4,225) (280) (8,829) (221) (324) – (14,489)
Impairment – – – – – – – –
Change inconsolidation scope (50,699) (111,999) (50,021) (2,681) (49,298) (4,066) (97) (268,861)
Currency translationadjustment 334 3,547 8,259 21,223 481 (1,762) 325 32,407
Reclassification andother changes – 708 (78,751) 173,598 (809) (90,319) (3,361) 1,066
12.31.2005 7,059 42,859 74,832 1,346,131 10,329 156,423 11,572 1,649,205
Acquisitions 1,959 3,505 1,476 134,073 1,421 306,887 6,375 455,696
Disposals – (106) (275) (64,978) (449) (5,773) – (71,581)
Impairment – – – – – – – –
Change inconsolidation scope – – 218 (4,192) (40) – – (4,014)
Currency translationadjustment (937) (2,551) (6,752) (33,729) (365) (558) (225) (45,117)
Reclassification andother changes – 14 (15,825) 191,935 159 (164,346) (11,953) (16)
Reclassificationas held for sale (161) (10,365) (21) – (1,936) (24) – (12,507)
12.31.2006 7,920 33,356 53,653 1,569,240 9,119 292,609 5,769 1,971,666

58 l BOURBON 2006 Financial report
Consolidated financial statements
Details of depreciation and impairment on property, plant and equipment:
PropertyVessels Other plant and Advances
Technical and tangible equipment and(in € thousands) Land Buildings facilities overhauls assets in progress installments Total
01.01.2005 (458) (32,992) (49,061) (163,254) (42,043) (673) – (288,481)
Acquisitions – (3,758) (13,320) (60,557) (11,855) – – (89,490)
Disposals – 349 280 5,322 424 2 – 6,377
Impairment – – – (2,476) – – – (2,476)
Change inconsolidation scope 448 22,346 34,404 (1,175) 45,875 455 – 102,353
Currency translationadjustment – (814) (1,507) (2,380) (336) (31) – (5,068)
Reclassificationand other changes – 423 10,122 (11,979) 404 – – (1,030)
12.31.2005 (10) (14,446) (19,082) (236,499) (7,531) (247) – (277,815)
Acquisitions – (1,475) (17,003) (72,978) (990) – – (92,446)
Disposals – 2,592 211 24,175 425 21 – 27,424
Impairment – – – – – – – –
Change in consolidation scope – – (517) (341) 42 – – (816)
Currency translation adjustment – 766 2,337 5,862 265 26 – 9,256
Reclassification
and other changes – 24 3,021 (3,590) (107) – – (652)Reclassificationas held for sale 10 1,907 99 – 1,385 – – 3,401
12.31.2006 – (10,632) (30,934) (283,371) (6,511) (200) – (331,648)

BOURBON 2006 Financial report I 59
Consolidated financial statements
Property, plant and equipment presented above include assets held under finance leases, which break down as follows:
Details of gross property, plant and equipment under finance leases:
Vessels OtherTechnical and tangible
(in € thousands) Land Buildings facilities overhauls assets Total
01.01.2005 5,798 32,757 10,322 53,623 1,075 103,575
Acquisitions – – – – – –
Disposals – – – – – –
Impairment – – – – – –
Change in consolidation scope (5,798) (30,191) (5,469) (2,681) (237) (44,376)
Currency translation adjustment – – – – – –
Reclassification and other changes – – (4,592) (45,791) – (50,383)
12.31.2005 – 2,566 261 5,151 838 8,816
Acquisitions – – – 102,178 1 102,179
Disposals – – – – – –
Impairment – – – – – –
Change in consolidation scope – – – – – –
Currency translation adjustment – – – – – –
Reclassification and other changes – – (261) (4,145) – (4,406)
Reclassification as held for sale – (2,566) – – – (2,566)
12.31.2006 – – – 103,184 839 104,023
Details of depreciation and impairment on property, plant and equipment under finance leases:
Vessels OtherTechnical and tangible
(in € thousands) Land Buildings facilities overhauls assets Total
01.01.2005 – (9,564) (1,030) (7,461) (1,075) (19,130)
Acquisitions – – – (415) – (415)
Disposals – – – – – –
Impairment – – – – – –
Change in consolidation scope – 8,871 769 1,960 237 11,837
Currency translation adjustment – – – – – –
Reclassification and other changes – – – 5,543 – 5,543
12.31.2005 – (693) (261) (373) (838) (2,165)
Acquisitions – – – (3,090) – (3,090)
Disposals – – – – – –
Impairment – – – – – –
Change in consolidation scope – – (780) – – (780)
Currency translation adjustment – – – – – –
Reclassification and other changes – – – 1,407 (1) 1,406
Reclassification as held for sale – (256) – – – (256)
12.31.2006 – (949) (1,041) (2,056) (839) (4,885)

60 l BOURBON 2006 Financial report
Consolidated financial statements
3.4 Investment properties
Breakdown of investment properties:
Gross Depreciation Net(in € thousands) value and impairment value
01.01.2005 22,387 (6,085) 16,302
Acquisitions – – –
Disposals – – –
Impairment – – –
Currency translation adjustment – – –
Change in consolidation scope (20,707) 6,085 (14,622)
Reclassification and other changes – – –
12.31.2005 1,680 – 1,680
Acquisitions – – –
Disposals – – –
Impairment – – –
Currency translation adjustment – – –
Change in consolidation scope – – –
Reclassification and other changes – – –
12.31.2006 1,680 – 1,680
At December 31, 2005, the fair value of the investment properties was €1,931 k, representing the value determinedaccording to expert testimony.The group believes that this valuation also reflects the fair value of the properties at December 31, 2006.
The net value of these properties at December 31, 2005 was €1,680 k corresponding to the residual value. As a result, nodepreciation was booked over fiscal year 2006.

BOURBON 2006 Financial report I 61
Consolidated financial statements
3.5 Investments in associates
As of December 31, 2006, investments in associates totaled €10,904 k. The change in the equity value was as follows:
Investments (in € thousands) in associates
01.01.2005 –
Change in consolidation scope
– Retail business 85,432
– Rigdon Marine 7,643
Share in net income/(loss) 5,115
Currency translation adjustment 810
12.31.2005 99,000
Reclassification as held for sale (*) (91,315)
Share in net income/(loss) 4,042
Currency translation adjustment (823)
12.31.2006 10,904
(*) Over fiscal year 2006, it corresponds to the classification of the equity investments in the Retail business as assets held for sale (see note 2.2)
As of December 31, 2006, the item “investments in associates” includes the amount of €1,158 k for the goodwill recognized at thetime of the purchase of the Rigdon Marine stock in 2005.
Over fiscal 2006, the share in net income (€4,042 k) corresponds to the share in income of Rigdon Marine.
After classification of the Retail business as “assets held for sale”, investments in associates at December 31, 2006 representedonly Rigdon Marine. The main financial items are presented below (calculated data indicated at 100%):
(in € thousands) 12.31.2006
Non-current assets 148,029
Current assets 26,971
Total assets 175,000
Non-current liabilities 163,714
Current liabilities 11,286
Total liabilities 175,000
Revenues 46,291
Net income 9,308

62 l BOURBON 2006 Financial report
Consolidated financial statements
3.6 Non-current financial assets
The non-current part of the financial assets is detailed below:
(in € thousands) 12.31.2006 12.31.2005
Available-for-sale assets 9,212 9,639
Receivables from non consolidated companies – 1
Loans and securities 70,697 58,409
Other non-current financial assets 812 954
Derivative instruments 17,078 2,095
Total 97,799 71,098
Loans and securities primarily reflect loans made to companies consolidated using the equity method.
The following tables show the change in the gross values and valuation allowance on the available-for-sale assets, receivablesfrom non consolidated companies, and loans and securities.
Change in gross values:Other
receivablesfrom non
Available-for-sale consolidated Loans,(in € thousands) assets companies securities Total
01.01.2005 17,540 2,593 97,687 117,820
Acquisitions 3,770 – 43,268 47,038
Disposals (1,779) (2,106) (87,475) (91,360)
Change in consolidation scope (4,006) – (203) (4,209)
Currency translation adjustment 340 183 4,686 5,209
Reclassification and other changes – (12) 1,186 1,174
12.31.2005 15,865 658 59,149 75,672
Acquisitions 56 – 31,250 31,306
Disposals (1,943) – (21,823) (23,766)
Change in consolidation scope (222) – 19,725 19,503
Currency translation adjustment (203) – (6,058) (6,261)
Reclassification and other changes (35) – (4,370) (4,405)
Reclassification as held for sale (31) (656) (7,024) (7,711)
12.31.2006 13,487 2 70,849 84,338

BOURBON 2006 Financial report I 63
Consolidated financial statements
Change in valuation allowance:Other
receivablesfrom non
Available-for-sale consolidated Loans,(in € thousands) assets companies securities Total
01.01.2005 (2,653) (657) (766) (4,076)
Acquisitions (4,569) – (80) (4,649)
Disposals 986 – 15 1,001
Change in consolidation scope 20 – 162 182
Currency translation adjustment (10) – (71) (81)
Reclassification and other changes – – – –
12.31.2005 (6,226) (657) (740) (7,623)
Acquisitions – – (7) (7)
Disposals 1,965 – 85 2,050
Change in consolidation scope (14) – – (14)
Currency translation adjustment – – 50 50
Reclassification and other changes – – 460 460
Reclassification as held for sale – 655 – 655
12.31.2006 (4,275) (2) (152) (4,429)
The main available-for-sale assets are:
Fair value ofStockholders’ Net % Gross equity equity Closing
(in € thousands) equity income held interests interests Date
Bourbon AXA Inv. Fund 31,976 12,032 23 5,660 5,660 12/31/2005
Innodis 23,147 110 20 4,720 2,622 06/30/2006
These equity interests represent the group’s interests in the capital stock of these companies, over which the group hasno influence.
The derivative instruments are detailed in notes 3.18 and 3.19.
3.7 Inventories and work in progress
Inventories and work in progress present a net value of €14,035 k at December 31, 2006 and €13,344 k at December 31,2005, broken down as follows:
Gross values:
(in € thousands) 12.31.2006 12.31.2005
Gross value
Raw materials and supplies 6,142 7,015
Work in progress 595 1,267
Finished and semi-finished goods 7,350 5,269
Merchandise 240 111
Total 14,327 13,662

64 l BOURBON 2006 Financial report
Consolidated financial statements
Valuation allowance:
(in € thousands) 12.31.2006 12.31.2005
Valuation allowance
Raw materials and supplies (292) (318)
Work in progress – –
Finished and semi-finished goods – –
Merchandise – –
Total (292) (318)
3.8 Trade and other debtors, current financial assets and other current assets
Receivables due in less than one year are classified as current assets.
The current part of the financial assets is detailed below:
12.31.2006 12.31.2005
Gross Valuation Net Valuation Net(in € thousands) value allowance value Gross allowance value
Trade and other debtors 201,409 (7,149) 194,260 173,145 (5,576) 167,569
Current financial assets 18,356 (144) 18,212 16,428 – 16,428
Other current assets 9,602 – 9,602 8,417 – 8,417
Total 229,367 (7,293) 222,074 197,990 (5,576) 192,414
Details of current financial assets and other current assets:
(in € thousands) 12.31.2006 12.31.2005
Loans and securities 13,807 9,872
Accrued interest on receivables and loans 1,625 380
Derivative instruments 2,780 6,176
Total current financial assets 18,212 16,428
Prepaid expenses 9,602 8,417
Total current assets 9,602 8,417
Derivative instruments are presented in notes 3.18 and 3.19.

BOURBON 2006 Financial report I 65
Consolidated financial statements
3.9 Cash and cash equivalents
La trésorerie et les équivalents de trésorerie se ventilent comme suit :
(in € thousands) 12.31.2006 12.31.2005
Marketable securities 89,866 14,194
Other investments 100 –
Accrued interests 352 63
Cash on hand and in banks 179,365 218,004
Total 269,683 232,261
Investments considered to be cash equivalents are readily convertible to known amounts of cash and are subject to aninsignificant risk of changes in value.
Marketable securities are Euro money market SICAVs with a volatility coefficient of less than 0.5. The main part of the portfolioconsists of SOGEMONEPLUS (€86.4 m). Note 3.18 on the stock risk specifies the group’s strategy.
3.10 Stockholders’ equity
Capital stock
At the beginning of the year, the capital stock was composed of 24,612,000 fully paid-up shares representing a value of31,267,264 euros; the capital increase related to the 433,577 stock options exercised between October and December 2005was amended by the Board of Directors at its meeting on March 20, 2006.
The Special Stockholders’ Meeting of May 23, 2006 approved the two-for-one stock split.
The group issued five stock option plans for 2,049,606 stock options at December 31, 2006. The method for measuring andaccounting for these stock option plans is detailed in note 1.5.14 and the principal features of the plans are presented in note3.11.
At the year end and given the two-for-one stock split, 971,528 stock options were exercised for a total amount of €5,484 k.The resulting new shares created generated a capital increase of €617 k and an increase in additional paid in capital of €4,867 k.
After these various operations, the number of shares comprising the capital stock is 50,195,528.
Changes in shares over 2006 are summarized as follows:
Number of Shares
Number of shares at January 1, 2006 (*) 25,045,577
Creation of shares following the exercise of stock subscription options until May 31, 2006 + 15 661
Number of shares at May 31, 2006 25,061,238
Two-for-one stock split on June 1, 2006 + 25 061 238
New shares created following the exercise of stock subscription options from June 1 toDecember 31, 2006 + 73 052
Number of shares at December 31, 2006 50,195,528
(*) Including 433,577 stock options exercised from October 2005 to December 2005.

66 l BOURBON 2006 Financial report
Consolidated financial statements
3.11 Stock option plans
BOURBON has issued five stock subscription option plans, four of which after November 7, 2002 are accounted for as employeebenefits. The features of these plans are detailed below:• the first plan granted in September 2001 for 1,011,106 shares (after two-for-one stock split in 2006 and including cancelled
stock options), which options may be exercised from 2005 until 2007. Under this plan, the total number of options exercisedat December 31, 2006 was 971,528. The number of options remaining totaled 39,578 at December 31, 2006;
• the second plan issued in September 2003 for 190,400 shares (after two-for-one stock split in 2006 and including cancelledstock options), which options may be exercised from 2007 until 2009;
• the third plan issued in March 2005 on 254,000 shares (after two-for-one stock split in 2006 and including cancelled stockoptions), which options may be exercised from 2009 until 2011;
• the fourth plan issued in December 2005 on 540,400 shares (after two-for-one stock split in 2006 and including cancelledstock options), which options may be exercised from 2009 until 2011;
• the fifth plan issued in December 2006 on 43,200 shares, which options may be exercised from 2010 until 2012.
The group’s stock options plans are summarized below:
September September March December December2001 2003 2005 2005 2006
Date of authorization by Combined Annual and May 25, May 25, May 25, June 7, June 7, Special Stockholders’ Meeting 2000 2000 2000 2005 2005
September 10 September 8 March 8 December 5 December 4Date of Board authorization 2001 2003 2005 2005 2006
Number of stock options 1,145,512 224,000 300,000 600,000 43,200
Total number of stock options allotted adjusted at Dec 2006 1,011,106 190,400 254,000 540,400 43,200
Number of beneficiaries 197 11 17 299 60
October September March December DecemberStart date 2005 2007 2009 2009 2010
October September March December DecemberExpiration date 2007 2009 2011 2011 2012
Subscription price in euros adjusted at 12/31/2006 5.645 9.13 21.085 32.75 40.05
Fair value at 12/31/2006 N/A 13.365 36.975 36.975 41.63
N/A: Not applicable.
3.12 Treasury shares (BOURBON shares held by BOURBON SA)
The treasury shares held by the group on the closing date have been deducted from consolidated stockholders’ equity.The cumulative impact at the beginning of the year is € (310) k, plus € (2,095) k in 2006 in the reserves. BOURBON held43,936 of its owned shares at December 31, 2006.

BOURBON 2006 Financial report I 67
Consolidated financial statements
3.13 Employee benefit obligations and other provisions
Provisions are as follows:
Employee General Other Provisionsbenefit Tax liability provisions for other
(in € thousands) obligations assessments Disputes warranty for risks obligations Total
01.01.2005 13,815 5,181 1,001 3,602 5,063 6,721 35,383
Additional provisions 1,775 28 99 3,320 2,102 971 8,295
Used during the year (539) (3,843) – (1,433) (3,874) (2,225) (11,914)
Unused amount reversed – – (147) – – – (147)
Change in consolidation scope (870) (984) (663) – 1,918 (3,686) (4,285)
Currency translation adjustment 25 – 44 – 493 – 562
Reclassificationand other changes (92) – – – – (500) (592)
12.31.2005 14,114 382 334 5,489 5,702 1,281 27,302
Additional provisions 1,350 261 39 155 1,498 269 3,572
Used during the year (613) (55) – – (2,124) (278) (3,070)
Unused amount reversed – (143) – – – – (143)
Change in consolidation scope – – – – – – –
Currency translation adjustment (40) – (4) – (126) 5 (165)
Reclassification andother changes 157 – – – – (157) –
Reclassification as held for sale – – – – (49) – (49)
12.31.2006 14,968 445 369 5,644 4,901 1,120 27,447
Provisions maturing in more than one year are classified in this item. The short-term part (< 1 year) is classified as “Provisions –less than one year” and only concerns employee benefit obligations.
The provision for general liability warranty is recognized for the general liability warranty granted at the time of the sale of theRéunion Sugar/Europe Trading activities.
The impact of additional provisions and reversal of provisions is booked as operating income.
Employee benefit obligations
Employee benefit obligations include the long-term (more than 1 year) part of the provision for retirement benefit obligations andthe provision for seniority awards.
Retirement benefit obligations
The main assumptions used in 2006, as in 2005, to measure the retirement benefit obligations are the following:• discount rate: 4%;• inflation rate: 2% in most cases, except for certain countries where a different rate has been used to take into account local
economic conditions;• inclusion of an average salary increase rate based on the salary policy within the various companies concerned.

68 l BOURBON 2006 Financial report
Consolidated financial statements
The change in the provision for retirement benefit obligations is as follows:
(in € thousands) 12.31.2006
Present value of the obligation at beginning of the year 14,353
Current service cost 1,367
Interest cost 509
Retirement indemnities paid (1,078)
Past service cost –
Currency translation adjustment (38)
Reclassifications 44
Effect of the changes in consolidation scope and changes in the consolidation method –
Present value of the obligation at closing 15,157
Less than one year 556
The current service cost is the present value of benefit attributed to the current year (cost of one year of additional work).
Interest cost is the increase in the present value of the obligation resulting from the fact that it is one year closer to the date ofpayment of the benefits. It represents the cost of one year of non-discounting.
In addition, there was no plan change in fiscal year 2006.
There is no associated asset (investment, insurance contract) intended to fund the benefits granted to employees (retirementbenefit obligations).
In 2006, the amounts recognized in the income statement for retirement benefit obligations are:
(in € thousands) 2006
Current service cost (1,367)
Interest cost (509)
Total expenses related to retirement benefit obligations (1,876)
Decrease in provision due to retirements during the year 1,078
Net impact on income statement 798

BOURBON 2006 Financial report I 69
Consolidated financial statements
3.14 Financial liabilities
Financial liabilities (€1,285,530 k at 12/31/2006) appear on the balance sheet in the items “Borrowings and financial liabilities”and “Borrowings and bank loans” (< 1 year).”
a) Analysis by maturity
The maturities of the financial liabilities are as follows:
(in € thousands) 12.31.2006 12.31.2005
< 1 year 414,566 292,915
From 1 year to 5 years 474,723 380,336
> 5 years 396,241 351,653
Total 1,285,530 1,024,904
Of which:
Bank overdrafts(including accrued interests) 245,522 148,709
Finance lease liabilities 84,104 3,940
< 1 year 4,347 3,219
From 1 year to 5 years 20,223 721
> 5 years 59,534 –
b) Analysis by interest rates
Financial liabilities breaks down as follows:
(in € thousands) 12.31.2006 12.31.2005
Fixed rate or swapped to fixed 578,420 258,022
Medium or long-term variable rate 453,688 615,135
Bank overdrafts (variable rate) 231,545 148,591
Bank overdrafts (fixed rate) 13,218 –
Total borrowings and bank overdrafts 1,276,871 1,021,748
Accrued interests 8,659 3,156
Total financial liabilities 1,285,530 1,024,904
c) Analysis by currency
As of December 31, 2006, bank borrowings and finance lease liabilities breaks down as follows:
(in € thousands) 12.31.2006 12.31.2005
EUR – Euro 1,015,774 686,913
USD – US Dollar 71,947 110,788
NOK – Norwegian Kroner 184,973 217,729
VND – Vietnamese Dong 1,543 3,512
MGA – Ariary 41 42
MUR – Mauritian rupee 2,466 2,764
SGD – Singapore Dollar 127 –
Total (exc. accrued interests) 1,276,871 1,021,748

70 l BOURBON 2006 Financial report
Consolidated financial statements
In 2005, the group contracted a syndicated loan for €320 m. As of December 31, 2006, the outstanding loan balance was€315.2 m. The balance of €4.8 m was released over the first quarter of 2007. The loan matures in 2017 and the rate is 3-monthEuribor + 0.8%, swapped to 3.75% (including margin) until 2014.
This loan carries a non-utilization commission. The amount paid for this commission was €261 k in 2006.
d) Debt secured by collateral
As of December 31, 2006, the bank borrowings collaterized secured by mortgages, pledges of equipment or marketable securitiesand other securities represented a total of €578,383 k, compared with €684,829 k in 2005. The assets pledged are primarilyvessels.
These mortgages were recorded with the “Bureau des Hypothèques” (Mortgage Registry) between 1999 and 2006 for a totalvalue of €1,035,413 k.
3.15 Finance costs
Finance costs are as follows:
(in € thousands) 12.31.2006 12.31.2005
Cost of net debt (30,345) (21,816)
– cost of gross debt (39,487) (32,561)
– income from cash and cash equivalents 9,141 10,745
Other finance gains and expenses 3,510 9,908
– net foreign exchange income/(loss) (7,890) 13,524
– other finance expenses (1,835) (13,792)
– other finance gains 13,235 10,176
Cost of net debt equals all interest expense and income produced by the elements comprising the net financial debt duringthe year.
Other finance gains and expenses mainly includes foreign exchange gains and losses and the net increase in financialvaluation allowances. The amount of the foreign exchange income/(loss) does not include the effect of the change in the fairvalue of the derivative instruments, which is recognized as other finance gains and expenses. This effect amounted to €3,726 kat December 31, 2006, and primarily corresponds to the change in fair value on the ineffective part of the currency hedges.

BOURBON 2006 Financial report I 71
Consolidated financial statements
3.16 Deferred tax
As of December 31, the deferred tax assets and liabilities are as follows:
(in € thousands) 12.31.2006 12.31.2005
Deferred tax assets 6,476 6,900
Deferred tax liabilities (40,742) (41,393)
Net deferred tax (34,266) (34,493)
Analysis of deferred tax:
(in € thousands) 12.31.2006 12.31.2005
Deferred tax assets 6,476 6,900
Retirement benefit obligations 3,515 3,934
Other temporary differences 844 131
Consolidation restatements 2,126 3,764
Other (9) (929)
Deferred tax liabilities (40,742) (41,393)
Restatements of amortization and depreciation (40,385) (41,304)
Other restatements and temporary differences (357) (89)
As of December 31, 2006, in accordance with the principle of prudence and based on the tax position of the companiesconcerned, no deferred tax asset was recognized on the tax losses which were €73,084 k.
3.17 Income tax
(in € thousands) 12.31.2006 12.31.2005
Current income tax (5,159) (10,266)
Deferred income tax (196) 108
Tax (expenses)/income (5,355) (10,158)
Current income tax in the amount of €5,159 k at December 31, 2006 takes into account the tax savings resulting from theapplication of the following rules:• french tax consolidation in the amount of €3,158 k• tonnage tax in the amount of €14,855 k
As of December 31, 2006, the theoretical corporate income tax of €53,974 k is calculated by applying the prevailing tax rate inFrance to the income before tax, share in income/loss of associates, gains on equity interest sold, and net income fromdiscontinued operations:
(in € thousands) 12.31.2006
Consolidated income before tax, share in income/loss of associates,gains on equity interest sold, and net income from discontinued operations: 154,548
French domestic income tax rate prevailing at 12/31/2006:
33.33% (51,511)
3.30% (1,675)
Theoretical income tax (53,186)
Income tax expense (5,355)
Difference 47,831

72 l BOURBON 2006 Financial report
Consolidated financial statements
The difference between the tax recognized and the theoretical tax is as follows:
(in € thousands) 12.31.2006
Companies in deficit excluded from tax consolidation (610)
Non-taxable foreign companies 13,087
Tax savings (fiscal EIGs, “Loi Pons”) 19,065
Tonnage tax 14,855
Change in additional tax rate 437
Other differences 997
Total 47,831
3.18 Financial risk management: objectives and policy
In addition to derivative instruments, the principal instruments of the group consist of bank loans and overdrafts, finance leasesand leases with a purchase option, cash and short-term deposits.The objective of these financial instruments is to finance the group’s operations. The group holds other financial assets andliabilities such as trade receivables and payables which are generated by its activities.The group has also executed transactions that integrate derivative instruments, mainly interest rate swaps and forward currencysales and purchases. The purpose of these instruments is to manage the interest rate and currency risks related to the group’soperations and financing.The group’s policy is, and has always been, not to subscribe to instruments for speculative purposes.The principal risks attached to the group’s financial instruments are the interest rate risk on cash flows, the liquidity risk, thecurrency risk and the credit risk. The Board of Directors has reviewed and approved the policies to manage each of those risks.Those policies are summarized below.The group’s accounting policies for the management of derivative instruments are described in note 1.5.19.
Interest rate risk on cash flows
The group’s exposure to the risk of changes in interest rates is related to the group’s medium and long-term variable rate financialdebt. BOURBON regularly monitors its exposure to the rate risk. This activity is the responsibility of the group’s Treasurer, whoreports to the Executive Vice President – Finance and administration.The group’s policy is to manage its interest liability using a combination of fixed-rate and variable rate borrowings. In order tooptimize the total interest cost, the group sets up interest rate swaps through which it exchanges, at specified intervals, thedifference between fixed contract rates and variable interest amounts calculated by reference to the agreed notional principalamounts. These swaps are assigned to hedge the borrowings. As of December 31, 2006, after consideration of the interest rateswaps, approximately 56% of the group’s medium or long-term debt is contracted at a fixed interest rate.

BOURBON 2006 Financial report I 73
Consolidated financial statements
The following table shows the book value by maturity of the group’s financial instruments which are exposed to the interest raterisk, after taking into account the rate hedges:
Fixed-rate position:
At December 31, 2006> 1 year to
(in € thousands) < 1 year < 5 years > 5 years Total
Cash or cash equivalents – – – –
Short term deposits – – – –
Loans and securities – 64,490 – 64,490
Fixed-rate assets – 64,490 – 64,490
Bank overdrafts (13,218) – – (13,218)
Deposits and securities received – (297) – (297)
Borrowings under finance leases (4,347) (20,223) (59,534) (84,104)
Bank borrowings (1,689) (12,490) (18,934) (33,113)
Fixed-rate liabilities (19,254) (33,010) (78,468) (130,732)
Net fixed-rate position (19,254) 31,480 (78,468) (66,242)
Variable-rate position:
At December 31, 2006> 1 year to
(in € thousands) < 1 year < 5 years > 5 years Total
Cash or cash equivalents 179,650 – – 179,650
Short term deposits 4,642 – – 4,642
Loans and securities – – – –
Variable-rate assets 184,292 – – 184,292
Bank overdrafts (231,545) – – (231,545)
Deposits and securities received – – – –
Borrowings under finance leases – – – –
Bank borrowings (155,109) (441,711) (317,774) (914,594)
Variable-rate liabilities (386,653) (441,711) (317,774) (1,146,139)
Hedges 67,190 218,194 175,521 460,906
Net variable-rate position after hedging (135,171) (223,517) (142,253) (500,941)

74 l BOURBON 2006 Financial report
Consolidated financial statements
At December 31, 2005, the group’s exposure to the interest rate risk was as follows:
Fixed-rate position:
At December 31, 2005> 1 year to
(in € thousands) < 1 year < 5 years > 5 years Total
Cash or cash equivalents – – – –
Short term deposits – – – –
Loans and securities – 50,289 – 50,289
Fixed-rate assets – 50,289 – 50,289
Bank overdrafts – – – –
Deposits and securities received (16,849) (101) – (16,950)
Borrowings under finance leases (3,219) (721) – (3,940)
Bank borrowings (9,498) (9,792) (21,505) (40,795)
Fixed-rate liabilities (29,566) (10,614) (21,505) (61,685)
Net fixed-rate position (29,566) 39,675 (21,505) (11,396)
Variable-rate position:
At December 31, 2005> 1 year to
(in € thousands) < 1 year < 5 years > 5 years Total
Cash or cash equivalents 218,004 – – 218,004
Short term deposits 14,257 – – 14,257
Loans and securities – – – –
Variable-rate assets 232,261 – – 232,261
Bank overdrafts (148,591) – – (148,591)
Deposits and securities received – – – –
Borrowings under finance leases – – – –
Bank borrowings (114,821) (366,503) (330,148) (811,472)
Variable-rate liabilities (263,412) (366,503) (330,148) (960,063)
Hedges – 106,272 90,066 196,338
Net variable-rate position after hedging (31,151) (260,232) (240,081) (531,465)

BOURBON 2006 Financial report I 75
Consolidated financial statements
At December 31, 2006, the interest rate swap contracts were on the group’s borrowings, transforming variable rates into fixedrates. Those contracts break down by maturity as follows:
At 12.31.2006 Notional (in currencies) Maturity
Currency
Fixed-rate borrowing swaps
NOK 351,629,968 11.18.2012
EUR 16,371,313 03.28.2008
EUR 21,278,770 08.10.2009
EUR 13,906,835 10.04.2010
EUR 8,378,571 03.21.2011
EUR 64,458,520 Between 03.30.2011 and 04.14.2011
EUR 12,000,000 03.28.2013
EUR 320,000,000 04.07.2014
The €320 m swap expiring in April 2014 covers the syndicated loan for the same amount (see note 3.14). At the end ofDecember 2006, a portion if this swap is initially deferred over 2007, in order to match with the installment schedule of the loan.
The following table shows the group’s net exposure to variable rates before and after risk management, based on the hedges inplace and the sensitivity of the group’s income before taxes (related to the changes in fair value of the monetary assets andliabilities) to a reasonable change in interest rates; all other variables are constant:
At December 31, 2006> 1 year to
(in € thousands) < 1 year < 5 years > 5 years Total
Variable rate assets 184,292 – – 184,292
Variable rate liabilities (386,653) (441,711) (317,774) (1,146,139)
Net variable rate position before hedging (202,361) (441,711) (317,774) (961,847)
Hedges 67,190 218,194 175,521 460,906
Net variable rate position after hedging (135,171) (223,517) (142,253) (500,941)
Sensitivity to a 1% increase in rates before hedging (2,024) (4,417) (3,178) (9,618)
Sensitivity to a 1% increase in rates after hedging (1,352) (2,235) (1,423) (5,009)
Sensitivity to a 1% decrease in rates before hedging 2,024 4,417 3,178 9,618
Sensitivity to a 1% decrease in rates after hedging 1,352 2,235 1,423 5,009
At December 31, 2006, if interest rates on borrowings had been 1% higher or lower, the group’s cost of net debt would havebeen €5.0 m higher or lower.

76 l BOURBON 2006 Financial report
Consolidated financial statements
At December 31, 2005, the position was as follows:
At December 31, 2005> 1 year to
(in € thousands) < 1 year < 5 years > 5 years Total
Variable rate assets 232,261 – – 232,261
Variable rate liabilities (263,412) (366,503) (330,148) (960,063)
Net variable rate position before hedging (31,151) (366,503) (330,148) (727,802)
Hedging – 106,272 90,066 196,338
Net variable rate position after hedging (31,151) (260,232) (240,081) (531,465)
Sensitivity to a 1% increase in rates before hedging (312) (3,665) (3,301) (7,278)
Sensitivity to a 1% increase in rates after hedging (312) (2,602) (2,401) (5,315)
Sensitivity to a 1% decrease in rates before hedging 312 3,665 3,301 7,278
Sensitivity to a 1% decrease in rates after hedging 312 2,602 2,401 5,315
At December 31, 2005, if interest rates on borrowings had been 1% higher or lower, the group’s cost of net debt would havebeen €5.3 m higher or lower.
Currency risk
The group’s policy is to reduce as far as possible the economic risk related to currency fluctuations over the medium term.The majority of BOURBON’s revenues are generated in US dollars, while a significant portion of its costs is incurred in euros.If BOURBON did not use a strategy to hedge its exposure to the risk resulting from currency fluctuations, its accounts would beimpacted by fluctuations in the market exchange rates.As a result, the group wants to minimize the impact of the dollar volatility on the annual operating income through natural hedgingand/or hedging instruments.
Thus, the group has opted for simple hedging instruments, based on forward currency sales and “vanilla” type put options.These instruments are all tied to certain underlying assets resulting from currency service contracts and are validated using realisticbudget assumptions. As of December 31, 2006, only a portion of first half 2007 was hedged.
The principal currency risks on operations are as follows:
For the Offshore Division, BOURBON invoices a large portion (about 68%) of its services in US dollars. The group has a naturalforeign exchange hedge thanks to the payment of expenses in the same currency (representing about 20% of revenues).The policy is to maximize this natural hedge.
The residual risk is partially hedged in the short term using forward US dollar sales and/or currency puts. On the unhedged portion,and over time, the Offshore Division is directly exposed to currency risks, more specifically on the US dollar.
The Bulk Division, essentially in US dollars (revenues and costs) is booked in the US dollar functional currency. The marginrealized in US dollars is not hedged.
For the Towage & Salvage Division, expenses are essentially in the same currency as revenues (mainly euro or CFA franc).Therefore, the currency risk is insignificant.
For the Vietnam sugar business, expenses are for the most part in the same currencies as revenues. Currency risk is, therefore,limited to the effect of translation in euros in the BOURBON consolidated statements and to the accounting effects onstockholders’ equity.

BOURBON 2006 Financial report I 77
Consolidated financial statements
The group also manages the currency risk arising from long term flows. Thus, in the case of vessel acquisitions in foreigncurrencies, the policy is to partially hedge the foreign currency risk during the construction period by entering into forward currencypurchase contracts.
The policy is to finance these acquisitions in the currency in which the corresponding leases will be paid by the customers;however, in order to avoid accounting exchange differences in the countries outside the euro zone and the US dollar zone(particularly, in Norway, Brazil and Mexico), the entities finance their investments in their functional currency.As an exception, early in 2004, it was decided to temporarily abandon this policy and to convert most of the loans from US dollarsto euros. This was done to recognized the unrealized foreign exchange gains booked in 2003. Since then, most of the newborrowings (outside Norway) have been contracted in euros. When the euro/US dollar parity permits, these borrowings will beconverted into US dollars and subsequent acquisitions will be financed in US dollars.
The contribution of the main currencies to the consolidated balance sheet at December 31, 2006 is the following:
12.31.2006(in € thousands) Assets Liabilities
EUR 1,488,300 1,756,150
BRL 56,001 19,318
MXP 26,526 9,934
NOK 481,676 402,831
USD 277,082 163,386
VND 66,579 50,543
Other currencies 20,996 14,999
Total balance sheet 2,417,160 2,417,160
The following table shows the group’s monetary assets and liabilities that are exposed to the foreign currency risk, before hedging:
12.31.2006Monetary Monetary Net position
(in € thousands) assets liabilities before hedging
BRL 1,672 1,306 365
MXP 1,559 628 931
NOK 47,594 196,165 (148,571)
USD 141,647 132,045 9,602
VND 18,983 2,572 16,412
Other currencies 7,241 5,179 2,062
Total 218,696 337,895 (119,199)
The group negotiates the maturities on its hedging derivative instruments to match them with the maturities of the items hedged(to optimize the effectiveness of the hedge). At December 31, 2006, 17% of the committed group’s revenues in foreigncurrencies (essentially until June 2007) are hedged.

78 l BOURBON 2006 Financial report
Consolidated financial statements
At December 31, 2006, currency derivatives were on flows that were essentially in US dollars (USD) and in Norwegian kroner(NOK) and were as follows:
Notional AverageAt 12.31.2006 (in currencies) Maturity exchange rate
Forward contracts hedging committedfuture revenues
Euro / NOK 3,900,000 Between 01/16/07 and 12/28/07 8.4269
NOK / GBP 300,000 01/16/07 12.0765
USD / Euro 15,000,000 Between 01/31/ 07 and 06/29/07 1.2604
USD / NOK 3,900,000 Between 01/31/ 07 and 03/30/07 6.5987
Forward contracts hedging committedfuture purchases
USD / Euro 264,391,162 Between 01/05/07 and 12/14/07 0.7722
USD / Euro 219,883,051 Between 01/16/08 and 10/15/08 0.7558
Options hedging future revenues
USD 2,500,000 01/29/07 0.7937
USD 2,500,000 02/26/07 0.7937
USD 2,500,000 03/28/07 0.7937
USD 2,500,000 04/26/07 0.7937
USD 2,500,000 05/29/07 0.7937
USD 2,500,000 06/27/07 0.7937
Contracts hedging intra-group loans inforeign currencies
NOK / Euro 275,000,000 03/01/07 0.12615
USD / Euro 1,217,000 03/01/07 1.24360
Cross-currency swap
Euro / NOK 90,498,677 Between 06/20/16 and 10/26/16 8.12719
The following table shows the sensitivity of the group’s pre-tax income (related to changes in the fair value of the monetary assetsand liabilities) to a reasonable modification in exchange rates against euro after currency hedging (all other variables heldconstant):
12.31.2006 Effect on incomeNet position Net position
Monetary Monetary before after Of a 1% Of a 1%(in € thousands) assets liabilities hedging Hedging hedging increase decrease
BRL 1,672 1,306 365 365 (4) 4
MXP 1,559 628 931 931 (9) 9
NOK 47,594 196,165 (148,571) 90,499 (58,072) 575 (587)
USD 141,647 132,045 9,602 9,602 (95) 97
VND 18,983 2,572 16,412 16,412 (162) 166
Other currencies 7,241 5,179 2,062 2,062 N/S N/S
Total 218,696 337,895 (119,199) 90,499 (28,700) 305 (311)
N.B.: Forward currency hedges on future transactions do not appear in this table insofar as the item hedged is not yet on thebalance sheet.

BOURBON 2006 Financial report I 79
Consolidated financial statements
Risk on the price of supplies
The group’s exposure to price risk is minimal.
Credit risk
The group maintains commercial relations only with thirdparties with proven financial stability. The group’s policy is toverify the financial health of all customers that wish to obtaincredit payment terms. In addition, customer balances arecontinually monitored and, therefore, the group’s exposure tounrecoverable receivables is not significant.
The group has not signed a credit insurance type agreement.
For the credit risk on the group’s other financial assets, i.e. cashand cash equivalents, available-for-sale financial assets, andcertain derivative instruments, the group works only with top-ranking banks.
Liquidity risk
The group’s financing is conducted within the framework of agroup policy implemented by the Finance and AdministrationDepartment. This policy is to self-finance the investmentprogram, using asset disposals and the generation of operatingcash flows, the recurrence of which is ensured by the long-termcontract strategy, particularly in the Offshore Division.
Cash management is coordinated at the group’s operationalheadquarters. Financière Bourbon, a general partnershiporganized as a cash-pooling unit, offers its services to most ofthe group’s operational subsidiaries. Under a cash agreementwith Financière Bourbon, those entities benefit from activesupport in managing their flows, their currency and rate risks,their operational risks, and their short and medium-term debt,in compliance with various laws in force locally.
In 2005, BOURBON took out a syndicated loan for €320 m.As of December 31, 2006, the outstanding loan amount was€315.2 m. The balance of €4.8 m was released during the firstquarter of 2007.
In addition, the group holds unused short-term linesrepresenting €95 m as of December 31, 2006.
The schedule of long-term financial debt appears in note 3.14.
In addition to the traditional covenants associated with such acorporate loan, some covenants specific to the €320 m loanrequire BOURBON to ensure that vessels are financed but notmortgaged be available to the lender. If BOURBON was toexceed certain financial ratios contained in this contract,BOURBON would also require, at the lender’s option, to grantmortgages on those same vessels (unmortgaged portion) firstand/or on other vessels in the BOURBON fleet, until it re-established those same ratios to the Lender’s satisfaction. Noearly repayment is required under these financial covenants.
The other loans taken out by the group do not contain anycontractual provisions, which, if violated, would have asignificant impact on the group’s financial statements.
Stock risk
The stock portfolio of the group consists of money marketfunds with a volatility coefficient of less than 0.5. In addition,these investments are made solely for the purpose ofmanaging short-term cash excess. Therefore, the sensitivity ofthe group’s income to any impairment of these assets isnegligible. Thus, the group’s exposure to stock risk is minimal.

80 l BOURBON 2006 Financial report
Consolidated financial statements
3.19 Financial instruments
As of December 31, 2006, the fair value of derivative instruments breaks down as follows:
(in € thousands) 12.31.2006
Currency hedging derivative instruments 3,627
Rate hedging derivative instruments 16,231
Transaction derivative instruments –
Instruments booked as assets 19,858
Of which:
< 1 year 2,780
> 1 year 17,078
Total 19,858
(in € thousands) 12.31.2006
Currency hedging derivative instruments 4,096
Rate hedging derivative instruments –
Transaction derivative instruments –
Instruments booked as liabilities 4,096
Interest rate risk
Cash flow hedges
As of December 31, 2006, the group held various swaps to hedge interest rate changes on its variable rate loans. These swapcontracts are used to hedge the interest rate risk for the firm commitments.
(in € thousands) Assets Liabilities
Fixed rate hedging derivative instruments 16,231 –
Optional rate hedging derivative instruments – –
Interest rate hedging 16,231 –
The terms of the rate swaps were negotiated in order to coincide with the terms of the firm commitments.The hedges on borrowing future cash flows were deemed highly efficient and an unrealized gain of €16,231 k was recognizedin stockholders’ equity at December 31, 2006.Interest on the variable-rate financial instruments is remeasured at regular intervals of less than one year. Interest on fixed-ratefinancial instruments is set until the instrument maturity. The group’s other financial instruments which are not indicated in thetables above do not bear interest and are not, therefore, subject to interest rate risk.
Fair value hedge
Not applicable.

BOURBON 2006 Financial report I 81
Consolidated financial statements
Currency risk
Cash flow hedges
As of December 31, 2006, the group held various forward foreign exchange contracts to hedge future revenues or futurepurchases on which the group has firm commitments.
(in € thousands) Assets Liabilities
Forward foreign exchange contracts 3,030 4,096
Options 597 –
Currency hedging 3,627 4,096
The terms of the forward foreign exchange contracts were negotiated in order to coincide with the terms of the firm commitments.The hedges on future cash flows related to future purchases and revenues were deemed highly efficient and an unrealized lossof €6,897 k was recognized in stockholders’ equity at December 31, 2006.
Fair value hedge
Not applicable.
Hedging of net investments in foreign operations
Not applicable.
Other derivative instruments
The Vindémia shares (residual 30% stake held by BOURBON) are covered by a stockholders’ agreement and a stock derivativethrough a put on Casino. Groupe Casino itself holds a call on BOURBON for the Vindémia shares still held by BOURBON.
The put can be exercised every year between the 45th day after approval of the financial statements for the year N-1 andSeptember 15, in year N. The call may be exercised between the 60th day after approval of the financial statements for the yearN-1 and September 15 in year N. Exercise of the put makes the corresponding call void and vice-versa.
The years for exercising the last put on the 30% residual stake are 2007, 2008 and 2009.
The years for exercising the last call on the 30% residual stake are 2008 and 2009.
At December 31, 2006 and December 31, 2005, the group believes that the fair value of Vindémia cannot be determined withsufficient reliability. Therefore, pursuant to IAS 39 governing options on unlisted securities, these derivatives are measured at cost,i.e. for a zero value, at December 31, 2006 and December 31, 2005.

82 l BOURBON 2006 Financial report
Consolidated financial statements
4 SEGMENT REPORTING
Pursuant to IAS 14 “Segment Reporting”, the group has opted for the business segment as the primary segment reporting formatand the geographic segment as the secondary segment reporting format.
Based on its organization and internal information system, the group has defined five business segments: Offshore Division,Towage & Salvage Division, Bulk Division, Corporate, and Retail business, although it should be pointed out that the group iswithdrawing from the Retail business. The principal divisions are defined as follows:
• Offshore Division, a marine service provider in the oil and gas industry, supporting offshore operational and productionactivities;
• Towage & Salvage Division, which operates in port towage, deep-sea towage and assistance and salvage at sea;• Bulk Division, which operates in the international maritime freight sector to transport dry bulk products (coal, minerals,
cement products, grain, etc.).
In the primary segment reporting format, the following are defined as segment assets:• goodwill,• intangible assets and property, plant and equipment,• investments in associates,• inventories and work in progress,• trade and other receivables,• current financial assets and other current assets.
and the following are segment liabilities:• trade and other payables,• tax liabilities,• other current liabilities.
It should be noted that these segment assets and liabilities are not broken down at the secondary segment reporting formatbetween “France” and “International” because of their mobility (vessels).
Commercial transactions between Divisions are established on a market basis, with terms and conditions identical to those ineffect for supplying goods and services to customers outside the group.

BOURBON 2006 Financial report I 83
Consolidated financial statements
4.1 Primary segment information
The segment information for 2006 is as follows:
Towage &(in € thousands) Offshore Salvage Bulk Corporate Retail Eliminations Total
Revenues (non group sales) 376,572 129,732 169,245 42,091 – – 717,640
Cost of sales and general costs (191,886) (88,772) (130,331) (30,126) – – (441,115)
Other operating expenses and income 441 (22) 10 615 – – 1,045
EBITDA 185,128 40,938 38,924 12,580 – – 277,570
Amort., depreciation/provision (*) (72,282) (13,933) (3,888) (6,084) – – (96,187)
Operating income 112,846 27,005 35,036 6,496 – – 181,383
Share in income/loss of associates net of goodwill 4,042 – – – – – 4,042
(*) Including impairment on asset – – – – – – –
Segment assets 1,555,806 405,877 124,661 705,832 – (883,419) 1,908,757
Non-current segment assets classified as held-for-sale – – – 32,786 99,401 – 132,187
Segment liabilities 472,073 154,519 38,161 293,834 – (799,294) 159,293
Segment liabilities directly associatedwith non-current assets classified asheld-for-sale – – – 7,911 – – 7,911
Capital expenditures (**) 399,243 32,149 25,390 5,343 – – 462,125
(**) Capital expenditures on intangible assets and property, plant and equipment excluding assets classified as held-for-sale
For 2005, the breakdown was as follow (including the Retail business classified as held-for-sale):
Towage &(in € thousands) Offshore Salvage Bulk Corporate Retail Eliminations Total
Revenues (non group sales) 277,227 114,903 182,904 39,427 407,560 – 1,022,021
Cost of sales and general costs (161,673) (87,029) (129,849) (28,578) (374,584) – (781,713)
EBITDA 115,554 27,874 53,055 10,849 32,976 – 240,308
Amort., depreciation/provision (*) (57,105) (12,269) (2,906) (8,419) (10,601) – (91,300)
Other operating expenses and income – – – (849) – – (849)
Operating income 58,449 15,605 50,149 1,581 22,375 – 148,159
Share in income/loss of associates net of goodwill 42 – – – 5,073 – 5,115
(*) Including impairment on assets – – – (2,476) – – (2,476)
Segment assets 1,187,334 441,083 119,882 432,407 91,314 (583,302) 1,688,718
Segment liabilities 315,134 149,587 49,338 159,358 – (531,521) 141,896
Capital expenditures net of disposals 225,191 59,946 27,973 (223,210) – – 89,900

84 l BOURBON 2006 Financial report
Consolidated financial statements
4.2 Secondary segment information
The breakdown of revenues by geographical area for fiscal year 2006 was as follows:
(in € thousands) France International TOTAL
Offshore 10,616 365,956 376,572
Towage & Salvage 110,102 19,630 129,732
Bulk 27,089 142,156 169,245
Corporate 5,142 36,949 42,091
Total 152,949 564,691 717,640
Taking into account discontinued operations, revenues for 2005 were as follows:
(in € thousands) France International TOTAL
Offshore 10,513 266,714 277,227
Towage & Salvage 99,003 15,900 114,903
Bulk 33,522 149,382 182,904
Corporate 3,388 36,039 39,427
Total 146,426 468,035 614,461
4.3 Additional segment information
Offshore revenues
(in € thousands) 2006 2005
Europe 71,247 62,307
Africa 262,441 182,141
Americas 33,933 30,401
Asia 8,951 2,378
Total 376,572 277,227

BOURBON 2006 Financial report I 85
Consolidated financial statements
5 OTHER INFORMATION
5.1 Contractual obligations and other off-balance sheet commitments
(in € thousands) 12.31.2006 12.31.2005
Pledges, mortgages and collateral (see note 3.14) 578,383 684,829
Endorsements and guarantees given 134,596 28,760
Total commitments given 712,979 713,589
Endorsements and guarantees received – –
Total commitments received – –
Contractual obligations are as follows:
Payment due per period< 2 >
(in € thousands) Total 1 year to 5 years 5 years
Finance leases 84,104 4,347 20,223 59,534
Operating leases 3,051 339 1,356 1,356
Balance payable on orders for vessels under construction 777,862 376,799 401,063 –
Total 865,017 381,485 422,642 60,890
The presentation above does not omit any significant off-balance sheet commitment.
5.2 Net earnings per share
5.2.1 Basis earnings per share
The determination of the weighted-average number of shares of common stock outstanding during each period is presentedbelow:
12.31.2006 12.31.2005
Weighted-average number of shares over the period 50,125,269 49,375,434
Weighted-average number of treasury shares held over the period (30,952) (15,512)
Weighted-average number of shares outstanding during the period 50,094,317 49,359,922
The weighted-average number of shares outstanding during fiscal year 2006 takes into account the weighted-average number ofstock options exercised during the period.
The weighted-average number of shares outstanding in fiscal 2005 was adjusted to take into account the two-for-one stock splitthat took place on June 1, 2006. It also takes into account the weighted average number of stock options that were exercisedduring the year and which were not yet capitalized as of December 31, 2005. The shares created following the exercise of optionswere subject to a capital increase approved by the Board of Directors on March 20, 2006.

86 l BOURBON 2006 Financial report
Consolidated financial statements
For each period presented, the basis earnings per share were as follows:
12.31.2006 12.31.2005
Weighted-average number of shares used in the calculation of basis earnings per share 50,094,317 49,359,922
Net income (in € thousands)Consolidated, group share 152,891 205,039
Consolidated, group share – excluding income from discontinued operations 145,015 188,212
Net income from discontinued operations 7,876 17,071
Consolidated, group share – excluding net gains on equity interests sold 149,071 110,943
Consolidated, group share – excluding net gains on equity interests sold and net income from discontinued operations 141,195 93,872
Basis earnings per share (in €)Consolidated, group share 3.05 4.15
Consolidated, group share – excluding income from discontinued operations 2.89 3.81
Net income from discontinued operations 0.16 0.35
Consolidated, group share – excluding net gains on equity interests sold 2.98 2.25
Consolidated, group share – excluding net gains on equity interests sold and net income from discontinued operations 2.82 1.90
5.2.2 Diluted earnings per share
Pursuant to IAS 33, the number of shares used to calculate diluted earnings per share takes into account the diluting effect of theexercise of stock options, determined using the “share buyback” method. The weighted average number of shares used tocalculate basis earnings per share is, therefore, increased by dilutive potential ordinary shares..
Diluted earnings per share are determined as follows:
Number of potential shares:
12.31.2006 12.31.2006
Weighted-average number of shares outstanding during the period 50,094,317 49,359,922
Weighted-average number of dilutive stock options during the period 408,058 850,368
Weighted average number of potential shares 50,502,375 50,210,290
Pursuant to IAS 33, the determination of diluted earnings per share for 2005 did not take into account the stock option plansauthorized by the Board of Directors on March 8, 2005 and December 5, 2005 because those options had an anti-dilutive effect.

BOURBON 2006 Financial report I 87
Consolidated financial statements
Diluted earnings per share:
12.31.2006 12.31.2005
Weighted-average number of shares used in the calculation of diluted earnings per share 50,502,375 50,210,290
Net income (in € thousands)Consolidated, group share 152,891 205,039
Consolidated, group share – excluding income from discontinued operations 145,015 188,212
Net income from discontinued operations 7,876 17,071
Consolidated, group share – excluding net gains on equity interests sold 149,071 110,943
Consolidated, group share – excluding net gains on equity interests sold and net income from discontinued operations 141,195 93,872
Diluted earnings per share (in €)Consolidated, group share 3.03 4.08
Consolidated, group share – excluding income from discontinued operations 2.87 3.75
Net income from discontinued operations 0.16 0.34
Consolidated, group share – excluding net gains on equity interests sold 2.95 2.21
Consolidated, group share – excluding net gains on equity interests sold and net income from discontinued operations 2.80 1.87
5.3 Workforce and payroll at December 31, 2006
The group’s workforce is as follows:
Workforce 12.31.2006 12.31.2005
Managers 269 242
Employees and workers 1,298 1,002
Seamen 2,806 2,404
– Officers 1,140 928
– Crew 1,666 1,476
Total 4,373 3,648
The change in payroll was as follows:
(in thousands euros) 12.31.2006 12.31.2005
Personnel expenses 157,442 134,148
5.4 Events after the balance sheet date
Second Vindémia put
BOURBON still holds a 30% interest in the Vindémia capital, for which it holds options to sell the share to Groupe Casino in 2007,2008 and 2009 (see notes 2.2 et 3.19).When releasing its annual financial statements on March 15, 2007, Groupe Casino announced a valuation of the Vindémia Put,which could not be determined on the basis of the closeout of the Vindémia financial statements for 2006, on which theSupervisory Board had not yet made its required decision.Believing that the difference in the valuation of this strike price is “significant enough”, BOURBON reacted to the announcementof this valuation immediately by issuing a press release.

88 l BOURBON 2006 Financial report
Consolidated financial statements
5.5 Related-party transactions
Relations with Financière du Pladen
The Jaccar company is a 23.75% stockholder in BOURBON, which in turn holds 100% of Bourbon Maritime. During the year,Bourbon Maritime sold the shares it held in the Piriou company to Financière du Pladen, which is 39.24% held by Jaccar Holdings,a wholly owned subsidiary of Jaccar. The sale price of the Piriou shares was €4.5 m.
Relations with Sinopacific
The Chairman and Chief Executive Officer of BOURBON is an equal partner in the naval construction company Sinopacific, throughJaccar Holdings, a wholly-owned subsidiary of Jaccar.In 2006, BOURBON, through one of its subsidiaries Bourbon Supply Investissements, acquired nine vessels from the Sinopacificgroup for a total amount of €105,910 k. In addition, at December 31, 2006, the amount of the current orders is for fifty-eightvessels and totals €670,374 k, which generated advances on orders in the amount of €183,392 k.
Relations with Piriou and West Atlantic Shipyard
The Chairman and Chief Executive Officer of BOURBON is indirectly associated in the Piriou naval construction company and itssubsidiary West Atlantic Shipyard, through Financière du Pladen, which is held (39.24%) by Jaccar Holdings, a wholly ownedsubsidiary of Jaccar.In 2006, BOURBON, through its subsidiaries Bourbon Supply Investissements and Bourbon Offshore Interoil Shipping NavegacaoLda, acquired three vessels from these two companies for a total of €8,587 k. At December 31, 2006, the amount of the orders inprogress placed through the subsidiaries Bourbon Supply Investissements, Bourbon Offshore Interoil Shipping Navegacao Lda andLes Abeilles SAS, for twenty vessels and totaled €77,313 k, having generated advances on orders in the amount of €20,705 k.
Relations with SEAS
The Chairman and Chief Executive Officer of BOURBON is directly associated in the naval construction company SEAS, which iswholly owned by Jaccar Holdings, which is itself a wholly owned subsidiary of Jaccar.At December 31, 2006, current orders placed by BOURBON through its subsidiary Bourbon Offshore Craft were for fourvessels and totaled €4,782 k, having generated advances on orders in the amount of €401 k.
5.6 Executive compensation
Compensation for the corporate officers is set by the Board of Directors on the recommendation of the Compensation Committee.
For the year 2006, compensation for corporate officers who were in office for most of the year was as follows (excluding directors’fees):
(in € thousands) 2006
Fixed compensation
Salaries 389
Services 660
Variable compensation (*) 903
TOTAL 1,952
(*) Includes €153 k which will be paid in 2007 for 2006

BOURBON 2006 Financial report I 89
Consolidated financial statements
5.7 Scope of consolidation
5.7.1 List of fully consolidated companies
% of control of capital % of capital interest held directly or held directly or
indirectly indirectly Country
2006 2005 2006 2005
BOURBON Parent Company Parent Company France (Paris)
Abeille Cilaos 100 100 99.95 99.95 France ( Reunion)
Abeille Mafate 100 100 99.95 99.95 France (Reunion)
Aqua Service Réunion 51 51 51 51 France (Reunion)
Avracs 100 100 100 100 France
Babor 100 100 100 100 France
Bourbon Assistance 100 100 100 100 France (Reunion)
Bourbon Ben Luc 100 100 100 100 Vietnam
Bourbon Brazil Participacoes 100 100 100 100 Brazil
Bourbon Capital 100 100 100 100 Luxembourg
Bourbon Capital Elec USA 100 – 100 – United States
Bourbon Capital Holdings USA 100 100 100 100 United States
Bourbon Capital USA 100 100 100 100 United States
Bourbon Interoil Nigeria Ltd 40 40 40 40 Nigeria
Bourbon Logistics Indonesia 95 – 95 – Indonesia
Bourbon Management (formerly CFG) 100 100 100 100 France
Bourbon Maritime 100 100 100 100 France
Bourbon Offshore Asia 51 – 51 – Singapore
Bourbon Offshore Associates 100 100 100 100 United States
Bourbon Offshore Crafts 100 100 100 100 France
Bourbon Offshore Gaia 50.8 50.8 50.8 50.8 France
Bourbon Offshore Greenmar 100 100 100 100 Switzerland
Bourbon Offshore Holding 100 100 100 100 France
Bourbon Offshore I AS 75 75 75 75 Norway
Bourbon Offshore I KS 80.26 80.26 75 75 Norway
Bourbon Offshore II AS 100 75.5 100 75.5 Norway
Bourbon Offshore II KS 100 77.95 100 75.5 Norway
Bourbon Offshore III AS 80 80 80 80 Norway
Bourbon Offshore III KS 85.52 85.52 80 80 Norway
Bourbon Offshore Interoil Shipping-navegacao Lda 55 55 55 55 Portugal (Madeira)
Bourbon Offshore Norway 100 100 100 100 Norway
Bourbon Offshore Surf 100 100 100 100 France
Bourbon Offshore Triangle 70 – 70 – Egypt
Bourbon Supply Investissements 100 100 100 100 France
Cador 100 100 100 100 France
Challenge Hypermarket 50 50 50 50 Mauritius
Chambon Offshore International 100 100 100 100 France
Cogerem EIG 100 100 99.98 99.98 France
Compagnie Financière de Bourbon 51 51 51 51 France (Reunion)
Deepwaters Marine Eurofinance 100 100 100 100 United States

90 l BOURBON 2006 Financial report
Consolidated financial statements
% of control of capital % of capital interest held directly or held directly or
indirectly indirectly Country
2006 2005 2006 2005
Diamant Express – 97.93 – 97.93 France
Domaines de la Convenance 99.99 99.99 99.99 99.99 France (Reunion)
DTI Océan Indien 100 100 100 100 Mauritius
Eidsurf – 51 – 51 Norway
Elbuque Shipping Lda 100 100 51 51 Portugal (Madeira)
Espace Bourbon Thang Long 65 65 65 65 Vietnam
Ex Commodo, SGPS Sociedade Unipessoal Lda 100 100 100 100 Portugal (Madeira)
Financière Bourbon 100 100 100 100 France
Fipargest 100 100 100 100 France (Reunion)
Flash Light - Exploracao de barcos Lda 100 100 51 51 Portugal (Madeira)
Fructidor 100 100 100 100 France
Gestion SB EIG 92.86 92.86 92.86 92.86 France (Reunion)
EIG Abeille Bourbon 99 99 99 99 France
EIG Abeille Liberté 99 99 99 99 France
EIG Abeille Nantes Saint-Nazaire 2004 100 100 100 100 France
EIG Abeilles Le Havre 2003 100 100 100 100 France
EIG AHTS 256 (Luzolo) 100 100 100 100 France
EIG AHTS 279 (Bourbon Aladin) 100 100 100 100 France
EIG AHTS 280 (Bourbon Apsara) 100 100 100 100 France
EIG AHTS 281 (Bourbon Alexandre) 100 100 100 100 France
EIG AHTS 610 Bourbon Sagitta 100 – 100 – France
EIG AHTS Argonaute 2004 100 100 100 100 France
EIG FSIV 252 Kemba 100 100 100 100 France
EIG FSIV 253 Surf Express 100 100 100 100 France
EIG FSIV 254 Bourbon Express 100 100 100 100 France
EIG FSIV 255 Bourbon Oceane 100 100 100 100 France
EIG N’DUVA 100 100 100 100 France
EIG PSV 114 (Bourbon Helios) 100 100 100 100 France
EIG PSV 115 (Bourbon Hermes) 100 100 100 100 France
EIG PSV 116 (Bourbon Hera) 100 100 100 100 France
EIG PSV Antenor 2004 100 100 100 100 France
EIG PSV Asterie 2004 100 100 100 100 France
EIG Remorqueurs Offshore 2003 (Nemed) 100 100 100 100 France
EIG Surfer 2003 100 100 100 100 France
EIG Surfer 2004 100 100 100 100 France
EIG Surfer 2005 100 100 100 100 France
EIG Surfer 2005 Bis 100 100 100 100 France
EIG Surfer 2006 100 – 100 – France
EIG Surfer 2006 Bis 100 – 100 – France
EIG VS 4501 (Athena) 100 100 100 100 France
Grena Navegacao Lda 100 100 100 100 Portugal (Madeira)
H.S.O 100 100 100 100 France
Handy Bulk AG 100 100 100 100 Switzerland

BOURBON 2006 Financial report I 91
Consolidated financial statements
% of control of capital % of capital interest held directly or held directly or
indirectly indirectly Country
2006 2005 2006 2005Handy Bulk AG 100 100 100 100 Switzerland
Handy Shipping AG 99.95 99.95 99.95 99.95 Switzerland
Ivoirienne de remorquage et de sauvetage 50.99 50.99 50.99 50.99 Ivory Coast
Jade Navegacao Lda 100 100 100 100 Portugal (Madeira)
La Petrussienne 50.8 50.8 25.9 25.9 Ivory Coast
Lastro Companhia Internacional de Navegacao Lda 100 100 100 100 Portugal (Madeira)
Latin quarter Servicos Maritimos Internacionais Lda 100 100 51 51 Portugal (Madeira)
Les Abeilles 100 100 100 100 France
Les Abeilles Bordeaux 99.84 99.84 99.84 99.84 France
Les Abeilles Boulogne 100 100 100 100 France
Les Abeilles Brest 100 100 100 100 France
Les Abeilles Cameroun 98 98 98 98 Cameroon
Les Abeilles Côte d’Ivoire 99.6 99.6 99.6 99.6 Ivory Coast
Les Abeilles Dunkerque 100 100 100 100 France
Les Abeilles International 100 100 100 100 France
Les Abeilles La Réunion 95.41 95.41 95.41 95.41 France (Reunion)
Les Abeilles La Rochelle 100 100 100 100 France
Les Abeilles Le Havre 99.88 99.88 99.88 99.88 France
Les Abeilles Marseille-Fos (formerly Société de remorquage portuaire et d’assistance en méditerranée) 100 100 100 100 France
Les Abeilles Saint-Nazaire 100 100 100 100 France
Les Abeilles Tanger Med 99.97 – 99.97 – Morocco
Les Villas du Lagon 100 100 100 100 France (Reunion)
Mahe Cruise Ltd – 79.99 – 79.99 Seychelles
Mastshipping Shipping Lda 100 100 51 51 Portugal (Madeira)
Motel Les Brisants 50 50 50 50 France (Reunion)
Navegaceano Shipping Lda 100 100 51 51 Portugal (Madeira)
O.D.B. 100 100 100 100 France
Offshore Structured Asset Finance 100 100 100 100 United States
Onix Investimentos e Servicos Lda 100 100 100 100 Portugal (Madeira)
Opale Shipping – 100 – 100 France (Guadeloupe)
Paris Shipping & Chartering 100 100 100 100 France
Placements Provence Languedoc 100 100 100 100 France
Recif SAS 99.12 99.12 98.45 98.45 France (Reunion)
Sagrim 74.97 74.97 74.97 74.97 Madagascar
SCI Claire Fontaine 100 100 100 100 France (Reunion)
Sehb Le Récif 99.79 99.79 98.75 98.75 France (Reunion)
Sesac 100 100 100 100 France
Setaf 100 100 100 100 France
Setaf Saget 100 100 100 100 France
Setapar 100 100 100 100 France
Sinvrac 100 100 100 100 France
Société Mahoraise de remorquage de sauvetage et de lamanage 100 100 100 100 Mayotte

92 l BOURBON 2006 Financial report
Consolidated financial statements
% of control of capital % of capital interest held directly or held directly or
indirectly indirectly Country
2006 2005 2006 2005
Société nouvelle Arpec 100 100 100 100 France
Somarsal Marine Service (SMS) 100 100 100 100 France (Mayotte)
Sonasurf Internacional Shipping Lda 51 51 51 51 Portugal (Madeira)
Sonasurf Jersey 100 100 51 51 Jersey
Sopade (Sté participation développement SAS) 100 100 100 100 France (Reunion)
Sucrerie de Bourbon Gia Lai 51 51 51 51 Vietnam
Sucrerie de Bourbon Madagascar 100 100 100 100 Madagascar
Sucrerie de Bourbon Tay Ninh 100 100 100 100 Vietnam
Surf Viking AS 100 – 100 – Norway
Tribor 100 100 100 100 France
Union des remorqueurs de Dakar 99.95 99.95 99.95 99.95 Senegal
5.7.2 List of proportionately consolidated companies
% of control of capital % of capital interest held directly or held directly or
indirectly indirectly Country
2006 2005 2006 2005
Bourbon Gulf 49 – 49 – Qatar
Delba Maritima Navegacao 50 50 50 50 Brazil
Delba Operadora de Servicios Ltda 50 – 50 – Brazil
EPD Asia Group Ltd 50 – 50 – United States
EPD Yangzhou Ltd 50 – 50 – China
Naviera Bourbon Tamaulipas 49 – 49 – Mexico
Servicios y Apoyos 49 – 49 – Mexico
Sonasurf Angola 50 50 50 50 Angola
Toesa 50 – 50 – Uruguay

BOURBON 2006 Financial report I 93
Consolidated financial statements
5.7.3 List of companies consolidated using the equity method
% of control of capital % of capital interest held directly or held directly or
indirectly indirectly Country
2006 2005 2006 2005Rigdon Marine Corporation 40.26 40.26 40.26 40.26 United States
Rigdon Marine LLC 24.5 24.5 24.5 24.5 United States
Agence rialto 30 30 30 30 France (Reunion)
Austral d’Investissement 30 30 30 30 Mauritius
Bourbon Distribution Mayotte 30 30 21 21 France (Mayotte)
Carmart 30 30 30 30 Mauritius
Cie Mauricienne d’Hypermarché Ltd 30 30 23.98 23.98 Mauritius
Distri-Food 30 30 22.8 22.8 France (La Réunion)
Espace Bourbon An Lac 30 30 24 24 Vietnam
Espace Bourbon Dong Nai 30 30 19.5 19.5 Vietnam
Espace Bourbon Hai Fon 30 – 30 – Vietnam
Fim Colimo 30 30 30 30 France (Reunion)
Grains du Capricorne 30 30 30 30 France (Reunion)
Home City 30 30 30 30 France (Reunion)
Magma 30 30 21 21 France (Reunion)
Mayotte Distribution 30 30 20.98 20.98 France (Mayotte)
Ortem 30 30 23.98 23.98 Mauritius
S2FOI 30 30 22.8 22.8 France (Reunion)
Salaison de Bourbon 30 30 26.78 26.78 France (Reunion)
Sapmer Distribution de marques 30 30 30 30 France (Reunion)
Saprim 30 30 29.76 29.76 France (Reunion)
SCI Armagnac 30 30 29.7 29.7 France (Reunion)
SCI Badamier 30 30 30 30 France (Reunion)
SCI des Centres commerciaux 30 30 30 30 France (Reunion)
SCI du Chaudron 30 30 30 30 France (Reunion)
SCI Jacaranda 30 30 30 30 France (Reunion)
SCI Kerveguen 30 30 29.7 29.7 France (Reunion)
SCI Ligne du Paradis 30 30 29.7 29.7 France (Reunion)
SCI Omega 30 30 30.07 30.07 France (Mayotte)
SCI Timur 30 30 30 30 France (Reunion)
SCI Toscane 30 30 21.01 21.01 France (Reunion)
SCI Vava Industrie 30 30 29.7 29.7 France (Reunion)
SCIM3 30 30 21 21 France (Reunion)
Score Digue 30 30 29.94 29.94 Madagascar
Score Madagascar 30 30 29.39 29.39 Madagascar
Selata(n) Indah 30 30 30 30 France (Mayotte)
SEMS SA 30 30 29.76 29.76 France (Reunion)
Sicre 30 30 30 30 France (Reunion)
SNIE Distribution 30 30 21 21 France (Mayotte)
Société de restauration rapide de la Réunion – S3R 30 30 30 30 France (Reunion)Société des Hypermarchés bénédictins 30 30 30 30 France (Reunion)

94 l BOURBON 2006 Financial report
Consolidated financial statements
% of control of capital % of capital interest held directly or held directly or
indirectly indirectly Country
2006 2005 2006 2005
Sodexmar 30 30 30 30 France (Reunion)
Sodimar 30 30 30 30 France (Reunion)
Sofimex 30 30 30 30 France
Sogim 30 30 30 30 France (Reunion)
Sogramo 30 30 30 30 France (Reunion)
Somags 30 30 30 30 Mauritius
Sorecom 30 30 30 30 France (Reunion)
Soretravi 30 30 30 30 France (Reunion)
Sormac 30 30 30 30 France (Reunion)
Spar Mauritius 30 30 30 30 Mauritius
SSTIC – Prestations informatiques 30 30 30 30 France (Reunion)
Transit SNIE 30 30 20.89 20.89 France (Mayotte)
Usine de Traitement de Viande – UTV 30 30 21 21 France (Mayotte)
UTV Investissement SNC 30 30 21 21 France (Mayotte)
Vindémia 30 30 30 30 France (Reunion)
Wheathervane Ltd 30 30 30 30 Mauritius
Zoom Madagascar – 30 – 29.39 Madagascar

BOURBON 2006 Financial report I 95
Consolidated financial statements
Statutory Auditors’ Report on the consolidated financialstatements for the year ended December 31, 2006
This is a free translation into English of the statutory auditors’ report issued in French and is provided solely for the convenienceof English speaking users. The statutory auditors’ report includes information specifically required by French law in such reports,whether modified or not. This information is presented below the opinion on the consolidated financial statements and includesan explanatory paragraph discussing the auditors’ assessments of certain significant accounting and auditing matters. Theseassessments were considered for the purpose of issuing an audit opinion on the consolidated financial statements taken as awhole and not to provide separate assurance on individual account captions or on information taken outside of the consolidatedfinancial statements.This report should be read in conjunction with, and construed in accordance with, French law and professional auditingstandards applicable in France
To the Stockholders,
Following our appointment as auditors by your stockholders’ meeting, we have audited the accompanying consolidated financialstatements of BOURBON for the year ended December 31, 2006.
The consolidated financial statements have been approved by the Board of Directors. Our role is to express an opinion on thesefinancial statements based on our audit.
I. Opinion on the consolidated financial statements
We conducted our audit in accordance with professional standards applicable in France. Those standards require that we plan andperform the audit to obtain reasonable assurance about whether the consolidated financial statements are free of materialmisstatement. An audit includes examining, on a test basis, evidence supporting the amounts and disclosures in the financialstatements. An audit also includes assessing the accounting principles used and the significant estimates made by themanagement, as well as evaluating the overall financial statements presentation. We believe that our audit provides a reasonablebasis for our opinion.
In our opinion, the consolidated financial statements give a true and fair view of the assets and liabilities and of the financialposition of the group as at December 31, 2006 and of the results of its operations for the year then ended in accordance withIFRSs as adopted by the European Union.
II. Justification for our assessments
In accordance with the requirements of article L 823-9 of the French Commercial Law (Code de commerce) relating to thejustification of our assessments, we bring to your attention the following matters:
Note 1.5.6 sets forth the accounting methods for the recognition and amortization of the vessels.
In our assessment of the accounting rules and principles used by your company, we have verified the appropriate nature of theaccounting methods described above and the information provided in the notes to the financial statements.
These assessments were made in the context of our audit of the consolidated financial statements taken as a whole, and thereforecontributed to the opinion we formed which is expressed in the first part of this report.
III. Specific verification
We have also verified the information given in the Group’s management report in accordance with professional standardsapplicable in France. We have no matters to report as to its fair presentation and its consistency with the consolidated financialstatements.
Lyons and Marseilles, April 24, 2007
The Statutory Auditors
EurAAudit C.R.C. Deloitte & AssociésCabinet Rousseau Consultants
Jean-Marc ROUSSEAU Vincent GROS

96 l BOURBON 2006 Financial report
Consolidated financial statements

BOURBON 2006 Financial report I 97
Report of the Chairmanof the Board of Directors
Contents98 I Report of the Chairman of the Board of Directors on the modus operandi
of the Board of Directors and on internal control procedures
104 I Statutory Auditors’ report on the report of the Chairman of the Board of Directors

98 l BOURBON 2006 Financial report
Report of the Chairman of the Board of Directors
To our Stockholders,
Pursuant to the provisions of paragraph 6 of article L 225-37of the French Commercial Law ”Code de Commerce“, I herebysubmit my report on the following:• the conditions for the preparation and organization of thework of your Board of Directors for the year ended December31, 2006;• the internal control procedures established by the company;• and the scope of the powers of the Chairman and ChiefExecutive Officer
1. CONDITIONS FOR THE PREPARATIONAND ORGANIZATION OF THE WORK OFTHE BOARD OF DIRECTORS
1.1 Composition of the Board of Directors
The Board of Directors is currently composed of ninemembers:• Mr. Jacques d’Armand de Chateauvieux: Chairman of the
Board and Chief Executive Officer,• Mr. Christian Munier: Member of the Board and Executive
Vice President until June 30, 2006,• Mr. Christian d’Armand de Chateauvieux,• Mr. Henri d’Armand de Chateauvieux,• Mr. Guy Dupont,• Mr. Marc Francken,• Ms. Victoire de Margerie,• Ms. Dominique Sénéquier,• Mr. Roger Wright.
Most of the members of the Board of Directors are corporateleaders in the fields of industry, banking, trade and shipping.
Each Director holds at least 300 shares of BOURBON stock, asrequired under the bylaws.
In addition, given the terms for obtaining tax approval for theCBo Territoria deal, the BOURBON Directors and the Jaccarcompany have accepted a three-year restriction on thetransferability of their BOURBON and CBo Teritoria shares heldas of December 16, 2004.
Evaluating the independence of the Directors
BOURBON is in compliance with the corporate governancesystem in effect and takes into account the recommendationsof the Viénot and Bouton reports. In particular, the Board ofDirectors includes a large percentage of independent Directors.
The Board of Directors, in its March 19, 2007 meeting,examined the qualifications of the BOURBON Directors interms of their independence under the definition and thecriteria selected by the October 2003 AFEP-MEDEF report onthe corporate governance of listed companies.
The independence criterion adopted being the lack of anysignificant relationships with the company, its group or itsmanagement that could compromise the Director’s freedom ofjudgment, the Board of Directors has concluded that:• Ms. Victoire de Margerie,• Mr. Guy Dupont,• Mr. Marc Francken,• Mr. Roger Wrightqualify as independent Directors.
Situation regarding the corporate officers
To the company’s knowledge, in the past five years, nocorporate officer:– has been found guilty of fraud;– has been involved in a bankruptcy, receivership or
liquidation;– has been found guilty of any offense or been subject to any
official public sanction issued by any statutory or regulatoryauthority;
– has ever been prevented by a court of law from acting as amember of any administrative, management or supervisorybody of any issuer, or from participating in themanagement or conduct of the business of any issuer.
In addition, to the company’s knowledge, no corporate officerowns any equity capital or voting rights above 5% aside fromJacques d’Armand de Chateauvieux, who owns more than20% of the equity in the company through the Jaccarcompany.
Report of the Chairman of the Board of Directors on themodus operandi of the Board of Directors and on internalcontrol procedures

BOURBON 2006 Financial report I 99
Report of the Chairman of the Board of Directors
Furthermore, concerning potential conflicts of interest, nocorporate officer has ever been subject to any arrangement oragreement with the principal stockholders, customers,suppliers or anyone else under which he would have beenselected as a member of the Board or as a member of themanagement, independently of any related-party agreements.
To date there are no service contracts connecting any Directoror member of the management to the company or to any ofits subsidiaries that provide for benefits to be granted at theend of such a contract.
1.2 Powers of the Board of Directors
1.2.1 Principles
The Board of Directors sets the guidelines for the company’sbusiness and ensures that they are implemented inaccordance with the bylaws and with existing laws andregulations.
The Board of Directors carries out any controls or auditsdeemed appropriate by it.
Directors must each receive the information necessary toperform their mandate and may obtain from the managementany and all documents deemed necessary by them.
1.2.2 Organization of the work of the Board of Directors
The Chairman organizes and manages the work of the Boardof Directors, reports on it to the stockholders’ meeting, andcarries out its decisions. He sees to it that the company’sgoverning bodies are able to operate smoothly and ensuresthat the Directors are able to perform their mission.
The Chairman of the Board of Directors and Chief Executive isassisted at December 31, 2006 by two Executive VicePresidents, Mr. Christian Lefèvre and Mr. Laurent Renard, whoare not Directors.
The group’s Executive Committee, which consists ofBOURBON’s Chief Executive Officer and its Executive VicePresidents, meets regularly and in particular before everymeeting of the Board of Directors. This committee prepares thedecisions of the Board of Directors concerning strategicguidelines, in particular investments and the annual operatingbudget.
1.3 Meetings of the Board of Directors
The Board of Directors meets as often as warranted by theinterests of the company. The minutes of the meetings of theBoard of Directors are drafted after every meeting and sentwithout delay to all the Directors. The minutes are generallysubject to their express approval at the following Boardmeeting.
The statutory auditors are invited to the meetings that close theaccounts.
During the year ended, four meetings of the Board of Directorswere held – on March 20, September 11, October 16 andDecember 4, 2006, at 33, rue du Louvre in Paris.
The attendance rate for all the Directors was 86.1%.
1.4 Evaluating the work of the Board of Directors
In accordance with a decision made at its March 20, 2006meeting, during the second half of 2006, the Board ofDirectors conducted a formal self-evaluation of its operations,based on a questionnaire approved by the Board.
The self-evaluation questionnaire dealt with three majorthemes:• the general organization of the Board meetings,• the effectiveness of the Board meetings,• the Directors (each Director by him or herself/self-evaluation,administration, skills and training).
As a follow-up to the responses and observations by themembers of the Board of Directors, some decisions wereadopted to improve the operation of the Board even further.
The Board of Directors is soon planning to draft its own internalregulations.
1.5 The specialized committees of the Board ofDirectors
The Board of Directors has two specialized committees.
1.5.1 The Audit Committee
The purpose of the Audit Committee is to assist the Board ofDirectors in order to ensure the quality of internal control and

100 l BOURBON 2006 Financial report
Report of the Chairman of the Board of Directors
the reliability of the information provided to stockholders andto the financial markets.
As of now, the committee is composed of three people:• Ms. Victoire de Margerie, Chairperson,• Ms. Dominique Sénéquier,• Mr. Roger Wright.
The Audit Committee met three times in 2006. The attendancerate at the meetings was 78%.
The committee dealt mainly with the following issues, amongothers:• review of the financial statements,• review of cartography of risks,• management of foreign exchange risk.
1.5.2 The Compensation Committee
The duties of this committee are as follows:• to make any recommendations to the Board of Directors
involving the Chairman’s compensation and pension, as wellas those of the other corporate officers, as the case may be;
• to examine proposals involving the introduction of stockoptions or stock purchase plans authorized by the combinedannual and special stockholders’ meeting;
• to accomplish any specific missions entrusted to it by theBoard of Directors.
As of now, the Compensation Committee is composed of threepeople:• Mr. Marc Francken, Chairman,• Mr. Henri d’Armand de Chateauvieux,• Ms. Dominique Sénéquier.
The committee met once in 2006 with a 100% attendancerate.
Of all the points subject to deliberation by the Board ofDirectors, the Board approved the proposals made during theyear by the Compensation Committee, in particular thoserelating to the method and amount of compensation for theExecutive Vice Presidents.
2. INTERNAL CONTROL PROCEDURES
2.1 Objectives in terms of internal control
In accordance with the results of the work of the groupestablished under the auspices of the AMF (Autorité desMarchés Financiers), the internal control system adopted byBOURBON is aimed at ensuring the following:• compliance with laws and regulations;• application of the instructions and guidelines set by
management;• the proper operation of internal processes, particularly as they
contribute to safeguarding its assets;• the reliability of financial data;and, in general, contributes to the control of its activities,effectiveness of its business operations and the efficient use ofits resources.
Improving and maintaining a satisfactory level of internalcontrol are a common concern shared by all line and staffmanagers; implementing an effective internal control system isan integral part of management’s responsibilities.
By helping to prevent and control the risks of failing to achievethe objectives set by BOURBON, the internal control systemplays a key role in the conduct and management of the group’sdifferent activities.
In this way, the internal control system adopted by BOURBONinvolves the following:• a structure that includes a clear definition of responsibilities,
with adequate resources and skills, backed by procedures,information systems and appropriate tools;
• dissemination in-house of relevant, reliable information, theknowledge of which helps all employees to perform theirduties;
• a system aimed at identifying and analyzing the principalidentifiable risks as regards the company’s objectives andone that provides procedures to be used to manage suchrisks;
• control activities designed to reduce the risks likely to affectthe achievement of the objectives;
• oversight of the internal control system.
However, no matter how well designed and applied it is,internal control, like any control system, cannot provide anabsolute guarantee that the risks targeted by it will be totallyeliminated.

BOURBON 2006 Financial report I 101
Report of the Chairman of the Board of Directors
2.2 Control environment
The control environment is an important factor in the internalcontrol process in that it determines the level of staffawareness of the need for control. Internal control is a matterthat affects everyone at BOURBON, from top management ondown.
2.2.1 General organization of internal control
BOURBON’s operational control is decentralized, which impliesstrong central control even though the managers in the fieldhave the primary responsibility for internal control.
The BOURBON Executive Committee identifies and handlesthe major issues and validates the operating and financialobjectives. It sees to it that the strategy is carried out andreviews the options for successfully implementing it, especiallyin the areas of safety, innovation, human resources and costcontrol. In carrying out its oversight responsibilities over theinternal control system, the Executive Committee is backed bythe following departments:• the corporate accounting department,• the corporate treasury and management control
department,• the corporate legal department.
In addition, the Management Committee meets periodicallyfor quarterly performance reviews involving a follow-up ofoperating activities, progress reports on projects, as well asresults and prospects for the future. Aside from the membersof the Executive Committee, this committee includesdepartment heads, managers of the main operatingsubsidiaries and Corporate management. The meetings of theManagement committee also enable the company to assessthe progress of BOURBON’s inter-company projects; they alsoprovide an opportunity to the different business lines toexchange information and feedback.
Lastly, in each Division, in addition to involvement bymanagement, the administrative and financial managers are anintegral part of the internal control process.
2.2.2 Internal control procedures
General procedures
In its different businesses, BOURBON ensures that at all timesits operations are conducted without danger to the health and
safety of its employees and sub-contractors. At the same time,BOURBON aims to satisfy its customers, its partners and itsemployees. For that reason, a “Quality, Health, Safety andEnvironment” charter was established and adopted on thevessels, at the bases and at the administrative offices. Followingthe fundamental principles set forth in the charter, eachDivision is in charge of the proper implementation andmonitoring of QHSE (Quality, Health, Safety and Environment)performances on its vessels and at its sites.
In connection with the quality and/or safety certification (ISOstandards and ISM code) of oilrig supply/assistance operationsand port towage businesses, manuals of procedures andinstructions are in effect in different areas: operations, fitting,commercial, procurement, disputes, technical, emergencies,safety, etc.
These manuals form the basis for the operational control of thebusinesses. Annual in-house quality/safety audits areconducted regularly under the authority of the quality/safetyassurance managers to make sure that they are properlyapplied.
External audits by the competent authorities are alsoconducted in accordance with an annual or long-term auditingplan. Specific procedures are also in effect to evaluate, on anon-going basis, the proper operation of the system put in place.
Concerning the Bulk Division, charter operations andoperations involving the bulk carriers are conducted accordingto precise internal operating rules and audited regularly. Everycharter agreement is monitored by a structured “operations”department, which checks to make sure the agreement isproperly implemented.
In addition, a manual of general policies and procedures isgradually developed and distributed. It deals mainly with thefinancial, accounting and legal factors involved in each process.In addition to formally stating and harmonizing the policies andprocedures, the purpose of the manual is to define theprinciples and rules to be applied by all BOURBON companies.It describes the roles and responsibilities of the different partiesinvolved in each process, the information flows, the operatingprocedures as well as the audits to be conducted and thelevels of approval required.
Among the principal topics addressed, investments as well asdealing with customer bids are key factors given BOURBON’sbusiness activities.

102 l BOURBON 2006 Financial report
Report of the Chairman of the Board of Directors
Internal control procedures related to the drafting andtreatment of accounting and financial information
The reliability of the accounting and financial informationpublished is backed by a set of systems, rules, procedures andaudits as well as by documentation and the gradualformalization of procedures.
This mainly involves the following:• budgets designed by the different group entities and the
monitoring of their implementation at the operational leveland by the group’s management control unit;
• procedures for consolidating the financial statements inaccordance with the rules set and approved by themanagement. The semi-annual and annual consolidatedfinancial statements are presented to the Audit Committeeprior to approval by the Board of Directors;
• procedures for drafting the annual report to ensureaccuracy and consistency and compliance with applicablelaws and regulations and the quality of the financialinformation.
2.3 Managing internal control
The internal control systems themselves are subject to controls,both continuously by the management and through spotevaluations by bodies with neither direct authority over nordirect responsibility for the operations.
2.3.1 The Audit Committee
The responsibilities of and the work carried out by the AuditCommittee are described in subsection 1.5.1 of this report.
2.3.2 The Steering Internal Control Committee
The purpose of this committee is to manage the quality ofinternal control within BOURBON and to supervise internalauditing activities, i.e.: approving the annual auditing plan,reviewing the reports issued and following up on therecommendations as implemented, reviewing and evaluatingthe internal control procedures, risk management system andinternal auditing operations.
Composed of the two Executive Vice Presidents and themanagers from the BOURBON operating Divisions, theSteering Internal Control Committee met twice in 2006.
2.3.3 Internal Audit Department
The BOURBON internal audit department was established in2002. It is currently staffed by four auditors.
The responsibility of the internal audit department is toevaluate on an on-going basis the proper operation andefficiency of the BOURBON internal control system in order toobtain reasonable assurance regarding the control of risks. Thescope of the department’s authority extends to all BOURBONsubsidiaries and businesses. The internal audit departmentcarries out its duties totally independently from the otheraudited units, and in accordance with the IIA (Institute ofInternal Auditors) code of ethics.
An internal audit charter was established to define and explainwidely within BOURBON what an internal audit is, i.e., themission, organization and place in the hierarchy, powers andresponsibilities, rules of conduct, skills and methodology.
Internal audit engagements are carried out in accordance withan annual plan approved by the Steering Internal ControlCommittee. The annual auditing plan is prepared on the basisof a prior analysis aimed at pinpointing the group’s internal andexternal environment in order to evaluate the risks, activities,processes and critical functions. This auditing plan takes intoaccount BOURBON’s growth, in particular globally.
The internal audit department has a methodology that allows itto reach conclusions resulting in recommendations that areadopted in cooperation with the person audited, andimplementation is followed up after the audit engagement.
The internal audit department investigates regularly to makesure the foregoing general policies and procedures are applied.
2.3.4 The Statutory Auditors
On December 31 of every year, the BOURBON financialstatements and those of its subsidiaries are examined by thestatutory auditors.
Their work provides the group with a reasonable assurance asto the reliability and accuracy of the accounting and financialinformation produced. They examine the internal audit toidentify and evaluate the risk of material misstatements in theaccounts and to design and implement their auditingprocedures.

BOURBON 2006 Financial report I 103
Report of the Chairman of the Board of Directors
2.4 Cartography of risks and risk management
BOURBON’s objective is to make certain that the entire internalcontrol system can, as far as possible, prevent any risks towhich it is exposed. In this spirit, in 2005, under the auspicesof the Steering Internal Audit Committee, steps were taken todesign a “cartography of risks”.
A dedicated team was established for each division: Offshore,Towage & Salvage and Bulk, as well as at a functional level atcorporate headquarters. An inventory of risks was prepared asthoroughly as possible, along with the associated controls, andthen categorized by type. On a case-by-case basis, probabilitiesof occurrence and of potential impact were evaluated. Thus therisks inventoried were ranked based on their possiblefrequency (from frequent to improbable) and their impact(negligible to catastrophic, which would require an action planto be implemented immediately by a crisis unit).
The management of each Division is responsible for forwardingthe cartography to the different units, as well as action plans,control and follow-up procedures.
The cartography of risks was updated in 2006 and waspresented to the Audit Committee as well as to the Board ofDirectors at its December 4, 2006 meeting.
On the recommendation of the Audit Committee, thecartography of risks will be updated regularly and discussed inthe Executive Committee and then presented to the AuditCommittee twice a year and to the Board of Directors annually.
The type and ranking of these risks are considered strategic andconfidential. Nevertheless, the principal risks and the methodsfor managing them are discussed under “Risk Management” inthe Management Report.
2.5 Conclusion
These different actions are meant to establish an increasinglyhigh degree of command over internal control in theBOURBON entities.
The control environment and the control system describedabove are not static and BOURBON’s management is attentiveto changes in this area and seeks regular improvement in itsinternal control system.
3. POWERS OF THE CHIEF EXECUTIVEOFFICER
No limitation has been placed on the powers of the Chairmanand Chief Executive Officer. The Executive Vice Presidents havethe same powers as the Chief Executive Officer, pursuant to thebylaws and the decision to appoint them.
Chairman of Board of Directors

104 l BOURBON 2006 Financial report
Report of the Chairman of the Board of Directors
This is a free translation of the original French text for information purpose only.
To the Stockholders,
As statutory auditors of BOURBON and pursuant to the provisions of article L 225-235 of the French Commercial Code, wepresent our report on the report prepared by the Chairman of your company as required by article L 225-37 of the FrenchCommercial Code for the year ended December 31, 2006.
It is the responsibility of the Chairman to report on the conditions for the preparation and organization of the Board’s work andthe internal control procedures established within the Company.
Our duty is to inform you of our observations on the information provided in the Chairman’s report on the internal controlprocedures for the preparation and treatment of the accounting and financial information.
We have conducted our work in accordance with generally accepted practices in France. Those practices require us to exercisedue care in assessing the accuracy of the information provided in the Chairman’s report on the internal control procedures forthe preparation and treatment of accounting and financial information. This work includes:– a review of the objectives and the general organization of internal control, as well as the internal control procedures for the
preparation and treatment of the accounting and financial information presented in the Chairman’s report, and– a review of the work underlying the information in the report.
Based on our examination, we have no comment on the information given concerning the company’s internal control proceduresfor the preparation and treatment of the accounting and financial information contained in the report by the Chairman of theBoard prepared pursuant to the provisions of the last paragraph of article L 225-37 of the French Commercial Code.
Lyons and Marseilles, April 24, 2007
The Statutory Auditors
EurAAudit C.R.C. Deloitte & AssociésCabinet Rousseau Consultants
Jean-Marc ROUSSEAU Vincent GROS
Statutory Auditors’ report prepared pursuant to articleL 225-235 of the French Commercial Code on the reportof the Chairman of the Board of Directors of theBOURBON Company concerning the internal controlprocedures for the preparation and treatment of theaccounting and financial information

BOURBON 2006 Financial Report I 105
Other
Legal and financialinformation
Contents106 I General information on BOURBON SA and its capital
116 I Trademarks, licenses, patents, real properties, plant and equipment
117 I Annual information document

1. INFORMATION ABOUT THE COMPANY
Corporate name: BOURBON.Corporate office: 33 rue du Louvre – 75002 Paris.Date of incorporation of the company: December 2, 1948.Nationality: French.Legal form: Incorporated company (“Société anonyme”) with aBoard of Directors, governed by the law of July 24, 1966concerning commercial companies.Term: the company was incorporated for 99 years and expireson December 2, 2066 except if dissolved early or extended(harmonization of the bylaws pursuant to the law of July 24,1966, special stockholders’ meeting of January 19, 1966).Trade Register: Paris 310 879 499.Location where the corporate documents and records may beconsulted: the bylaws, financial statements and reports andminutes of stockholders’ meetings may be consulted at thecorporate office at the address indicated above.
1.1 Corporate purpose (article 2 of the bylaws)
The purpose of the company is:• the creation, ownership, acquisition, sale, lease, development,operation, management, rental, control, organization andfinancing of all industrial, commercial, agricultural, real estate orother types of property, companies or businesses;• the acquisition of equity interests and the management ofinterests related to any and all marine business activities, eitherdirectly or indirectly;• the manufacture, packaging, import, export, commission,representation, transit, deposit and shipping of any and allproducts, merchandise, items and commodities of any kind ofany origin;• the acquisition, purchase, operation, sale or licensing of allpatents and manufacturing trademarks;• the acquisition of an interest through contribution, merger,participation, subscription of shares, units or bonds or in anyother manner, in all businesses or companies related directly tothe aim of the company and in general in all businesses,companies or work that may attract customers to its corporateactivity or stimulate operations in which they would have aninterest;• and generally all industrial, commercial, financial, agricultural,real estate and other types of property operations that may berelated directly to the aim of the company, the variouscomponents of which have been specified above.
Fiscal year: From January 1 to December 31 of each year.
1.2 Stockholders’ meetings (article 19 of the bylaws)
Stockholders’ meetings shall be called and shall deliberateunder the conditions set by law and regulations. They shall beheld in any location specified in the meeting notice.
Any stockholder, however many shares he or she owns, mayparticipate in the meetings in person or by proxy, provided theygive proof of identity and proof of ownership of registeredshares in the form of registration in the share register, or theymust file at the locations cited in the meeting notice acertificate from the authorized broker certifying that the sharesregistered in the account are not available for transfer until thedate of the meeting. These formalities must be completed nolater than five days before the date of the stockholders’meeting.
However, the Chairman of the Board of Directors shall alwayshave the option of accepting as a general rule proof ofregistered shares and of the filing of the aforementionedcertificates within a time period that differs from the periodstipulated above.
In the absence of the Chairman of the Board, unless otherwisespecified, the meeting shall be chaired by the Directorspecifically appointed by the Board. If no Director has beenappointed, the stockholders’ meeting shall elect a Chairman forthe meeting.
1.3 Ownership thresholds
The bylaws do not stipulate specific requirements forownership thresholds. Pursuant to article L 233-7, I -paragraphs 1 and 2 of the French Commercial Law “Code decommerce” (amended by Law 2005-842 of July 26, 2005),• when the stock of a Company with its corporate office in theFrench Republic is admitted for trading on a registered marketor on a financial instruments market admitting for trading stocksthat can be registered in an account with an authorizedintermediary under the conditions set forth by article L 211-4of the French Monetary and Financial Code (“Code monétaireet financier”), any individual or legal entity, acting alone or withothers, who owns a number of shares representing more thanone twentieth, one tenth, three twentieths, one fifth, onefourth, one third, half, two thirds, eighteen twentieths ornineteen twentieths of the capital and/or voting rights in theCompany, shall inform the Company of the total number ofshares or voting rights owned before a deadline set by theCouncil of State from the time the threshold is crossed;
General information on BOURBON SA and its capital
106 l BOURBON 2006 Financial report
Other legal and financial information
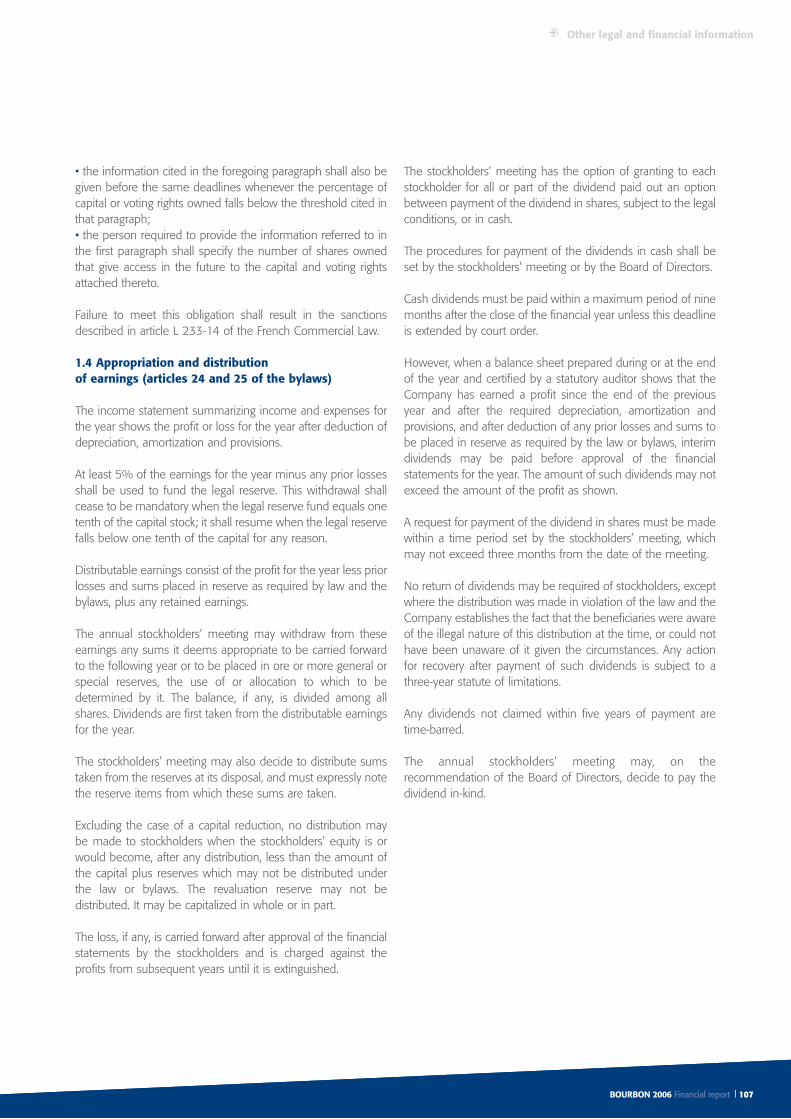
BOURBON Rapport financier 2006 I 107
• the information cited in the foregoing paragraph shall also begiven before the same deadlines whenever the percentage ofcapital or voting rights owned falls below the threshold cited inthat paragraph;• the person required to provide the information referred to inthe first paragraph shall specify the number of shares ownedthat give access in the future to the capital and voting rightsattached thereto.
Failure to meet this obligation shall result in the sanctionsdescribed in article L 233-14 of the French Commercial Law.
1.4 Appropriation and distributionof earnings (articles 24 and 25 of the bylaws)
The income statement summarizing income and expenses forthe year shows the profit or loss for the year after deduction ofdepreciation, amortization and provisions.
At least 5% of the earnings for the year minus any prior lossesshall be used to fund the legal reserve. This withdrawal shallcease to be mandatory when the legal reserve fund equals onetenth of the capital stock; it shall resume when the legal reservefalls below one tenth of the capital for any reason.
Distributable earnings consist of the profit for the year less priorlosses and sums placed in reserve as required by law and thebylaws, plus any retained earnings.
The annual stockholders’ meeting may withdraw from theseearnings any sums it deems appropriate to be carried forwardto the following year or to be placed in ore or more general orspecial reserves, the use of or allocation to which to bedetermined by it. The balance, if any, is divided among allshares. Dividends are first taken from the distributable earningsfor the year.
The stockholders’ meeting may also decide to distribute sumstaken from the reserves at its disposal, and must expressly notethe reserve items from which these sums are taken.
Excluding the case of a capital reduction, no distribution maybe made to stockholders when the stockholders’ equity is orwould become, after any distribution, less than the amount ofthe capital plus reserves which may not be distributed underthe law or bylaws. The revaluation reserve may not bedistributed. It may be capitalized in whole or in part.
The loss, if any, is carried forward after approval of the financialstatements by the stockholders and is charged against theprofits from subsequent years until it is extinguished.
The stockholders’ meeting has the option of granting to eachstockholder for all or part of the dividend paid out an optionbetween payment of the dividend in shares, subject to the legalconditions, or in cash.
The procedures for payment of the dividends in cash shall beset by the stockholders’ meeting or by the Board of Directors.
Cash dividends must be paid within a maximum period of ninemonths after the close of the financial year unless this deadlineis extended by court order.
However, when a balance sheet prepared during or at the endof the year and certified by a statutory auditor shows that theCompany has earned a profit since the end of the previousyear and after the required depreciation, amortization andprovisions, and after deduction of any prior losses and sums tobe placed in reserve as required by the law or bylaws, interimdividends may be paid before approval of the financialstatements for the year. The amount of such dividends may notexceed the amount of the profit as shown.
A request for payment of the dividend in shares must be madewithin a time period set by the stockholders’ meeting, whichmay not exceed three months from the date of the meeting.
No return of dividends may be required of stockholders, exceptwhere the distribution was made in violation of the law and theCompany establishes the fact that the beneficiaries were awareof the illegal nature of this distribution at the time, or could nothave been unaware of it given the circumstances. Any actionfor recovery after payment of such dividends is subject to athree-year statute of limitations.
Any dividends not claimed within five years of payment aretime-barred.
The annual stockholders’ meeting may, on therecommendation of the Board of Directors, decide to pay thedividend in-kind.
BOURBON 2006 Financial report I 107
Other legal and financial information

2. INFORMATION ABOUT THE CAPITAL STOCK
The Company was listed for trading on the second marché ofthe Paris Stock Exchange on October 20, 1998.
Since February 2, 2004, BOURBON has been classified byEuronext in the “Oil Services” sector.
The BOURBON share was admitted to the SBF 120 index onSeptember 1, 2005. It was admitted for trading on EuronextParis, as from January 12, 2006, in capitalization compartmentA of Eurolist Paris.
As from March 28, 2006, the BOURBON share was includedin the Deferred Settlement Service (SRD).
2.1 Capital stock
After the Board of Directors’ meeting of March 19, 2007, theBOURBON capital amounts to 31,884,382. It is divided into50,195,528 shares, fully paid-up.
As of December 31, 2006 (and after the June 1, 2006 two-for-one split), i.e.• the total number of shares comprising the capital was
50,195,528;• the number of voting rights was 50,151,592.
These figures are adjusted as necessary every monthin accordance with the “Transparency Directive.” Thisinformation is available on the Company’s websitewww.bourbon-online.com under the heading “Finance” –“Regulated information”.
During 2006, more than 32.9 million BOURBON shares weretraded (twice as many as in 2005).
The Company’s market capitalization amounted to€ 2,090 million at December 31, 2006, for a latest price listedof € 41.63.
According to the criteria “number of shares traded”, “capital”,“rotation rate” and “market capitalization”, in 2006, dependingon the month, BOURBON ranked between number 60 andnumber 85 among the companies listed on Eurolist Paris.
As of December 31, 2006, there were 851 employeestockholders holding stock through the FCPE “BourbonExpansion” for 474,107 shares, or 0.94% of the capital.
In the special stockholders’ meeting of August 23, 2004,double voting rights were eliminated. There is also no limitationon the voting right.
2.2 Option plans for new stock
• The combined annual and special stockholders’meeting of May 25, 2000 granted authority to the Board ofDirectors to grant options giving rights either to subscribe tonew shares issued by the company in a capital increase on oneor more occasions for a period of five years, or to purchaseexisting shares in the company from the buybacks made by thecompany, subject to legal requirements. This authorizationexpired on May 24, 2005. It contained the following terms forapplication:
The beneficiaries of the operation may be some or all theemployees or some categories of employees, or the corporateofficers as defined by law, both of the Company and ofaffiliated French or foreign companies, as this term is definedby article 208-4 of the law of July 24, 1966 concerningcommercial companies. The total number of options that maybe granted by the Board of Directors under this authority maynot give rights to subscribe to or to purchase new oroutstanding shares equal to more than 5% of the capital onthe implementation date of this authority, subject to all legallimits on the allotment. The authority granted for stock optionsincludes an express waiver by stockholders of their preemptivesubscription rights.
The purchase price of new and/or existing shares for thebeneficiaries shall be set on the date the options are grantedby the Board of Directors and may be neither less than 95%of the average opening price of the shares on the SecondMarché of the Paris Stock Exchange during the twenty tradingdays preceding the date the options on new and/oroutstanding shares are granted, nor less than 95% of theaverage purchase price of the shares held by the Companyunder articles 217-1 and/or 217-2 of the law of July 24, 1966.
No stock purchase or subscription option may be granted lessthan twenty trading days after detachment of a coupon givingthe right to a dividend or a capital increase.
The stockholders’ meeting grants full powers to the Board ofDirectors to set the other terms and conditions and proceduresfor awarding the options and exercising them including thepower to:• set the conditions under which the options are to be grantedand to define the list or categories of beneficiaries;• set the seniority requirements to be met by the beneficiaries;• decide on the conditions under which the price and thenumber of shares may be adjusted, particularly in the casesdescribed in articles 174-8 to 174-16 of the decree ofMarch 23, 1967;• set the exercise period(s) of the options thus granted,provided that the term of the options does not exceed a periodof six years from the date they are granted;
108 l BOURBON 2006 Financial report
Other legal and financial information

• provide for the option of temporarily suspending the exerciseof options for a maximum period of three months in the eventof financial transactions involving the exercise of a rightattached to the shares.
Plan No. 1
Using the authority granted by the combined annual andspecial stockholders’ meeting of May 25, 2000, the Board ofDirectors’ meeting of September 10, 2001 decided to grant asof October 9, 2001, options giving the right to subscribe to newshares in the Company to be issued in a capital increase up toa total maximum amount of 571,500 euros, representing150,000 new shares with a par value of 3.81 euros.
These options were granted under the conditions set by theannual and special stockholders’ meeting at a price of43.10 euros, or 95% of the average of the 20 trading daysimmediately preceding October 9, 2001, rounded up to thenearest tenth of a euro.
These stock options may be exercised from October 9, 2005,the start of the fifth year of allotment, until October 8, 2007, theend of the sixth year of allotment.
Following the allotment of one scrip issue for 11 existing sharesin June 2002, then one share for six in June 2004 followed bythe 3-for-1 stock split on August 30, 2004, the number of stockoptions increased to 572,756 and the price was adjustedaccordingly to 11.29 euros. Finally for options not exercisedbefore June 1, 2006, the date of the 2-for-1 split after theannual and special stockholders’ meeting of May 23, 2006, thenumber and price were adjusted accordingly at 5.645 eurosper share.
Plan No. 2
Using the authority granted by the annual and specialstockholders’ meeting of May 25, 2000, the Board of Directors’meeting of September 8, 2003 decided to grant 32,000 newoptions, as of September 8, 2003, for new shares in theCompany to be issued in a capital increase, in a total nominalamount of 121,920 euros corresponding to 32,000 newshares with a par value of 3.81 euros.
These options were granted under the conditions set by thespecial stockholders’ meeting at the price of 63.9 euros,corresponding to 95% of the average of the prices quoted at theend of the 20 trading sessions preceeding September 8, 2003.
These stock options may be exercised from September 8,2007, the start of the fifth year of allotment, and untilSeptember 7, 2009, the end of the sixth year of allotment.
The number of options and the price were adjusted fortransactions conducted on the capital after allotment, thus afterthe allotment of one scrip issue for six existing shares in June2004, followed by the 3-for-1 stock split on August 30, 2004,and by the 2-for-1 stock split on June 1, 2006, the number ofstock options increased to 224,000 and the price was adjustedto 9.13 euros.
They must be fully paid up in cash at the time of subscriptionand will be issued with rights as of the first day of the year inwhich the option is exercised and with entitlement to the entiredividend paid for that year. The beneficiaries of these optionsare the corporate officers and the employees directly involvedin successfully meeting the five-year objectives.
Plan No. 3
Using the authority granted by the annual and specialstockholders’ meeting of May 25, 2000, the Board of Directors’meeting of March 8, 2005 decided to grant 150,000 newoptions for new shares in the Company to be issued in a capitalincrease in a total nominal amount of 190,500 euroscorresponding to 150,000 new shares with a par value of1.27 euros each. Under this authority, 127,000 stock optionswere granted.
These options were granted under the conditions set by thespecial stockholders’ meeting at the price of 42.17 euroscorresponding to a price slightly above 95% of the average ofthe prices quoted at the end of the 20 trading sessionspreceding March 8, 2005.
These options may be exercised from March 8, 2009, the startof the fifth year of allotment, and until March 7, 2011, the endof the sixth year of allotment.
The number of stock options and the price will be adjusted fortransactions conducted on the capital after allotment. Theymust be fully paid up in cash at the time of subscription andwill be issued with rights as of the first day of the year in whichthe option is exercised, and with entitlement to the entiredividend paid for that year. The beneficiaries of these optionsare the corporate officers and the employees directly involvedin successfully meeting the five-year objectives. Following thetwo-for-one stock split on June 1, 2006, the number of optionscorresponding to Plan No. 3 increased to 254,000 and theprice was adjusted to 21.085 euros.
On the Chairman’s recommendation, the Board of Directors’meeting of December 5, 2005 decided to add a rider to theBOURBON stock option plan of March 8, 2005 maintaining theemployees of former BOURBON subsidiaries or sub-subsidiaries as recipients of the BOURBON stock options.These are subsidiaries or sub-subsidiaries sold in connection
BOURBON Rapport financier 2006 I 109BOURBON 2006 Financial report I 109
Other legal and financial information
with the restructuring of the group and its shift in focus to themarine business.
Employees of the BOURBON subsidiaries or sub-subsidiariesthat are no longer consolidated within BOURBON will continueto enjoy these rights as long as they are employed with thosecompanies.
• The combined annual and special stockholders’meeting of June 7, 2005 granted authority to the Board ofDirectors in its twenty-first special resolution to grant, one ormore times, to some or all of the employees or to somecategories of employees or the corporate officers, as defined bylaw, of the Company or of any affiliated companies pursuant toarticle L 225-180 of the French Commercial Law, optionsentitling the holder to subscribe for new stock in the Companyand/or to purchase existing shares in the Company frompurchases made by it.
The Board of Directors may use this authority one or moretimes during a period of thirty-eight months from the time ofthe meeting.
The total number of options granted under this authority andnot yet exercised may not entitle the holder to subscribe for orto buy a number of shares greater than 5% of the capital stockin the Company after the meeting.
The exercise period for the options may not exceed six yearsfrom the date the options are allotted by the Board of Directors.
The decision in question entails the express waiver by therecipients of the stock options of their pre-emptive right to theshares issued as the options are exercised.
The subscription or purchase price of the shares under optionshall be set by the Board of Directors on the day the optionsare allotted, as required by law, but with the exception of theapplication of any discount, the subscription price shall bedetermined based on the average prices quoted in the 20trading sessions preceding the day the shares under option areallotted.
This price may not be changed unless the Company carries outa financial transaction during the option exercise period. In thatcase, the Company will adjust the price or the number of theshares, as required by law.
All powers were given to the Board of Directors, acting underthe foregoing conditions, to grant the foregoing stock options,to set the terms and conditions thereof, in accordance with thelaw and the bylaws, to designate the beneficiaries, to take duenote of the capital increase(s) carried out under this authority,to withhold from the amount of any premiums related to thecapital increases the cost of such transactions, to carry out any
and all related formalities and to amend accordingly the articleof the bylaws setting the amount of the capital.
Plan No. 4
Using the authority granted by the annual and specialstockholders’ meeting of June 7, 2005, the Board of Directors’meeting of December 5, 2005 decided to grant 300,000 newstock options to be issued in a capital increase in a totalnominal amount of 381,000 euros corresponding to a parvalue of 1.27 euro each. These options were granted under theconditions set by the special stockholders’ meeting at the priceof 65.50 euros, corresponding to a price slightly above 95% ofthe average of the prices quoted at the end of the 20 tradingsessions preceding December 5, 2005.
These options may be exercised from December 5, 2009, thestart of the fifth year of allotment, and until December 4, 2011,the end of the sixth year of allotment.
The number of options and the price will be adjusted fortransactions conducted on the capital after allotment. Theymust be fully paid up in cash at the time of subscription andwill be issued with rights as of the first day of the year in whichthe option is exercised, and with entitlement to the entiredividend paid for that year. The beneficiaries of these optionsare the corporate officers and the employees directly involvedin successfully meeting the five-year objectives. Following thetwo-for-one stock split on June 1, 2006, the number of optionscorresponding to Plan No. 4 increased to 600,000 actions andthe price was adjusted at 32.75 euros.
Plan No. 5
Using the authority granted by the annual and specialstockholders’ meeting of June 7, 2005, the Board of Directors’meeting of December 4, 2006 decided to grant 43,200 newstock options in the Company to be issued in a capital increasein a total nominal amount of 27,432 euros, corresponding to43,200 new shares with a par value of 0.635 euro each. Theseoptions were granted under the conditions set by the specialstockholders’ meeting at the price of 40.05 euros,corresponding to a price slightly above 95% of the average ofthe prices quoted at the end of the 20 trading sessionspreceding December 4, 2006.
These options may be exercised from December 4, 2010, thestart of the fifth year of allotment, and until December 3, 2012,the end of the sixth year of allotment.
The number of stock options and the price will be adjusted forany transactions conducted on the capital after allotment. Theymust be fully paid up in cash at the time of subscription andwill be issued with rights as of the first day of the year in whichthe option is exercised, and with entitlement to the entire
110 l BOURBON 2006 Financial report
Other legal and financial information

dividend paid for that year. The beneficiaries of these optionsare the corporate officers and the employees directly involvedin successfully meeting the five-year objectives.
• Capital increases already carried out
Fiscal year 2005
On October 9, 2005, after the fourth year following theallotment date, the exercise period for the first stock optionplan began for options allotted under the authority granted tothe Board of Directors by the annual and special stockholders’meeting of May 25, 2000 (Board of Directors’ meeting ofSeptember 10, 2001).
The exercise of these options by the recipients generatedsuccessive capital increases noted as a whole at the firstmeeting of the Board of Directors for the year 2006, or in theBoard meeting of March 20, 2006.
This resulted in the following:• on the one hand, as of December 31, 2005, 433,577 newshares were subscribed, representing an increase in the capitalin the amount of 550,819.38 euros, thus raising theCompany’s capital to the sum of 31,818,083.53 euros. Thesubscription premium amounted to 4,344, 264.95 euros.
• on the other hand, for the period between January 1, 2006and the date of the Board meeting noting the successivecapital increases (March 20, 2006), the stock optionscontinued to be exercised, and 11,228 new shares weresubscribed, representing an increase in the capital stock of14,264.13 euros, raising the Company’s capital as of that dateto the sum of 31,832,347.66 euros, the additional paid-incapital amounted to 112,499.99 euros.
The Board of Directors’ meeting of March 20, 2006 thereforenoted that BOURBON’s statutory capital, rounded down to thenearest whole number, was set at 31, 832,347 euros, andaccordingly decided to amend article 7 of the Company’sbylaws.
Fiscal year 2006
The exercise by the recipients of the stock options receivedunder the first option plan granted under the authority given tothe Board of Directors by the annual and special stockholders’meeting of May 25, 2005 (Board of Directors’ meeting ofSeptember 10, 2001) continued to generate a capital increasein the Company during fiscal year 2006.
At its first meeting of the year 2007, i.e. during the March 19,2007 Board meeting, the Board of Directors noted the capitalincrease that occurred between March 20, 2006 (the date of
the last acknowledgement of an increase by the Board ofDirectors) and December 31, 2006.
As a result, between March 20, 2006 and December 31,2006, 81,918 new shares were issued at a price of 5.645euros, adjusted for any transactions conducted on the capitalafter the annual and special stockholders’ meeting of May 23,2006 doubling (from June 1, 2006), the number of sharescomprising the capital. This new share issue represents anincrease in the Company’s capital of 52,034.60 euros, thusraising the Company’s capital from 31,832,347.66 euros to31,884,382.26 euros. The additional paid-in capital amountedto 410,392.52 euros.
The Board of Directors, in its March 19, 2007 meeting, notedthat BOURBON’s statutory capital, rounded down to thenearest whole number, was set at 31,884,382 euros, andtherefore decided to amend article 7 of the Company’s bylawsaccordingly.
Article 7 – Capital stockThe capital stock is set at 31,884,382 euros. It is divided into50,195,528 shares. The shares are all in the same class.
BOURBON Rapport financier 2006 I 111BOURBON 2006 Financial report I 111
Other legal and financial information

2.3 Potential capital dilution as of December 31, 2006
As of December 31, 2006, 50,195,528 shares of BOURBON stock were outstanding. The stock options not yet exercised andnot cancelled will result in capital dilution when exercised.
There is no other form of potential capital.
2.4 Information on stock options
Date of stockholders’ meeting May 25, 2000 June 7, 2005
Plan No.1 (1) Plan No.2 (1) Plan No.3 (1) Plan No.4 (1) Plan No.5 Total
Sept. 10, Sept. 8, Mar. 8, Dec. 5, Dec. 4,Date of Board meeting 2001 2003 2005 2005 2006
Total number of shares that can be subscribed or purchased by specifying: 1,145,512 224,000 300,000 600,000 43,200 –
the number that can be subscribed or purchased by– corporate officers 263,456 49,000 80,000 120,000 – –
– the top ten employee optionees 329,128 151,900 162,000 124,000 19,800 –
Start date for exercising options 10.09.2005 09.08.2007 03.08.2009 12.05.2009 12.04.2010 –
Expiration date 10.08.2007 09.07.2009 03.07.2011 12.04.2011 12.03.2012 –
Subscription or purchase price €5.65 €9.13 €21.09 €32.75 €40.05 –
Number of shares subscribed as of 12.31.2006 971,528 – – – – –
Options cancelled as of 12.31.2006 134,406 33,600 46,000 59,600 – –
Options remaining as of 12.31.2006 39,578 190,400 254,000 540,400 43,200 1,067,578
(1) Figures adjusted following the different transactions since the plans were allotted.
Should the 1,067,578 options be exercised, the potential capital dilution would be a maximum of 2.08%,or 1,067,578/ (50,195,528 + 1,067,578).
112 l BOURBON 2006 Financial report
Other legal and financial information

2.5 Changes in the capital over the past five years
Share issues
Amount of Issue and Total Totalcapital Number merger amount of number of
Date Operation increase (€) of shares premium capital shares
06/21/2002 Allotment of 1 new share for 11 old shares 2,116,446 555,319 – 25,397,351 6,663,828
06/21/2002 Exercise of 9,100 stock warrants (BSA) at the price of € 57.93 41,619 10,920 492,480 25,438,970 6,674,748
09/06/2002 Exercise of 297,710 BSA at the price of € 57.93 1,361,568 357,252 16,111,702 26,800,538 7,032,000
06/28/2004 Allotment of 1 new share for 6 old shares 4,466,726 1,172,000 – 31,267,264 8,204,000
08/23/2004 Merger-consolidation Sté Financière Jaccar 9,472,434 2,485,401 39,393,233 40,739,698 10,689,401
08/23/2004 Capital reduction by canceling the securities received (9,472,434) (2,485,401) (39,393,233) 31,267,264 8,204,000
08/30/2004 3-for-1 stock split – – – 31,267,264 24,612,000
12/31/2005 Exercise of stock options (October 2005 to December 2005) 550,819 433,577 4,344,265 25,045,577
03/20/2006 Exercise of stock options (January 1 to March 20, 2006) 14,264 11,228 112,500 31,832,347 25,056,805
05/31/2006 Exercise of stock options (March 21, 2006 to May 31, 2006) 5,632 4,433 44,417 31,837,979 25,061,238
06/01/2006 2-for1 stock split – – – – 50,122,476
12/31/2006 Exercise of stock options (June 1 to December 31, 2006) 46,403 73,052 365,976 31,884,382(1) 50,195,528
(1) Capital increase related to the options exercised, amended only on March 19, 2007.
The number of shares comprising the capital stock and the number of voting rights are adjusted monthly as necessary inaccordance with the “Transparency Directive”. This information is available on the Company’s website, www.bourbon-online.comunder the heading “Finance” – “Regulated information”.
2.6 Significant transactions affecting the distribution of capital over the past three years
On April 23, 2004, Schroders reported it had fallen below the 5% threshold for capital and voting rights.
On August 23, 2004, the Company Financière Jaccar, following the merger-consolidation with BOURBON, reported that it hadfallen below the threshold by 20% to 0%; at the same time, Jaccar reported it had exceeded the threshold by going from 0%to 10%, and the Company Bearing Venture Capital exceeded the threshhold by 5 %. Then on September 16, 2004, Jaccarreported it had moved from 10% to 20%. On October 21, 2004, the Company Bearing Venture Capital announced it had fallenbelow the 5% threshold. Lastly, Gebema (part of the Gevaert group) said in turn that it had dropped below 5%.
Jaccar reported the acquisition of 985,114 shares on June 27, 2005 and 100,000 shares on June 13 and 14, 2006. Thus itsstake amounted to 23.75% as of December 31, 2006.
On October 10, 2006, Schroders reported it had exceeded the 5% threshold, with 2,523,062 shares on that date.
BOURBON Rapport financier 2006 I 113BOURBON 2006 Financial report I 113
Other legal and financial information

Lastly, on April 17, 2007, after a sale of shares, Schroders reported it had again fallen below the 5% threshold for capital andvoting rights, and that it held on that date 2,420,812 shares.
Thus as of the registration date of the “2006 Registration Document”, and to the Company’s knowledge, only one stockholder,Jaccar, owned more than 5% of the capital and voting rights.
Furthermore, Jaccar reported that it “[was] acting alone, reserving the option of stopping or continuing its purchases dependingon the circumstances and market positions and [was] not planning to acquire control of BOURBON”.
2.7 Changes in the stockholder base
Position at 12.31.06 Position at 12.31.05 Position at 12.31.04% of % of % of
Number % of voting Number % of voting Number % of votingStockholder of shares capital rights of shares capital rights of shares capital rights
Jaccar (*) 11,919,960 23.75 23.77 5,909,980 23.60 23.60 4,924,866 20.01 20.02
Schroders 2,523,062 5.03 5.03 – – – – – –
Treasury stocks 43,936 0.09 – 660 0.00 – 7,914 0.03 –
Employees 474,107 0.94 0.94 237,888 0.95 0.95 211,000 0.86 0.86
Public 35,234,463 70.19 70.26 18,897,049 75.45 75.45 19,468,220 79.10 79.13
TOTAL 50,195,528 100.00 100.00 25,045,577 100.00 100.00 24,612,000 100.00 100.00
(*) Jaccar: family of Jacques d’Armand de Chateauvieux.
2.8 Distribution of capital and voting rights as of December 31, 2006
Total number of shares (December 31, 2006) 50,195,528Total number of voting rights (December 31, 2006) 50,151,592Approximate number of stockholders (TPI stockholder identification procedure at February 7, 2007) 35,000Stockholders owning 5% or more of the capital or voting rights (December 31, 2006)– more than 20% Jaccar– more than 10% None– more than 5% Schroders
To the Company’s knowledge, there are no other stockholders owning, either directly or indirectly, or together 5% or more of thecapital and voting rights.
Percentage of capital and voting rights held by all the members of the Board of Directors:• capital: 29.5%• voting rights: 29.5%
As of December 31, 2006, the Company held 43,936 shares or 0.09% of the capital.
In addition, as of that same date, 851 employees owned 0.94% of the capital with 474,107 shares.
Since December 31, 2004, there has been a stockholders’ agreement stipulating a collective pledge to retain shares of BOURBONstock (“Loi Dutreil”, article 885 I of the French General Tax Code “Code Général des Impôts”) involving 27.17% of the capital.
This agreement, which is tax-related in nature, does not under any circumstances represent a “collective action” to implement avoting policy or a BOURBON management policy.
It does not contain any preferred terms for sales.
114 l BOURBON 2006 Financial report
Other legal and financial information

2.9 Price trend in euros over 18 months
Date High Low Volume in € m
2005
September 35.78 29.10 1,396,988 90.80
October 36.98 31.83 1,522,743 102.62
November 35.58 33.43 914,406 62.71
December 37.10 34.53 1,080,981 77.44
2006
January 44.45 36.00 995,311 79.92
February 46.60 39.00 1,481,357 128.56
March 46.95 42.83 1,549,390 140.33
April 51.95 44.05 1,176,470 113.17
May 53.25 41.10 3,778,367 358.63
June 45.90 34.00 4,191,199 165.53
July 43.10 38.22 1,797,490 73.88
August 43.60 38.15 3,363,553 136.00
September 40.98 36.81 3,465,685 133.16
October 45.00 36.21 3,616,462 144.79
November 44.29 40.20 3,875,941 164.53
December 42.18 39.73 3,599,883 147.35
2007
January 43.19 39.44 3,611,655 149.93
February 48.70 42.90 2,983,584 137.82
2.10 DividendsNet Dividend Gross Total
dividend/ Tax credit/ dividend/ payout in Closing date share share share thousands €
December 31, 2002 1.08 0.54 1.62 7,595
December 31, 2003 (1) 1.40 0.70 2.10 9,845
December 31, 2004 (2) 0.56 – 0.56 13,783
December 31, 2005 (3) 1.00 – 1.00 25,046
December 31, 2006 (4) 0.60 – 0.60 30,117
(1) 7,032,000 shares.(2) 24,612,000 shares.(3) 25,045,577 shares.(4) 50,195,528 shares.
BOURBON Rapport financier 2006 I 115BOURBON 2006 Financial report I 115
Other legal and financial information

1. TRADEMARKS, LICENSES, PATENTS
The BOURBON Company has filed its logo, including thegraphic features. It has also protected its trademarks, i.e.BOURBON, Bourbon Offshore, Les Abeilles, Setaf Saget andSetaf for the products and services concerned.
2. PROPERTY, PLANT AND EQUIPMENT
BOURBON generally owns its operating resources, with theexception of those of the Bulk Division.
The group’s tangible assets consist mainly of vesselsrepresenting nearly 94% of the line item (excluding fixedassets in progress and prepaid expenses).
At year-end 2006, the fleet owned by the Offshore Divisionincluded 113 crewboats and 73 supply vessels.
Aside from the five intervention and assistance tugs, theTowage & Salvage Division operates 62 harbor tugs, inFrance and abroad.
Lastly, the Bulk Division fully owns six bulk carriers for its solidbulk shipping business.
A summary of BOURBON’s property, plant and equipment andthe principal related expenses (amortization, depreciation andprovisions) appears in note 3.3 of the notes to theconsolidated financial statements (page 57).
Trademarks, licenses, patents, real properties, plant and equipment
116 l BOURBON 2006 Financial report
Other legal and financial information

BOURBON Rapport financier 2006 I 117
BOURBON PRESS RELEASES FROM JANUARY 1, 2006 THROUGH DECEMBER 31, 2006
The press releases or publications below are available on the AMF website, www.amf-france.org, and/or on the websitewww.bourbon-online.com (under the heading “Press Releases”).
Date Description
January 13, 2006 Admission of BOURBON to compartment A and eligibility for Deferred Settlement Service (SRD).
January 18, 2006 BOURBON invests in US offshore oil and gas marine services by making USD 9.1 million equity investmentin Rigdon Marine.
February 10, 2006 BOURBON (new scope): 2005 revenues up sharply at 614.4 million euros, or +19.1 %
February 28, 2006 Horizon 2010 : BOURBON positions itself to become the market leader in offshore oil and gas marineservices.
March 17, 2006 Annual assessment of the liquidity contract with CM CIC Securities
March 23, 2006 2005 Annual results
April 24, 2006 BOURBON orders 56 platform supply vessels for its offshore oil and gas services
April 25, 2006 Amount of Statutory Auditors’ fees
April 27, 2006 BOURBON orders 12 new harbor tugs
May 10, 2006 First quarter 2006 revenues
May 24, 2006 Annual and Special Shareholders’ Meeting of May 23, 2006
June 23, 2006 For fair competitive conditions in the Port of Le Havre
June 26, 2006 BOURBON announces the commissioning of the Bourbon Orca, an advanced technology vessel for themodern offshore oil and gas sector
August 10, 2006 First half 2006 revenues
August 11, 2006 Midyear assessment of the liquidity contract with CM CIC Securities
September 13, 2006 First half 2006 results
October 24, 2006 Les Abeilles Le Havre maintains its fleet and quality standards whilst adopting an aggressive marketingpolicy
November 3, 2006 Under completely safe conditions Les Abeilles International carries out the delicate operation of pumpingfuel oil from MV Rokia Delmas container vessel, which ran aground off the coast of the Island of Ré
November 9, 2006 Third quarter 2006 revenues
STRATEGIC AND FINANCIAL PRESENTATIONS (SLIDESHOWS)
Documents available on the website www.bourbon-online.com (under the heading “Slideshows”).
Date Description
February 28, 2006 Slideshow Horizon 2010 Strategy
March 23, 2006 Slideshow 2005 Annual results
May 23, 2006 Slideshow annual and special stockholders’ meeting of May 23, 2006
September 13, 2006 Slideshow First-half 2006 results
Annual information document
BOURBON 2006 Financial report I 117
Other legal and financial information

REGISTRATION DOCUMENT
The Registration Document is available on the AMF website, www.amf-france.org, and on the website, www.bourbon-online.com(under the heading “Annual Reports”).
Date Description
May 15, 2006 Registration Document/Annual Report 2005
DECLARATIONSInformation available on the AMF website, www.amf-france.org.
Monthly declarations of purchases and sales by the companies of their own shares
Date Description
January 16, 2006 Declaration of purchases/sales of own shares
February 13, 2006 Declaration of purchases/sales of own shares
March 13, 2006 Declaration of purchases/sales of own shares
April 18, 2006 Declaration of purchases/sales of own shares
May 22, 2006 Declaration of purchases/sales of own shares
June 12, 2006 Declaration of purchases/sales of own shares
July 17, 2006 Declaration of purchases/sales of own shares
August 21, 2006 Declaration of purchases/sales of own shares
September 18, 2006 Declaration of purchases/sales of own shares
October 9, 2006 Declaration of purchases/sales of own shares
Declarations by executives of transactions involving the Company’s stock
Date Description
June 27, 2006 Declarations by executives
Thresholds crossed
Date Description
October 20, 2006 Threshold crossed
118 l BOURBON 2006 Financial report
Other legal and financial information

BOURBON 2006 Financial report I 119
Information published in the Legal Gazette [BALO]
The information published in the “Bulletin des annonces légales obligatoires (BALO)” is available on the official website:balo.journal-officiel.gouv.fr.
Date Description
March 1, 2006 Revenues 2005
March 31, 2006 BOURBON doubles its net income group share to 205 million euros
April 21, 2006 Invitation to the annual and special stockholders’ meeting of May 23, 2006
May 10, 2006 Annual financial statements as of December 31, 2005
May 15, 2006 First quarter 2006 revenues
May 26, 2006 Correction to the annual financial statements
June 2, 2006 Voting rights for the May 23, 2006 annual meeting
June 7, 2006 Amendment to the bylaws
June 14, 2006 Number of voting rights after the two-for-one stock split
June 23, 2006 Notice of non-modification of the annual financial statements at December 31, 2005
August 11, 2006 First half 2006 revenues
October 23, 2006 First-half financial statements at June 30, 2006
November 15, 2006 Third quarter 2006 revenues
Other legal and financial information


Design and production: - Photographs: Harald Valderhaug, all rights reserved.

www.bourbon-online.com
Corporate office:33, rue du Louvre - 75002 Paris - France
Tel. : +33 (0)1 40 13 86 16 - Fax : +33 (0)1 40 28 40 31
Investor relations, analysts, stockholders:[email protected]