A GUIDE TO PROMOTING DATA USE UNDER THE 50x2030 …
33
1 A GUIDE TO PROMOTING DATA USE UNDER THE 50x2030 INITIATIVE This version: January 15, 2021
Transcript of A GUIDE TO PROMOTING DATA USE UNDER THE 50x2030 …

1
A GUIDE TO PROMOTING DATA USE UNDER
THE 50x2030 INITIATIVE
This version: January 15, 2021
2
I. Targeted Results and the Theory of Change
The main objective of the 50x2030 Initiative is increased and sustained evidence-based decision-
making in agriculture in low and lower-middle income countries (L/LMICs), particularly to help
achieve Sustainable Development Goal (SDG) 2. To reach this objective, the 50x2030 Initiative
implements work under three Components: (1) Data Production, led by the Food and Agriculture
Organization of the UN (FAO); (2) Methods and Tools Development, led by the World Bank’s
Development Data Group; and (3) Data Use, led by IFAD’s Research and Impact Assessment Division.
The work of the three Components is coordinated by a Program Management Team (PMT) within
the World Bank.
In support of the main objective, the Data Use component will focus on achieving two outcomes
under the 50x2030 Results Framework:
• Key actors using survey data in more and better ways in partner countries
• More sustainable and strategic agricultural data ecosystems in partner countries.
The Data Use component will achieve those outcomes by supporting countries to implement
activities to strengthen the data ecosystem for data use through improved capacities,
communication, policies, and practices. Ultimately, those outputs should lead to more evidence-
based planning and data-driven policies, and investments both inside the governments and in the
private sector.
The Initiative can only help facilitate progress towards achieving SDG targets 2.3 and 2.4 if the data
from the surveys is used and applied to solutions across the agricultural and food security sectors.
The Initiative focuses on data use to ensure that (i) Decision Makers have the needed motivation,
access, and capacity to use the 50x2030 survey data and that (ii) the agricultural and rural data
produced by national statistical offices and researchers aligns with the needs of Decision Makers.
The 50x2030 Initiative defines the “Decision Maker” as the final consumer who applies the data to
answer questions and solve problems relevant to their job. In practice, Decision Makers would
include government staff from the Ministry of Agriculture and other relevant ministries (e.g.
managing directors, permanent secretaries, ministers, etc.), staff of development organizations,
business owners and staff, and other national, regional, and international stakeholders. The
inclusion of a Data Use component recognizes that supply-side efforts focused on data production
alone are insufficient to increase evidence-use in decision-making.
3
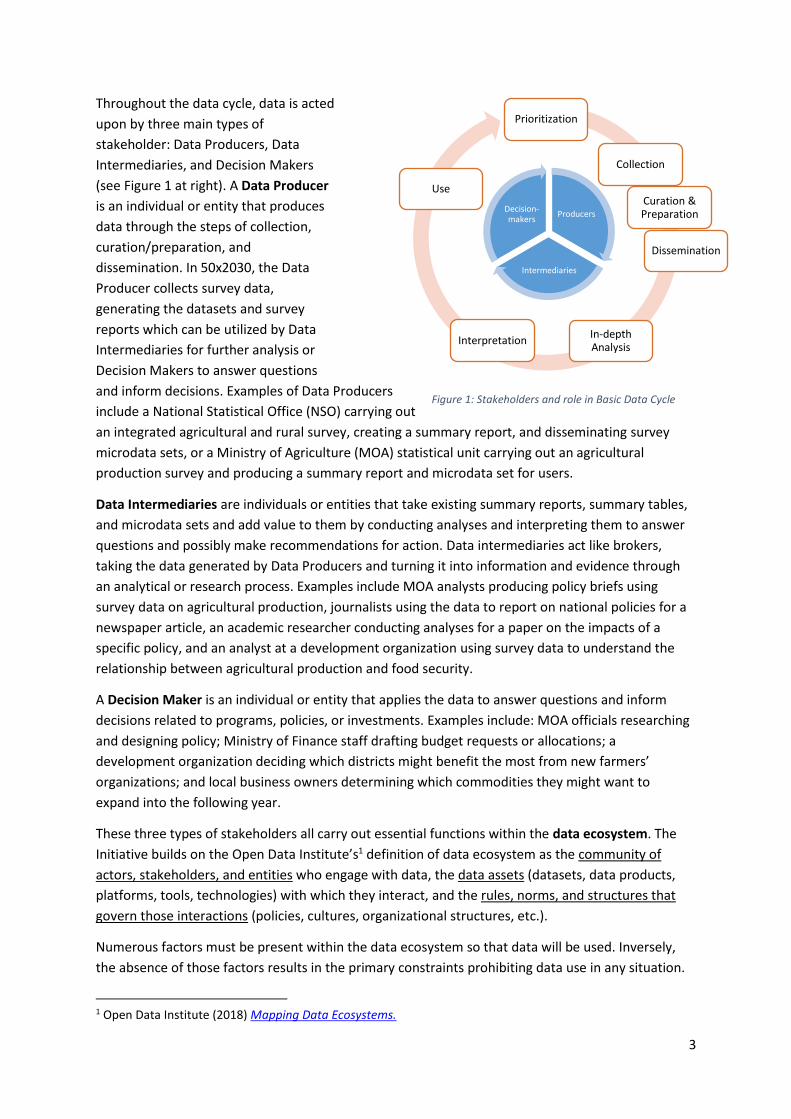
Throughout the data cycle, data is acted
upon by three main types of
stakeholder: Data Producers, Data
Intermediaries, and Decision Makers
(see Figure 1 at right). A Data Producer
is an individual or entity that produces
data through the steps of collection,
curation/preparation, and
dissemination. In 50x2030, the Data
Producer collects survey data,
generating the datasets and survey
reports which can be utilized by Data
Intermediaries for further analysis or
Decision Makers to answer questions
and inform decisions. Examples of Data Producers
include a National Statistical Office (NSO) carrying out
an integrated agricultural and rural survey, creating a summary report, and disseminating survey
microdata sets, or a Ministry of Agriculture (MOA) statistical unit carrying out an agricultural
production survey and producing a summary report and microdata set for users.
Data Intermediaries are individuals or entities that take existing summary reports, summary tables,
and microdata sets and add value to them by conducting analyses and interpreting them to answer
questions and possibly make recommendations for action. Data intermediaries act like brokers,
taking the data generated by Data Producers and turning it into information and evidence through
an analytical or research process. Examples include MOA analysts producing policy briefs using
survey data on agricultural production, journalists using the data to report on national policies for a
newspaper article, an academic researcher conducting analyses for a paper on the impacts of a
specific policy, and an analyst at a development organization using survey data to understand the
relationship between agricultural production and food security.
A Decision Maker is an individual or entity that applies the data to answer questions and inform
decisions related to programs, policies, or investments. Examples include: MOA officials researching
and designing policy; Ministry of Finance staff drafting budget requests or allocations; a
development organization deciding which districts might benefit the most from new farmers’
organizations; and local business owners determining which commodities they might want to
expand into the following year.
These three types of stakeholders all carry out essential functions within the data ecosystem. The
Initiative builds on the Open Data Institute’s1 definition of data ecosystem as the community of
actors, stakeholders, and entities who engage with data, the data assets (datasets, data products,
platforms, tools, technologies) with which they interact, and the rules, norms, and structures that
govern those interactions (policies, cultures, organizational structures, etc.).
Numerous factors must be present within the data ecosystem so that data will be used. Inversely,
the absence of those factors results in the primary constraints prohibiting data use in any situation.
1 Open Data Institute (2018) Mapping Data Ecosystems.
Prioritization
Collection
Curation & Preparation
Dissemination
In-depth Analysis
Interpretation
Use
Figure 1: Stakeholders and role in Basic Data Cycle
Producers
Intermediaries
Decision-makers

4
The 50x2030 Initiative uses the Data Use Framework in Table 1 to understand, examine, prioritize
and address the enabling factors, which can also become the most binding constraints if absent in a
particular context.
Table 1: The 50x2030 Data Use Framework
Factors that lead
to Data Use
Definition Sub-factors
Demand Decision Makers want to use data to
make their decisions
Decision Makers believe that data-
based decisions are beneficial
Political and cultural beliefs and
norms enable data use
Expertise Decision Makers know what data they
need and how to use it
Availability Data is produced and exists (may not be
accessible/available to users)
Access
Data Intermediaries and Decision
Makers have access to (and can obtain)
the data that is produced
Awareness
Data Intermediaries and Decision
Makers know the data is available and
accessible
Utility
The data is relevant and useful to the
Decision Makers for the decisions they
need to make
Data is of the type needed for
targeted decisions (useful
variables, disaggregation,
periodicity, etc.)
Data is in the necessary formats
and products
Information (analyzed data) is in
needed formats and products
Trust
Data Intermediaries and Decision
Makers believe the data is reliable,
useful, and accurate
Data quality based on producer
capacity
Absence of political interference in
one or more stages within the
data cycle
Cooperation with other data
sources (not competition)
These factors are all embedded in the data ecosystem and the communication exchanges or
practices between Data Producers, Data Intermediaries, and Decision Makers. All factors must be
present to achieve optimal data use, yet, in reality, the presence of these factors varies greatly in any
specific context. Upon identifying the degree to which these factors are present or absent in partner

5
countries, the Data Use component will address the most binding constraint by working to build a
stronger data ecosystem and by improving data sharing and communication practices.
A strong data ecosystem means data needs are being met through data assets and collaborative
interaction between Decision Makers, Data Producers, and Data Intermediaries, and that, ultimately,
data is being applied appropriately to make decisions. Data Use activities will be designed to
increase or enhance demand for the data, improve its utility, and build trust between users and
producers, thereby strengthening the data ecosystem.
Good data sharing and communication practices by the partner governments are essential to enable
ecosystem actors to use the survey data in more and better ways. That often implies changes in data
policies, data management tools and platforms, and stronger capacity to manage and share data.
The Initiative will implement data-use activities to promote extensive access to the survey data and
ensure Decision Makers are aware of the survey data and its uses. Both the Data Production and
Data Use components will implement coordinated activities to improve access and awareness,
through work with Data Producers, Data Intermediaries, and Decision Makers. Data availability will
be addressed by the Initiative, but solely under the Data Production component.
The work under the Data Production and Methods and Tools Development components also directly
and indirectly supports the work of the Data Use component. It aims to improve various aspects of
the data systems related to the seven factors identified in the Data Use Framework.
II. Activities to Promote Data Use
Once a partner country is onboarded to the 50x2030 Initiative and a joint inception mission has
taken place, the Initiative’s Data Use component will begin activities in the country, in the following
sequence:
A. First, an Agricultural Data Ecosystem Mapping and Report will be created to inform the
design of all future activities.
B. Based on the findings of the Data Ecosystem Mapping exercise, country stakeholders will
jointly develop a multiyear approach to promote data use, which will be included as a
section of the broader 50x2030 Program Implementation Plan (PIP).
C. The Data Use activities under the data use section of the 50x2030 PIP will include technical
assistance, training, and workshops, designed to strengthen the data ecosystem, improve
data sharing and communication practices, and monitor data use.
All of these activities will be designed and implemented using the Data Use Framework to achieve
the desired outcomes of the Initiative. The implementation method for those activities is below.
A. The Agricultural Data Ecosystem Mapping and Report
The Agricultural Data Ecosystem Mapping and Report is a type of assessment process that identifies
the components of the data ecosystem (actors or stakeholders, data assets, and the structures that
govern them), how they interact, and where enablers and constraints to data use reside in it. The
6
mapping exercise employs a visual technique for understanding the actors, relationships and data
flows in the particular country and will be accompanied by a written narrative that identifies key
characteristics and findings related to the ecosystem. The process of drawing the main elements of
the map enhances (i) the understanding of where important value exchanges happen (e.g., in the
supply of data from one actor to another, in the use of data, and in the sharing of data within
professional and social networks, etc.), and (ii) what kind of strategies or support might be needed
to enhance effective collaboration between actors and more efficient and effective flows of data.
Furthermore, the mapping will use a participatory approach that engages all relevant and key
stakeholder groups for the 50x2030-supported survey program, specifically the NSO and the
Ministries of Agriculture, Finance, Planning and any other relevant government agency. Information
from surveys and interviews with key stakeholders is used to generate the map, followed by
collaborative workshops to validate the draft. As such, the map emanates from the thoughts,
concerns, and understandings of the stakeholders within the data ecosystem, using a process
whereby those stakeholders exchange ideas and knowledge in a constructive way. The final product
serves as a communication tool to support engagement and buy-in across the ecosystem.
In each country, mapping the agricultural data ecosystem will entail the following activities in the
order below, although overlap is probable and desirable. They will be conducted by Initiative staff or
Initiative-employed consultants:
1. Conduct a desk review. Research and draft a brief summary of existing documentation to
create an Agricultural Data Profile for the country that includes:
a. National statistical capacity, technology, and digital infrastructure;
b. Data policies and laws within the country;
c. Other (non-governmental) data capacity in agriculture, research, or statistics;
d. The basic political situation and trends that might affect data production and use in
the country;
e. Agricultural (and rural) data needs in the country, particularly those related to
relevant national agricultural policy frameworks and international/regional
monitoring frameworks;
f. Existing and planned data sources related to those agricultural and rural data needs
(i.e. administrative data, satellite-derived data, etc.), including for regional and
international data monitoring and reporting requirements;
g. The agricultural and rural data needs which could be met by the agricultural survey if
designed accordingly;
h. Data Producers of the identified data sources;
i. Potential or presumed Data Users in the country and for the country, including
national statistical office staff, line ministry analysts, line ministry policymakers,
academics, civil society organization staff, development organization staff, agri-
business owners and staff, smallholders, and more.
2. Adapt draft questionnaires and interview protocol for stakeholder surveys and interviews.
The Initiative’s Data Use component will work from a standardized questionnaire (see Annex
1), aligned to the Data Use Framework and its seven factors, and will adapt it based on the
country context, as needed. The interview protocol (see Annex 2) will be semi-structured
and adapted to country context. The protocol is flexible and can be adapted for respondents
7
who have not responded to the survey or those who have answered the survey questions,
building on survey responses.
3. Develop brief plans for country stakeholder engagement. Plans will include a list of
proposed stakeholders/respondents and a timeline for the interviews and workshops among
any other considerations needed for the country.
4. Conduct a written survey among stakeholders. Surveys will be designed to yield both
qualitative/open-ended and quantitative/categorical data, using the country-specific
questionnaire. The quantitative data will inform indicators under factors and sub-factors of
the Data Use Framework, and identify the most binding constraints to data use based on
those factors. The qualitative data will support the Agricultural Data Ecosystem Mapping
exercise and help identify all of the actors, entities, data assets, enablers and constraints to
data use within the system. Through the written survey, the Data Use component will seek
to engage a broad and representative sample that collects data from the primary
stakeholder groups: government agencies, including the NSO, MOA, and other relevant
ministries; development organizations; research institutes and universities; journalists or
members of the media; and the private sector. Respondents will vary in rank, from mid-level
to high-level, and technical capacity related to data. Respondents will represent Data
Producers, Data Intermediaries and Decision Makers in order to understand the perspectives
of all groups. The sample will be purposive and include 40-60 respondents, depending on the
size and complexity of the stakeholder groups.
5. Conduct key informant Interviews. The interview process will coordinate with the written
surveys to elaborate more qualitative and detailed information about data exchanges that
happen or constraints that hinder them. The interviews will take place in person or via a
videoconferencing platform, depending on the context and travel conditions. In all cases,
Initiative or contractor staff will record the verbal interviews for transcription, if the
respondent agrees, to ensure optimal qualitative analysis. The interviewing process will also
seek to create a purposive sample that represents the various stakeholder groups under the
categorization above: government agencies, including the NSO, MOA, and other relevant
ministries; development organizations; research institutes and universities; journalists or
members of the media; and the private sector. Respondents will be Decision Makers, Data
Intermediaries, and Data Producers in order to understand the perspectives of all groups,
although the majority will be Decision Makers. Key interviewees will be identified through
the desk review process and from the written survey responses. The sample size is expected
to be 12-20 interviewees, although the final sample size will be determined when the data
saturation point is reached, meaning no new information is yielded from the interviews.
Note, the interview process could start while the survey responses are still being received.
6. Create a preliminary Agricultural Data Ecosystem Map using data from the desk review and
interviews. In each country, a preliminary map will be developed that identifies the actors
and entities in the system (Data Producers, Intermediaries, and Users), the data assets
(datasets, data products, platforms, tools, technologies) with which they interact, and the
constraints to data use.
8
7. Hold collaborative workshops (virtual or traditional) to validate the preliminary Data
Ecosystem Map. Consulted interviewees will be brought together through a virtual or in-
person format to examine the preliminary ecosystem mapping and findings. Jointly, the
Initiative and the country staff will work through the mapping and findings and ensure that
they reflect the main (majority) perspectives and that notable deviations in views, if any, will
be noted in the final report. Beyond ensuring that the mapping and report are accurate, this
workshop and collaborative discussion provide a means for Decision Makers, Data
Intermediaries, and Data Producers to discuss the issues, build understanding and rapport,
and thereby begin to strengthen the ecosystem.
8. Create the final Country Data Ecosystem Maps and Reports. A final Map and Report will be
drafted for reach country that includes:
a. The Country Profile for agricultural data, including all components listed under the
Desk Review.
b. The Current-State Ecosystem Map, which visualizes the relevant actors/entities
engaging with the survey data, the specific data assets related to the survey, data
flows, and any constraints to interactions.
c. A Future-State Ecosystem Map, which shows what an ideal data flow could look like,
including barriers.
d. An Examination of the various constraints to data use assessed against the Data Use
Framework.
e. Recommendations for activities and actions to overcome the most serious
constraints to data use (general and country-specific).
f. references for all documents, resources, and processes used to create the final
report.
In each country, the full Agricultural Data Ecosystem Mapping and Report process will take
approximately two to three months. The timeframe may fluctuate based on whether activities take
place virtually or in-person and other context-specific factors such as the availability of country
stakeholders and public holidays.
B. Jointly-designed Approach: The Data Use section of the Program Implementation Plan
As stated above, country stakeholders will jointly develop a multiyear approach to promote data use
that will be included as a section of the broader 50x2030 PIP. Initiative staff will work with the MoA,
the NSO, and any other relevant government organizations through a participatory process to
develop the Data Use section of the PIP. This will delineate the specific activities, timeline, and
budget related to Data Use activities for the full period of the program.
Following the release of each country’s Agricultural Data Ecosystem Mapping and Report, the
Initiative will engage a number (10-20) of key expert stakeholders, identified through the interview
process and representative of the relevant organizations, to formulate the Data Use section of the
PIP based on the findings. The Initiative will facilitate the development of the Data Use section of the

9
PIP using the Data Use Framework (as a conceptual guide) and the Delphi method (as a negotiation
approach) to consolidate ideas and build consensus among expert stakeholders.
The Delphi method is a consensus-building approach developed by the Rand Corporation2 in the
1950s that engages a limited set of experts in a series of questionnaires, to which they anonymously
respond and then receive feedback in the form of a statistical representation of the “group
response." The questionnaire process repeats, each time reducing the range of responses based on
the previous outcomes, until consensus is achieved. This approach will help the refine the priorities
for reducing constraints to data use, resulting in a feasible plan that has the buy-in of the consulted
experts and their organizations. 50x2030 will use the method to guide participants to prioritize the
factors to address and the activities best suited to address them. For example, questionnaires will
help participants choose the factors they think are most critical. Over a series of questionnaires,
priorities will be identified as options are reduced and those receiving little support are dropped.
The ultimate result should be a smaller set of priorities, such as building Expertise, improving Access,
and increasing Trust by working to depoliticize how data are used.
The Delphi method will either be conducted remotely, using electronic questionnaires and
videoconferencing, or in person, using paper or electronic questionnaires and in-person discussion
of the results. If undertaken remotely, the method will take approximately two to three weeks. If in-
person, most of the method will take place during a one- to two-day workshop.
After the constraints and solutions are prioritized and determined through the Delphi method,
Initiative staff or consultants will develop a draft section of the PIP that addresses the key
constraints and incorporates the desired solutions. Those desired solutions will be the Data Use
activities that the Initiative and the country will implement under the Data Use component. The
draft section of the PIP will be circulated, reviewed, and revised, as needed, until it is finalized and
endorsed by the stakeholders.
The Data Use component will engage the Initiative’s Program Management Team (PMT) and Data
Production component staff to ensure the plan corresponds to other workplans under development,
particularly to activities related to the Data Production component. PMT and Data Production staff
will be encouraged to join all meetings or written processes to develop the Data Use section of the
PIP.
C. Data Use Activities
The activities implemented in the country and delineated in the Data Use section of the PIP will be
designed to (i) strengthen the data ecosystem; (ii) improve data sharing and communication
practices; and (iii) monitor data use among stakeholders to provide a feedback loop for constant
improvements.
The activities designed to strengthen the data ecosystem will aim to enhance the relationships and
interactions between Decision Makers, Data Intermediaries, and Data Producers by increasing or
enhancing demand for the data, improving its utility, and building trust between them. Specific
2 https://www.rand.org/topics/delphi-method.html

10
activities will vary by country, based on identified constraints, and include a combination of actions
such as:
• Training for Data Producers in basic statistical analyses and to develop easy-to-
understand reports for needed audiences.
• Training for Data Intermediaries to conduct detailed analysis and present their
findings to Decision Makers for specific policy or programmatic needs.
• Training for Decision Makers to understand, interpret, and apply data to decisions.
• Collaborative workshops to share information between Data Producers, Data
Intermediaries, and Data users and build relationships and trust among partners
• National-level sensitization workshops and seminars for Decision Makers to improve
the culture of using data for decision-making
• Technical assistance and training on data use monitoring methods to yield products
that demonstrate how data are being used and the outcomes their use generates.
Activities intending to improve data sharing and communication practices will seek to enhance
evidence-informed decision making by improving access to the survey data and ensuring Decision
Makers are aware of the survey data and its possible uses. Specific activities will include:
• Technical assistance to strengthen data sharing and communication technologies,
platforms, and practices. This will include recommendations and facilitation of key
technologies, platforms, and processes that could address identified constraints to
access.
• Technical assistance and guidance on needed policy reforms for data sharing.
• A global annual conference and regional conferences for dissemination and
advocacy (not country-specific, but countries’ contributions can be planned). These
will be coordinated with similar initiatives or programs as far as possible.
Activities for data-use monitoring will include forms of technical assistance to design a monitoring
framework and corresponding methods to track data use. Monitoring activities will form a feedback
loop to inform stakeholders on the current status of the data ecosystem, data sharing practices,
whether actions to promote data use are generating desired results. In-country monitoring should
align with the indicators in the 50x2030 Results Framework as far as possible.
Data Use activities will need to be developed and tailored according to the countries’ needs. The
groupings above demonstrate the types of activities that can be tailored and designed to address the
targeted outcomes and constraints. As such, all possible activities will come in the form of technical
assistance (expert consultants and guidance); trainings; workshops; and conferences.
While the specific activities can only be defined after the Agricultural Data Ecosystem Mapping
exercise is completed and the constraints well understood, the general parameters and
characteristics of those activity types are:
a. Technical Assistance
Technical assistance will be provided primarily in the form of expert guidance and identification of
solutions for data sharing practices and data policies. The Initiative will identify experts to examine

11
countries’ data accessibility constraints, and identify actions to strengthen data sharing and
communication technologies, platforms, and practices. This will include recommendations and
facilitation of access to key technologies, platforms, and processes (see Section D below for
examples), such as linking country stakeholders to technology providers and organizing
demonstrations or trainings on desired platforms and software. Technical assistance and guidance
may also be provided to recommend and help draft the needed policy reforms for improved data
sharing. The aim will be that the identified experts will deliver all technical assistance in-person, or at
least following on an in-person mission to the country, if travel situations allow.
b. Training
Training will be designed, organized, and implemented for Data Producers, Data Intermediaries, and
Data Users. Training will be delivered in-person or virtually depending on the needs, culture, and
capacities of participants and on the nature of the training itself. As far as possible, it will bring them
together to help coordinate their needs and promote cross-fertilization of skills development. Again,
the particular topics, skill focus, duration, and number of participants will vary by country, but the
Initiative will seek to standardize certain training modules and approaches as they are tested, to
better understand the most effective practices.
Training for Data Producers will aim to build capacity among statisticians working directly on the
surveys to generate relevant and useful information and products necessary to meet specific policy or
programmatic needs. Many trainings for Data Producers would be conducted under the Initiative’s
Data Production component in coordination with the Data Use component. Training for Data
Producers that specifically aim to promote Data Use will focus on improving skills and knowledge
relevant to communicating and presenting data products as well as approaches to user engagement.
Possible areas of focus might be visualization techniques or statistical software functions. An example
would be a two-part training on Communicating Survey Results. The first part would include a three-
day training with NSO staff on developing brochures, presentations, and flyers to share survey data
with a variety of audiences, including instruction on using STATA or other software to visualize data
findings in the form of infographics. This first training would be followed by a one-month period for
trainees to put their skills in practice. Following this, a second, one-day training would be conducted
with the same trainees to present their products and discuss their possible uptake and application.
Training for Data Intermediaries would focus on building the capacities of analysts, researchers,
economists, and other data scientists to analyse the survey microdata and prepare analytical
products and reports for Decision Makers related to specific policies or program needs. An example
of training for Intermediaries would be a five-day training course that brings together staff from the
Ministry of Agriculture (MOA), Ministry of Planning (MOP), and a local university to analyze livestock
data from a recent survey and prepare analytical reports to develop or evaluate a livestock policy. A
policy of increasing meat or milk production requires analysis of many factors, such as: breed of
animals; animal feed; structures for animals; practices by farmers (disaggregated by sex); availability
of veterinary services; sex-differentiated characteristics of livestock farmers; availability of vaccines;
and quality of livestock inputs, such as medicines. Training would include guidance on the
production of a system of reports necessary for the development and evaluation of policies. Training
would also cover techniques to examine other specific issues such as the use/effects of livestock
insurance among smallholders or the regions in which certain livestock diseases are most impacting
farmers. The training would teach analytical techniques to examine and interpret the data and
12
present it as information in ways that MOA and MOP Decision Makers can use in livestock policy and
program development.
Training for Decision Makers would be designed for different categories of users, including
government agencies, development organizations, and the private sector, to understand, interpret,
and apply data to decisions. The priority category of users would be from the first category,
particularly governmental staff from Ministries of Agriculture, Economy, Gender and Women, Finance
or Planning. Training sessions would focus on priority areas identified in the Ecosystem Mapping and
Implementation Plan. An example would be a two-part training in Statistical Literacy and Applying
Data in Decision Making for mid- and senior-level management staff in the MOA and other line
Ministries. The training would build participants’ skills and knowledge in basic survey concepts, types
of statistical analyses, and understanding of/how to apply descriptive and parametric statistics. The
structure would include a one-week course, a three-month practical application period, and a one-
week follow-up course. A similar type of training program could be developed and offered with private
sector or development partner Decision Makers to ensure they are aware of and know how to use the
survey data.
c. Workshops
Workshops will be organized and implemented to bring together stakeholders to strengthen
collaboration, build connections, develop joint plans or actions, and encourage data use through
advocacy. Workshops will typically be one- to two-day event with 20–80 participants that engage
Decision Makers, Data Intermediaries and Data Producers from the following institution types: staff
from government ministries; universities, institutes and research councils; the media and journalists;
and NGOs. They can be used in cases when formal, longer-term training or technical capacity
building is not needed and when larger, more formal conferences are not necessary. These
workshops will also be necessary to expand the networks of data users beyond just the agriculture
sector to include partners working on gender and women’s issues, environment, climate change,
and other critical development areas.
In early stages of the Initiative, when there are fewer country partners, most activities will be
developed at the country-level. As the Initiative grows and more countries join, some trainings and
workshops may be developed jointly within a region, with other regional partners specializing in data
and statistics, to strengthen local/relationships and institutions, leverage synergies between
countries, and find cost-efficiencies in implementation.
d. Conferences
The Data Use component will carry out larger, more formal conferences at the global and regional
levels to promote learning across country-level experiences and provide global and regional insights
into the measurement and achievement of SDG 2.3 and 2.4, primarily among policymakers.
The Global Annual Conference will aim to (i) demonstrate how the survey data has and can be used
to answer development questions and develop policy, programmatic, and investment solutions and
(ii) showcase key examples of the application of the survey data in partner countries. A secondary aim
of the Conference is to create networks of Decision Makers among regions of the world that face
similar challenges in achieving food security and sustainable agricultural growth. Conference
participants will primarily be Decision Makers from partner country government agencies and
ministries, civil society organizations, donor/development organizations, academic institutions, and
13
private sector organizations. The Initiative will ensure that all partner countries and all sectors
described above are represented. The number of participants will range between 100–250, including
Initiative staff, with the numbers likely to increase as the Initiative grows and more countries are
included.
Additionally, a series of Regional Conferences will be conducted to promote the dissemination of
useful practices and advocacy among policymakers within the six World Bank subregions covered by
the Initiative: Latin America and the Caribbean (LAC); East Asia and the Pacific (EAP); Central Asia;
South Asia; the Middle East and North Africa (MENA); and Sub-Saharan Africa (SSA). Regional
Conferences take place on a multi-annual basis, across regions and will be organized strategically,
based on the regional distribution of onboarded Initiative countries. Staff working on the Data Use
component will engage partner countries to leverage their experiences and plan their contributions
to the Regional Conferences.
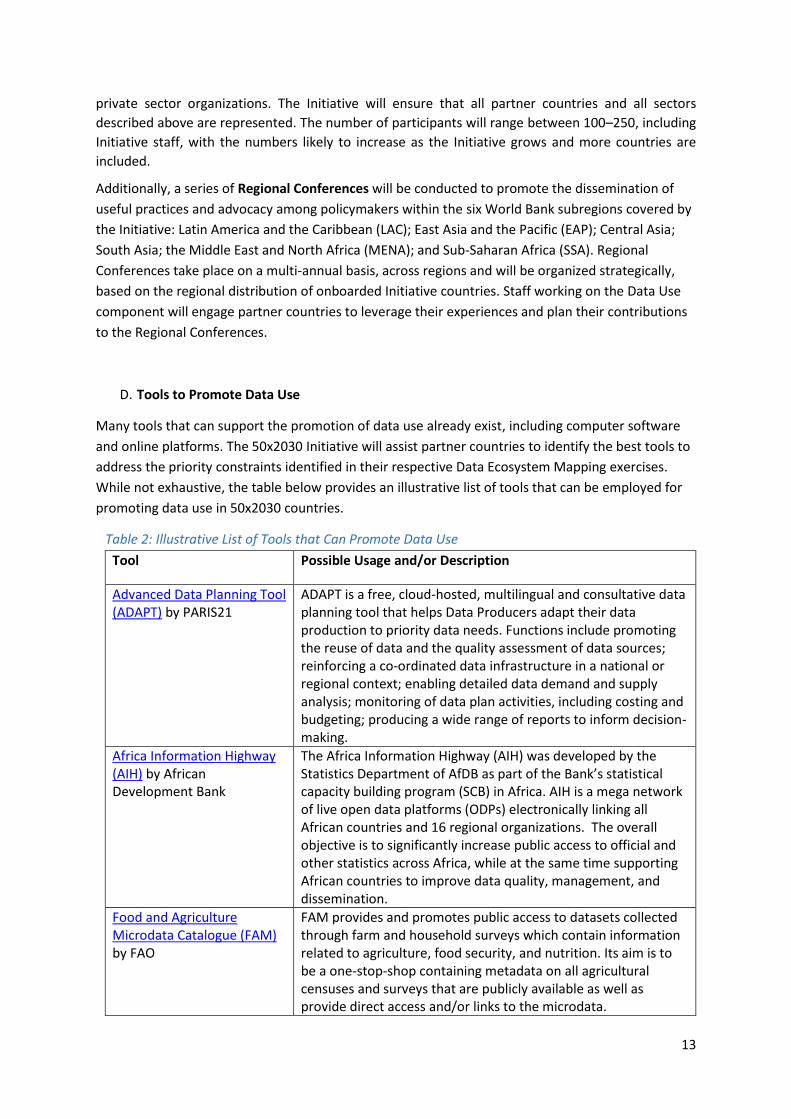
D. Tools to Promote Data Use
Many tools that can support the promotion of data use already exist, including computer software
and online platforms. The 50x2030 Initiative will assist partner countries to identify the best tools to
address the priority constraints identified in their respective Data Ecosystem Mapping exercises.
While not exhaustive, the table below provides an illustrative list of tools that can be employed for
promoting data use in 50x2030 countries.
Table 2: Illustrative List of Tools that Can Promote Data Use
Tool Possible Usage and/or Description
Advanced Data Planning Tool (ADAPT) by PARIS21
ADAPT is a free, cloud-hosted, multilingual and consultative data planning tool that helps Data Producers adapt their data production to priority data needs. Functions include promoting the reuse of data and the quality assessment of data sources; reinforcing a co-ordinated data infrastructure in a national or regional context; enabling detailed data demand and supply analysis; monitoring of data plan activities, including costing and budgeting; producing a wide range of reports to inform decision-making.
Africa Information Highway (AIH) by African Development Bank
The Africa Information Highway (AIH) was developed by the Statistics Department of AfDB as part of the Bank’s statistical capacity building program (SCB) in Africa. AIH is a mega network of live open data platforms (ODPs) electronically linking all African countries and 16 regional organizations. The overall objective is to significantly increase public access to official and other statistics across Africa, while at the same time supporting African countries to improve data quality, management, and dissemination.
Food and Agriculture Microdata Catalogue (FAM) by FAO
FAM provides and promotes public access to datasets collected through farm and household surveys which contain information related to agriculture, food security, and nutrition. Its aim is to be a one-stop-shop containing metadata on all agricultural censuses and surveys that are publicly available as well as provide direct access and/or links to the microdata.

14
Organizations which collect relevant data are also highly encouraged to submit datasets for dissemination through FAM.
QGIS QGIS (until 2013 known as Quantum GIS) is a free and open-source platform desktop geographic information system (GIS) application that supports viewing, editing, and analysis of geospatial data. The application could be used to visualize survey data by geographic disaggregation.
ReSAKSS Country eAtlas The RCeA is a GIS-based data exploration platform designed to help policy analysts and policymakers access and use high-quality and highly-disaggregated data on agricultural, socio-economic and biophysical indicators to guide agricultural policy and investment decisions.
Statistical Software Packages, including R, SPSS, Stata
These multipurpose data analysis and statistical software packages can be used for a range of needs such as data visualization and advanced analytical functions. They offer a wide array of estimation and statistical features that apply both standard and advanced statistical methods and techniques. They enable data visualization techniques which can be printed, published, and reproduced. R is a free software; SPSS and Stata have associated costs.
Tableau Tableau Public
Tableau is online data visualization software that has both free (Tableau Public) and paid versions. It is described as a business intelligence system that helps companies visualize and understand their data.
III. Interaction and Synergies with 50x2030 Data Production Activities
Promoting the use of data requires addressing all of the factors identified in the Data Use
Framework, which are linked to the various stages of the Data Cycle. While Data Use is the end
objective, the Data Use activities will need to be designed to improve the demand, availability,
access, awareness, utility and trust for data so that data will be used. As such, the activities and
actions under the Data Use Component will interact with, parallel, and build from activities
implemented under the Data Production Component.
Figure 1 shows where activities under the Data Production and Data Use components fall in the Data
Cycle. The rust-colored arrows show the links in the Data Cycle and the Data Production activities
(green arrows) and Data Use activities (blue arrows) that relate to each of those links.

15
Figure 2. Diagram of the interaction of Data Use and Production Activities along the Data Cycle

16
Annex 1
Data Ecosystem Survey Questionnaire
This survey will collect information related to the use of agricultural data in your country. Your
responses will be kept confidential and will be reviewed along with reports from multiple
respondents.
There are five sections of the questionnaire addressing the following topics:
1. Current use of data
2. Data demand and expertise
3. Data availability, awareness, and access
4. Data utility
5. Trust in data
Please provide some general information about yourself and your organization below to assist in
summarizing the survey results.
If you wish to participate beyond the survey for potential clarifications and potential follow-up
activities and projects, please provide your name and email address.
* Required
1. Respondent Name: *
2. Respondent Organization: *
3. Respondent Email Address (Optional):
4. Which of the following best describes your role? *
Mark only one oval.
Data Producer: An individual who produces data through the steps of collection,
curation/preparation, and dissemination. Data Producers work with raw survey data, generating

17
datasets and survey reports which can be utilized by Data Intermediaries for further analysis or
Decision Makers to answer questions and inform decisions.
Data Intermediary (researcher or analyst): An individual who takes existing summary
tables or microdata sets and adds value to them by conducting analyses and interpreting them
to answer questions and possibly make recommendations for action. These individuals take the
existing data generated by Data Producers and turn them into information and evidence
through an analytical process.
Decision Maker: An individual who applies the data to answer questions and inform
decisions related to programs, policies, or investments.
5. To what extent are government staff, academics, the private sector, and others using
the agricultural and rural data produced in your country for making decisions and
informing policies and programs?
Mark only one oval.
Fully used
Widely used
Somewhat used
Used a little, but not much
Not used at all
Do not know
6. Please describe ways in which you use agricultural and rural data produced in your
country.
7. If you are not able to use data but want to, what support or interventions would help
you to use it?
18
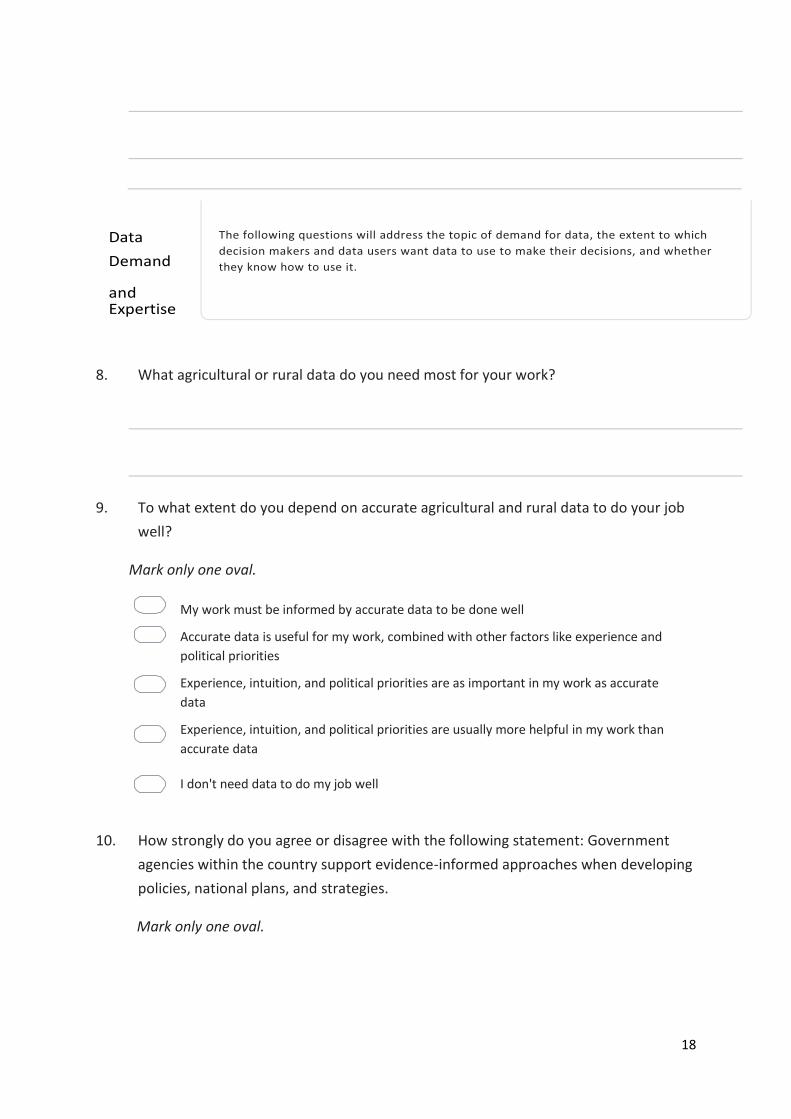
8. What agricultural or rural data do you need most for your work?
9. To what extent do you depend on accurate agricultural and rural data to do your job
well?
Mark only one oval.
My work must be informed by accurate data to be done well
Accurate data is useful for my work, combined with other factors like experience and
political priorities
Experience, intuition, and political priorities are as important in my work as accurate
data
Experience, intuition, and political priorities are usually more helpful in my work than
accurate data
I don't need data to do my job well
10. How strongly do you agree or disagree with the following statement: Government
agencies within the country support evidence-informed approaches when developing
policies, national plans, and strategies.
Mark only one oval.
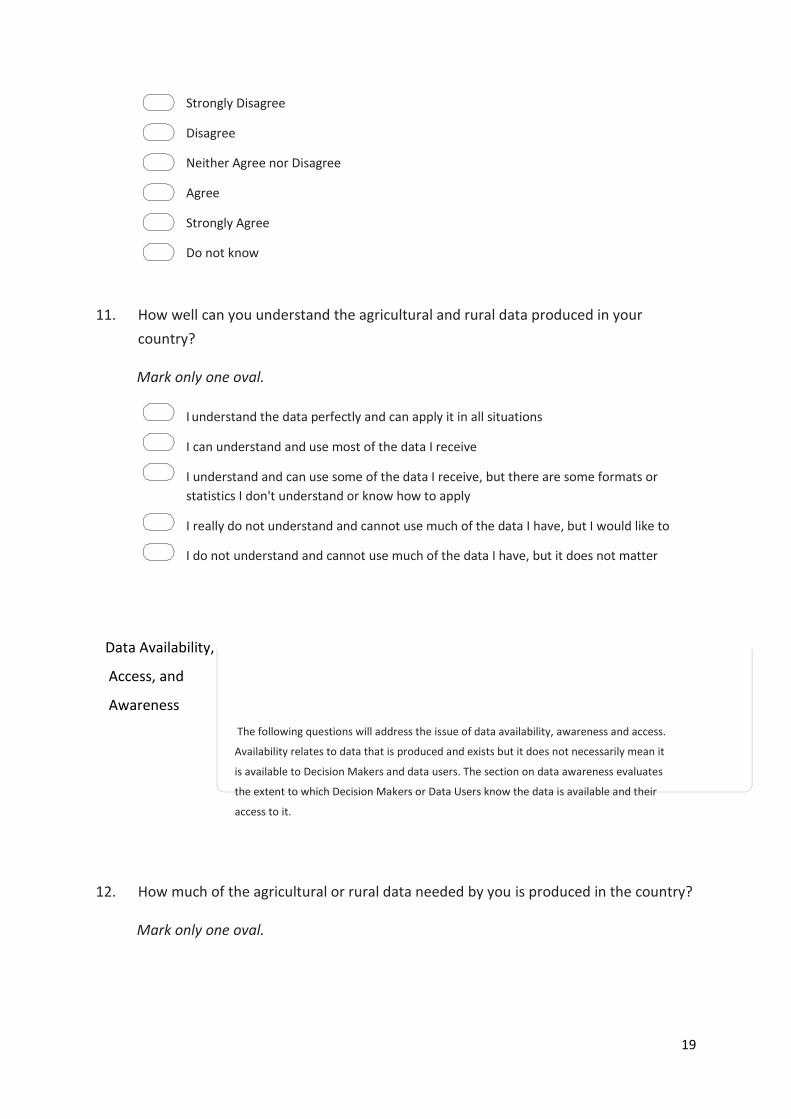
19
Strongly Disagree
Disagree
Neither Agree nor Disagree
Agree
Strongly Agree
Do not know
11. How well can you understand the agricultural and rural data produced in your
country?
Mark only one oval.
I understand the data perfectly and can apply it in all situations
I can understand and use most of the data I receive
I understand and can use some of the data I receive, but there are some formats or
statistics I don't understand or know how to apply
I really do not understand and cannot use much of the data I have, but I would like to
I do not understand and cannot use much of the data I have, but it does not matter
Data Availability,
Access, and
Awareness
The following questions will address the issue of data availability, awareness and access.
Availability relates to data that is produced and exists but it does not necessarily mean it
is available to Decision Makers and data users. The section on data awareness evaluates
the extent to which Decision Makers or Data Users know the data is available and their
access to it.
12. How much of the agricultural or rural data needed by you is produced in the country?
Mark only one oval.
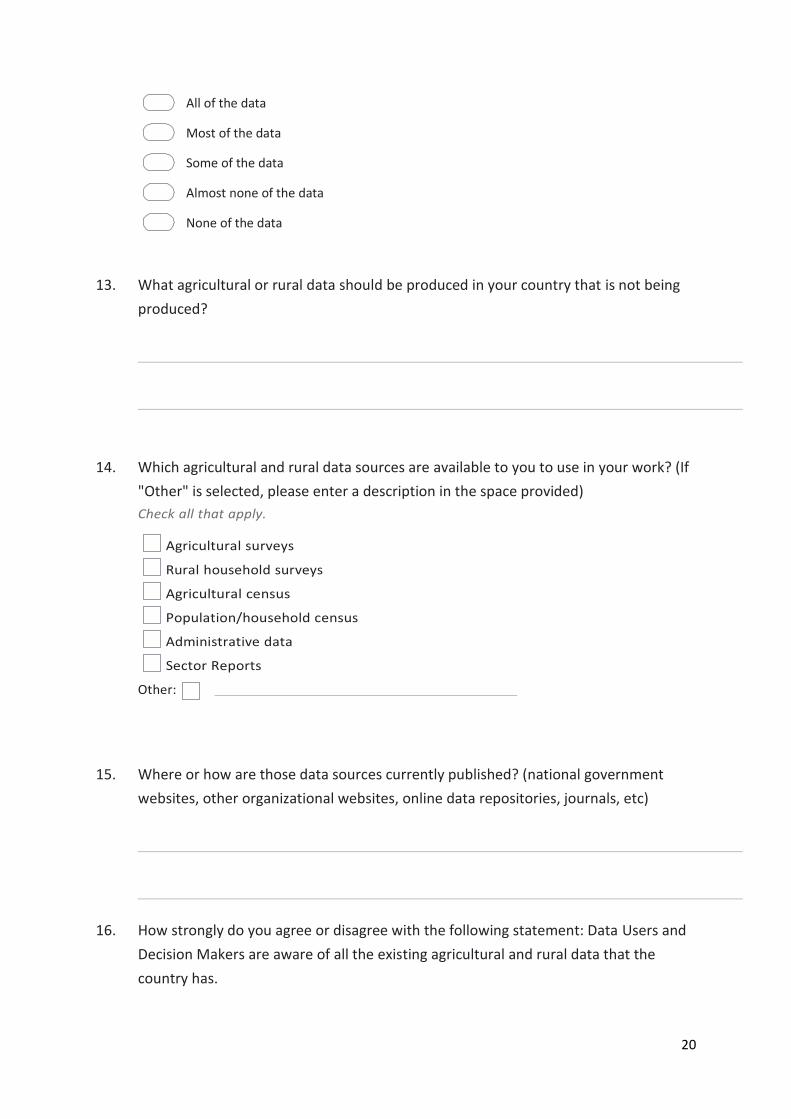
20
All of the data
Most of the data
Some of the data
Almost none of the data
None of the data
13. What agricultural or rural data should be produced in your country that is not being
produced?
14. Which agricultural and rural data sources are available to you to use in your work? (If
"Other" is selected, please enter a description in the space provided)
15. Where or how are those data sources currently published? (national government
websites, other organizational websites, online data repositories, journals, etc)
16. How strongly do you agree or disagree with the following statement: Data Users and
Decision Makers are aware of all the existing agricultural and rural data that the
country has.
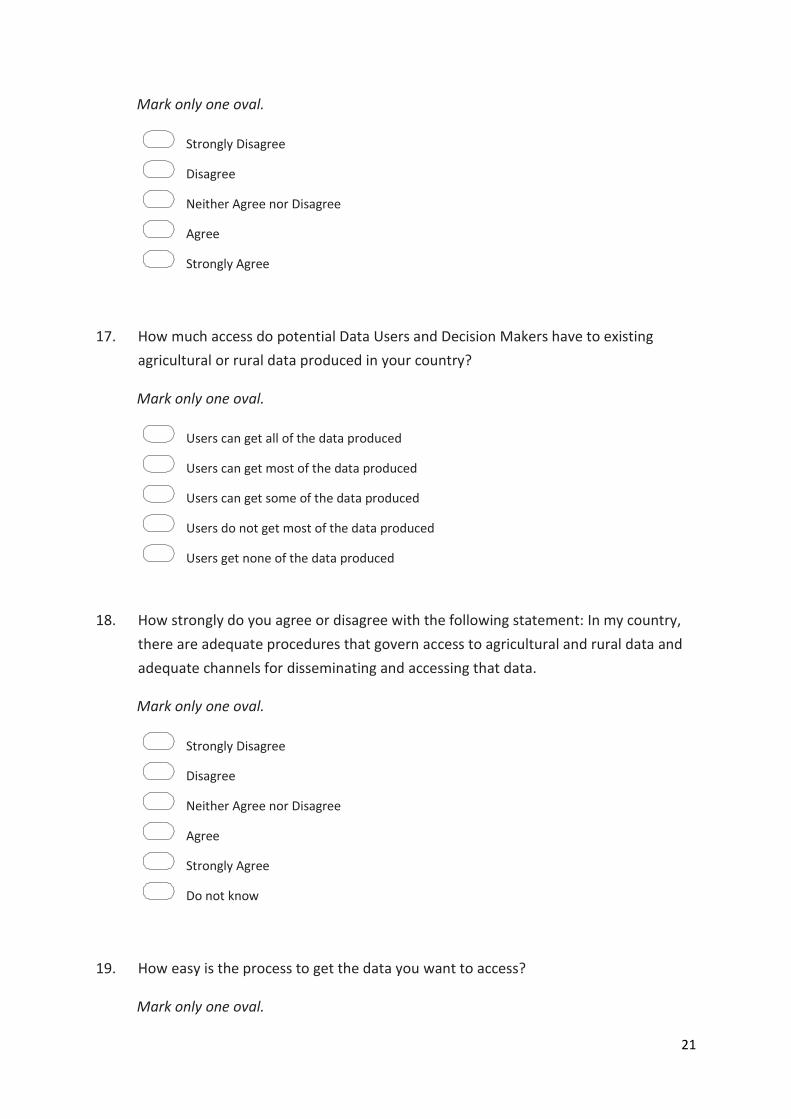
21
Mark only one oval.
Strongly Disagree
Disagree
Neither Agree nor Disagree
Agree
Strongly Agree
17. How much access do potential Data Users and Decision Makers have to existing
agricultural or rural data produced in your country?
Mark only one oval.
Users can get all of the data produced
Users can get most of the data produced
Users can get some of the data produced
Users do not get most of the data produced
Users get none of the data produced
18. How strongly do you agree or disagree with the following statement: In my country,
there are adequate procedures that govern access to agricultural and rural data and
adequate channels for disseminating and accessing that data.
Mark only one oval.
Strongly Disagree
Disagree
Neither Agree nor Disagree
Agree
Strongly Agree
Do not know
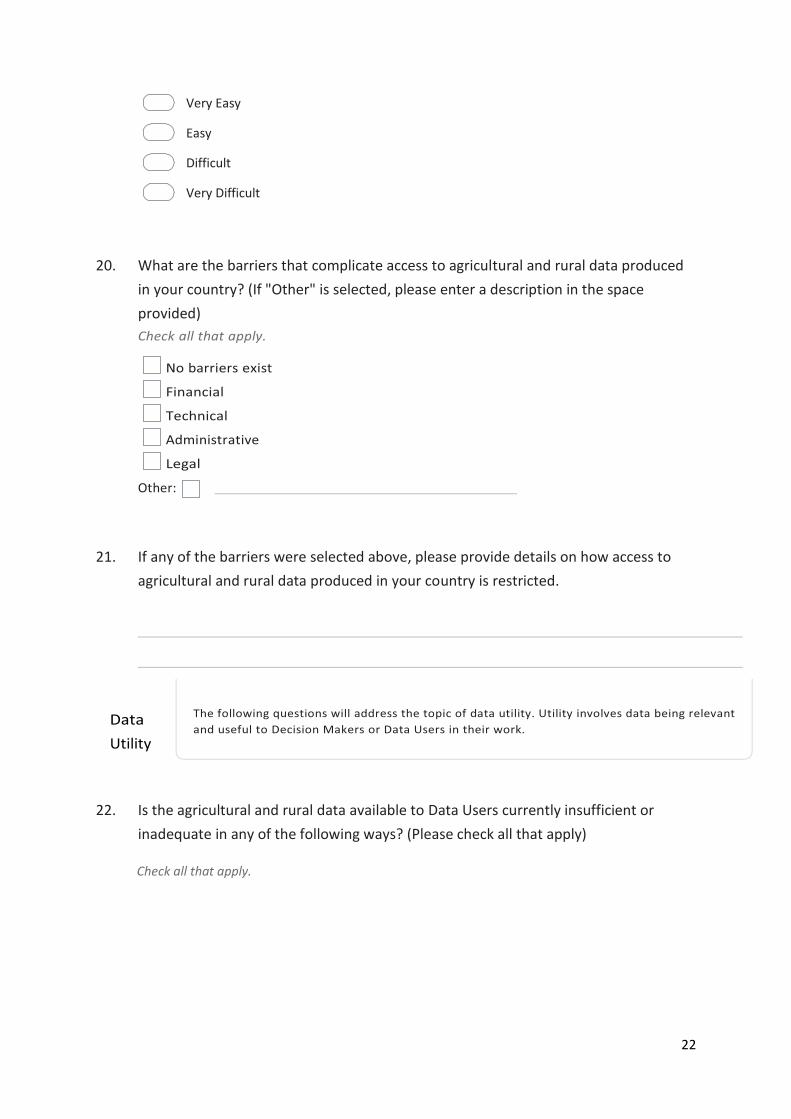
19. How easy is the process to get the data you want to access?
Mark only one oval.
22
Very Easy
Easy
Difficult
Very Difficult
20. What are the barriers that complicate access to agricultural and rural data produced
in your country? (If "Other" is selected, please enter a description in the space
provided)
21. If any of the barriers were selected above, please provide details on how access to
agricultural and rural data produced in your country is restricted.
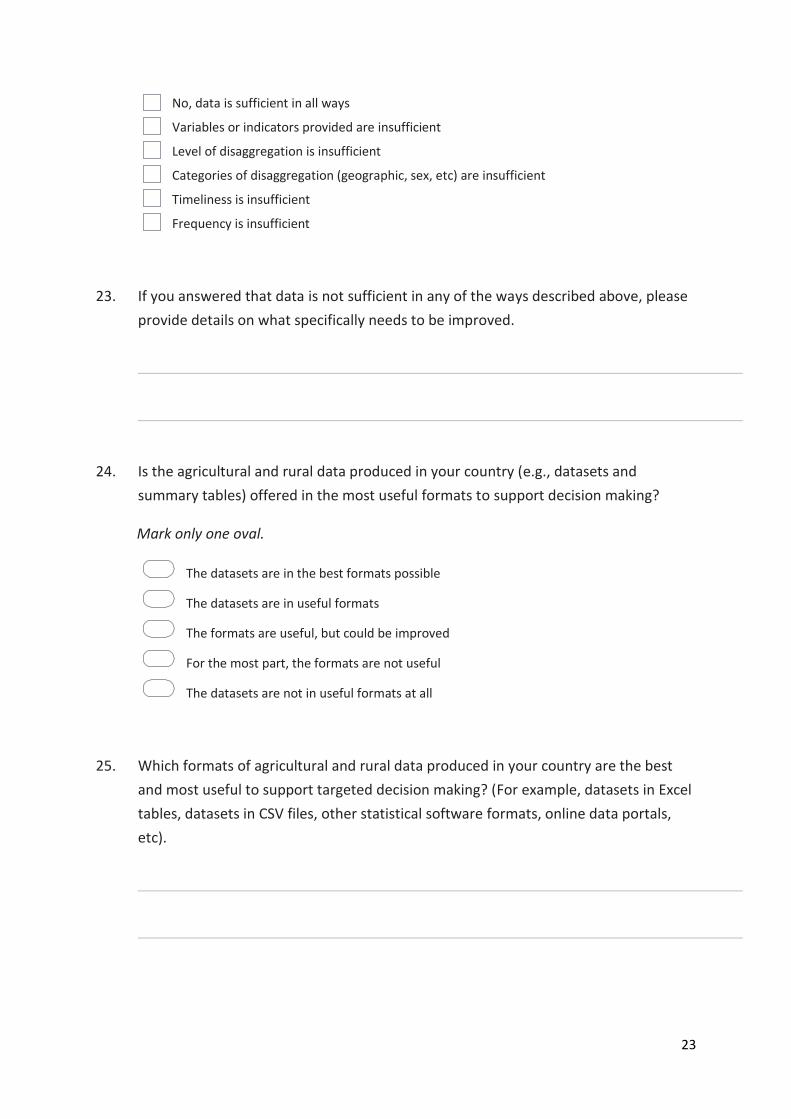
22. Is the agricultural and rural data available to Data Users currently insufficient or
inadequate in any of the following ways? (Please check all that apply)
Check all that apply.
23
No, data is sufficient in all ways
Variables or indicators provided are insufficient
Level of disaggregation is insufficient
Categories of disaggregation (geographic, sex, etc) are insufficient
Timeliness is insufficient
Frequency is insufficient
23. If you answered that data is not sufficient in any of the ways described above, please
provide details on what specifically needs to be improved.
24. Is the agricultural and rural data produced in your country (e.g., datasets and
summary tables) offered in the most useful formats to support decision making?
Mark only one oval.
The datasets are in the best formats possible
The datasets are in useful formats
The formats are useful, but could be improved
For the most part, the formats are not useful
The datasets are not in useful formats at all
25. Which formats of agricultural and rural data produced in your country are the best
and most useful to support targeted decision making? (For example, datasets in Excel
tables, datasets in CSV files, other statistical software formats, online data portals,
etc).

24
26. Is the analyzed information produced from data provided in the most useful products
(summary reports, policy briefs, infographics, push SMS) to help Decision Makers with
their work?
Mark only one oval.
The information is in the best product possible
The information is in useful products
The products are useful, but could be improved
For the most part, the products are not useful
The information is not provided in useful products at all
27. Which information products (reports, policy briefs, infographics) are the most useful
ways to provide data that support targeted decision making?
28. To what extent do you believe the agricultural or rural data made available, which
you've described in the previous section, is accurate and trustworthy?
Mark only one oval.
Completely
The majority are accurate and trustworthy
Some are accurate and trustworthy, but some are not
For the most part, the data are not accurate and can't be trusted
The data are not accurate or trustworthy at all
Do not know

25
29. If you answered that some data is not accurate or trustworthy, why do you think this
is? If "Other" is selected, please enter a description in the space provided)
Check all that apply.
The organization producing the information has insufficient capacity to produce accurate
data
The organization producing the information has insufficient capacity to protect and
manage data
Data is altered due to political interference
Other:
30. What about the agricultural or rural data and information could be improved to
increase accuracy and trustworthiness?
31. With the support of the 50x2030 Initiative, the National Statistical Office will be
conducting an agricultural or rural survey with the aim of producing much of the data
needed by Decision Makers. Which other agricultural or rural data sources could
provide similar or complementary data?
32. Are there other agricultural or rural data sources available that you think will be more
useful or important than the agricultural or rural survey the National Statistical Office
will produce?

26
Mark only one oval.
The survey will be the official source, but there are other data sources that will
complement it
The survey is important, but other sources are just as important
There are other data sources that will be more accurate and trusted
The survey data is not/will not be accurate or trustworthy at all
33. How strongly do you agree or disagree with the following statement: Agricultural and
rural data produced by the National Statistical Office is well documented and of good
quality.
Mark only one oval.
Strongly Disagree
Disagree
Neither Agree nor Disagree
Agree
Strongly Agree
Respondent Information
34. What is your age (in years)?
35. What is your sex?
Mark only one oval.
Male
Female

27
36. What is the highest degree or level of schooling you have completed? (If "Other" is
selected, please enter a description in the space provided)
Mark only one oval.
Primary school
Lower-secondary school
Post-secondary vocational or technical training
Bachelor’s degree or equivalent/University first degree
Master’s degree or equivalent
Doctoral degree or equivalent
Other
37. What field(s) best describe your educational background? (If "Other" is selected,
please enter a description in the space provided)
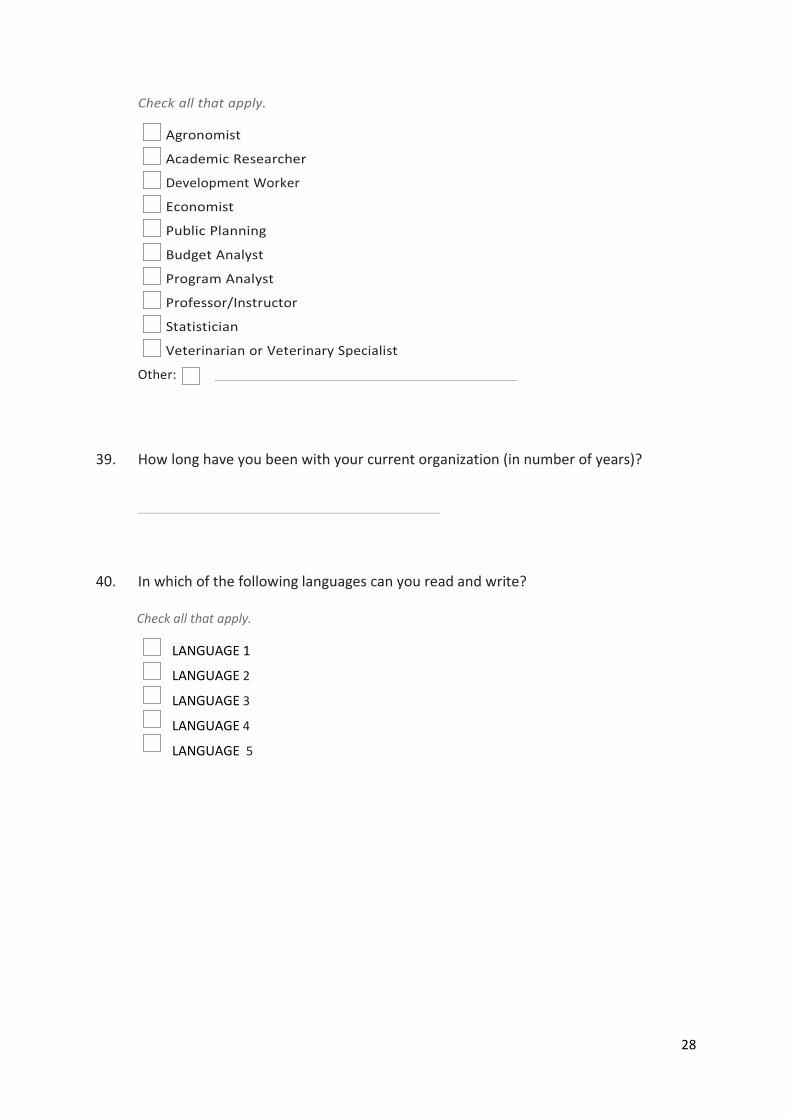
38. Which of the following best describe your current position? (If "Other" is selected,
please enter a description in the space provided)
28
39. How long have you been with your current organization (in number of years)?
40. In which of the following languages can you read and write?
Check all that apply.
LANGUAGE 1
LANGUAGE 2
LANGUAGE 3
LANGUAGE 4
LANGUAGE 5

29
Annex 2
DATA ECOSYSTEM MAPPING
STANDARD INTERVIEW PROTOCOL
Overview
This Protocol provides instructions on the script and procedures to be used for the interviews under
the 50x2030 Data Ecosystem Mapping exercise. These interviews are intended to be semi-
structured, providing a framework of the interview’s intended objectives, while allowing flexibility
for the interviewer to use her/his judgment to determine the most productive course of questioning.
Interviews conducted under the Data Ecosystem Mapping exercise may involve respondents who
have (i) already responded to the written Data Ecosystem Survey Questionnaire, building from their
responses, or (ii) not yet responded to the Survey (e.g. high-level officials).
The interviews are intended to collect information on the current status of data use and the seven
factors (and their sub-factors) that enable data use. To ensure each interview covers all needed
topics, while flowing naturally, the Protocol is organized in five sections:
1. Current use of data
2. Data demand and expertise
3. Data availability, awareness, and access
4. Data utility
5. Trust in data
Instructions to the Interviewer
Your goal is to elicit information to meet the objectives stated under each section. You should
prepare before the interview by reviewing the protocol and any background information on the
respondent before the interview. The interview will be impacted by whether the respondent has
previously completed the written Survey, and if so, the interviewer should ensure they have read the
survey responses prior to the interview. Questions should also be strategically selected or worded
based on whether the respondent is a Data Producer, Data Intermediary, or Decision Maker. The
interview should take 45 minutes to one hour, and questioning should be developed accordingly.
Suggested Interview Script
Good morning (afternoon). My name is . I work for and am
helping conduct interviews that are part of the assessment of the data ecosystem for the 50x2030
Initiative. Thank you for your time today. Your input is really important to helping us understand how
agricultural and rural data are being used to inform decisions in COUNTRY and any reasons as
to why data and information aren’t being used in the decision-making process.
The purpose of this interview is to get information on your experiences and thoughts on the use of
agricultural and rural data in COUNTRY . We asked you to participate in an interview
because of (provide appropriate reason such as…your role in your organization, your involvement
30
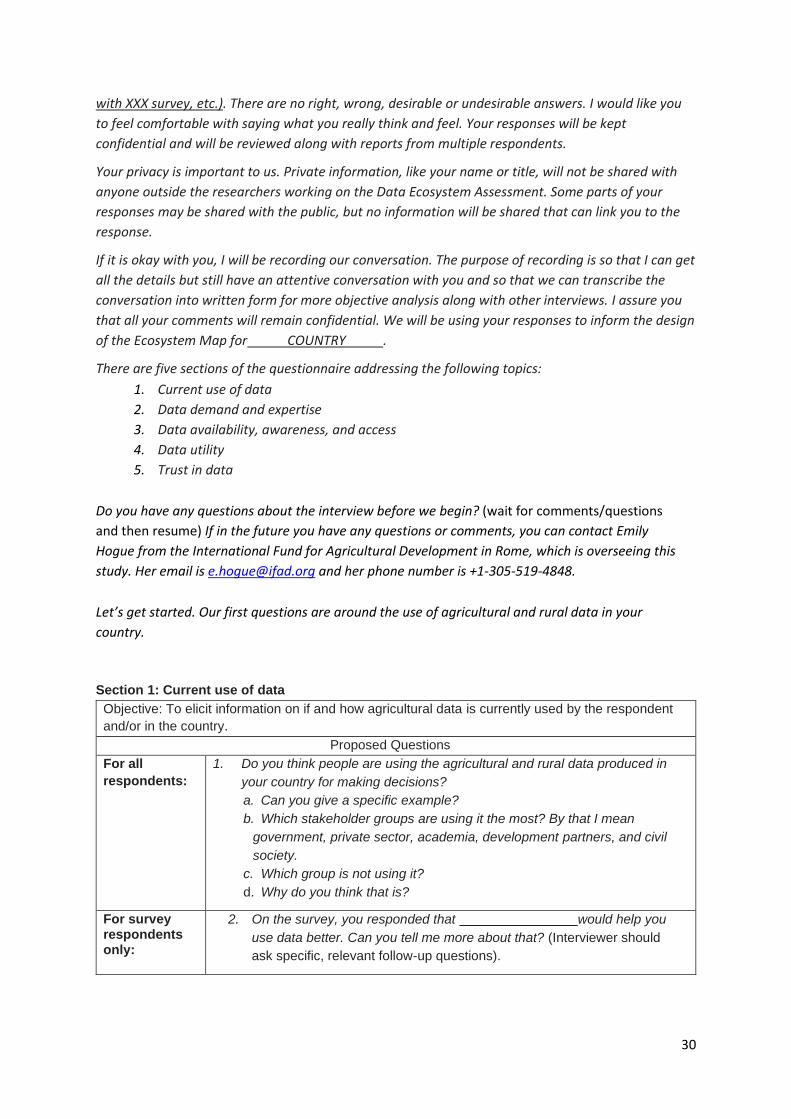
with XXX survey, etc.). There are no right, wrong, desirable or undesirable answers. I would like you
to feel comfortable with saying what you really think and feel. Your responses will be kept
confidential and will be reviewed along with reports from multiple respondents.
Your privacy is important to us. Private information, like your name or title, will not be shared with
anyone outside the researchers working on the Data Ecosystem Assessment. Some parts of your
responses may be shared with the public, but no information will be shared that can link you to the
response.
If it is okay with you, I will be recording our conversation. The purpose of recording is so that I can get
all the details but still have an attentive conversation with you and so that we can transcribe the
conversation into written form for more objective analysis along with other interviews. I assure you
that all your comments will remain confidential. We will be using your responses to inform the design
of the Ecosystem Map for COUNTRY .
There are five sections of the questionnaire addressing the following topics:
1. Current use of data
2. Data demand and expertise
3. Data availability, awareness, and access
4. Data utility
5. Trust in data
Do you have any questions about the interview before we begin? (wait for comments/questions
and then resume) If in the future you have any questions or comments, you can contact Emily
Hogue from the International Fund for Agricultural Development in Rome, which is overseeing this
study. Her email is [email protected] and her phone number is +1-305-519-4848.
Let’s get started. Our first questions are around the use of agricultural and rural data in your
country.
Section 1: Current use of data
Objective: To elicit information on if and how agricultural data is currently used by the respondent
and/or in the country.
Proposed Questions
For all
respondents:
1. Do you think people are using the agricultural and rural data produced in
your country for making decisions?
a. Can you give a specific example?
b. Which stakeholder groups are using it the most? By that I mean
government, private sector, academia, development partners, and civil
society.
c. Which group is not using it?
d. Why do you think that is?
For survey respondents only:
2. On the survey, you responded that would help you
use data better. Can you tell me more about that? (Interviewer should
ask specific, relevant follow-up questions).
31
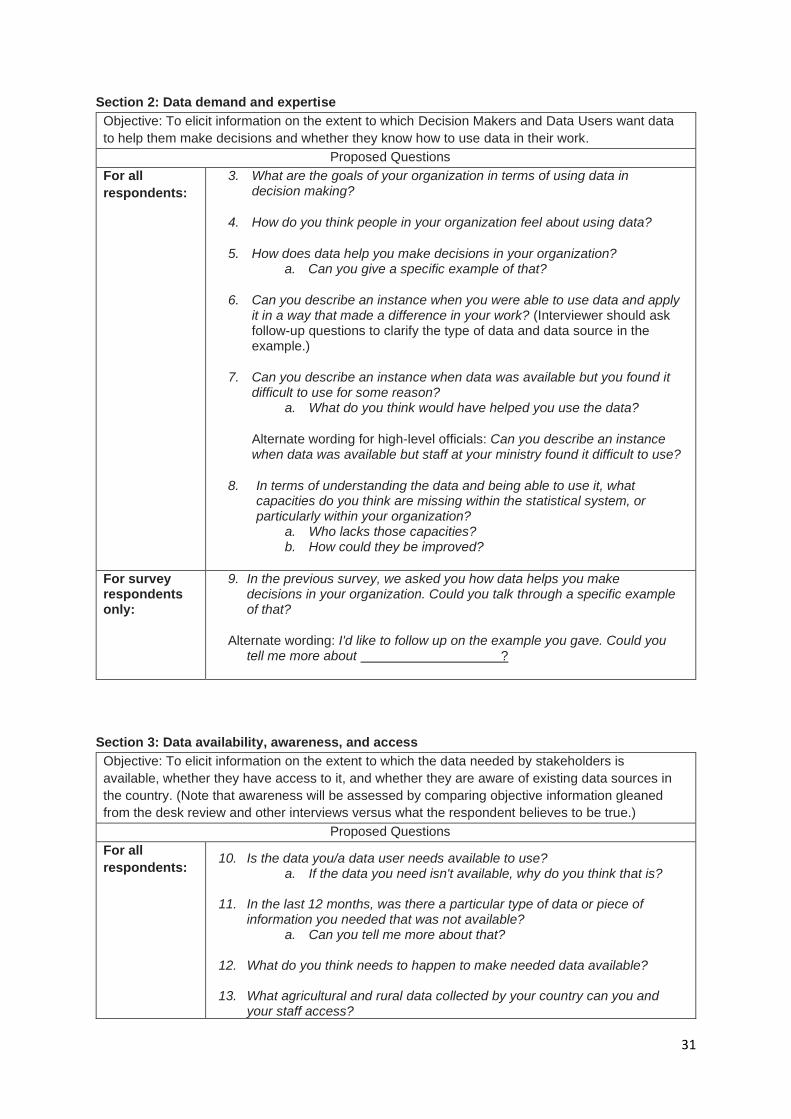
Section 2: Data demand and expertise
Objective: To elicit information on the extent to which Decision Makers and Data Users want data
to help them make decisions and whether they know how to use data in their work.
Proposed Questions
For all
respondents:
3. What are the goals of your organization in terms of using data in decision making?
4. How do you think people in your organization feel about using data?
5. How does data help you make decisions in your organization? a. Can you give a specific example of that?
6. Can you describe an instance when you were able to use data and apply it in a way that made a difference in your work? (Interviewer should ask follow-up questions to clarify the type of data and data source in the example.)
7. Can you describe an instance when data was available but you found it difficult to use for some reason?
a. What do you think would have helped you use the data?
Alternate wording for high-level officials: Can you describe an instance when data was available but staff at your ministry found it difficult to use?
8. In terms of understanding the data and being able to use it, what capacities do you think are missing within the statistical system, or particularly within your organization?
a. Who lacks those capacities? b. How could they be improved?
For survey respondents only:
9. In the previous survey, we asked you how data helps you make decisions in your organization. Could you talk through a specific example of that?
Alternate wording: I'd like to follow up on the example you gave. Could you tell me more about ?
Section 3: Data availability, awareness, and access
Objective: To elicit information on the extent to which the data needed by stakeholders is
available, whether they have access to it, and whether they are aware of existing data sources in
the country. (Note that awareness will be assessed by comparing objective information gleaned
from the desk review and other interviews versus what the respondent believes to be true.)
Proposed Questions
For all
respondents: 10. Is the data you/a data user needs available to use?
a. If the data you need isn't available, why do you think that is?
11. In the last 12 months, was there a particular type of data or piece of information you needed that was not available?
a. Can you tell me more about that?
12. What do you think needs to happen to make needed data available?
13. What agricultural and rural data collected by your country can you and your staff access?

32
a. What isn't available to you?
14. What agricultural and rural data can the public access? What isn't available to the public?
For survey respondents only:
15. In your survey response, you listed X as a barrier to accessing data. a. Can you explain that a bit more? b. How do you think that barrier could be removed?
Section 4: Data utility
Objective: To elicit information on whether generated data and data products are relevant and
useful to Decision Makers and how they could be made more useful.
Proposed Questions
For all
respondents: 16. Of the agricultural and rural data produced in your country that you have
used, was any not useful to you for some reason? a. Why do you think that was?
17. How could the data available be more useful?
18. Could the formats in which the data is provided be made more useful?
a. How? b. (Interviewer can prompt about data platforms, report types,
microdata sets, and other data products.)
19. What would be the best way for you to receive the information you need? a. (Interviewer can give examples of reports, presentations, text
messaging, infographics/flyers, etc.)
20. Is there any way to make the information products you currently receive more useful?
For survey respondents only:
21. On the survey, you said were the most useful ways to receive data for targeted decision making, do you have any good examples of that from your experience?
Section 5: Trust in data
Objective: To elicit information on whether data is trusted and believed to be accurate and if not,
why not.
Proposed Questions
For all
respondents:
22. How much do you trust the quality of the data you receive now?
a. Why is that?
23. Do you think ORGANIZATION has the right capacities and staff to
produce the needed data?
a. What could be improved?
24. Beside capacity constraints, are there any other reasons the data
released is not accurate?
25. Are there other data sources that are as important or more important
than the [INSERT NAME OF ANNUAL AGRICULTURAL AND RURAL
SURVEY]?
a. How do they address data needs better than the [SURVEY]?
33
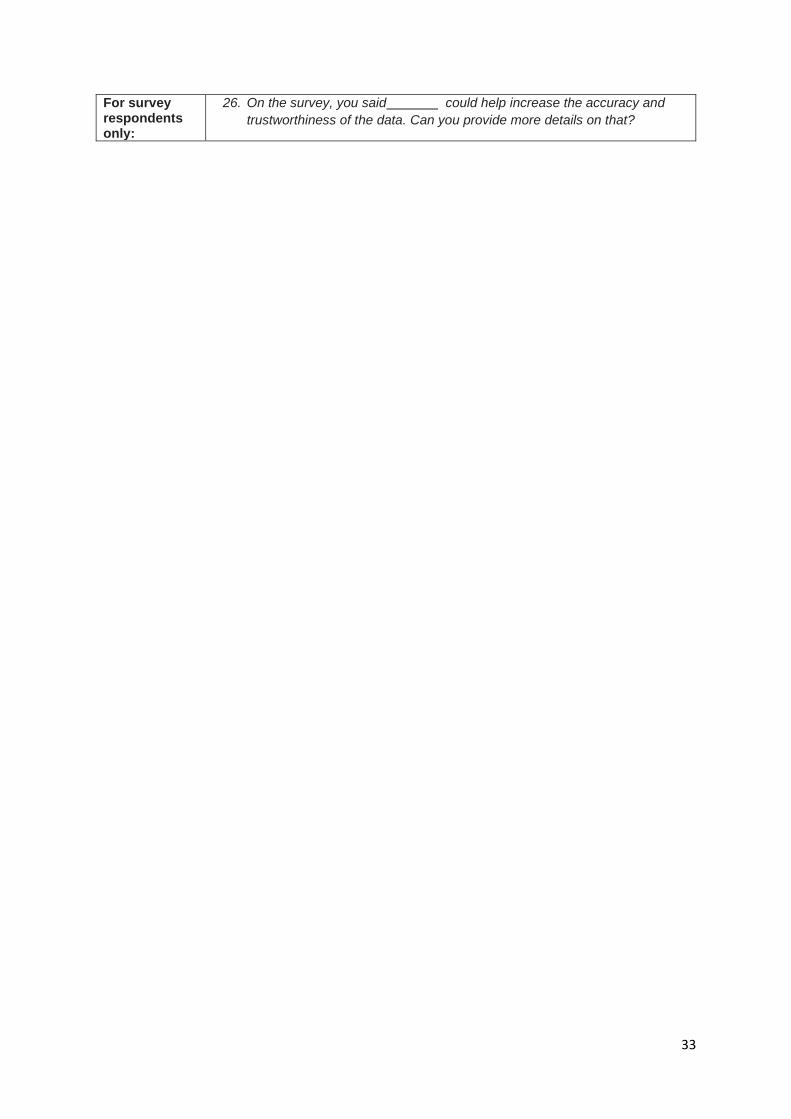
For survey respondents only:
26. On the survey, you said could help increase the accuracy and
trustworthiness of the data. Can you provide more details on that?