Technology Trends series Business: Full Speed Ahead Dr. Bjarne Berg.
Upload
jocelyn-waltonCategory
view
240download
15
A guide to plan,manage, & execute a
successful BI Project
Dr. Bjarne Berg
2
What We’ll Cover
• Overview BI and Data Warehousing
• Budgeting, staffing and scoping a project
• Selecting an OLAP Tool
• What are the ERP-BI vendors doing – a look at SAP, Oracle, PeopleSoft, Siebel, JDE’s BI tools
• The future of BI
• Wrap up
3
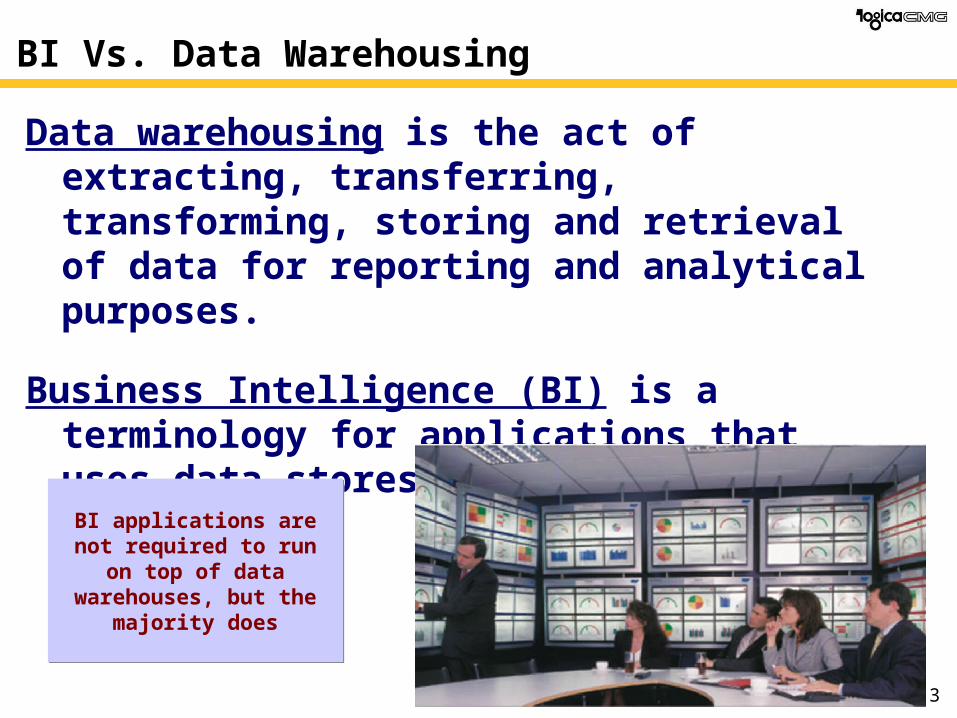
BI Vs. Data Warehousing
Data warehousing is the act of extracting, transferring, transforming, storing and retrieval of data for reporting and analytical purposes.
Business Intelligence (BI) is a terminology for applications that uses data stores for analytical purposes.
BI applications are not required to run on top of data warehouses, but the
majority does
BI applications are not required to run on top of data warehouses, but the
majority does
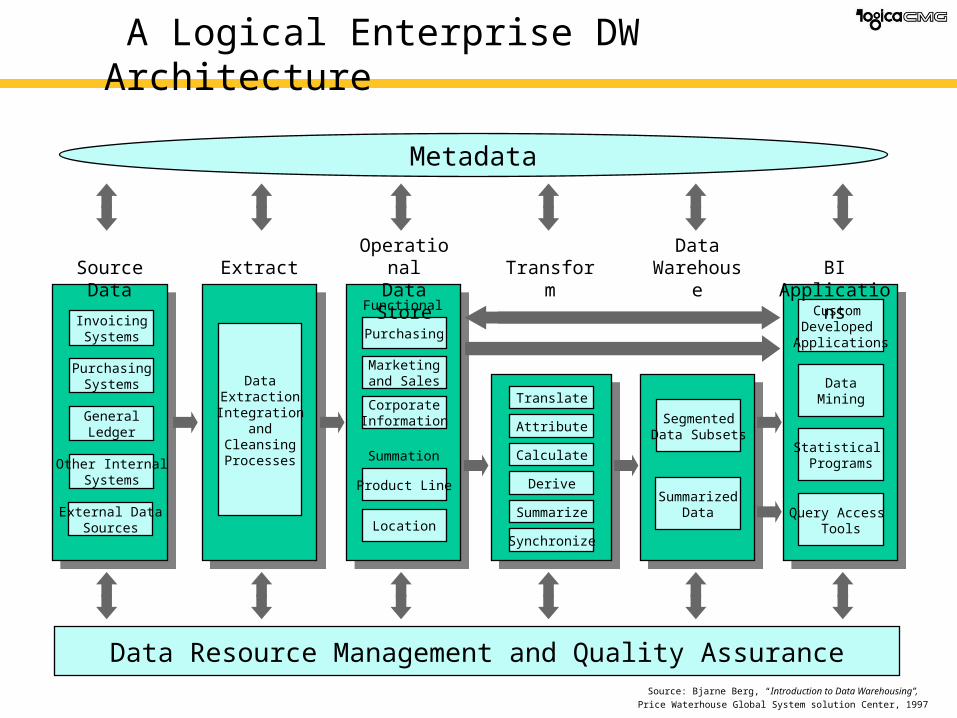
A Logical Enterprise DW Architecture
Metadata
DataExtractionIntegration
andCleansingProcesses
Custom Developed Applications
DataMining
Statistical Programs
Query Access Tools
Data Resource Management and Quality Assurance
SummarizedData
SegmentedData Subsets
Functional Area
Summation
Marketingand Sales
Purchasing
CorporateInformation
Product Line
Location
PurchasingSystems
InvoicingSystems
GeneralLedger
External DataSources
Other InternalSystems
Translate
Attribute
Calculate
Derive
Summarize
Synchronize
Source Data ExtractOperationalData Store Transform
DataWarehouse BI Applications
Source: Bjarne Berg, “Introduction to Data Warehousing”,
Price Waterhouse Global System solution Center, 1997
5
Level of Pre-delivered ContentToolsets & accelerators
Analytical applications for specific industries
Lev
el o
f E
mb
edde
d A
naly
t ics
Complex (score cards, budgeting, planning, KPI)
Interactive Mgmt. reporting (OLAP, MQE)
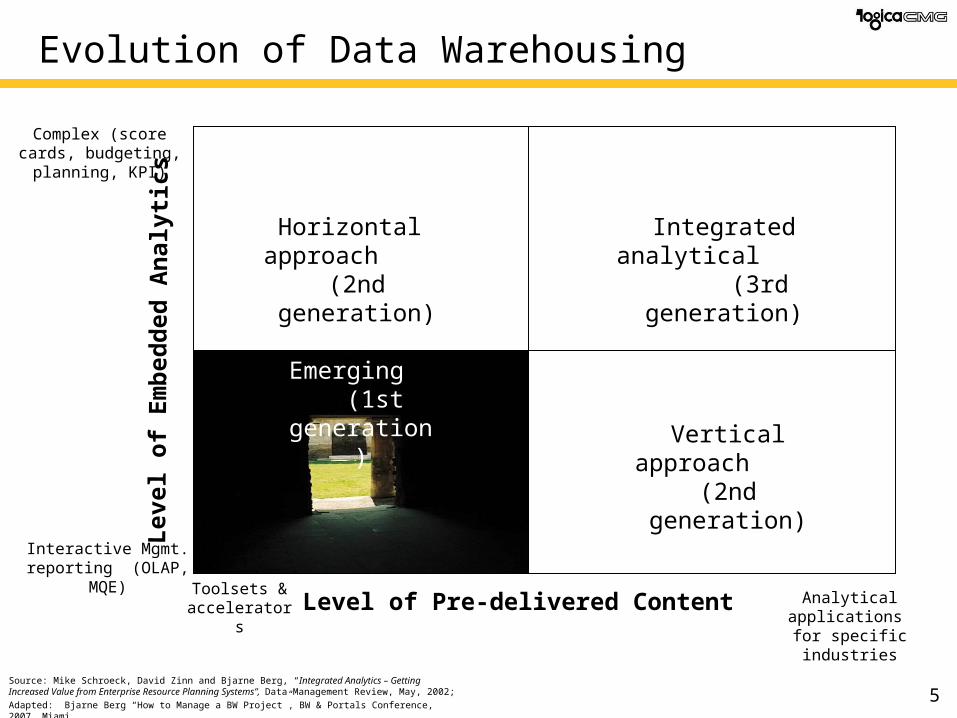
Evolution of Data Warehousing
Emerging (1st generation)
Vertical approach (2nd generation)
Horizontal approach (2nd generation)
Integrated analytical (3rd generation)
Source: Mike Schroeck, David Zinn and Bjarne Berg, “Integrated Analytics – Getting Increased Value from Enterprise Resource Planning Systems”, Data Management Review, May, 2002;
Adapted: Bjarne Berg “How to Manage a BW Project”, BW & Portals Conference, 2007, Miami
6
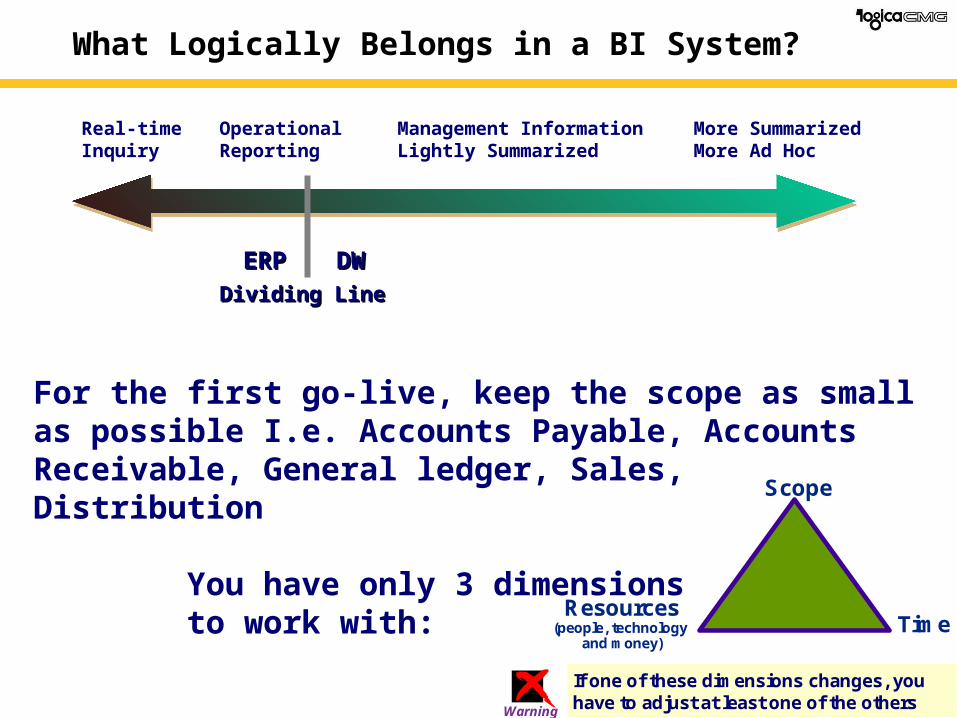
OperationalReporting
More SummarizedMore Ad Hoc
Management InformationLightly Summarized
Real-timeInquiry
Dividing LineDividing Line
ERPERP DWDW
What Logically Belongs in a BI System?
For the first go-live, keep the scope as small as possible I.e. Accounts Payable, Accounts Receivable, General ledger, Sales, Distribution
You have only 3 dimensions to work with:
Time
Scope
Resources(people, technology
and money)
If one of these dimensions changes, you have to adjust at least one of the othersWarning
7
What We’ll Cover
• Overview BI and Data Warehousing
• Budgeting, staffing and scoping a project
• Selecting an OLAP Tool
• What are the ERP-BI vendors doing – a look at SAP, Oracle, PeopleSoft, Siebel, JDE’s BI tools
• The future of BI
• Wrap up
8
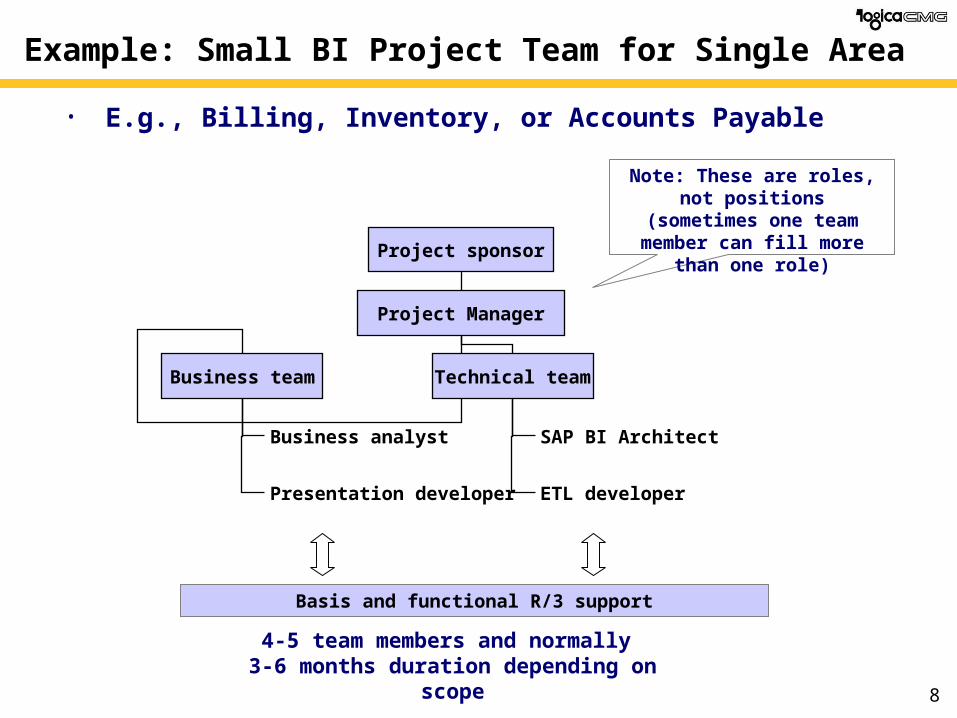
Example: Small BI Project Team for Single Area
• E.g., Billing, Inventory, or Accounts Payable
4-5 team members and normally 3-6 months duration depending on scope
Basis and functional R/3 support
Project sponsor
Project Manager
Business team Technical team
Business analyst
Presentation developer
SAP BI Architect
ETL developer
Note: These are roles, not positions (sometimes one team member can fill more
than one role)

9
Example: Mid-sized BI Project, Single Complex Subject
• E.g., Global Cost and Profitability, international cross organization or consolidated billing
Basis and functional R/3 support
8-10 team members and normally 2-4 months duration depending on scope
Project sponsor/ Steering
Committee
Project Manager
SAP BW
Architect
Business
Analyst(s)
Extract, Transforms and Loads
Data Management(InfoCubes &
ODS)
Presentation
Developer(s)
Sr. Business analyst
Business analyst
Sr. ETL developer
ETL developer
Sr. SAP BI developer
SAP BI developer
Sr. Presentation
developer
Presentation developer
Note: These are roles, not positions (sometimes one team member can fill more
than one role)
10
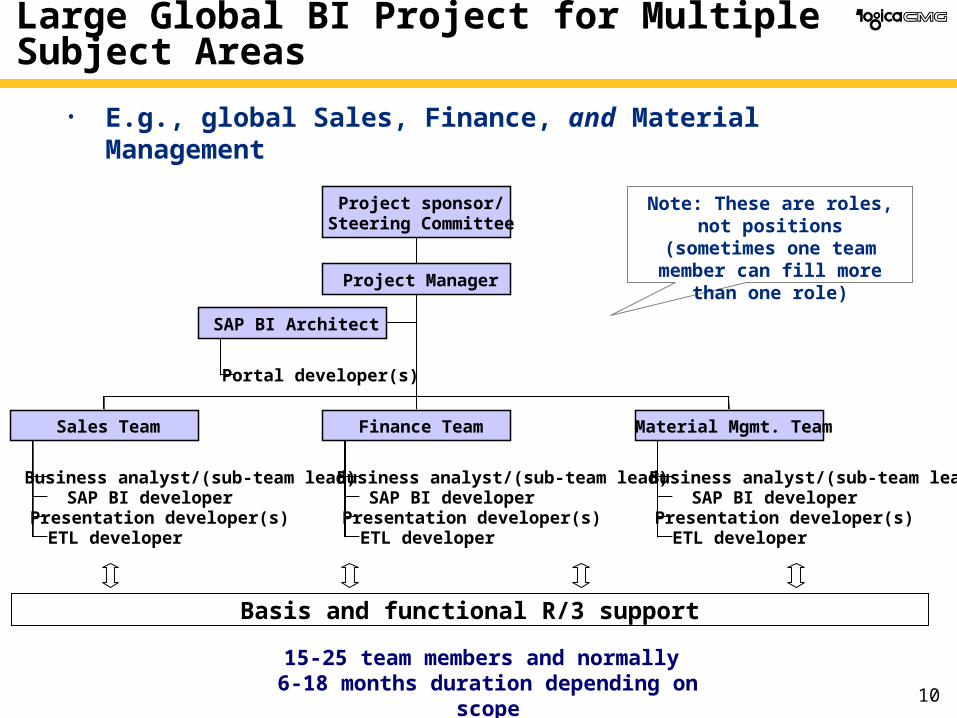
Large Global BI Project for Multiple Subject Areas
• E.g., global Sales, Finance, and Material Management
Basis and functional R/3 support
15-25 team members and normally 6-18 months duration depending on scope
Portal developer(s)
SAP BI Architect
Business analyst/(sub-team lead) SAP BI developer
Presentation developer(s)ETL developer
Sales Team
Business analyst/(sub-team lead) SAP BI developer
Presentation developer(s)ETL developer
Finance Team
Business analyst/(sub-team lead) SAP BI developer
Presentation developer(s)ETL developer
Material Mgmt. Team
Project Manager
Project sponsor/Steering Committee
Note: These are roles, not positions (sometimes one team member can fill more
than one role)
11
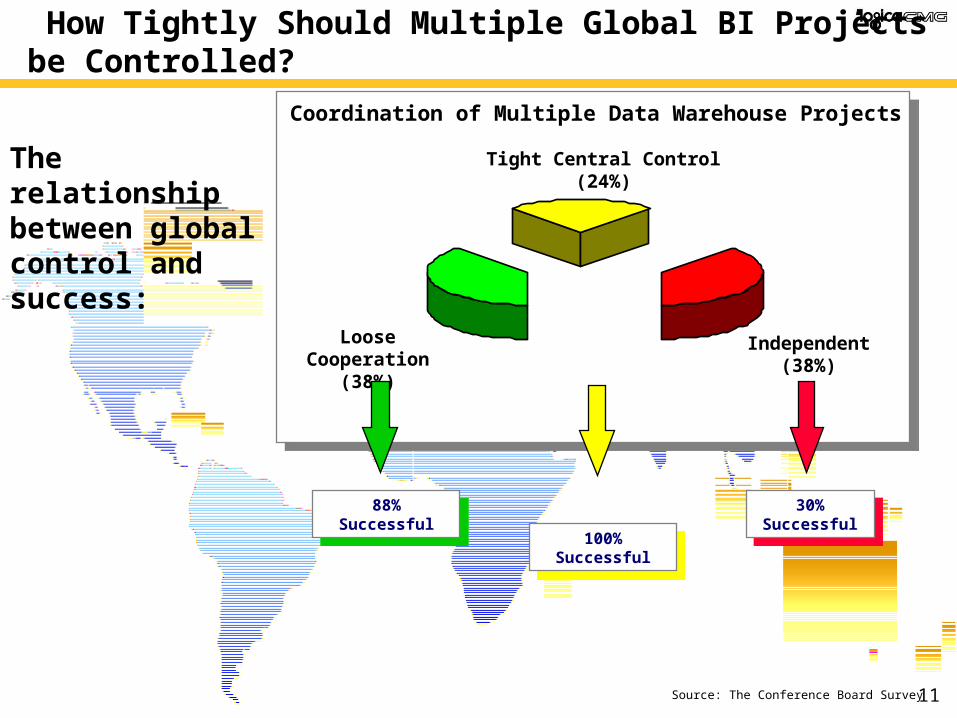
How Tightly Should Multiple Global BI Projects be Controlled?
Source: The Conference Board Survey
The relationship between global control and success:
88% Successful88% Successful 30% Successful30% Successful
Loose Cooperation(38%)
Independent(38%)
Tight Central Control(24%)
100% Successful100% Successful
Coordination of Multiple Data Warehouse Projects
12
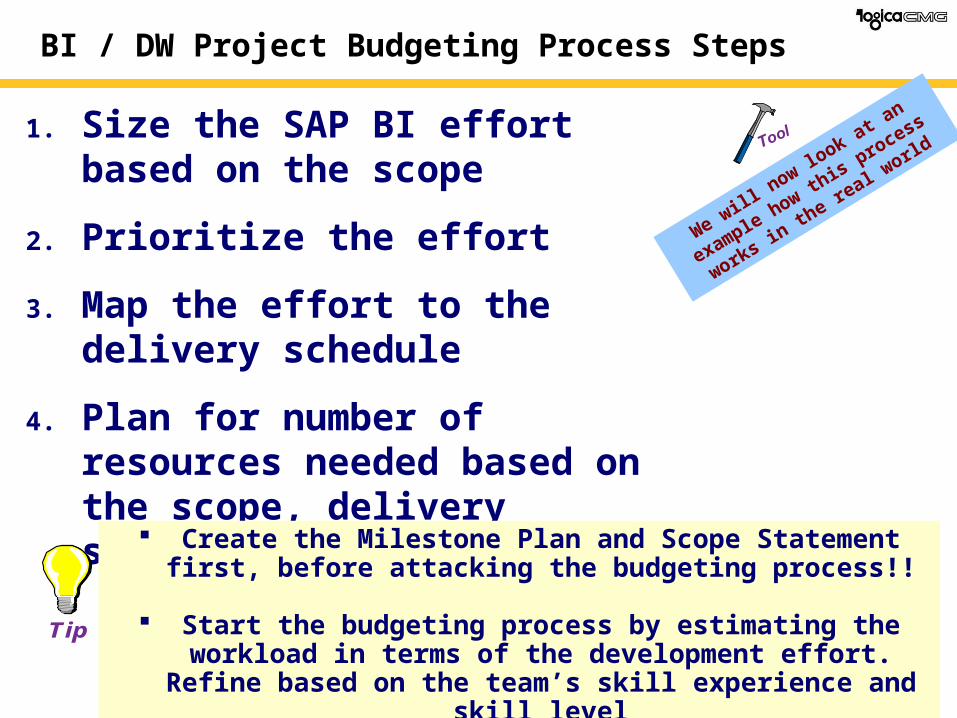
BI / DW Project Budgeting Process Steps
1. Size the SAP BI effort based on the scope
2. Prioritize the effort
3. Map the effort to the delivery schedule
4. Plan for number of resources needed based on the scope, delivery schedule and the effort.
Create the Milestone Plan and Scope Statement first, before attacking the budgeting process!!
Start the budgeting process by estimating the workload in terms of the development effort. Refine based on the team’s skill experience and skill
level
We will now lo
ok at an example
how this process works in
the
real world
Tip
13
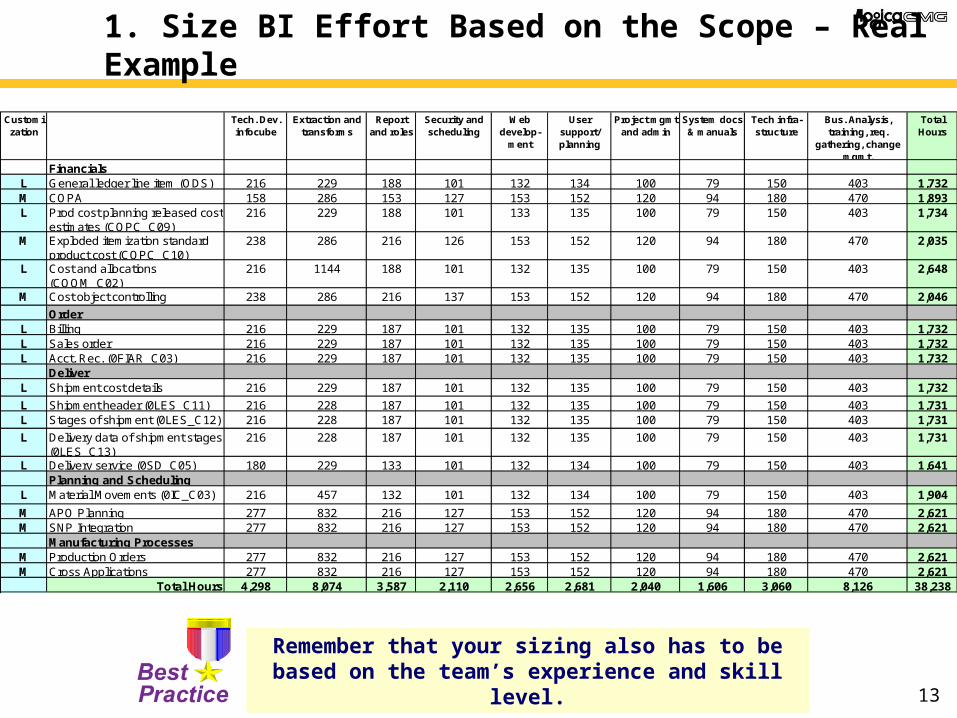
1. Size BI Effort Based on the Scope – Real Example
Customization
Tech. Dev. infocube
Extraction and transforms
Report and roles
Security and scheduling
Web develop-
ment
User support/ planning
Project mgmt and admin
System docs & manuals
Tech infra-structure
Bus. Analysis, training, req.
gathering, change mgmt.
Total Hours
FinancialsL General ledger line item (ODS) 216 229 188 101 132 134 100 79 150 403 1,732M COPA 158 286 153 127 153 152 120 94 180 470 1,893L Prod cost planning released cost
estimates (COPC_C09)216 229 188 101 133 135 100 79 150 403 1,734
M Exploded itemization standard product cost (COPC_C10)
238 286 216 126 153 152 120 94 180 470 2,035
L Cost and allocations (COOM_C02)
216 1144 188 101 132 135 100 79 150 403 2,648
M Cost object controlling (0PC_C01)
238 286 216 137 153 152 120 94 180 470 2,046
Order L Billing 216 229 187 101 132 135 100 79 150 403 1,732L Sales order 216 229 187 101 132 135 100 79 150 403 1,732L Acct. Rec. (0FIAR_C03) 216 229 187 101 132 135 100 79 150 403 1,732
Deliver L Shipment cost details
(0LES_C02)216 229 187 101 132 135 100 79 150 403 1,732
L Shipment header (0LES_C11) 216 228 187 101 132 135 100 79 150 403 1,731L Stages of shipment (0LES_C12) 216 228 187 101 132 135 100 79 150 403 1,731
L Delivery data of shipment stages (0LES_C13)
216 228 187 101 132 135 100 79 150 403 1,731
L Delivery service (0SD_C05) 180 229 133 101 132 134 100 79 150 403 1,641Planning and Scheduling
L Material Movements (0IC_C03) 216 457 132 101 132 134 100 79 150 403 1,904
M APO Planning 277 832 216 127 153 152 120 94 180 470 2,621M SNP Integration 277 832 216 127 153 152 120 94 180 470 2,621
Manufacturing Processes M Production Orders 277 832 216 127 153 152 120 94 180 470 2,621M Cross Applications 277 832 216 127 153 152 120 94 180 470 2,621
Total Hours 4,298 8,074 3,587 2,110 2,656 2,681 2,040 1,606 3,060 8,126 38,238
Remember that your sizing also has to be based on the team’s experience and skill level.
14
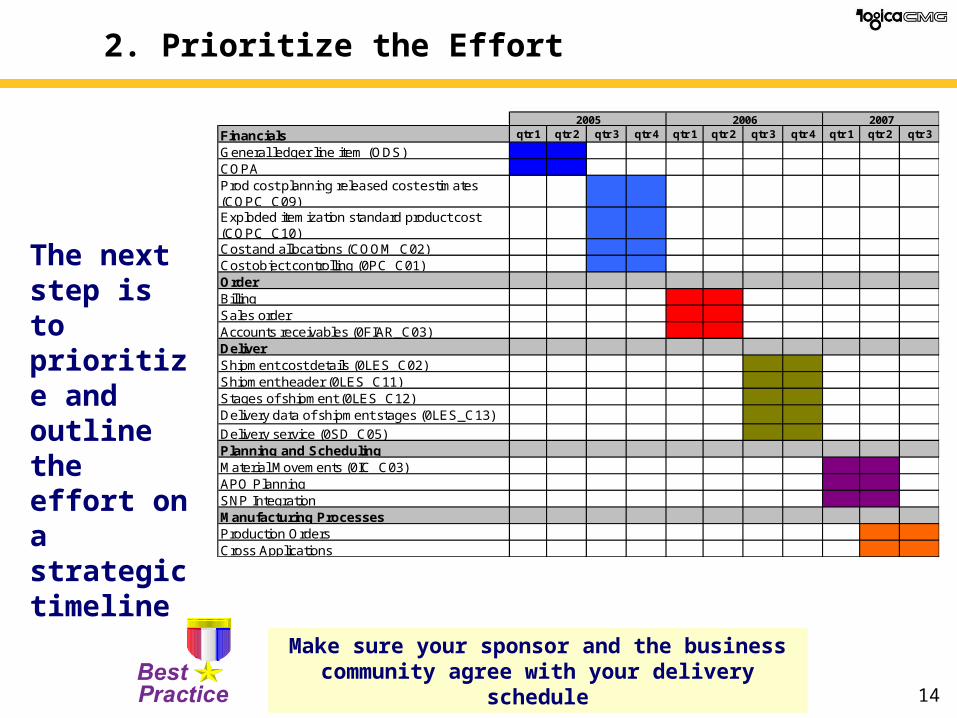
2. Prioritize the Effort
Financials qtr 1 qtr 2 qtr 3 qtr 4 qtr 1 qtr 2 qtr 3 qtr 4 qtr 1 qtr 2 qtr 3
General ledger line item (ODS)COPAProd cost planning released cost estimates (COPC_C09)Exploded itemization standard product cost (COPC_C10)Cost and allocations (COOM_C02)Cost object controlling (0PC_C01)Order Billing Sales orderAccounts receivables (0FIAR_C03)Deliver Shipment cost details (0LES_C02)Shipment header (0LES_C11)Stages of shipment (0LES_C12)Delivery data of shipment stages (0LES_C13)
Delivery service (0SD_C05)Planning and Scheduling Material Movements (0IC_C03)APO PlanningSNP IntegrationManufacturing Processes Production OrdersCross Applications
2005 2006 2007
The next step is to prioritize and outline the effort on a strategic timeline
Make sure your sponsor and the business community agree with your delivery schedule
15
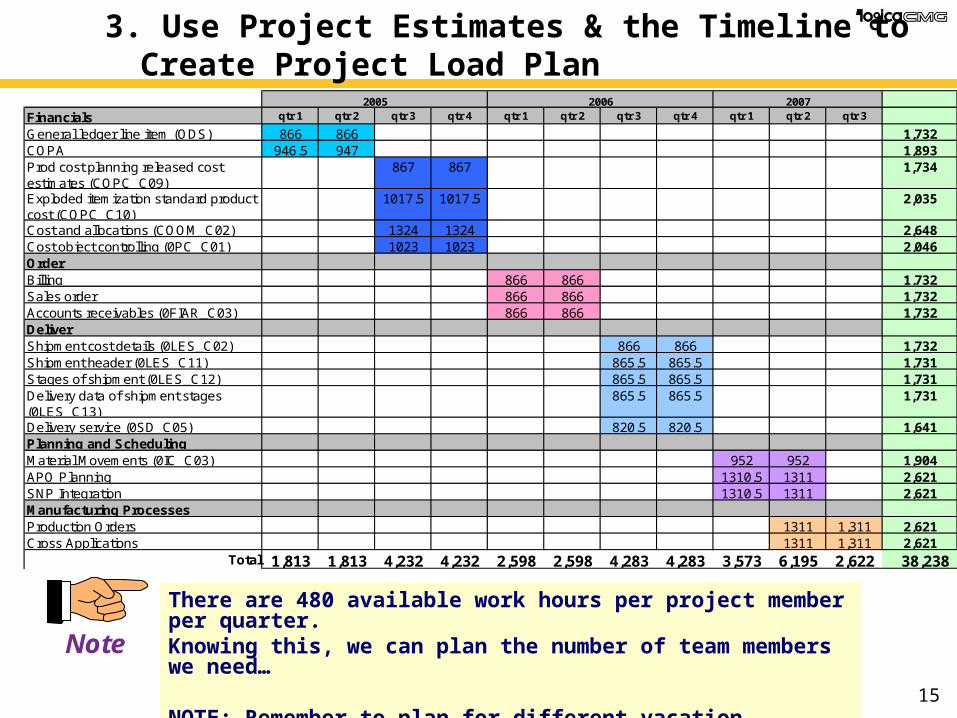
3. Use Project Estimates & the Timeline to Create Project Load Plan
There are 480 available work hours per project member per quarter. Knowing this, we can plan the number of team members we need…
NOTE: Remember to plan for different vacation schedules (i.e. in the USA a 1-2 weeks vacation is most common).
Financials qtr 1 qtr 2 qtr 3 qtr 4 qtr 1 qtr 2 qtr 3 qtr 4 qtr 1 qtr 2 qtr 3
General ledger line item (ODS) 866 866 1,732COPA 946.5 947 1,893Prod cost planning released cost estimates (COPC_C09)
867 867 1,734
Exploded itemization standard product cost (COPC_C10)
1017.5 1017.5 2,035
Cost and allocations (COOM_C02) 1324 1324 2,648Cost object controlling (0PC_C01) 1023 1023 2,046Order Billing 866 866 1,732Sales order 866 866 1,732Accounts receivables (0FIAR_C03) 866 866 1,732Deliver Shipment cost details (0LES_C02) 866 866 1,732Shipment header (0LES_C11) 865.5 865.5 1,731Stages of shipment (0LES_C12) 865.5 865.5 1,731Delivery data of shipment stages (0LES_C13)
865.5 865.5 1,731
Delivery service (0SD_C05) 820.5 820.5 1,641Planning and Scheduling Material Movements (0IC_C03) 952 952 1,904APO Planning 1310.5 1311 2,621SNP Integration 1310.5 1311 2,621Manufacturing Processes Production Orders 1311 1,311 2,621Cross Applications 1311 1,311 2,621
Total 1,813 1,813 4,232 4,232 2,598 2,598 4,283 4,283 3,573 6,195 2,622 38,238
2005 2006 2007
Note
16
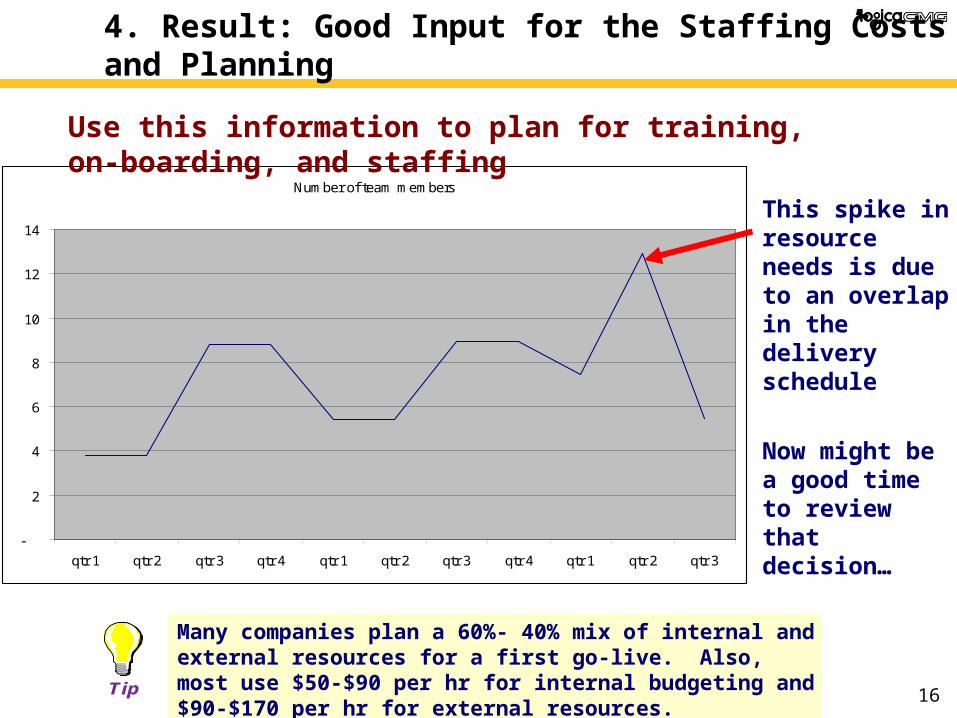
4. Result: Good Input for the Staffing Costs and Planning
Many companies plan a 60%- 40% mix of internal and external resources for a first go-live. Also, most use $50-$90 per hr for internal budgeting and $90-$170 per hr for external resources.
Number of team members
-
2
4
6
8
10
12
14
qtr 1 qtr 2 qtr 3 qtr 4 qtr 1 qtr 2 qtr 3 qtr 4 qtr 1 qtr 2 qtr 3
Use this information to plan for training, on-boarding, and staffing
Tip
This spike in resource needs is due to an overlap in the delivery schedule
Now might be a good time to review that decision…
17
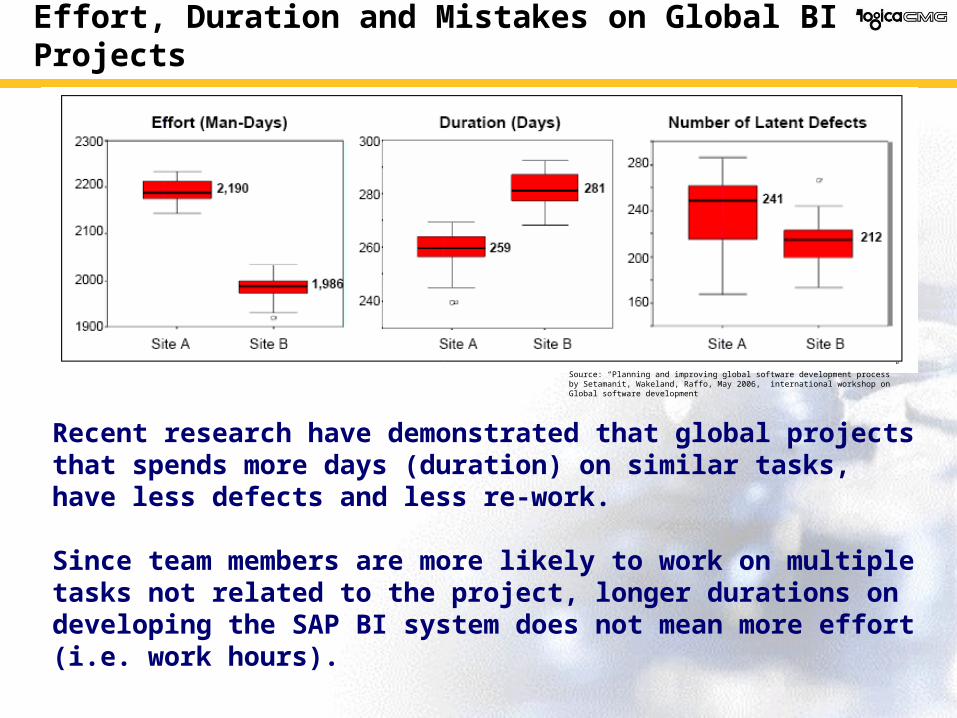
Effort, Duration and Mistakes on Global BI Projects
Source: “Planning and improving global software development process” by Setamanit, Wakeland, Raffo, May 2006, international workshop on Global software development
Recent research have demonstrated that global projects that spends more days (duration) on similar tasks, have less defects and less re-work.
Since team members are more likely to work on multiple tasks not related to the project, longer durations on developing the SAP BI system does not mean more effort (i.e. work hours).
18
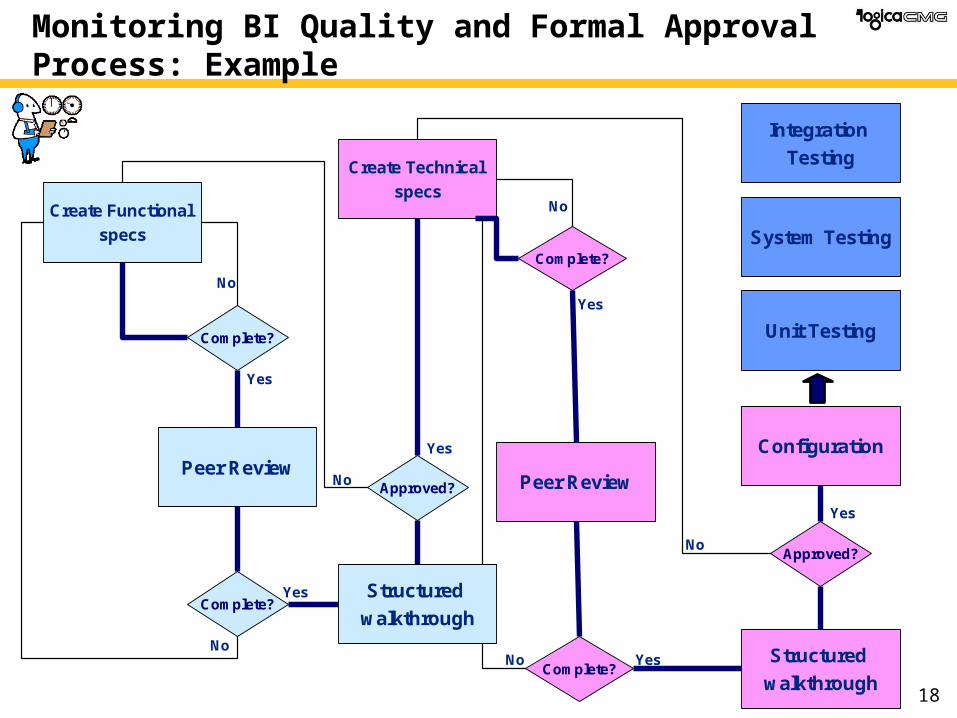
Monitoring BI Quality and Formal Approval Process: Example
Create Functional
specs
Peer Review
Complete?
Complete?
Create Technical
specs
Peer Review
Complete?
Complete?Structured
walkthrough
Approved?
Configuration
Unit Testing
Integration
Testing
System Testing
Structured
walkthrough
Approved?
No
No
No
No
No
Yes
Yes
Yes
Yes
Yes
Yes
No

19
What We’ll Cover
• Overview BI and Data Warehousing
• Budgeting, staffing and scoping a project
• Selecting an OLAP Tool
• What are the ERP-BI vendors doing – a look at SAP, Oracle, PeopleSoft, Siebel, JDE’s BI tools
• The future of BI
• Wrap up
20
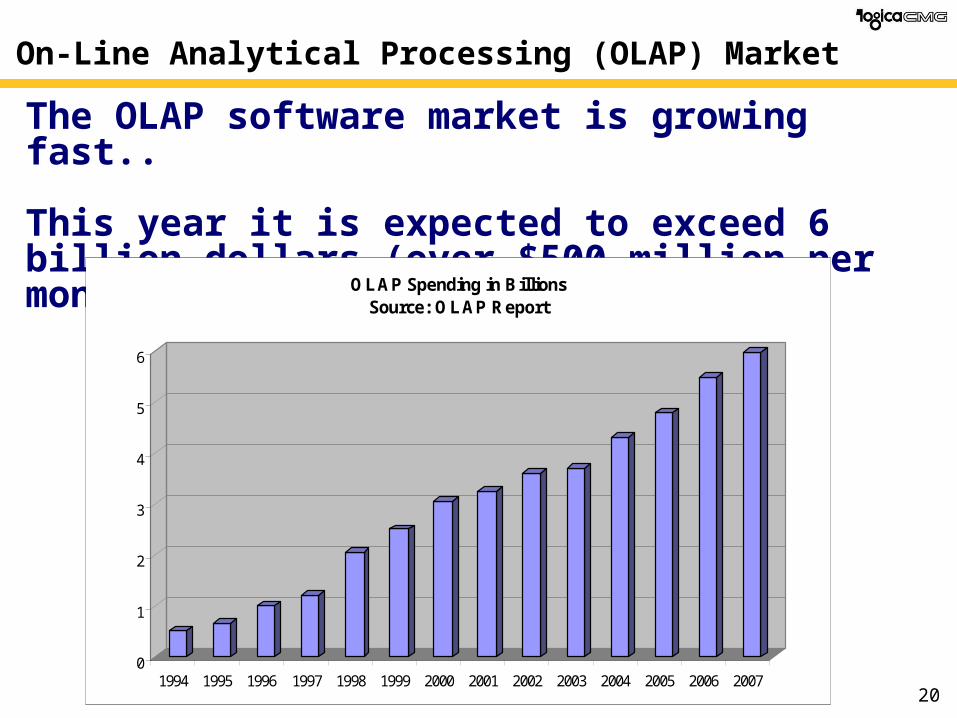
On-Line Analytical Processing (OLAP) Market
The OLAP software market is growing fast..
This year it is expected to exceed 6 billion dollars (over $500 million per month in sales)
0
1
2
3
4
5
6
1994 1995 1996 1997 1998 1999 2000 2001 2002 2003 2004 2005 2006 2007
OLAP Spending in Billions Source : OLAP Report
21
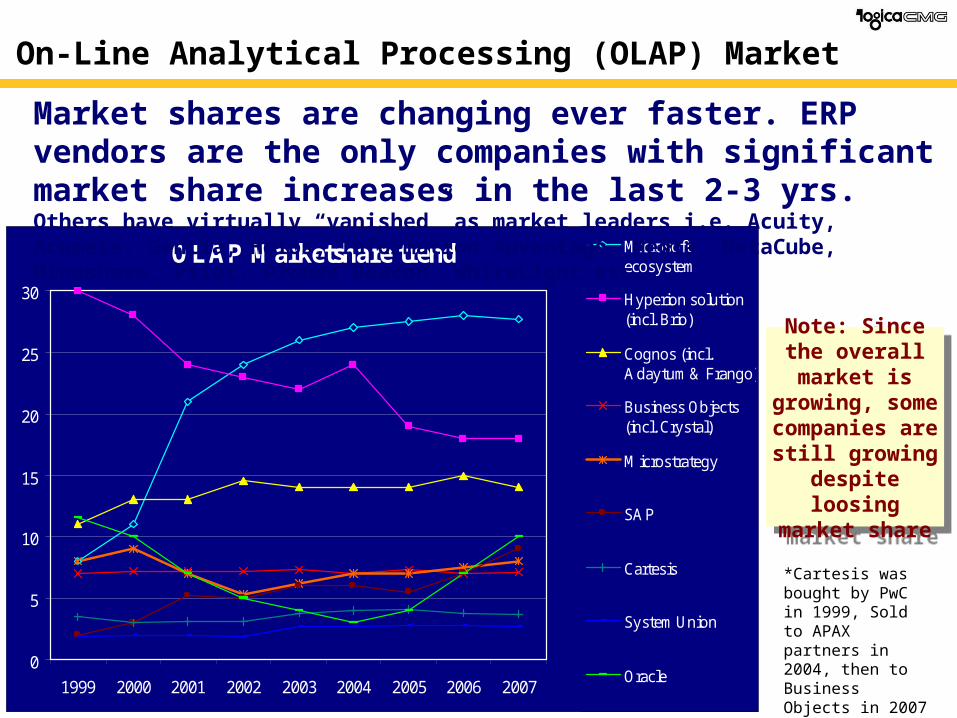
On-Line Analytical Processing (OLAP) Market
OLAP Marketshare trend
0
5
10
15
20
25
30
1999 2000 2001 2002 2003 2004 2005 2006 2007
Microsoftecosystem
Hyperion solution(incl. Brio)
Cognos (incl.Adaytum & Frango)
Business Objects(incl. Crystal)
Microstrategy
SAP
Cartes is
System Union
Oracle
Market shares are changing ever faster. ERP vendors are the only companies with significant market share increases in the last 2-3 yrs.Others have virtually “vanished” as market leaders i.e. Acuity, Acumate, Gentia, Holos, Information Advantage, Media, MetaCube, Mineshare, Pilot, Prodea Beacon, WhiteLight etc…
Note: Since the overall market is growing, some
companies are still growing despite loosing market
share
Note: Since the overall market is growing, some
companies are still growing despite loosing market
share
*Cartesis was bought by PwC in 1999, Sold to APAX partners in 2004, then to Business Objects in 2007 and finally to SAP in October 2007
22
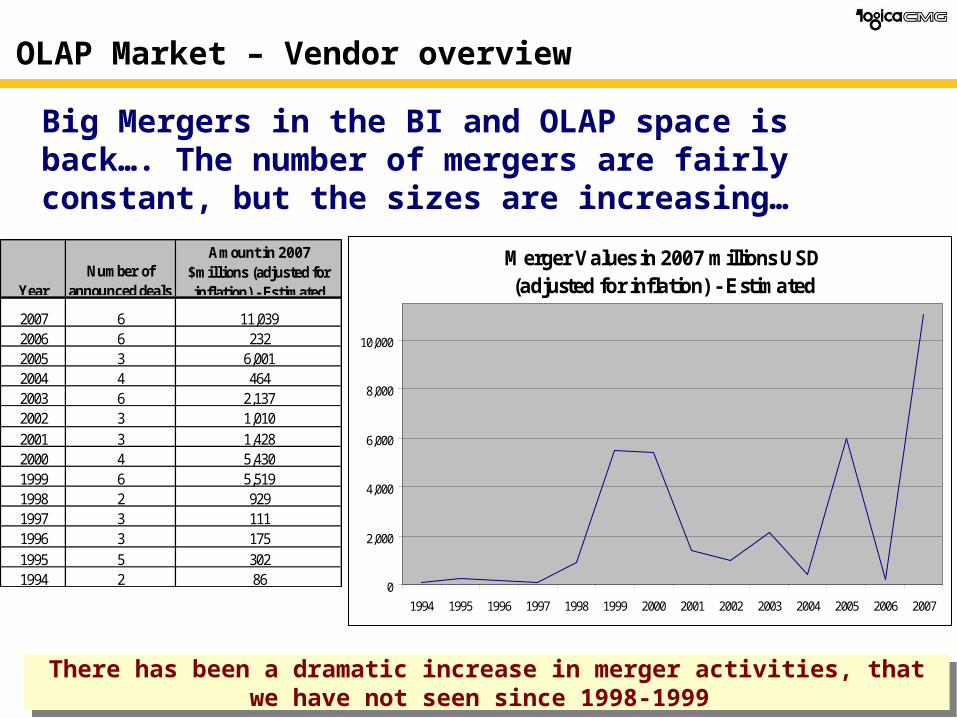
OLAP Market – Vendor overview
Big Mergers in the BI and OLAP space is back…. The number of mergers are fairly constant, but the sizes are increasing…
There has been a dramatic increase in merger activities, that we have not seen since 1998-1999 There has been a dramatic increase in merger activities, that we have not seen since 1998-1999
2007 6 11,0392006 6 2322005 3 6,0012004 4 4642003 6 2,1372002 3 1,010
2001 3 1,4282000 4 5,4301999 6 5,5191998 2 9291997 3 1111996 3 175
1995 5 3021994 2 86
Amount in 2007 $millions (adjusted for inflation) - Estimated
Number of announced dealsYear
Merger Values in 2007 millions USD(adjusted for inflation) - Estimated
0
2,000
4,000
6,000
8,000
10,000
1994 1995 1996 1997 1998 1999 2000 2001 2002 2003 2004 2005 2006 2007
23
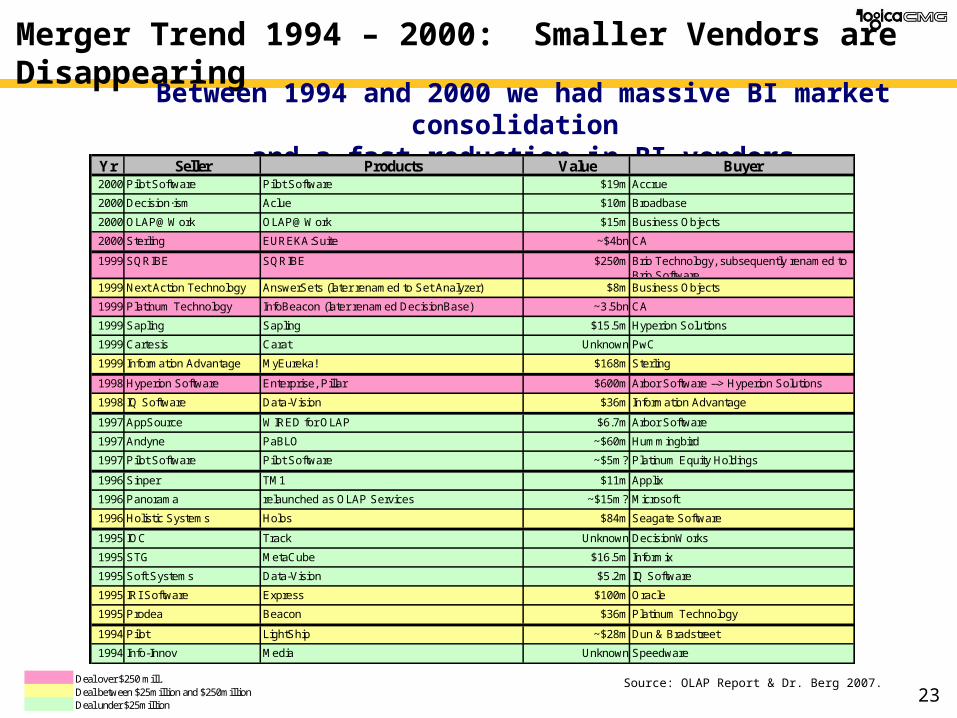
Merger Trend 1994 – 2000: Smaller Vendors are Disappearing
Between 1994 and 2000 we had massive BI market consolidation and a fast reduction in BI vendors
Deal over $250 mill.Deal between $25million and $250millionDeal under $25million
Source: OLAP Report & Dr. Berg 2007.
Yr Seller Products Value Buyer2000 Pilot Software Pilot Software $19m Accrue
2000 Decision·ism Aclue $10m Broadbase
2000 OLAP@Work OLAP@Work $15m Business Objects
2000 Sterling EUREKA:Suite ~$4bn CA
1999 SQRIBE SQRIBE $250m Brio Technology, subsequently renamed to Brio Software
1999 Next Action Technology AnswerSets (later renamed to Set Analyzer) $8m Business Objects
1999 Platinum Technology InfoBeacon (later renamed DecisionBase) ~3.5bn CA
1999 Sapling Sapling $15.5m Hyperion Solutions
1999 Cartesis Carat Unknown PwC
1999 Information Advantage MyEureka! $168m Sterling
1998 Hyperion Software Enterprise, Pillar $600m Arbor Software --> Hyperion Solutions
1998 IQ Software Data-Vision $36m Information Advantage
1997 AppSource WIRED for OLAP $6.7m Arbor Software
1997 Andyne PaBLO ~$60m Hummingbird
1997 Pilot Software Pilot Software ~$5m? Platinum Equity Holdings
1996 Sinper TM1 $11m Applix
1996 Panorama relaunched as OLAP Services ~$15m? Microsoft
1996 Holistic Systems Holos $84m Seagate Software
1995 IOC Track Unknown DecisionWorks
1995 STG MetaCube $16.5m Informix
1995 Soft Systems Data-Vision $5.2m IQ Software
1995 IRI Software Express $100m Oracle
1995 Prodea Beacon $36m Platinum Technology
1994 Pilot LightShip ~$28m Dun & Bradstreet
1994 Info-Innov Media Unknown Speedware
24
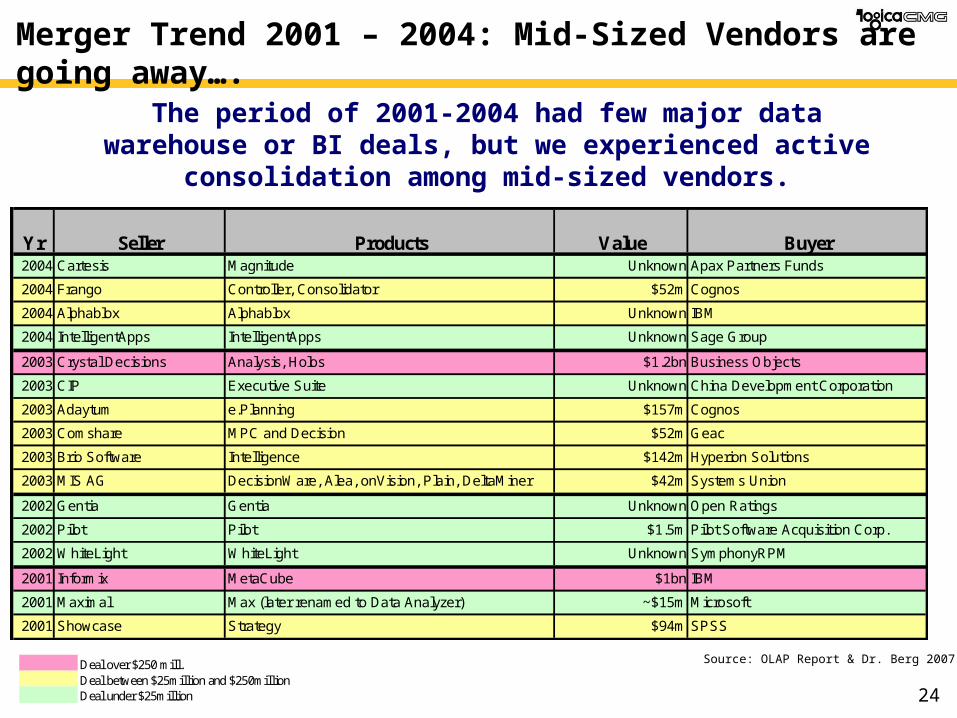
Merger Trend 2001 – 2004: Mid-Sized Vendors are going away….
The period of 2001-2004 had few major data warehouse or BI deals, but we experienced active consolidation among mid-sized vendors.
Deal over $250 mill.Deal between $25million and $250millionDeal under $25million
Source: OLAP Report & Dr. Berg 2007.
Yr Seller Products Value Buyer2004 Cartesis Magnitude Unknown Apax Partners Funds
2004 Frango Controller, Consolidator $52m Cognos
2004 Alphablox Alphablox Unknown IBM
2004 IntelligentApps IntelligentApps Unknown Sage Group
2003 Crystal Decisions Analysis, Holos $1.2bn Business Objects
2003 CIP Executive Suite Unknown China Development Corporation
2003 Adaytum e.Planning $157m Cognos
2003 Comshare MPC and Decision $52m Geac
2003 Brio Software Intelligence $142m Hyperion Solutions
2003 MIS AG DecisionWare, Alea, onVision, Plain, DeltaMiner $42m Systems Union
2002 Gentia Gentia Unknown Open Ratings
2002 Pilot Pilot $1.5m Pilot Software Acquisition Corp.
2002 WhiteLight WhiteLight Unknown SymphonyRPM
2001 Informix MetaCube $1bn IBM
2001 Maximal Max (later renamed to Data Analyzer) ~$15m Microsoft
2001 Showcase Strategy $94m SPSS
25
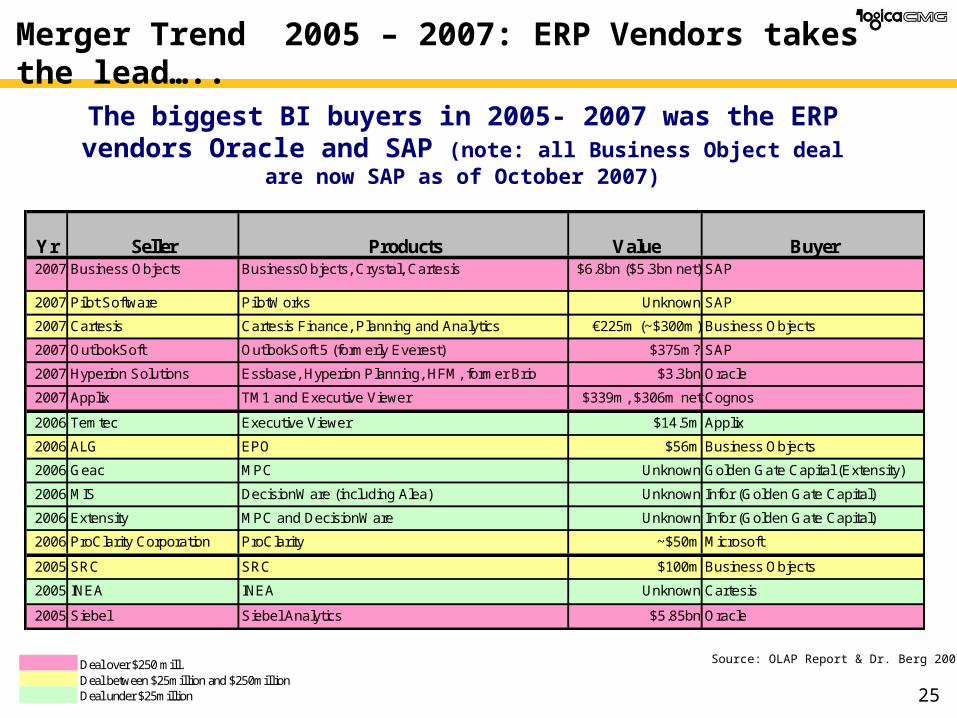
Merger Trend 2005 – 2007: ERP Vendors takes the lead…..
The biggest BI buyers in 2005- 2007 was the ERP vendors Oracle and SAP (note: all Business Object deal are now SAP as of October 2007)
Yr Seller Products Value Buyer2007 Business Objects BusinessObjects, Crystal, Cartesis $6.8bn ($5.3bn net) SAP
2007 Pilot Software PilotWorks Unknown SAP
2007 Cartesis Cartesis Finance, Planning and Analytics €225m (~$300m) Business Objects
2007 OutlookSoft OutlookSoft 5 (formerly Everest) $375m? SAP
2007 Hyperion Solutions Essbase, Hyperion Planning, HFM, former Brio $3.3bn Oracle
2007 Applix TM1 and Executive Viewer $339m, $306m net Cognos
2006 Temtec Executive Viewer $14.5m Applix
2006 ALG EPO $56m Business Objects
2006 Geac MPC Unknown Golden Gate Capital (Extensity)
2006 MIS DecisionWare (including Alea) Unknown Infor (Golden Gate Capital)
2006 Extensity MPC and DecisionWare Unknown Infor (Golden Gate Capital)
2006 ProClarity Corporation ProClarity ~$50m Microsoft
2005 SRC SRC $100m Business Objects
2005 INEA INEA Unknown Cartesis
2005 Siebel Siebel Analytics $5.85bn Oracle
Deal over $250 mill.Deal between $25million and $250millionDeal under $25million
Source: OLAP Report & Dr. Berg 2007.

26
Definition: Multi dimensional On-Line Analytical Processing (MOLAP)
Let us look at those remaining vendors…
MOLAP Tool Category Definition:
Server or client resident, proprietary data bases, architected to quickly manipulate and display data in different combinations, i.e., to provide for fast, adhoc analysis.
Also known as OLAP engines, OLAP servers, data-cubes, and hyper-cubes.
Note: this category includes only those products that employ an actual physical MOLAP cube database
27
Market leaders in MOLAP – Cognos PowerPlay
The Canadian company Cognos is a market leader in MOLAP technology and boosts support for instances with over 190,000 users through their web services tools (server based scalability).
PowerPlay is in version 8.0 now and is now over 15 years old stable technology.
PowerPlay achieve some scalability by partitioning the data cubes by filters (i.e. by year). This creates many cubes, but balances the time it takes to update the cubes.
PowerPlay MOLAP cubes are easy to navigate and are extremely fast due to the fact that results sets are “precalculated”.

28
Market leaders in MOLAP – Oracle Express
Oracle have taken full advantage of their “Express 10g” tool.
You can buy either Express Server or Personal Express for single users (desktop MOLAP).
Tools for Express development and accessExpress Analyzer - Reporting and analysis tool Express Objects - Object-oriented development environment Express Web Publisher - Develop Briefings for Web Deployment Express Spreadsheet Add-in - MS-Excell interface to the Express Server
Pre-Delivered Express applicationsData Entry ClientSales Analyzer ClientSales Brief ClientSales Analyzer (OSA) - analyze sales, marketing and other corporate dataFinancial Analyzer (OFA) - financial reporting, analysis, budgeting & planningFinancial Analyzer Client Financial ControllerFinancial Controller Client

29
Other MOLAP Vendors
There are many other MOLAP vendors.
The differentiator between them is the support for building the cubes on the both the server and the client side (both is better)…
Vendor Name ProductWhere is the
cube builtCognos, Inc. Powerplay BothMicrosoft Corp. Analysis Services (OLAP Services) BothOpen Ratings (bought Gentia 2002) Gentia BothOracle (bought Hyperion 2007) Essbase BothOracle Corp. Express BothCognos (bought Applix 2007) iTM/1 ServerSAS Institute OLAP Server / MDDB ServerBusiness Objects (Seagate) HOLOS (discontinued in 2005) ServerGolden Gate Capital (bought Comshare 2006) Commander ClientHummingbird BI/Analyze ClientOracle (bought Hyperion 2007) Brio Enterprise Client

30
ConceptualMulti-dimensional
Layer
FirstQuarter
February
JanuaryWeek 1-2
Week 3-4
Week 5-6
Week 7-8
Durables
Electronics
SportingGoods
Bats
Gloves
VCR
Radios
CategoryClass
Pro
du
ct
Product
QuarterMonth Week
Tim
e
Time
U.S.
West
South Miami
Dallas
Los Angeles
San Francisco
CountryRegion City
Geo
gra
ph
y Chicago
New YorkNorth
Item
OperationalSystems
DataWarehouse
ODS
BusinessUsers
SQL
DataSources
Queries
Definition: Relational On-Line Analytical Processing (ROLAP)
All else held constant, ROLAP tools are more scalable than MOLAP
tools, but is also slower
All else held constant, ROLAP tools are more scalable than MOLAP
tools, but is also slower
ROLAP Tool Category Definition: Products that provide OLAP functionality by building multidimensional views “on the fly” from data stored in relational database-based data warehouses.
To achieve this, ROLAP vendors employ sophisticated SQL generation engines & multidimensional oriented metadata.
31
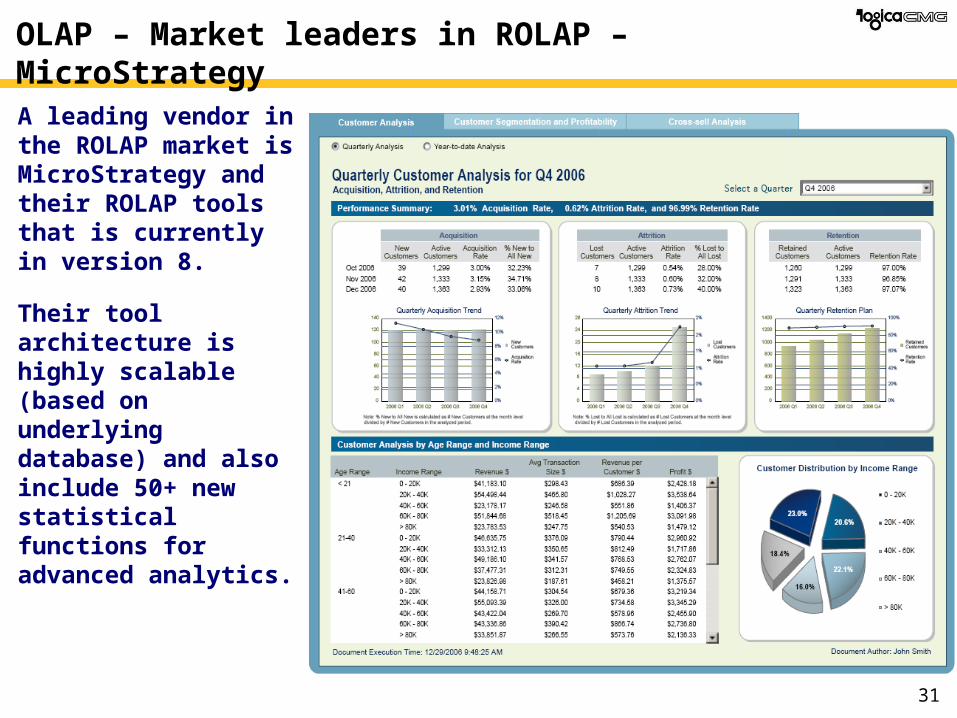
OLAP – Market leaders in ROLAP – MicroStrategy
A leading vendor in the ROLAP market is MicroStrategy and their ROLAP tools that is currently in version 8.
Their tool architecture is highly scalable (based on underlying database) and also include 50+ new statistical functions for advanced analytics.

32
OLAP – Market leaders in ROLAP – MicroStrategy
The tool also have improved event monitoring and broadcast features as well as structured formatting capabilities and better charting for dashboards then previous releases.
You can also develop custom analytical applications more quickly using the new version.
33
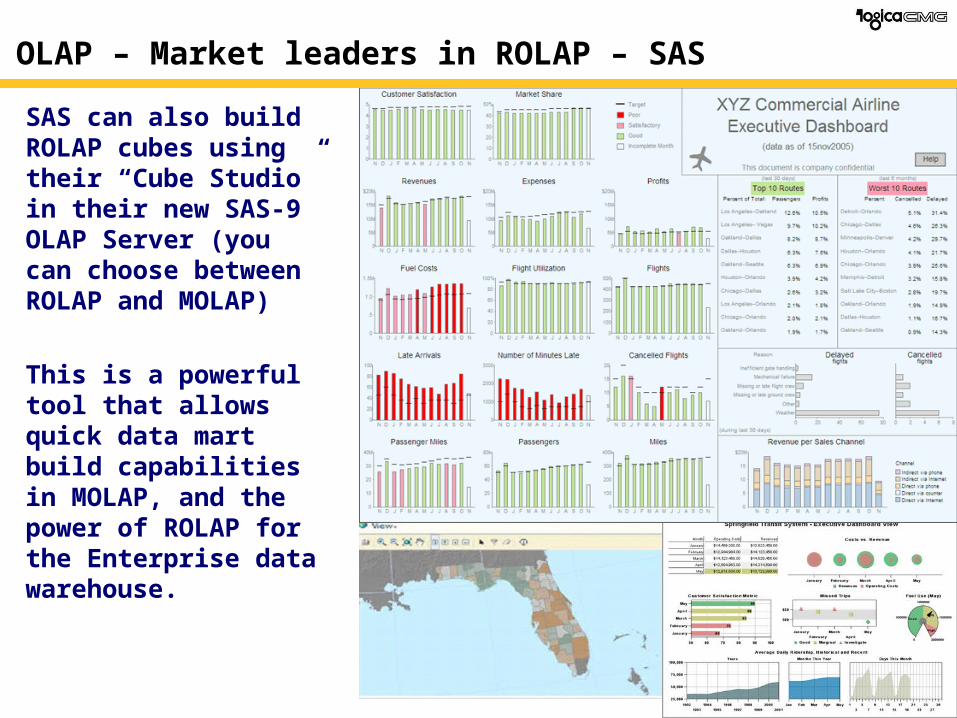
OLAP – Market leaders in ROLAP – SAS
SAS can also build ROLAP cubes using their “Cube Studio” in their new SAS-9 OLAP Server (you can choose between ROLAP and MOLAP)
This is a powerful tool that allows quick data mart build capabilities in MOLAP, and the power of ROLAP for the Enterprise data warehouse.
34
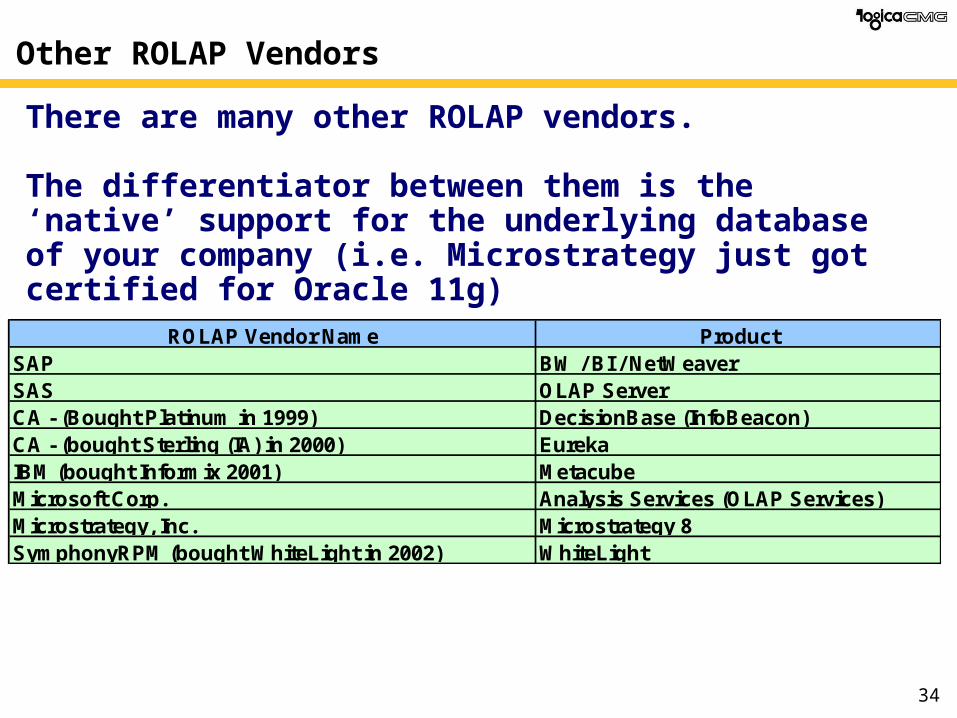
Other ROLAP Vendors
There are many other ROLAP vendors.
The differentiator between them is the ‘native’ support for the underlying database of your company (i.e. Microstrategy just got certified for Oracle 11g)
ROLAP Vendor Name ProductSAP BW / BI / NetWeaverSAS OLAP ServerCA - (Bought Platinum in 1999) DecisionBase (InfoBeacon)CA - (bought Sterling (IA) in 2000) EurekaIBM (bought Informix 2001) MetacubeMicrosoft Corp. Analysis Services (OLAP Services)Microstrategy, Inc. Microstrategy 8SymphonyRPM (bought WhiteLight in 2002) WhiteLight
35
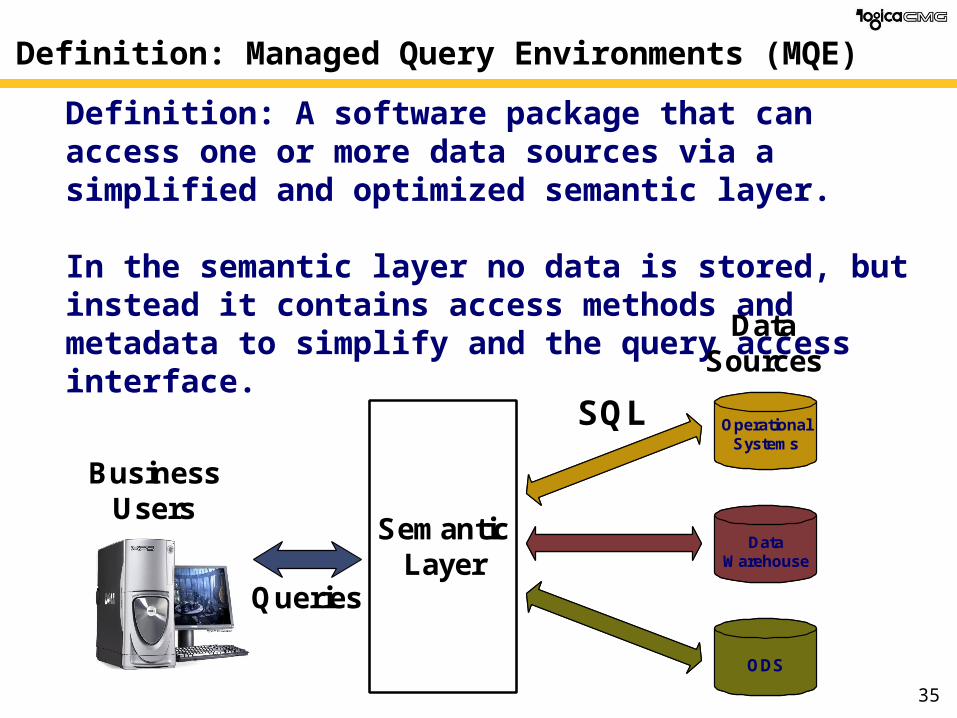
Definition: Managed Query Environments (MQE)
Definition: A software package that can access one or more data sources via a simplified and optimized semantic layer.
In the semantic layer no data is stored, but instead it contains access methods and metadata to simplify and the query access interface.
SemanticLayer
Queries
OperationalSystems
DataWarehouse
ODS
BusinessUsers
SQL
DataSources
36
Market leaders in MQE – Cognos ReportNet
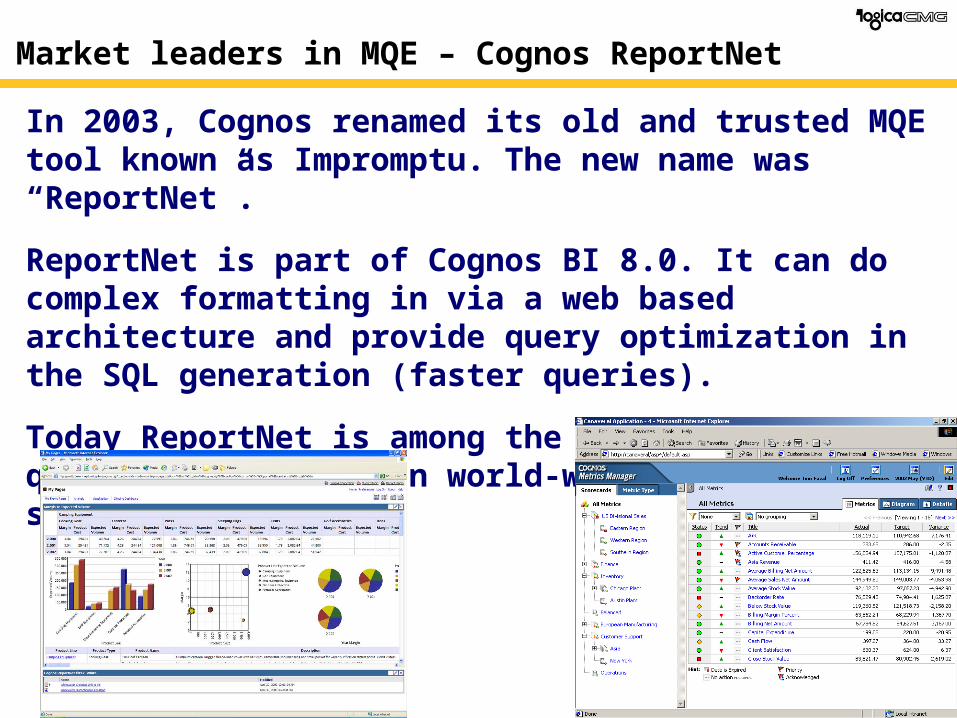
In 2003, Cognos renamed its old and trusted MQE tool known as Impromptu. The new name was “ReportNet”.
ReportNet is part of Cognos BI 8.0. It can do complex formatting in via a web based architecture and provide query optimization in the SQL generation (faster queries).
Today ReportNet is among the top-5 most used query tool and has an world-wide install and support base.
37
Market leaders in MQE – Oracle Discoverer
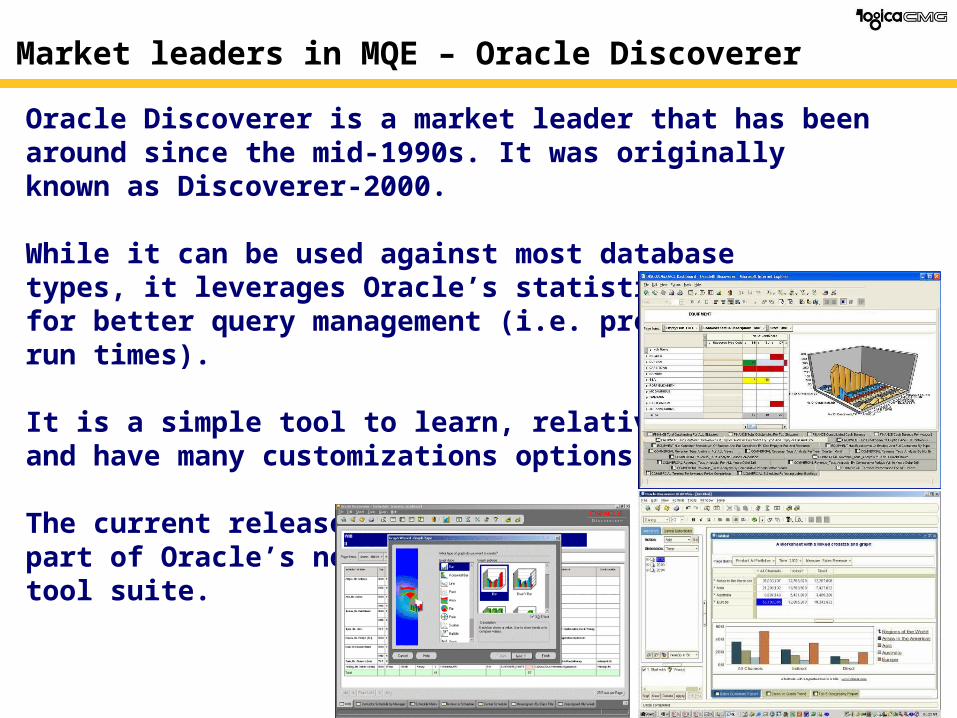
Oracle Discoverer is a market leader that has been around since the mid-1990s. It was originally known as Discoverer-2000.
While it can be used against most database types, it leverages Oracle’s statistical features for better query management (i.e. predictive run times).
It is a simple tool to learn, relatively low cost,and have many customizations options.
The current release is part of Oracle’s new 10g tool suite.
38
Market leaders in MQE – (SAP) Business Objects
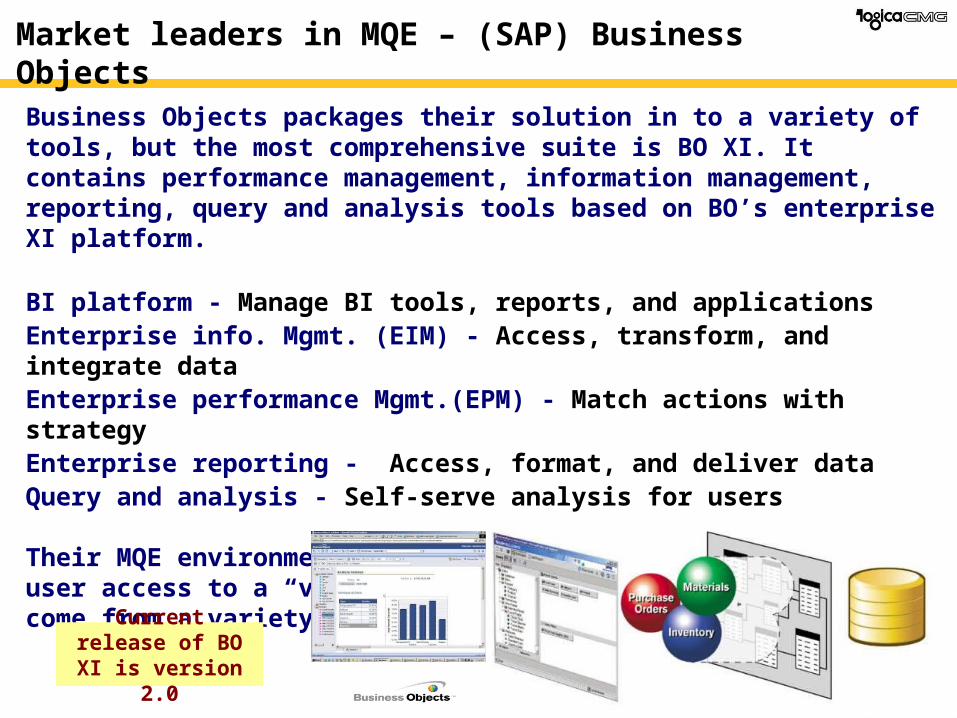
Business Objects packages their solution in to a variety of tools, but the most comprehensive suite is BO XI. It contains performance management, information management, reporting, query and analysis tools based on BO’s enterprise XI platform.
BI platform - Manage BI tools, reports, and applications Enterprise info. Mgmt. (EIM) - Access, transform, and integrate data Enterprise performance Mgmt.(EPM) - Match actions with strategy Enterprise reporting - Access, format, and deliver data Query and analysis - Self-serve analysis for users
Their MQE environment can create “universes” that provide user access to a “virtual data warehouse” where data can come from a variety of BI and/or transaction systems
Current release of BO XI is version 2.0
39
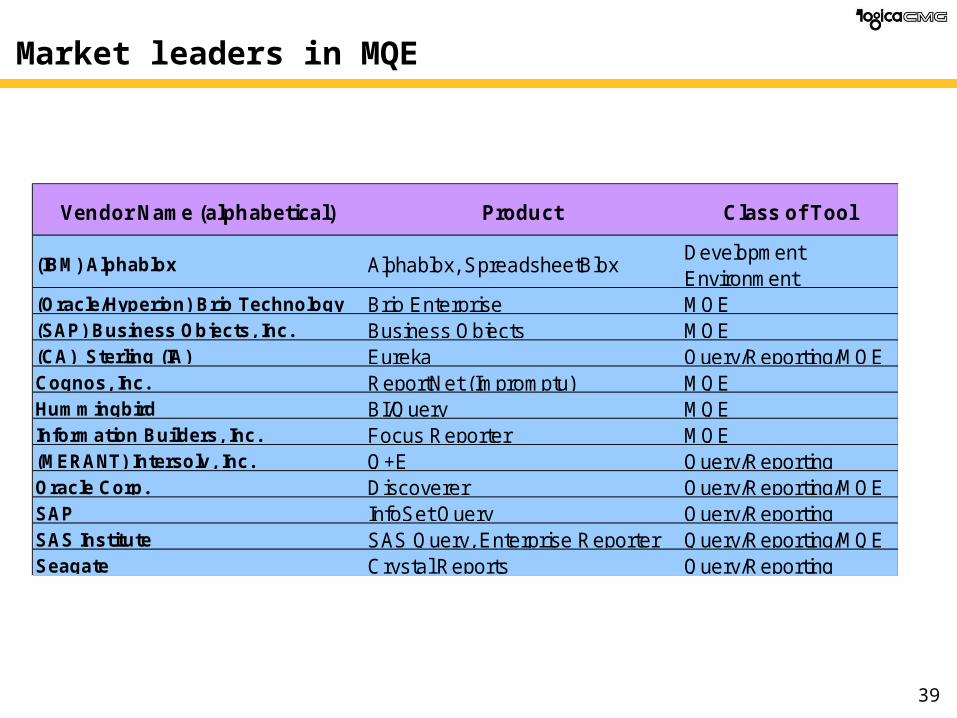
Market leaders in MQE
Vendor Name (alphabetical) Product Class of Tool
(IBM) Alphablox Alphablox, SpreadsheetBloxDevelopment Environment
(Oracle/Hyperion) Brio Technology Brio Enterprise MQE(SAP) Business Objects, Inc. Business Objects MQE(CA) Sterling (IA) Eureka Query/Reporting/MQECognos, Inc. ReportNet (Impromptu) MQEHummingbird BI/Query MQEInformation Builders, Inc. Focus Reporter MQE(MERANT) Intersolv, Inc. Q+E Query/ReportingOracle Corp. Discoverer Query/Reporting/MQESAP InfoSet Query Query/ReportingSAS Institute SAS Query, Enterprise Reporter Query/Reporting/MQESeagate Crystal Reports Query/Reporting

40
Other Useful Tool Categories
Report Servers – Tools that creates batch reports that can be “pixel formatted” for statements and high-volume access.
The market leader in this segment is Crystal Reports in its new release
“Crystal-2008”.
Statistical Software – Tools that provide advanced statistical functions, i.e. clustering, neural networks, decision trees, discrimminant analysis, analysis of variance for complex decision making.
The market leader in this segment is SAS Institute and their SAS/Stat tool

41
What We’ll Cover
• Overview BI and Data Warehousing
• Budgeting, staffing and scoping a project
• Selecting an OLAP Tool
• What are the ERP-BI vendors doing – a look at SAP, Oracle, PeopleSoft, Siebel, JDE’s BI tools
• The future of BI
• Wrap up
42
DB and OS Abstraction
.NET WebSphere…
People Integration
Co
mp
osit
e A
pp
lic
ati
on
Fra
me
wo
rk
Process IntegrationIntegration
BrokerBusiness Process
Management
Information Integration
BusinessIntelligence
KnowledgeManagement
Life
Cyc
le M
an
ag
em
en
t
Portal Collaboration
J2EE ABAP
Application Platform
Multi-Channel Access
SAP SAP NetWeaver™™
DB and OS Abstraction
Master Data Management
DB and OS Abstraction
.NET WebSphere…
People Integration
Co
mp
osit
e A
pp
lic
ati
on
Fra
me
wo
rk
Process IntegrationIntegration
BrokerBusiness Process
Management
Information Integration
BusinessIntelligence
KnowledgeManagement
Life
Cyc
le M
an
ag
em
en
t
Portal Collaboration
J2EE ABAP
Application Platform
Multi-Channel Access
SAP SAP NetWeaver™™
DB and OS Abstraction
Master Data Management
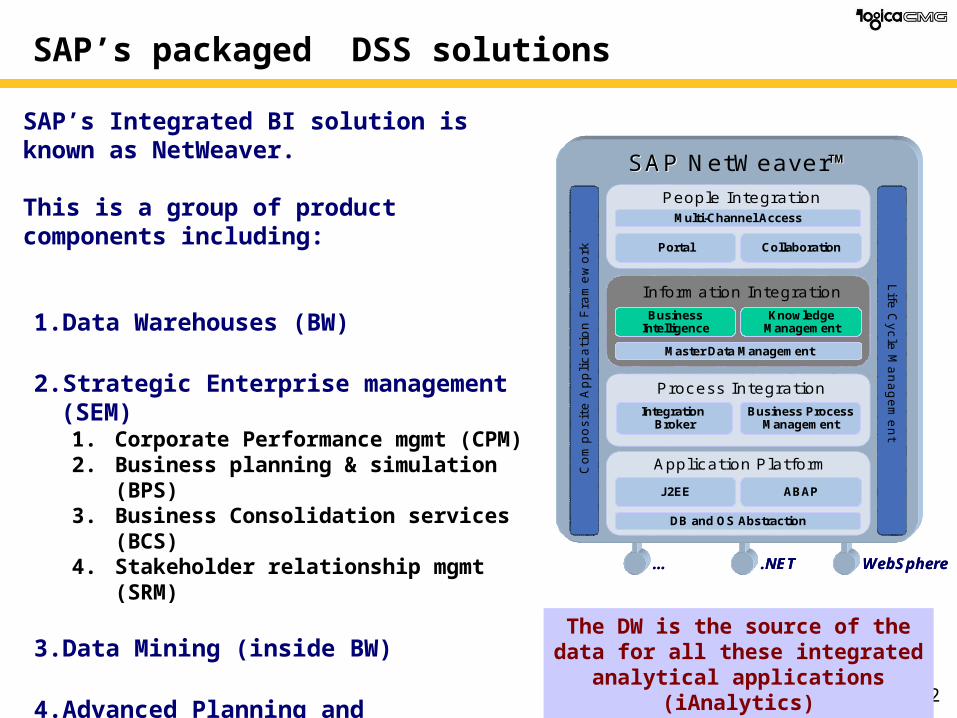
SAP’s packaged DSS solutions
SAP’s Integrated BI solution is known as NetWeaver.
This is a group of product components including:
1. Data Warehouses (BW)
2. Strategic Enterprise management (SEM)1. Corporate Performance mgmt (CPM)2. Business planning & simulation (BPS)3. Business Consolidation services (BCS)4. Stakeholder relationship mgmt (SRM)
3. Data Mining (inside BW)
4. Advanced Planning and Optimization (APO-BI)
5. Supply Chain Event Manager (SCEM-BI)
6. Customer Relationship Manager (CRM-BI)The DW is the source of the data for
all these integrated analytical applications (iAnalytics)
43
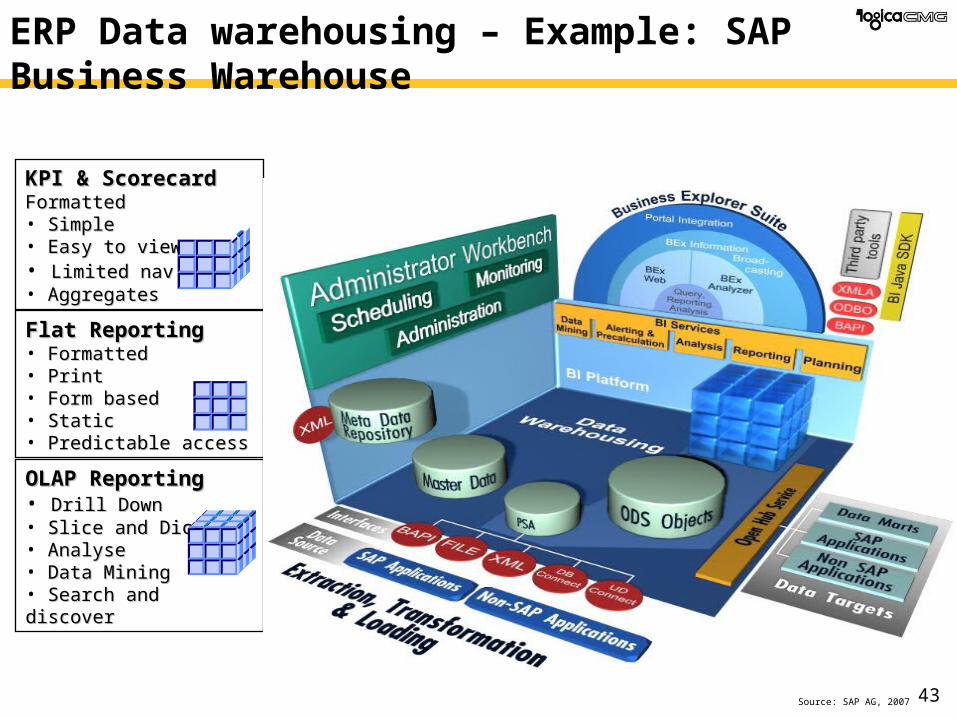
ERP Data warehousing – Example: SAP Business Warehouse
Source: SAP AG, 2007
Flat ReportingFlat Reporting• FormattedFormatted• PrintPrint• Form basedForm based• StaticStatic• Predictable accessPredictable access
OLAP ReportingOLAP Reporting• Drill DownDrill Down• Slice and DiceSlice and Dice• AnalyseAnalyse• Data Mining Data Mining • Search and discoverSearch and discover
KPI & ScorecardKPI & Scorecard FormattedFormatted• SimpleSimple• Easy to viewEasy to view• Limited navLimited nav• AggregatesAggregates
44
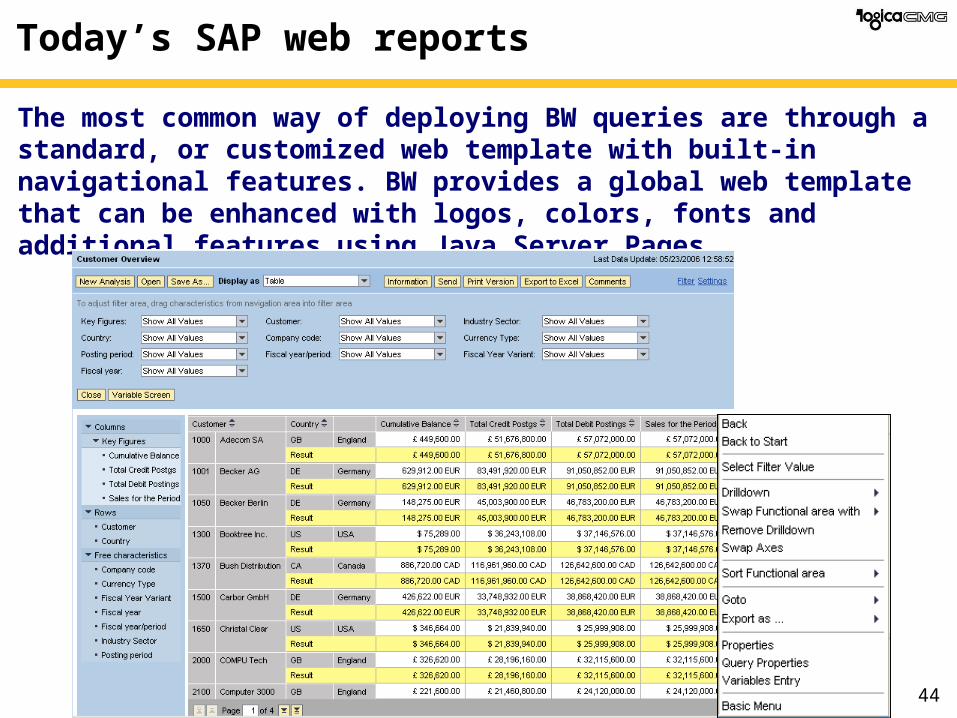
Today’s SAP web reports
The most common way of deploying BW queries are through a standard, or customized web template with built-in navigational features. BW provides a global web template that can be enhanced with logos, colors, fonts and additional features using Java Server Pages.

45
Where is SAP heading?
In October 2007, SAP launched a new tool suite called Corporate Performance Management (CPM) Note: same acronym but new tools.
The new SAP CPM is a collection of 3 tools it acquired in 2005-2006:
1. SAP Strategy Management (formerly PilotWorks)
2. SAP Business Planning and Consolidation (formerly OutlookSoft 5)
3. SAP Business Profitability Management by Acorn
KEY POINT— What we see is a temporary strategy of integrating previously acquired
software under a shared marketing umbrella until SAP can digest the Business Objects acquisition (2008) and build coherent front-end tools. In the interim,
SAP will have a complex number of tools with overlapping capabilities.

46
Oracle’s Legacy Approach to BI
Oracle Business Intelligence ApplicationsOracle's analytic applications include corporate performance management, interactive dashboarding (i.e. from Oracle’s Financial Analyzer), and embedded analytics. It is pre-built, industry specific analytic applications for BI based on business functions and user roles.
Oracle Business Intelligence SuiteBusiness Intelligence Suite is intended for executives, managers, and front line workers , and include ad hoc query and analysis, proactive intelligence and alerts, advanced reporting, and predictive analytics.
Oracle Data WarehousingThe Data Warehousing products include a graphical environment that supports design, deployment, and management of data warehouses. It include parallel database technology, and a suite of data access and management tools.
47
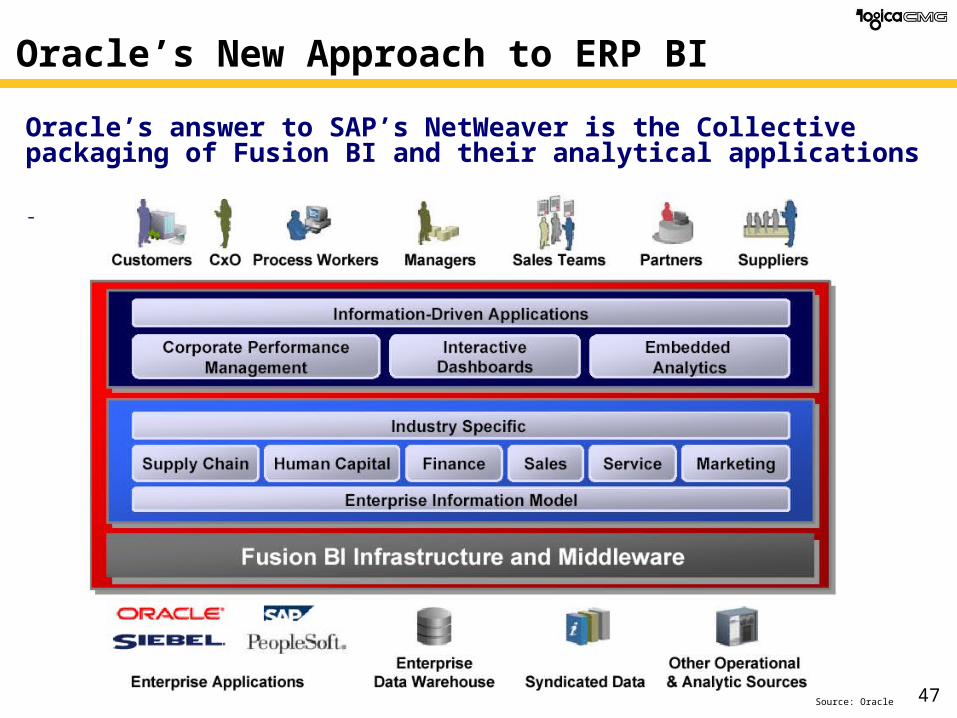
Oracle’s New Approach to ERP BI
Oracle’s answer to SAP’s NetWeaver is the Collective packaging of Fusion BI and their analytical applications
-
Source: Oracle
48
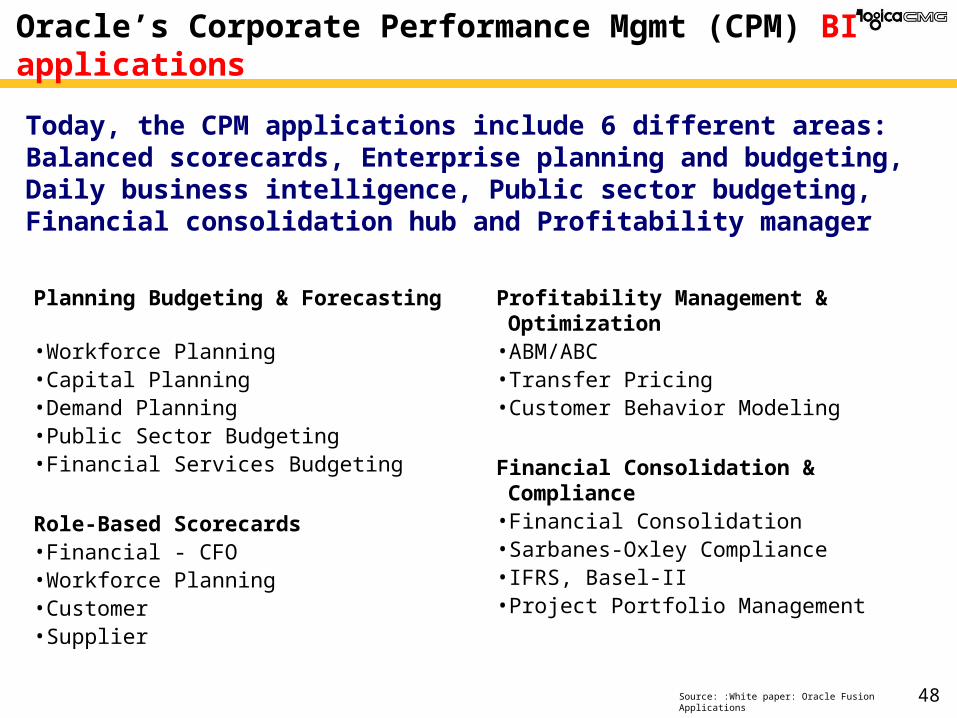
Oracle’s Corporate Performance Mgmt (CPM) BI applications
Today, the CPM applications include 6 different areas: Balanced scorecards, Enterprise planning and budgeting, Daily business intelligence, Public sector budgeting, Financial consolidation hub and Profitability manager
Source: :White paper: Oracle Fusion Applications
Planning Budgeting & Forecasting• Workforce Planning• Capital Planning• Demand Planning• Public Sector Budgeting• Financial Services Budgeting
Role-Based Scorecards• Financial - CFO• Workforce Planning• Customer• Supplier
Profitability Management & Optimization• ABM/ABC• Transfer Pricing• Customer Behavior Modeling
Financial Consolidation & Compliance• Financial Consolidation• Sarbanes-Oxley Compliance• IFRS, Basel-II• Project Portfolio Management
49
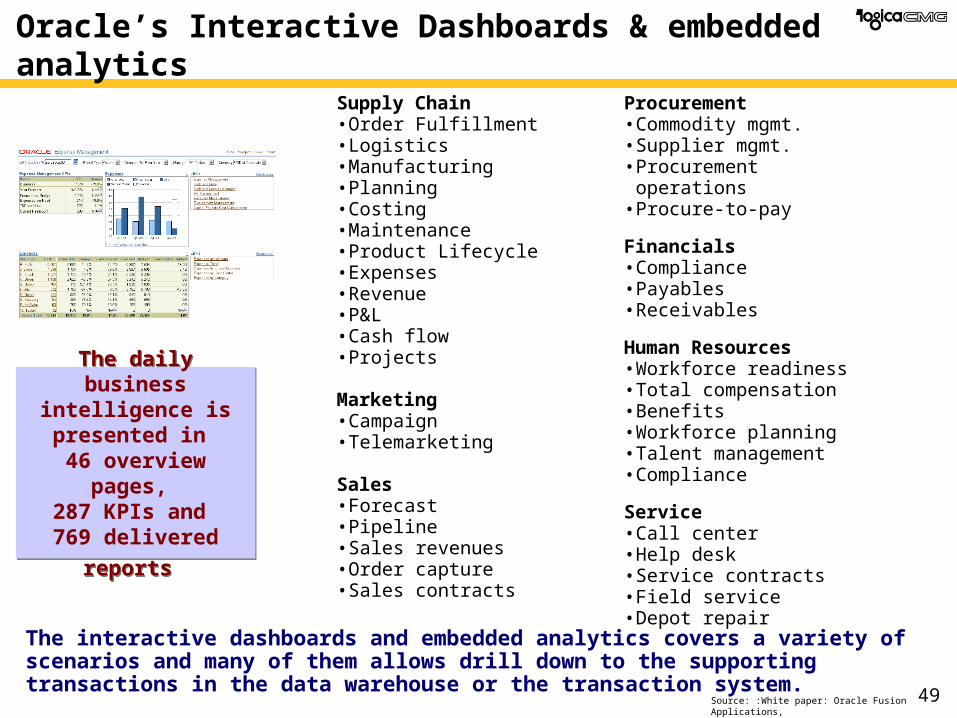
Oracle’s Interactive Dashboards & embedded analytics
The interactive dashboards and embedded analytics covers a variety of scenarios and many of them allows drill down to the supporting transactions in the data warehouse or the transaction system.
Source: :White paper: Oracle Fusion Applications,
The daily business intelligence is presented in
46 overview pages, 287 KPIs and
769 delivered reports
The daily business intelligence is presented in
46 overview pages, 287 KPIs and
769 delivered reports
Supply Chain• Order Fulfillment• Logistics• Manufacturing• Planning• Costing• Maintenance• Product Lifecycle• Expenses• Revenue• P&L• Cash flow• Projects
Marketing• Campaign• Telemarketing
Sales• Forecast• Pipeline• Sales revenues• Order capture• Sales contracts
Procurement• Commodity mgmt.• Supplier mgmt.• Procurement operations• Procure-to-pay
Financials• Compliance• Payables• Receivables
Human Resources• Workforce readiness• Total compensation• Benefits• Workforce planning• Talent management• Compliance
Service• Call center• Help desk• Service contracts• Field service• Depot repair
50
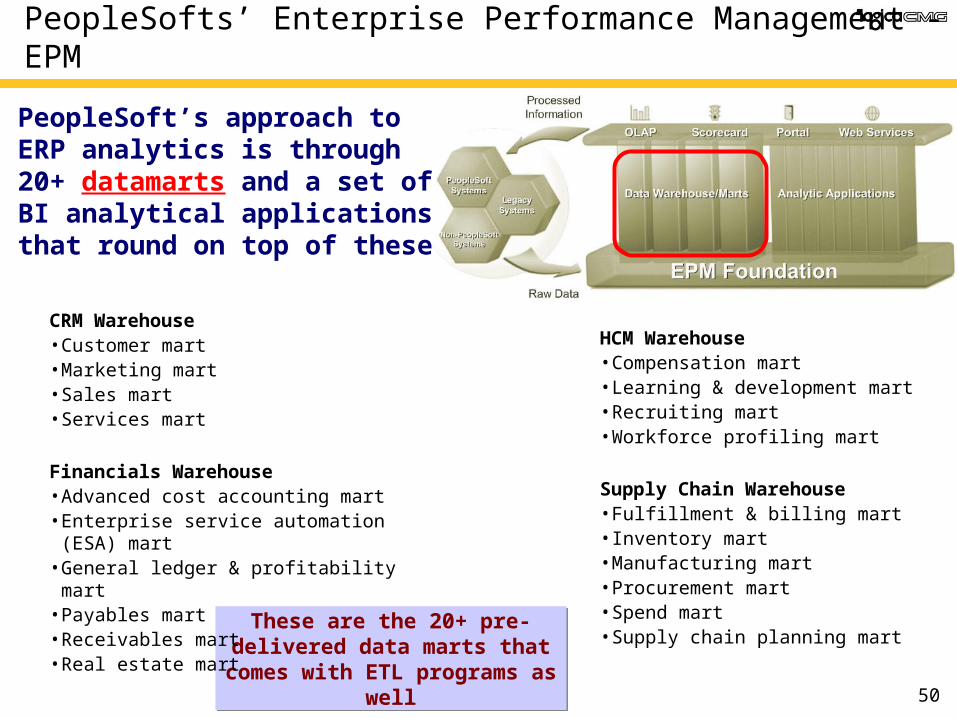
PeopleSofts’ Enterprise Performance Management - EPM
PeopleSoft’s approach to ERP analytics is through 20+ datamarts and a set of BI analytical applications that round on top of these
These are the 20+ pre-delivered data marts that comes with ETL
programs as well
These are the 20+ pre-delivered data marts that comes with ETL
programs as well
CRM Warehouse• Customer mart• Marketing mart• Sales mart• Services mart
Financials Warehouse• Advanced cost accounting mart• Enterprise service automation (ESA) mart• General ledger & profitability mart• Payables mart• Receivables mart• Real estate mart
HCM Warehouse• Compensation mart• Learning & development mart• Recruiting mart• Workforce profiling mart
Supply Chain Warehouse• Fulfillment & billing mart• Inventory mart• Manufacturing mart• Procurement mart• Spend mart• Supply chain planning mart
51
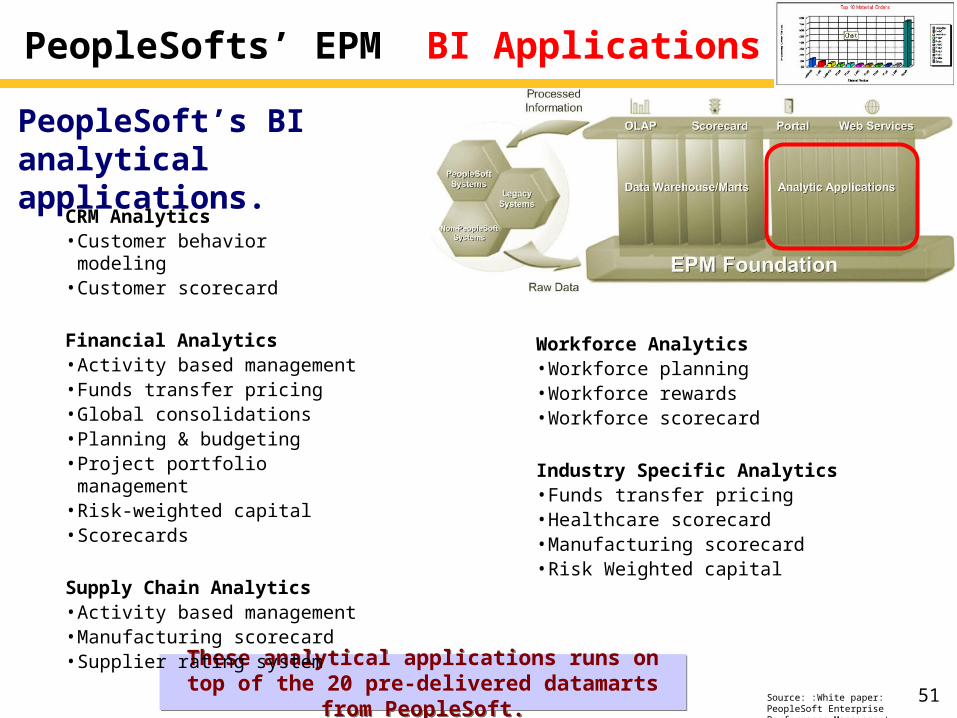
PeopleSofts’ EPM BI Applications
PeopleSoft’s BI analytical applications.
Source: :White paper: PeopleSoft Enterprise Performance Management,
These analytical applications runs on top of the 20 pre-delivered datamarts from PeopleSoft.
These analytical applications runs on top of the 20 pre-delivered datamarts from PeopleSoft.
CRM Analytics• Customer behavior modeling• Customer scorecard
Financial Analytics• Activity based management• Funds transfer pricing• Global consolidations• Planning & budgeting• Project portfolio management• Risk-weighted capital• Scorecards
Supply Chain Analytics• Activity based management• Manufacturing scorecard• Supplier rating system
Workforce Analytics• Workforce planning• Workforce rewards• Workforce scorecard
Industry Specific Analytics• Funds transfer pricing• Healthcare scorecard• Manufacturing scorecard• Risk Weighted capital
52
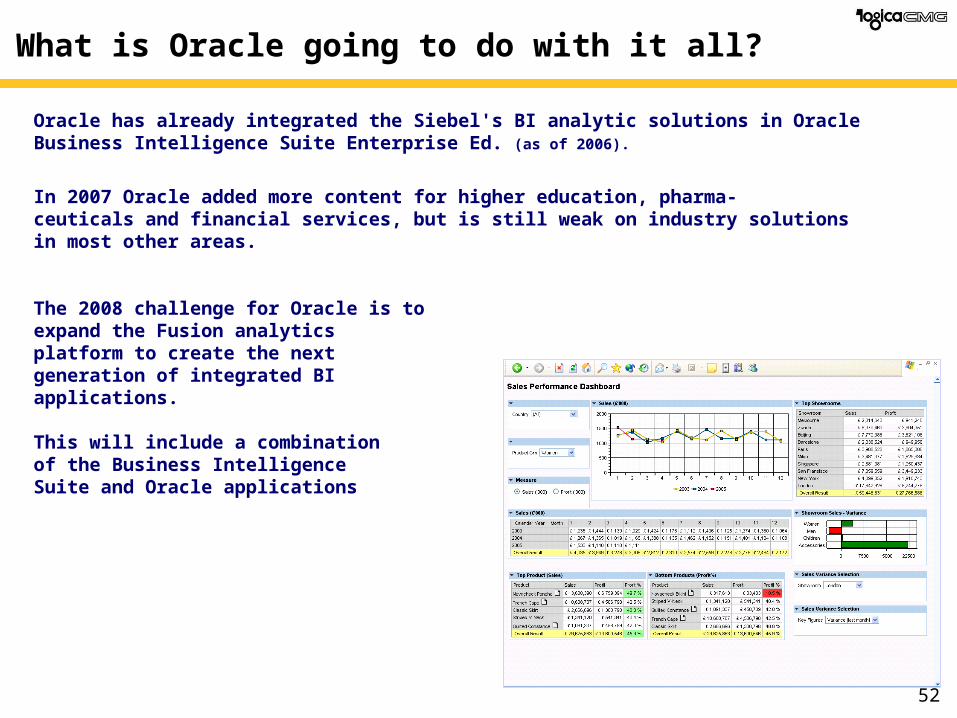
What is Oracle going to do with it all?
Oracle has already integrated the Siebel's BI analytic solutions in Oracle Business Intelligence Suite Enterprise Ed. (as of 2006).
In 2007 Oracle added more content for higher education, pharma-ceuticals and financial services, but is still weak on industry solutions in most other areas.
The 2008 challenge for Oracle is to expand the Fusion analytics platform to create the next generation of integrated BI applications.
This will include a combination of the Business Intelligence Suite and Oracle applications
53
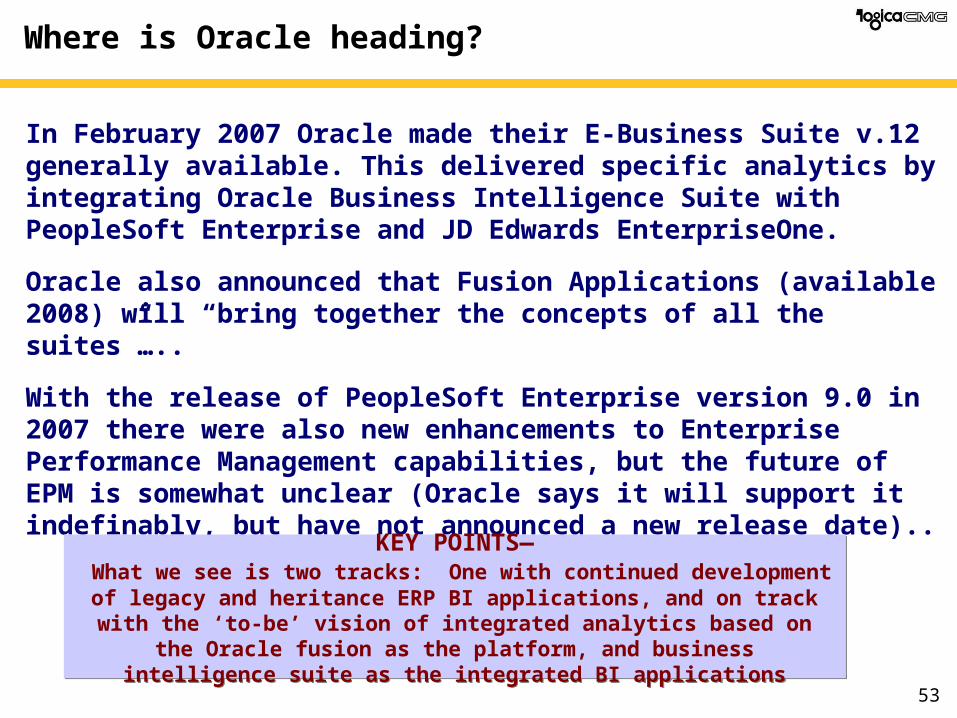
Where is Oracle heading?
In February 2007 Oracle made their E-Business Suite v.12 generally available. This delivered specific analytics by integrating Oracle Business Intelligence Suite with PeopleSoft Enterprise and JD Edwards EnterpriseOne.
Oracle also announced that Fusion Applications (available 2008) will “bring together the concepts of all the suites”…..
With the release of PeopleSoft Enterprise version 9.0 in 2007 there were also new enhancements to Enterprise Performance Management capabilities, but the future of EPM is somewhat unclear (Oracle says it will support it indefinably, but have not announced a new release date)..
KEY POINTS— What we see is two tracks: One with continued development of legacy and
heritance ERP BI applications, and on track with the ‘to-be’ vision of integrated analytics based on the Oracle fusion as the platform, and
business intelligence suite as the integrated BI applications
KEY POINTS— What we see is two tracks: One with continued development of legacy and
heritance ERP BI applications, and on track with the ‘to-be’ vision of integrated analytics based on the Oracle fusion as the platform, and
business intelligence suite as the integrated BI applications
54
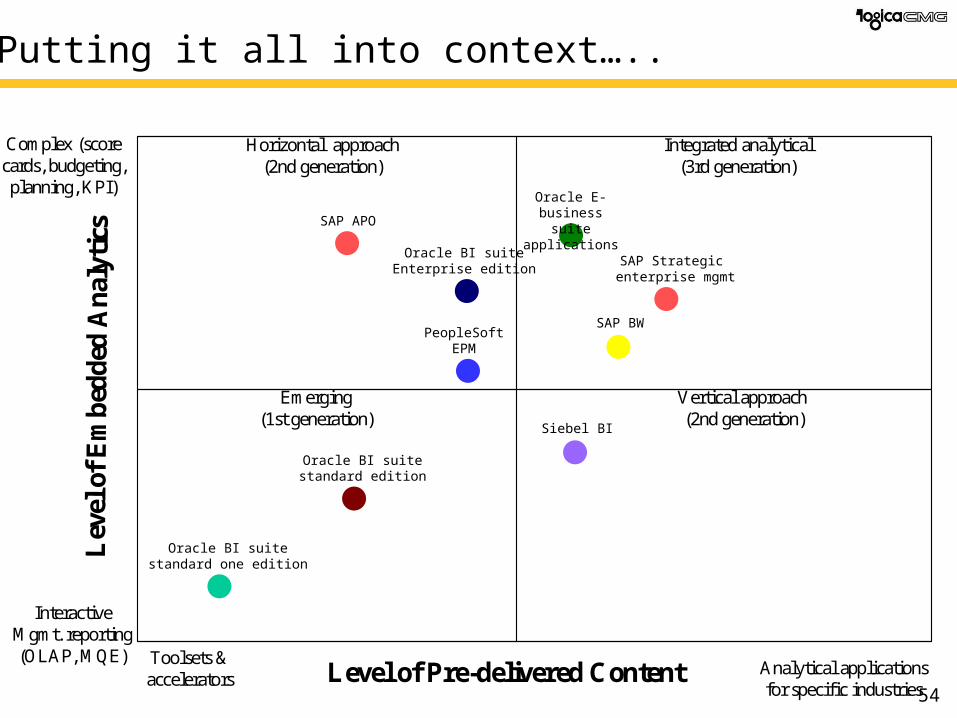
Putting it all into context…..
Level of Pre-delivered ContentToolsets & accelerators
Analytical applications for specific industries
Lev
el o
f E
mb
edd
ed A
nal
ytic
s
Complex (score cards, budgeting, planning, KPI)
Interactive Mgmt. reporting (OLAP, MQE)
Emerging (1st generation)
Vertical approach (2nd generation)
Horizontal approach (2nd generation)
Integrated analytical (3rd generation)
Oracle BI suitestandard edition
Oracle BI suitestandard one edition
Siebel BI
PeopleSoftEPM
SAP Strategic enterprise mgmt
SAP BW
Oracle BI suiteEnterprise edition
Oracle E-business suite applications
SAP APO
55
What We’ll Cover
• Overview BI and Data Warehousing
• Budgeting, staffing and scoping a project
• Selecting an OLAP Tool
• What are the ERP-BI vendors doing – a look at SAP, Oracle, PeopleSoft, Siebel, JDE’s BI tools
• The future of BI
• Wrap up
56
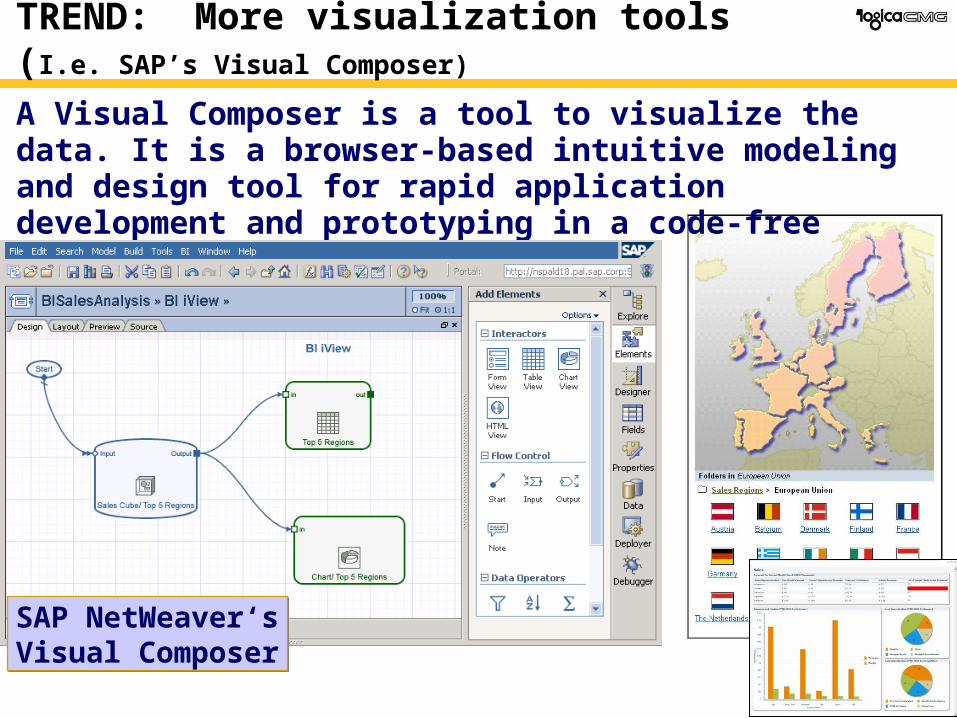
TREND: More visualization tools (I.e. SAP’s Visual Composer)
A Visual Composer is a tool to visualize the data. It is a browser-based intuitive modeling and design tool for rapid application development and prototyping in a code-free development environment.
SAP NetWeaver‘sVisual ComposerSAP NetWeaver‘sVisual Composer

57
TREND: Virtual OLAP
• Virtual OLAP is a trend of merging operational and analytical data in a logical manner.
• Since the merger is virtual, it can have zero lag time and therefore provide real-time analytics.
• Many companies such as the GL company is providing tie-ins to Oracle applications and databases that can logically merge the data as well as transform the data to external indexing engines for extremely fast query accessing.

58
TREND: Virtual OLAP – an SAP approach
• SAP launched the BI accelerator at the end of June 2006.
• This tool takes BI and/or operational data and creates a proprietary indexing system that allows users to access the data very quickly.
Query performance can
be 100s of times faster
than traditional ROLAP.
Source: Alexander Peter, SAP AG, 2006
59
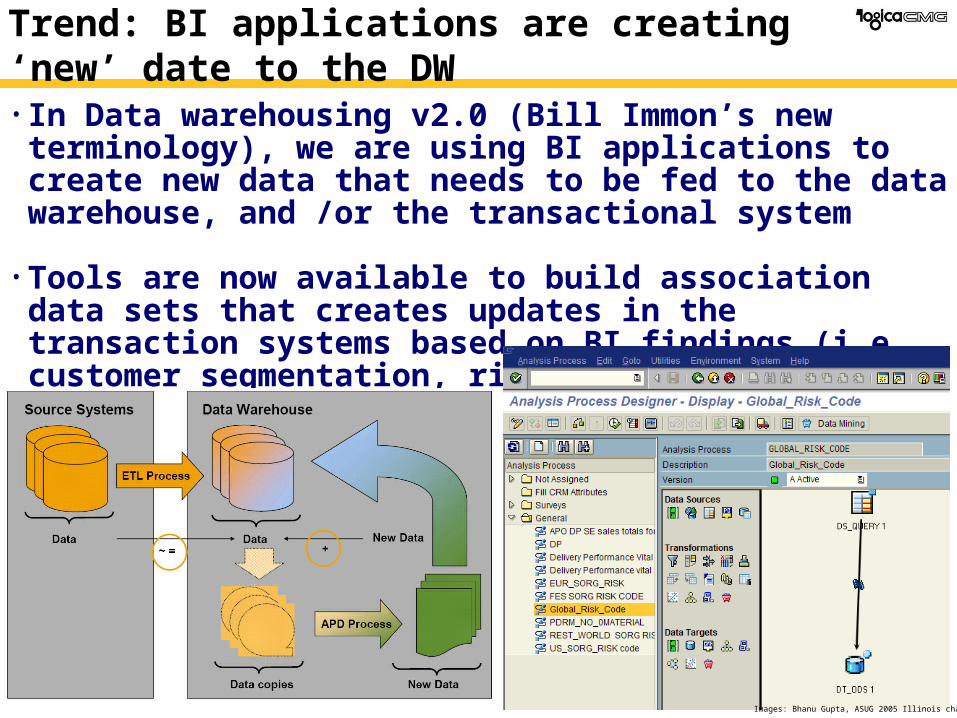
Trend: BI applications are creating ‘new’ date to the DW
• In Data warehousing v2.0 (Bill Immon’s new terminology), we are using BI applications to create new data that needs to be fed to the data warehouse, and /or the transactional system
• Tools are now available to build association data sets that creates updates in the transaction systems based on BI findings (i.e. customer segmentation, risk, profitability flagging etc).
Images: Bhanu Gupta, ASUG 2005 Illinois chapter

60
Joint Application Design(JAD)
Rapid Application Development(RAD)
Extreme Programming(EP)
System development Life-Cycle based methodologies
(SDLC)
Impact of FailureLow High
Low
High
Time to Delivery
When to Select Different Methodologies
Most BI projects are abandoning the vendor delivered methodologies
All major vendor’s have ‘proposed’ BI methodologies, but they are predominantly based on traditional approaches to building transaction systems.
SDLC methodologies are for building
transactional systems.
For BI, there are several other alternatives.
SDLC methodologies are for building
transactional systems.
For BI, there are several other alternatives.
Source: Dr. Bjarne Berg, SAP Project Management Conference - Oct. 2005, Las Vegas “How to pick JAD, RAD, XP or a SDLC Methodology for your IT project”
61
What We’ll Cover
• Overview BI and Data Warehousing
• Budgeting, staffing and scoping a project
• Selecting an OLAP Tool
• What are the ERP-BI vendors doing – a look at SAP, Oracle, PeopleSoft, Siebel, JDE’s BI tools
• The future of BI
• Wrap up
62
Your Turn!
Dr. Bjarne [email protected]
COMERIT (presentations,
articles, accellerators)www.comerit.net