A guide to learning about livelihood impacts of REDD+ · A guide to learning about livelihood...
110
A guide to learning about livelihood impacts of REDD+ projects Pamela Jagger Erin O. Sills Kathleen Lawlor William D. Sunderlin OCCASIONAL PAPER
Transcript of A guide to learning about livelihood impacts of REDD+ · A guide to learning about livelihood...

A guide to learning about livelihood impacts of REDD+ projects
Pamela Jagger
Erin O. Sills
Kathleen Lawlor
William D. Sunderlin
O C C A S I O N A L P A P E R


OccasiOnal paper 56
A guide to learning about livelihood impacts of REDD+ projects
Pamela JaggerUniversity of North Carolina at Chapel Hill
CIFOR
Erin O. SillsNorth Carolina State University
CIFOR
Kathleen LawlorUniversity of North Carolina at Chapel Hill
William D. SunderlinCIFOR
Occasional Paper 56
© 2010 Center for International Forestry Research. All rights reserved
ISBN 978-602-8693-29-5
Jagger P., Sills E.O., Lawlor, K. and Sunderlin, W.D. 2010 A guide to learning about livelihood impacts of REDD+ projects. Occasional paper 56. CIFOR, Bogor, Indonesia.
Cover photoTwo forest residents return home after collecting firewood, Ketapang district, West Kalimantan, Indonesia. © Andini Desita Ekaputri/CIFOR
CIFORJl. CIFOR, Situ GedeBogor Barat 16115Indonesia
T +62 (251) 8622-622F +62 (251) 8622-100E [email protected]
www.cifor.cgiar.org
Any views expressed in this paper are those of the authors. They do not necessarily represent the views of CIFOR, the authors’ institutions or the financial sponsors of this paper.
iii
Contents
Acknowledgements vi
Executive summary vii
Preface xi
1 The case for learning from REDD+ 1
1.1 Why do we need to learn from REDD+ projects? 1
1.2 Why impact evaluation of social welfare outcomes? 6
1.3 Which projects should be evaluated? 7
1.4 Learning from the past 8
1.5 How we proceed 9
2 Counterfactual thinking for learning from REDD+ projects 10
2.1 Selecting a research design: Basic assumptions 11
2.2 Selecting a research design: Basic questions 13
2.3 Selecting a research design: Basic options 14
2.4 Implementing a research design 20
3 Understanding the causal mechanisms that link REDD+ interventions to outcomes 23
3.1 Understanding ‘what’ and ‘why’ 23
3.2 Situating causal model development in impact evaluation design 24
3.3 Mapping and testing causal models 25
4 Practical considerations for understanding the social welfare impacts of REDD+ 32
4.1 Budgets and evaluation capacity 32
4.2 Ethical considerations 33
5 Moving ahead with realising REDD+: Guidance for learning about social impacts 35
References 37
Glossary 48
Annexes
A Worksheets 51
B Annotated bibliography 75
C About the technical guidelines and survey instruments 89

iv
Figures
1 Global distribution of forest carbon projects 2
2 Decision tree for research design 15
3 Falsely attributing welfare declines to a REDD+ project due to before–after comparison 18
4 Falsely attributing welfare declines to a REDD+ project due to control–intervention comparison without matching 19
5 Levels of community participation in research 34
Tables
1 Research design options for ex post evaluation of impacts based on empirical evidence 13
2 Components of a map of the causal chain 26
Boxes
1 Global REDD+ project distribution 2
2 Why we can learn from REDD+ projects 3
3 Standards and certification systems for REDD+ projects 4
4 CIFOR’s Global Comparative Study on REDD+ 5
5 The problem of counterfeit counterfactuals 18
6 Comparing causal models for linking interventions and outcomes 24
7 GCS-REDD survey of project implementation 28
8 Core hypotheses of GCS-REDD 30
List of figures, tables and boxes

v
List of abbreviations
3E+ Effectiveness, efficiency, equity and co-benefits
ACR American Carbon Registry
AR Afforestation/reforestation
ATE Average treatment effect
ATT Average treatment effect on treated
BACI Before–after/control–intervention
BAG Basic Assessment Guide
BMI Body mass index
BNS Basic Necessities Survey
CCBA Climate, Community and Biodiversity Alliance
CDM Clean Development Mechanism
CIFOR Center for International Forestry Research
COP 13 13th Conference of the Parties
FPIC Free, prior and informed consent
GCS Global Conservation Standard
GCS-REDD Global Comparative Study on REDD+
HDI Human Development Index
HLSA Household Livelihood Security Assessments
IFAD International Fund for Agricultural Development
IFRI International Forestry Resources and Institutions
IPCC Intergovernmental Panel on Climate Change
LOAM Landscape Outcomes Assessment Methodology
LSMS Living Standards Measurement Study
M&E Monitoring and evaluation
MRV Monitoring, reporting and verification
MSC Most significant change
NONIE Network of Networks Impact Evaluation Initiative
OECD Organisation for Economic Co-operation and Development
PA Proponent appraisal
PDD Project design document
PEN Poverty Environment Network
PES Payments for environmental services, payments for ecosystem services
PIA Participatory impact assessment
PRA Participatory rural appraisal
PSM Propensity score matching
REDD Reducing emissions from deforestation and forest degradation
REDD+ Reducing emissions from deforestation and forest degradation and enhancing forest carbon stocks
REL Reference emission level
SAPA Social Assessment of Protected Areas
SLF Sustainable Livelihoods Framework
SPI Survey of project implementation
SUTVA Stable unit treatment value assumption
UN United Nations
UNDP United Nations Development Programme
UNFCCC United Nations Framework Convention on Climate Change
VCS Voluntary Carbon Standard
VCU Voluntary Carbon Units
WCS Wildlife Conservation Society

vi
Acknowledgements
We have a long list of organisations and people to thank for contributing to the content, structure, and production of this guide. The work was supported by the Norwegian Agency for Development Cooperation, the Australian Agency for International Development, the UK Department for International Development, the European Commission, the Department for International Development Cooperation of Finland, the David and Lucile Packard Foundation, the Program on Forests (PROFOR), the US Agency for International Development and the US Department of Agriculture’s Forest Service. We are grateful to RTI International for a small grant that supported a working group and interuniversity graduate seminar on REDD+. The University of North Carolina at Chapel Hill (UNC-CH) and North Carolina State University (NCSU) provided institutional support. Specifically we recognise Megha Karmalkar of UNC-CH and Liwei Lin of NCSU for their support as undergraduate and graduate research assistants, respectively. Katrina Mullen, a postdoctoral researcher at NCSU, contributed research on the quality of retrospective data. Our families, especially Adam Lowe and Subhrendu Pattanayak provided logistical and moral support throughout the duration of the writing of this guide.
We have benefited from input through various forums on the content and structure of this guide. Early thinking was shaped by the writing of Chapter 22 in Realising REDD+ (Jagger et al. 2009). Stibniati Atmadja and Subhrendu Pattanayak were co-authors of that chapter. Arild Angelsen also provided important feedback on our ideas as they developed. A workshop titled ‘CIFOR’s Global Comparative Study on REDD+: A Review of Methods and Best Practices for Evaluation of REDD+ Projects’ was held in North Carolina in January 2010. We had fruitful discussions with participants at that meeting including: Soeryo Adiwibowo, Andre Rodrigues Aquino, Stibniati
Atmadja, Simone Bauch, Rizaldi Boer, Miguel Calmon, Susan Caplow, Mariano Cenamo, Paul Ferraro, Alain Karsenty, Anirudh Krishna, Liwei Lin, Erin Myers Madeira, Will Makin, Subhrendu Pattanayak, Mustofa Agung Sardjono, Frances Seymour, Satyawan Sunito, Peter Vaughan, Jeff Vincent and Sven Wunder. We also benefited tremendously from comments on our early ideas presented at a workshop organised by the Climate, Community and Biodiversity Alliance in May 2010 titled ’Workshop on Social and Environmental Impact Assessment for Land-based Carbon Projects’.
This guide has been shaped by conversations and email exchanges about REDD+ and impact evaluations with many colleagues, including Arild Angelsen, Amy Duchelle, Joanna Durbin, Paul Ferraro, Cecilia Luttrell, Erin Myers Madeira, Steve Panfil, Subhrendu Pattanayak, Daju Resosudarmo, and Michael Richards. The Triangle Working Group on REDD+, Brian Murray, and the students who participated in an interuniversity graduate seminar have given valuable feedback and helped shape our thinking. We benefited from insightful reviews by Andrew Wardell, two anonymous academic peer reviewers, and two anonymous practitioner reviewers. Their input has strengthened this guide considerably. We recognise and appreciate the efforts of the many people who contributed to the research instruments of CIFOR’s Global Comparative Study on REDD+ (GCS-REDD), which are part of this guide.
This guide was prepared under considerable time pressure. Several members of the Information Services Group at CIFOR worked tirelessly to publish this guide for launching at the 2010 UNFCCC Climate Change Conference in Cancún, Mexico. We are particularly grateful to Imogen Badgery-Parker, Vidya Fitrian, Edith Johnson, Glen Mulcahy, Andri Novianto, Handi Priono and Gideon Suharyanto.

vii
Executive summary
This guide is about understanding the livelihood impacts of first-generation REDD+ projects. These projects are being planned
and funded by a range of actors, with the aim of implementing a range of interventions to reduce deforestation and forest degradation, to promote conservation and sustainable management of forests and to enhance forest carbon stocks. The international community is looking to these projects for insight and guidance on the design of REDD+. Clearly, there are limitations to how REDD+ can be implemented and what it can achieve at the subnational level, and thus we should not expect the experience of projects to answer all of our questions about REDD+. However, by applying rigorous research designs and mapping the causal chains of projects, we can gather valuable evidence about how REDD+ interventions affect social welfare in forest regions. This guide provides an overview of such methods.
In the core text of the guide, we focus on the basic building blocks of careful research design and causal mapping. We make the case that the best way to learn from projects is to use a mixed-methods approach that employs the most rigorous impact evaluation methods to quantify impacts and interprets those impacts in light of a theory of change. The guide includes a series of technical worksheets (Annex A) and an annotated bibliography of toolkits, methods and research relevant to understanding the social welfare impacts of REDD+ projects (Annex B).
The Center for International Forestry Research (CIFOR) is building the evidence base on REDD+ through the Global Comparative Study on REDD+ (GCS-REDD). This study is examining REDD+ at both national and project scales, in terms of its
effectiveness at reducing carbon emissions as well as its efficiency, equity and co-benefits (the 3E+). Also included in the CD accompanying this guide are the GCS-REDD research instruments and accompanying technical guidelines that are being used to examine the consequences of REDD+ projects for social welfare. Although the focus of the guide is on REDD+ projects, the theoretical foundations and empirical methods described have relevance to a wide variety of conservation and development interventions.
A variety of research designs can be used to establish whether observed changes in social welfare are the result of project interventions. The choice of design will depend on the project timing, human and financial resources and influence of the evaluation team (see Table 1). This guide describes these designs, drawing on the recent but rapidly growing literature on rigorous impact evaluation of conservation and sustainable development projects. We provide a glossary and worksheet (Worksheet 1) to explain the terminology used in the impact evaluation field, with the goal of making it more accessible to those working in REDD+. One key concept is the ‘counterfactual’, which is similar to the ‘business-as-usual baseline’ in REDD+. In both fields, this is a central concept: to assess a project’s causal impacts or additionality, we have to establish what would have happened without the project.
The counterfactual is not likely to be best represented by a simple comparison with conditions before the project (because other factors would have led to changes even without the project) or with areas and forest users outside the project (because the fact that they were not selected for the project suggests that they were different in terms of some key factors). In fact, such comparisons

viii
have been termed ‘counterfeit counterfactuals’. One way to avoid counterfeiting is to build ‘experimental’ design into projects, phasing in or distributing interventions in a way unrelated to these other factors—typically through some form of randomisation. When this is possible, it is the best way to rule out rival explanations for observed impacts and determine if they can be attributed to the project. Another way is to employ ‘quasi-experimental’ methods (labelled BACI, BA and CI in the table) which use careful sample design.
‘Matching’ is an important tool for quasi-experimental methods. This is the process of identifying comparison sites or forest users who are similar to those in the project in terms of key factors that affect both selection into the project and the outcomes of interest. These factors are called ‘confounders’, because if they are not recognised, they can confound or obscure the impacts. For example, imagine that a proponent chooses to work with villages that are relatively vulnerable to climate change (e.g. droughts or floods). Even after the project, that greater vulnerability may result in lower social welfare than in a random sample of neighbouring villages. Therefore, instead of using a random sample, we should compare them with a
matched sample that is balanced in terms of initial vulnerability to climate change (before the project). These would be good ‘control’ observations for constructing the counterfactual.
In practical terms, it is difficult to identify and measure all of the confounding factors that influence both which areas are selected for projects and the outcomes in those areas. For this reason, the preferred quasi-experimental method is BACI, which involves collecting data both before and after the project, in matched control and intervention sites. The changes in outcomes can then be compared across these matched sites, effectively removing the influence of different starting conditions (because we consider only changes since the start of the project) and of external changes contemporaneous with the project, such as new national policies or weather anomalies (because these would affect both intervention and control sites). GCS-REDD is employing the BACI method. It requires significant resources for field research, in part because quantitative data must be collected before the project and in control sites (not just the standard data collection after the project in the intervention site). Resources should also be allocated to more qualitative data collection to
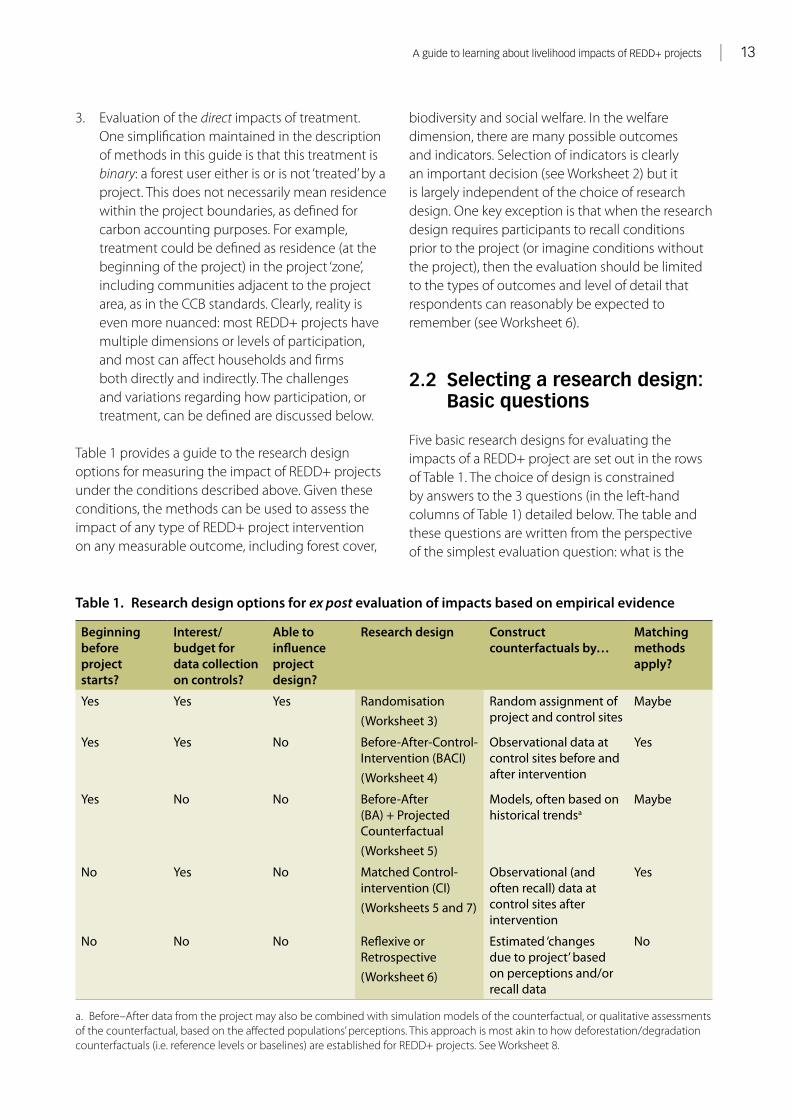
Table 1. Research design options for ex post evaluation of impacts based on empirical evidence
Beginning before project starts?
Interest/budget for data collection on controls?
Able to influence project design?
Research design Construct counterfactuals by…
Matching methods apply?
Yes Yes Yes Randomisation(Worksheet 3)
Random assignment of project and control sites
Maybe
Yes Yes No Before-After-Control-Intervention (BACI)(Worksheet 4)
Observational data at control sites before and after intervention
Yes
Yes No No Before-After (BA) + Projected Counterfactual(Worksheet 5)
Models, often based on historical trends
Maybe
No Yes No Matched Control-intervention (CI)(Worksheets 5 and 7)
Observational (and often recall) data at control sites after intervention
Yes
No No No Reflexive or Retrospective(Worksheet 6)
Estimated ‘changes due to project’ based on perceptions and/or recall data
No

ix
identify any external changes that affect only the intervention or control sites, i.e. any time-varying factors not accounted for in the sample design, and to map the causal chain (as discussed below).
Although this guide presents research designs as if forest sites or users can be neatly categorised into either ‘intervention’ or ‘control’ and either ‘before’ or ‘after’, it also recognises that reality is likely to be more complex. Many REDD+ projects are building on previous conservation initiatives, and it is important to describe these and recognise their influence on conditions ‘before’ the project. This makes it difficult to define a project’s start date. One way to address this is to recognise that many REDD+ projects are actually bundles of interventions, and to focus the evaluation on a particular component of that bundle introduced or expanded with financing tied to reductions in net carbon emissions. It may also be useful to evaluate the relative impacts of different components of that bundle (e.g. different ways to deliver incentives to forest users), rather than focusing only on the overall impact of the entire project.
‘Controls’ by definition should not be influenced by the project; that is, the fact that other forest sites become part of a REDD+ project should have no bearing on the outcomes in the control sites. However, the control sites should be similar to the project sites. Thus, the search for controls should start in the closest area to the project where there is no direct interaction with forest users in the project site. In between these two areas, there are likely to be forest users who are indirectly affected by the project interventions. If there are sufficient resources for the evaluation, these may be sampled as a third group, in order to assess spillovers or leakages from the project. At a minimum, forest users in the project site should be asked about activities—such as purchases of land or seasonal migration for work—that may affect forest users in other areas.
In this guide, we make a strong case for collecting information on the process of project implementation, using mixed qualitative and quantitative methods, and mapping a causal chain (also known as a theory of change). Quantifying the direction and magnitude of impacts on social
welfare is necessary but insufficient for learning lessons from REDD+ projects. We also need to learn about the processes underlying observed outcomes and their associated costs. Developing a theory of change (and understanding the project proponent’s theory of change) can help generate important insights into the causal mechanisms underlying observed outcomes. Quantifying the administrative costs (both implementation and transaction costs) of REDD+ projects is essential for drawing lessons from their impacts. Thus, putting together the ‘what’ (i.e. the observed outcome) with the ‘why’ (i.e. what causes the observed outcome) is critical.
Mapping causal chains is an iterative process. We highlight and provide an example of the 5 steps in this process. (1) identifying demographic, socio-economic, biophysical and institutional characteristics of the REDD+ site; (2) characterising the intervention, including whether the intervention was implemented as planned; (3) developing testable hypotheses based upon theoretical and empirical literature, and knowledge of site conditions; (4) identifying qualitative and quantitative data needs for testing hypotheses; and (5) testing hypotheses and revisiting initial assumptions about the causal mechanisms that link REDD+ project implementation to quantifiable changes in social welfare. Mapping causal chains requires significant investment in understanding what has actually happened on the ground with the REDD+ intervention, as well as how intervention activities have influenced various welfare indicators for forest users ranging from small-scale actors to large landholders. We also provide guidance on understanding impact heterogeneity amongst forest users in the REDD+ site. Having a clear understanding of the causal chain helps explain why some forest users experience social welfare gains as a result of the REDD+ project and others experience losses.
REDD+ stakeholders have several practical issues to consider when planning impact evaluation. These include complying with principles for ethical research: including local communities in the design and collection of data; providing information to communities and individuals about the purpose of the research and the potential

x
benefits of the research; and reporting findings to local stakeholders. Other considerations include budgeting and development of human resource capacity to evaluate impacts and causal mechanisms. We emphasise that evaluation of social impacts should be included in a project’s design and implementation plans before the project starts. This allows for the most flexible approach to evaluation, and also increases the likelihood of resources being invested in impact evaluation. The costs of estimating social impacts are justified given that the livelihood impacts of REDD+ are likely to be a major determinant of its political and social viability and the permanence of its contributions to climate change mitigation.
REDD+ projects operate at a variety of scales, in extremely diverse settings, and employ a range of interventions. No single method will be appropriate for evaluating all of the approximately 150 REDD+ projects that have been proposed or planned. Whilst variation presents methodological challenges, it also presents a learning opportunity. If we invest time and resources in evaluating a representative sample of REDD+ projects using state-of-the-art methods, rigorous research designs and mixed methods to understand causal chains, and then share findings amongst projects and regions, the lessons learned can help shape the future of REDD+ policy.
Women of Galinggang Village in Central Kalimantan take part in a group interview for the Global Comparative Study on REDD+. © Yayan Indriatmoko/CIFOR

xi
We anticipate that a future version of this guide will report on the best practices for evaluation as developed and tested through CIFOR’s GCS-REDD and other ongoing efforts to quantify the causal impacts of projects. We welcome feedback on this guide from stakeholders engaged in such efforts, whether as implementers, funders or researchers.
We focus on research designs for rigorous, empirical, ex post impact evaluation. The learning generated from such evaluations is a global public good. This knowledge is being obtained so current and future REDD+ projects can be improved, and so the experience of projects can inform the scaling-up of REDD+ to subnational and national levels. Although CIFOR’s GCS-REDD will measure both the socio-economic and biophysical outcomes of REDD+ implementation, in this guide we focus only on social welfare outcomes, for 2 reasons. First, we believe this is an area where there is limited evidence to inform the public debate, especially in comparison with the much larger research effort on carbon. Second, our methods for measuring biophysical outcomes at GCS-REDD project sites are still under development, so it is too early to give them in-depth attention in this guide.
We leave to other guides the important issue of evaluating impacts on biodiversity and local ecosystem services, perhaps as integrated components of carbon monitoring, reporting and verification systems. There are clearly synergies between evaluating carbon and livelihood outcomes (because both are mediated by decisions and behaviour regarding forest use), but impacts on livelihoods are typically not considered in the same framework or with the same level of rigour as for land use and carbon.
Preface
This guide is designed for stakeholders involved in REDD+ projects who want to learn about which interventions and conditions
lead to desirable outcomes, in order to ensure that their projects contribute to the improved design of the global REDD+ system(s). Specifically, this guide is for those who want to understand the implications of REDD+ for livelihoods in tropical forest regions by examining the causal effects of REDD+ projects on social welfare. The information contained in this guide should be of interest to multilateral and bilateral agencies and other donors that are funding REDD+ projects as demonstrations and pilots. For these projects to serve their purpose, rigorous impact evaluation should be planned, embedded in project design and fully funded. Our audience also includes national and regional governments funding and piloting REDD+ programmes, project proponents and non-governmental and civil society organisations tracking the impacts of projects, as well as the global research community.
The Center for International Forestry Research (CIFOR), as part of that global community, is employing the rigorous methods described in this guide to learn from a sample of REDD+ projects across Africa, Asia and Latin America. CIFOR’s Global Comparative Study on REDD+ (GCS-REDD) involves research at 20 REDD+ project sites, looking at the extent to which REDD+ projects fulfil the 3E+ criteria (effectiveness, efficiency, equity and co-benefits). The research project encompasses the socio-economic and biophysical dimensions of REDD+ implementation.
With this guide, we encourage other organisations to support, implement and cooperate with similar research to build a global evidence base on REDD+.

xii
Whilst we do not dispute the fundamental importance of understanding the carbon outcomes of projects that are designed and funded to mitigate climate change, we believe that the political and social viability of REDD+ rests on better understanding and managing the trade-offs and/or synergies between reducing emissions and improving social welfare. This is corroborated by the popularity of the Climate, Community and Biodiversity (CCB) Project Design Standards and by the interest in the new REDD+ Social & Environmental Standards facilitated by the Climate, Community and Biodiversity Alliance (CCBA) and CARE.
We believe that REDD+ projects and programmes should also be recognised for their contributions to learning about social impacts, e.g. for building in experimental or quasi-experimental evaluation design and funding data collection that meets the highest standards of evidence for causality. In addition to evaluating social welfare outcomes, we provide guidance on mapping the causal pathway from REDD+ intervention to outcomes. By both quantifying the impact and examining the reasons for that impact, evaluators can expand our relatively limited understanding of what factors favour positive social outcomes for conservation and development initiatives, including REDD+.
This in turn should inform and complement parallel work on methods for validating and verifying that those projects meet the standards of the voluntary markets and any future compliance markets.
In sum, this guide is most relevant to REDD+ stakeholders who are:
• committed to using rigorous research design and methods for understanding the social welfare outcomes of REDD+ projects;
• willing to evaluate ex post the causal impacts of REDD+ projects relative to what would have happened without those projects (which may be different than what was projected as the crediting baselines for those projects);
• interested in comparing and testing the convergent validity of different approaches to assessing social impacts (e.g. methods typically used for verification under voluntary carbon market standards such as the CCBA);
• attuned to the importance of understanding whether and where there are trade-offs or synergies between improving local social welfare and reducing global carbon emissions; and
• ready to allocate resources to contribute to global learning about REDD+ project implementation.

1.1 Why do we need to learn from REDD+ projects?
Since the Bali Conference of the Parties (COP 13) in December 2007, approximately 150 projects have been planned to reduce
emissions from deforestation and degradation and to promote the conservation, sustainable management of forests and enhancement of forest carbon stocks in developing countries; these are commonly known as ‘REDD+ projects’ (see Box 1).1 Additional funding and support for REDD+, including these projects, was one of the few concrete outcomes of COP 15 in Copenhagen in 2009 (Climate Funds Update 2010; Coria et al. 2010). One reason is REDD+’s reputation as a relatively quick, easy and low-cost way to slow down climate change, as reflected in the oft-repeated aphorism that ‘we know how NOT to cut down trees’. REDD+ also attracts support because of its perceived potential to multiply funding for conservation of biodiverse tropical forests and generate a new income stream for poor rural populations in tropical forest regions.
At the same time, REDD+ (at both project and national scales) remains highly controversial, with
fears that it will provide a loophole resulting in fewer net global reductions in emissions, that it will exacerbate existing inequalities and undermine the already tenuous rights of poor forest-dependent populations and that it will draw funding away from biodiversity (Sunderlin et al. 2009; Springate-Baginski and Wollenberg 2010).
REDD+ projects can provide evidence to inform this debate.2 They present a unique opportunity for us to learn how alternative interventions affect not only forests but also the people who live in, manage and depend on those forests. REDD+ projects are in many ways similar to past forest conservation initiatives (Blom et al. 2010), but they also offer new opportunities and challenges, not least of which is their performance-based orientation (Box 2). Project proponents expect and are planning for rigorous monitoring and evaluation of changes in land use and carbon emissions that will have real consequences for their funding. However, these projects will also have real consequences for local people, and there is both a clear need and an opportunity for rigorous evaluation of causal impacts on livelihoods. There is now a narrow, but critical, window of opportunity to lay the groundwork for this type of evaluation, through
The case for learning from REDD+1
1 We have identified proposals or plans for approximately 300 forest carbon projects. About half of those appear to be focused exclusively on afforestation/reforestation. Many of the remaining 150 that could become REDD+ projects are at the very early stages of planning. However, there are dozens moving forward with implementation, especially in Brazil, Peru, and Indonesia (Sills et al. 2009; Wertz-Kanounnikoff and Kongphan-apirak 2009).
2 Projects are just one source of evidence and way to learn about REDD+. As discussed in Angelsen et al. (2008) and Angelsen et al. (2009) there are limitations on what we can learn from projects; for example, they do not provide evidence on the impact of national policy change. Further, the measurement and leakage problems inherent in the project-level approach (Richards and Andersson 2001) may pose problems for accurately identifying forest and welfare spillovers in project impact evaluations and thus for learning lessons that can be extrapolated to national programmes covering a larger spatial scale. As described in Box 4, CIFOR’s Global Comparative Study on REDD+ includes components that focus on national policy processes and strategies, and modelling and monitoring national reference levels, in addition to examining the experiences of REDD+ projects.
2 | pamela Jagger, erin O. sills, Kathleen lawlor and William D. sunderlin
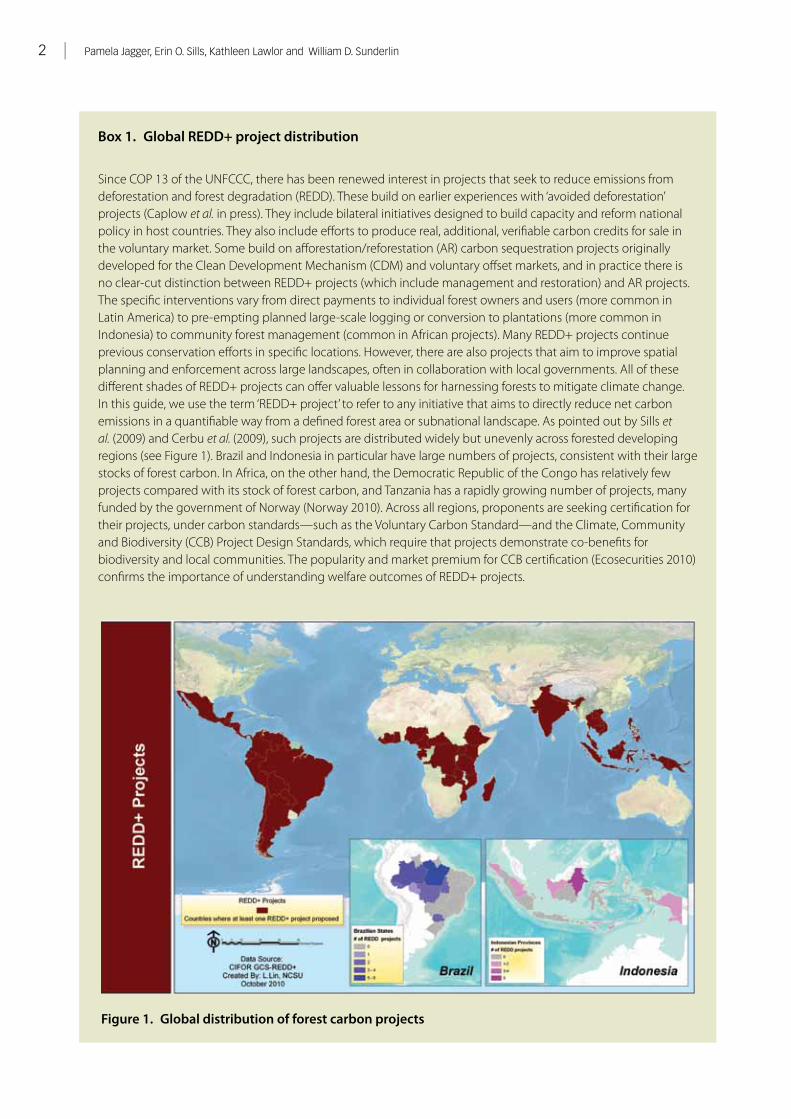
Box 1. Global REDD+ project distribution
Since COP 13 of the UNFCCC, there has been renewed interest in projects that seek to reduce emissions from deforestation and forest degradation (REDD). These build on earlier experiences with ‘avoided deforestation’ projects (Caplow et al. in press). They include bilateral initiatives designed to build capacity and reform national policy in host countries. They also include efforts to produce real, additional, verifiable carbon credits for sale in the voluntary market. Some build on afforestation/reforestation (AR) carbon sequestration projects originally developed for the Clean Development Mechanism (CDM) and voluntary offset markets, and in practice there is no clear-cut distinction between REDD+ projects (which include management and restoration) and AR projects. The specific interventions vary from direct payments to individual forest owners and users (more common in Latin America) to pre-empting planned large-scale logging or conversion to plantations (more common in Indonesia) to community forest management (common in African projects). Many REDD+ projects continue previous conservation efforts in specific locations. However, there are also projects that aim to improve spatial planning and enforcement across large landscapes, often in collaboration with local governments. All of these different shades of REDD+ projects can offer valuable lessons for harnessing forests to mitigate climate change. In this guide, we use the term ‘REDD+ project’ to refer to any initiative that aims to directly reduce net carbon emissions in a quantifiable way from a defined forest area or subnational landscape. As pointed out by Sills et al. (2009) and Cerbu et al. (2009), such projects are distributed widely but unevenly across forested developing regions (see Figure 1). Brazil and Indonesia in particular have large numbers of projects, consistent with their large stocks of forest carbon. In Africa, on the other hand, the Democratic Republic of the Congo has relatively few projects compared with its stock of forest carbon, and Tanzania has a rapidly growing number of projects, many funded by the government of Norway (Norway 2010). Across all regions, proponents are seeking certification for their projects, under carbon standards—such as the Voluntary Carbon Standard—and the Climate, Community and Biodiversity (CCB) Project Design Standards, which require that projects demonstrate co-benefits for biodiversity and local communities. The popularity and market premium for CCB certification (Ecosecurities 2010) confirms the importance of understanding welfare outcomes of REDD+ projects.
Figure 1. Global distribution of forest carbon projects

a guide to learning about livelihood impacts of reDD+ projects | 3
experimental design, detailed documentation of site selection and other implementation choices, and collection of baseline data from carefully selected samples of participants and non-participants. Careful research design applied to multiple projects pursuing a range of strategies under a range of conditions will allow us to assess what works and what doesn’t, to provide advice on the development of new REDD+ projects and to help plan for scaling-up or nesting REDD+ projects into regional and national systems.
REDD+ projects strongly resemble many other types of conservation and development projects that seek to influence or restrict the behaviour of small- or large-scale forest resource users with the aim of improving environmental conditions. In the case of REDD+, the explicit objective is to reduce deforestation and forest degradation, or promote forest restoration, rehabilitation and conservation, in a way that reduces net carbon emissions. The plan for accomplishing this—or the project’s ‘map of the causal chain’—very often requires changes in the way local people make their living, for example because of reduced employment in sawmills or adoption of new agricultural practices that do not use fire to clear new cropland. (See Annex B.4 for a selected list of literature on drivers of deforestation and degradation.) In many REDD+ projects, these changes are intended to have net positive effects for ‘development’ or local livelihoods. In addition, many project proponents would like to quantify and receive credit for their contributions
to the welfare of local forest users, for example via certification under standards developed by organisations such as Climate, Community and Biodiversity Alliance (CCBA) or Plan Vivo (Box 3). The challenge for the REDD+ community is the same as the challenge for the broader conservation and development community: how do you determine which changes in the environment (carbon) and well-being are a direct result of your intervention? That is, when can your project take the credit (or the blame)?
A common framework for assessing REDD+ is referred to as 3E+: effectiveness, efficiency and equity plus co-benefits (Angelsen 2009). Perhaps the greatest effort has been put into developing methodologies for measuring the first ‘E’, or impacts on net carbon emissions; see Annex B.5 for a list of references and resources on carbon monitoring, reporting and verification (MRV). There are also efforts to build on carbon MRV to generate the information required to assess impacts on other ecosystem services and biodiversity (e.g. Teobaldelli et al. 2010). This guide explores methods for measuring the impact of REDD+ projects on the other 2 Es, specifically the impacts (costs and benefits) on local people that can be attributed to projects. Our emphasis is on rigorous impact evaluation methods and research designs that provide empirical evidence on the counterfactual—that is, an ex post picture of what would have happened to social welfare in the absence of the REDD+ intervention.
Box 2. Why we can learn from REDD+ projects
Reasons REDD+ projects present a unique opportunity for learning include: • global distribution and relatively coordinated timing of projects • significant allocation of financial resources for development, implementation, monitoring and evaluation• explicit mandate for learning set by international negotiators• emphasis on ‘conditionality’ and ‘additionality’, which are consistent with and supportive of the impact
evaluation framework• implementation of projects focused in geographically defined areas, which enables comparison with other
areas (more difficult with national policies)• likelihood that many open questions about potential trade-offs and synergies between carbon and livelihood
impacts will be manifested at the project scale• ability to draw on recent rapid advances in methods for causal impact evaluation, mostly developed and
applied in other policy fields but transferrable to conservation projects and programmes such as REDD+

4 | pamela Jagger, erin O. sills, Kathleen lawlor and William D. sunderlin
Box 3. Standards and certification systems for REDD+ projects
The voluntary carbon offset market is currently the only sales outlet for carbon credits generated by REDD+ projects. This ‘market’ actually includes a wide range of exchanges, brokers and buyers making direct purchases. Hamilton et al. (2010) record 2846 ktCO2e in REDD+ credits traded in 2009, up sharply from 730 ktCO2e in 2008, although still a small part of the market. Buyers are often motivated by corporate social responsibility and/or a desire to position themselves for expected future compliance markets. In either case, they seek guarantees that the credits they purchase actually reduce net carbon emissions, and do so without negative impacts on biodiversity and local livelihoods. More than a dozen standards and certification systems have been developed to provide these assurances. Only some of these certify REDD+ projects (CORE 2010) and address persistent questions about additionality, leakage and permanence of REDD+, as well as looking at impacts on local people and the environment.
The leading standard is the Voluntary Carbon Standard (VCS), which was used by more than a third of all credits traded in the voluntary market in 2009 (Hamilton et al. 2010, VCS 2010). The VCS focuses on the integrity of emissions reductions, including an independent risk analysis and required contributions to a pooled buffer. It has partnered with 3 registries to track its verified VCU (Voluntary Carbon Units). Many REDD+ projects intend to certify their credits to the VCS (Ecosecurities 2010), but this requires first developing and obtaining ‘double approval’ of methodologies for establishing baselines, adjusting for leakages and monitoring, reporting and verification of land activities and emissions. The approval of methodologies has proven to be a significant bottleneck. As of August 2010, only one methodology—for avoided planned deforestation—had been approved, although several others for unplanned deforestation and degradation on frontiers and in mosaics were under review. Likewise, the American Carbon Registry (ACR) has proposed a REDD+ methodology, which was open for public review and comment as of August 2010 (ACR 2010).
The other leading standards for REDD+ projects were developed by the Climate, Community and Biodiversity Alliance (CCBA 2010). The CCBA maintains a registry of projects that have been certified to its standards, but does not issue verified emissions credits. CCBA also does not approve specific methodologies but has contributed to a new manual that provides guidance on low-cost methods for assessing the social benefits of forest carbon projects (Richards and Panfil 2010). The CCB standards were originally designed to help differentiate high-quality projects that respect the rights of and generate benefits for local people, as well as conserving biodiversity. However, CCB certification has become essential for both market access and credibility; for example, many REDD+ project proponents—regardless of whether they plan to sell credits—aim to meet CCB standards (Madeira et al. 2010). A recent market survey found that many buyers were willing to pay a price premium for projects with both VCS and CCB certification (Ecosecurities 2010).
The CCBA is also working with CARE to develop and pilot the REDD+ Social & Environmental Standards for governmental REDD+ programmes to demonstrate their social and environmental ‘co-benefits’.
There are several other standards designed to be ‘stacked’ on carbon accounting standards, such as Social Carbon, although these have much more limited coverage. Finally, there are also standards that seek to cover both carbon accounting and social benefits, such as Plan Vivo.
The Center for International Forestry Research (CIFOR) has launched a Global Comparative Study on REDD+ (GCS-REDD) that takes up the challenge of rigorous evaluation of REDD+ projects (see Box 4). This guide explains the research design and provides the research tools used by ‘Component 2’ of the GCS-REDD to quantify project impacts
on social welfare. One goal of this guide is to encourage and facilitate wider adoption of the GCS-REDD approach to help build the global evidence base on REDD+. However, this guide also presents a variety of other research designs that demand different levels of data collection and statistical analysis. We discuss the reasoning behind and the

a guide to learning about livelihood impacts of reDD+ projects | 5
Box 4. CIFOR’s Global Comparative Study on REDD+
Updated information on this comparative study is available at www.forestsclimatechange.org.
Realising REDD+ requires new knowledge and expertise• Given the urgency of climate change and the need for expedited information, CIFOR will analyse REDD+
policies and practices and subsequently propagate the information to a global audience. • CIFOR intends to create effective and efficient tools in order to reduce forest emissions and produce co-
benefits such as poverty alleviation and biodiversity conservation.• The goal is to influence the design of REDD+ projects on the following 3 levels:
- Local: site and landscape projects, with community-based monitoring systems. - National: development of policies, including scenarios for national reference levels. - Global: REDD+ architecture in the post-2012 climate protection agreement.
CIFOR works with an extensive network of partners including: project proponents, policymakers and negotiators, all of whom would benefit from guidance and reflection on their own activities, as well as from other projects conducted around the world. • Throughout this 4-year initiative, CIFOR will provide information for designing REDD+ projects in the pre-2012
period and implementing them in the post-2012 period.• The work is divided into 4 interrelated components and will be conducted in 9 countries in Latin America,
Asia and Africa. Annual conferences and workshops will be held to share ideas and lessons learned. Publications will be produced to support REDD+ implementation.
Component 1: National REDD+ processes and policies• Assessment of first-generation processes using rigorously designed strategies, such as analysis of media
discourse, policy network surveys and scoring of strategy content, to guarantee high-quality results• Analysis of how national processes that formulate REDD policies reflect different interests at all levels • Ensure resulting outcomes follow the 3Es+ principle
Component 2: REDD+ project sites• Collection of data before and after implementation of study interventions at 20 REDD+ project sites, including
directly affected villages and control villages• Creation of an online global REDD database from extensive data collection • Production of a practitioner’s manual on how to learn from REDD after the first study year to improve
performance in attaining 3E+ outcomes
Component 3: Monitoring and reference levels• Improvement of methods for establishing reference emission levels to help countries determine likely future
ranges of emissions• Improvement of the availability of emissions factors for implementing IPCC methods to account for national
greenhouse gases • Development of appropriate community-based measurement methods
Component 4: Knowledge sharing• Preparation of knowledge-sharing strategy• Development of an online learning community through creation of an interactive website• Sharing of information at major events and conferences• Creative use of media to engage journalists from diverse outlets

6 | pamela Jagger, erin O. sills, Kathleen lawlor and William D. sunderlin
data requirements of each research design, as well as budgetary, human capacity and ethical issues.
Rigorous impact evaluation3 quantifies the direction and magnitude of a REDD+ project’s causal effect. That is, impact evaluation tells us not only ‘what’ happens as the result of a project, but also ‘why’ we observe those outcomes. Qualitative methods, including observations and in-depth conversations in the field, are important for selecting outcome measures and interpreting estimated effects. Quantifying the administrative costs (both implementation and transaction costs) of projects is essential for drawing lessons from their impacts. In this guide, we present a ‘mixed-methods’ approach to developing and testing a ‘map of the causal chain’ for social welfare impacts of REDD+ projects.
1.2 Why impact evaluation of social welfare outcomes?
The Bali Action Plan requires REDD+ projects to measure changes in net carbon emissions that result from project activities. This has forced the scientific community and project developers to grapple with the concept of counterfactual scenarios for projects (typically called ‘reference levels’ or ‘baselines’ in the REDD+ world, as explained in Worksheet 1). Establishing what would have happened to carbon emissions in the absence of a project is key to determining whether that project provided any additional reductions in carbon emissions. The incentive-based mechanisms that underpin REDD+ mean this type of approach is necessary to understand carbon impacts.
This guide is based on the premise that we need to place impacts on carbon emissions in context by equally rigorous estimation of impacts in other domains—including impacts on the well-being of people who live and work in the project area. Evaluating these local welfare impacts is critical for understanding the broader social implications
and long-term political feasibility of REDD+. More immediately, project proponents, donors and certifying organisations such as the CCBA and Voluntary Carbon Standard (VCS) need to know the outcomes of their projects and what trade-offs between conservation and livelihoods are associated with those outcomes. We argue that the success or failure of REDD+, at any scale, depends on the possibility of designing interventions that at the very least do no harm to local populations, and in the best case scenario lead to favourable joint outcomes of reduced net carbon emissions and improved rural livelihoods.
In this guide, we define ‘social welfare’ broadly to include a wide range of factors that influence human well-being. The GCS-REDD method focuses on household income (both in kind and cash), its composition (e.g. the extent to which it is derived from agriculture, forestry or other sources) and how and why it changes. To understand why impacts are or are not observed, the GCS-REDD pays careful attention to voice and empowerment (e.g. to the extent to which local populations are involved in the process of permitting, conceptualising and implementing REDD+), knowledge (inasmuch as knowledge plays an important role in voice and empowerment), gender (recognising that income, employment opportunities, livelihood opportunities, property rights, voice and knowledge are strongly conditioned by gender in most cultures) and tenure (as property rights over land and resources have an important role in guiding the outcomes of REDD+ interventions).
The ideal research designs for quantifying project impacts on social welfare and ruling out alternatives—or rival explanations—involve collecting data before and after, from inside and outside the project. This imposes additional costs beyond the current requirements of voluntary carbon market standards. For the GCS-REDD, these costs will be amply repaid by what we learn about REDD+ in general and REDD+ projects in
3 In this guide, we use the term ‘evaluation’ broadly, but the term ‘impact evaluation’ refers to a specific set of research designs and methods for assessing and understanding outcomes of policies, programmes and projects. Impact evaluation—also called programme evaluation—is concerned with quantifying effects and examining the extent to which the measured effects can be attributed to the programme and not to other causes (Khandker et al. 2010). See Worksheet 1 for a detailed review of terms used in impact evaluation and REDD+.
a guide to learning about livelihood impacts of reDD+ projects | 7
particular. Rigorous impact evaluation will provide real evidence to help resolve controversies over the livelihood implications of REDD+. When applied to a range of interventions under a range of conditions, and in conjunction with mixed methods to understand why certain impacts are observed, impact evaluation will help improve current projects and identify best practices for future projects. Finally, impact evaluation can help validate and improve ex ante methods of projecting outcomes in project areas under intervention and baseline conditions, as well as providing more accurate inputs to models of the very long-term impacts of REDD+.
1.3 Which projects should be evaluated?
Rigorous impact evaluation, especially using the preferred research designs, is expensive in terms of the effort required to design the research, the budget required for data collection and the statistical skills required for data analysis. Clearly, not all REDD+ projects can or should be evaluated using these methods to assess their causal impacts on social welfare. This raises the questions of who should invest in such evaluations and which projects should be evaluated.
Some proponents may be interested in employing these methods for the sake of monitoring and managing their portfolio of projects or regional programmes (e.g. subnational government initiatives designed to satisfy the criteria laid out in the REDD+ Social & Environmental Standards). Concrete evidence on causal effects will help proponents avoid being blamed for or facing expectations for results that are not actually due to their projects. This will allow them to focus instead on the results (good or bad) that are actually under their control in the sense of being caused by REDD+ interventions. Rigorous impact evaluation, using methods that ensure high internal validity, provides a solid basis for reporting on and improving REDD+ projects and programmes.
The potential gains for learning from individual projects to help plan future REDD+ systems are even greater. Most obviously, rigorous evaluation
of early projects should help identify the best interventions to scale up and avoid investing further resources in interventions that do not work (or that have negative consequences for social welfare). By providing a credible evidence base, rigorous evaluation of early pilot and demonstration projects can help manage expectations and guide adjustments, perhaps keeping REDD+ from falling into the ‘hype cycle’ typical of development and conservation fads that cannot meet unrealistic expectations (cf. Skutsch and McCall 2010). Thus, rigorous impact evaluation of REDD+ projects should fall within the mandate of a wide range of bilateral, multilateral and international organisations whose mission includes developing effective strategies for climate change mitigation.
To meet this broader goal, evaluations of REDD+ projects must also have external validity, generating lessons that can in fact be generalised. This suggests that priority should be given to evaluating projects that are testing interventions likely to be scaled up in areas that are representative of the broader landscape and with groups that are representative of larger populations. Further, evaluations of projects whose proponents are willing to share information on implementation costs will prove most useful for assessing trade-offs and complementarities across the 3E+ outcomes. Finally, proponents who are willing to incorporate experimental design, phasing in implementation or testing different options in subsamples selected in a way unrelated to their other characteristics, can potentially provide both high internal and high external validity. This will be the case if the interventions or implementation options tested are of general interest and if the ‘experiments’ can be repeated across projects.
Donors and funding programmes supporting large numbers of REDD+ projects could potentially greatly magnify their contribution to learning by identifying key questions about the types of interventions and conditions conducive to positive outcomes for well-being, and then providing sufficient funding (and a mandate) for the data collection required for rigorous and consistent evaluation of these interventions under different conditions (cf. Baker et al. 2010). CIFOR’s GCS-REDD (Box 4) is an example of this type of evaluation

8 | pamela Jagger, erin O. sills, Kathleen lawlor and William D. sunderlin
programme, applying consistent and rigorous methods across a range of projects in order to obtain results with high internal and external validity. Project proponents across Africa, Asia and Latin America have agreed to cooperate with the GCS-REDD in order to contribute to global knowledge about REDD+.
1.4 Learning from the past
The literature on evaluating natural resource management and conservation policy reforms provides important lessons for assessing REDD+ projects. The first lesson is that rigorous impact evaluation methods, which quantify what the change would have been in the absence of the intervention, have rarely been applied to conservation investments (Ferraro and Pattanayak 2006, Schreckenberg et al. 2010). For example, most published evaluations of payments for ecosystem services (PES) are qualitative case studies drawing on records of government and non-governmental organisations, reviews of grey literature, key informant interviews and rapid field appraisals (Pattanayak et al. 2010). This also holds true for early avoided deforestation projects (Caplow et al. in press).
The number of efforts to apply rigorous impact evaluation methods to conservation interventions is increasing. For example, the Global Environmental Facility has funded a project employing experimental design to evaluate the impact of PES in Uganda (GEF 2010), and the Wildlife Conservation Society has gathered extensive data on initial conditions in communities at various distances from new protected areas in Gabon (Wilkie et al. 2006). However, most rigorous impact evaluation of conservation interventions is based on ex post data collection. The key is that data are collected on both ‘treated’ and ‘control’ units, e.g. households or watersheds inside and outside a REDD+ project boundary. If the sample is large enough and there is sufficient variation in the data, this can support various types of statistical analyses.
Traditionally, the most common method is to regress outcomes on an indicator for whether the unit is ‘treated’ by the project and any potentially confounding factors (e.g. to estimate a regression
model of household income as a function of household characteristics and an indicator of whether the household falls inside or outside the REDD+ project). However, this standard approach has been criticised for potentially strong reliance on distributional assumptions and extrapolation across very different treated and non-treated units. ‘Matching’ methods, developed to address these issues, are increasingly being applied to evaluate the outcomes of policies related to natural resources and conservation. Most recently, researchers have applied combinations of matching and regression to obtain ‘doubly robust’ estimates of impacts.
A range of interventions and outcomes have been examined in recent impact evaluation literature. These include the causal impact of individual, transferable quotas on the collapse of fisheries worldwide (Costello et al. 2008); moratoria on development in the USA (Bento et al. 2007); protected areas on forest cover in Costa Rica (Andam et al. 2008), Sumatra (Gaveau et al. 2009a) and globally (Nelson and Chomitz 2009); PES on forest cover in Costa Rica (Arriagada 2008, Pfaff et al. 2008); decentralised management on forest cover in India (Somanathan et al. 2009); devolution of forest management on household income from forests in Malawi (Jumbe and Angelsen 2006) and Uganda (Jagger 2008); integrated conservation and development projects on household livelihoods (Weber et al. in press); and protected areas on poverty reduction (Bandyopadhyay and Tembo 2009, Andam et al. 2010, Sims 2010).
Regardless of the exact statistical method and topic, all impact evaluations could benefit from data on conditions before the intervention took place, whether recalled by households, reconstructed from remote sensing or secondary data or (preferably) recorded through pre-project surveys. Previous studies have often faced difficulty ruling out alternative explanations for observed impacts because of lack of data from before the intervention. With ‘before’ data, changes in outcomes can be compared across matched samples of treated and control units, and those treated and control units can be matched based on their characteristics before they were affected

a guide to learning about livelihood impacts of reDD+ projects | 9
by the intervention—thus emphasising the factors that were observed in the field to influence the selection of sites and recruitment of participants into the project.
1.5 How we proceed
The remainder of this guide is structured as follows. In the following section we discuss the central role of counterfactual thinking in evaluating REDD+ projects, and we present several research designs for ex post evaluation of the social welfare impacts of projects. We examine the conditions and factors shaping the choice of research design, and some of the technical aspects associated with implementing the designs. In Section 3, we make a case for developing causal models and theories of change about why the REDD+ intervention is expected to affect the well-being of forest users and other major stakeholders. We emphasize the use of mixed methods to develop causal models, understand the process of REDD+ project implementation,
and interpret the findings of rigorous impact evaluations. In Section 4, we provide guidance on practical considerations for designing rigorous evaluations of REDD+ projects, including budgets, evaluation capacity and ethical considerations. Supporting all of this is a series of worksheets (Annex A), which explain terminology, discuss selection and measurement of variables, provide more technical detail on the research methods and explain options for distributional analysis. This guide focuses on research design for impact evaluation in large part because other key issues in evaluation (such as development and measurement of indicators) are well described in other resources, which we list in Annex B. Throughout the guide we draw on methods and examples from CIFOR’s GCS-REDD (Box 4) as an example of the implementation of one of the most robust research designs presented in this guide: Before–After/Control–Intervention (BACI). Annex C includes the full technical guidelines and questionnaires employed for data collection on REDD+ project sites across Africa, Asia and Latin America.
Two forest residents return home after collecting firewood, Ketapang district, West Kalimantan, Indonesia. © Andini Desita Ekaputri/CIFOR

The debate over REDD+ is fed in part by the different places, assumptions, scales and methods employed to examine its carbon,
biodiversity and livelihood implications. In particular, the different points of view are often based on very different assumptions about the alternative to REDD+: what would the world, or a particular region, look like without REDD+? This lack of consistency—and sometimes lack of explicit consideration—of the counterfactual scenario fuels the debate and provides little basis for systematically assessing the dimensions and conditions under which there are trade-offs or complementarities. Whilst it is probably not possible or even desirable to harmonise methods across these domains, we argue that there should be common principles for evaluating the first generation of REDD+ pilots. One of these principles is that any evaluation should develop and specify its counterfactual. In this section, we consider the different approaches to counterfactual thinking in carbon MRV and impact evaluation. Worksheet 1 compares the different terminology used in these 2 fields.
The importance of monitoring and evaluation (M&E) is universally recognised amongst conservation, development and indeed REDD+ project proponents. M&E includes identification of desired outcomes or goals (e.g. increased household wealth and preserved biodiversity) (Worksheet 2) and conceptual models that describe the causal links between the project and desired outcomes (Worksheet 8). In REDD+, methodologies for carbon accounting (or MRV) have been the subject of intense focus—and rightly so, because if that
accounting is wrong, then the fundamental goal of reducing global greenhouse gas emissions is undermined. As is common in M&E, much of the effort focuses on defining and measuring the outcomes, including emissions per hectare under different land uses, and changes in the areas under those land uses (e.g. Global Observation for Forest and Land Cover Dynamics (GOFC/GOLD) 2009).
There is also a substantial literature and many competing proposals (Parker et al. 2009) and models (e.g. Hertel et al. 2009) on defining counterfactual land use scenarios for purposes of crediting (i.e. the baseline) in an international REDD+ system. There is a smaller published literature (e.g. Brown et al. 2007)—but a burgeoning number of methodologies and other practical guidance—on estimating the land use counterfactual in projects seeking to generate carbon credits (See Annex B.5). These methodologies concentrate on how to establish a credible ex ante counterfactual (baseline) and a credible ex ante claim that the project will result in different outcomes (additionality, as shown by uncompetitive financial returns, institutional barriers and lack of previous adoption). Ex post evaluation of outcomes in the project area is part of monitoring and verification. However, most methodologies—including afforestation/reforestation methodologies under the Clean Development Mechanism (CDM) and proposed REDD+ methodologies under the VCS and American Carbon Registry (ACR)—do not require ongoing monitoring and verification in control or reference areas outside the project.
Counterfactual thinking for learning from REDD+ projects2

a guide to learning about livelihood impacts of reDD+ projects | 11
These methodologies generally do require that baselines (or counterfactuals) be periodically reassessed and updated. In this reassessment, information on the actual emissions from reference areas becomes relevant for developing a new ex ante counterfactual. Under CCBA, there are also requirements to assess ex ante the livelihood and biodiversity impacts of a project compared with the counterfactual, and then periodically verify these estimates. The type of ex post, quantitative, empirical evaluation that we advocate in this guide is most similar to project verification that includes reassessing (or revisiting) the baseline.
One key difference between the methods discussed in this guide and carbon MRV is that project proponents typically focus on developing ex ante baseline scenarios that define the credits that can be expected if projected outcomes are realised in the project area, whereas the methods discussed in this guide are focused on examining what actually would have happened in the counterfactual using ex post information. Another difference between carbon accounting and evaluating impacts on livelihoods is the relative difficulty of measuring outcomes. On the carbon side, it is usually possible to reconstruct a historical series of land cover data using remote sensing. This is typically the basis for both ex ante projections of the carbon baseline and ex post assessment of carbon emissions in the project area. By contrast, secondary data on socio-economic conditions are usually much more limited, meaning that project proponents or researchers must gather primary data themselves, starting before the project. As discussed in Worksheet 6, asking respondents to recall prior conditions is another possibility, although it has significant limitations.
Project carbon accounting and the design-based research on social impacts proposed here have some key similarities. For example, both (1) require a credible estimate of the counterfactual (called the ‘baseline’ or ‘reference level’ in the carbon literature); (2) are concerned with accurate measures of relevant outcomes (land use change and emissions versus income, consumption or wealth); (3) seek to establish attribution of outcomes to the project (called ‘additionality tests’ in voluntary carbon market standards, and ‘treatment effects’ in impact evaluation); and (4) are concerned with spillovers
or leakages (e.g. defining and monitoring a leakage belt under voluntary carbon market standards, and verifying the ‘SUTVA’ or stable unit treatment value assumption in impact evaluations).
In practice, if a project results in more carbon retained (additionality), then it is likely to have changed people’s behaviour and welfare. This in turn is likely to have created leakages, because people always react, seeking to maximise utility in the face of constraints. If the additionality in the project area was obtained at a welfare cost (e.g. through reduced production), then there are likely to be leakages to other areas that result in welfare gains (e.g. through increased production). This is consistent with the typical concern that leakages will result in more carbon emissions (i.e. that they are a negative in terms of carbon accounting). Thus, the real story about the socio-economic impacts of REDD+ may be more about distribution than about total net impacts on welfare. This issue is addressed in Worksheet 9 on distributional impacts, and later in this section when we define which forest areas and users are ‘treated’ and which are ‘controls’. Although project impacts can extend to much larger areas, it remains important to consider the ‘local’ socio-economic impacts, for a number of reasons, including the local right or claim on forest resources, the importance of local actors in directly determining the fate of the forest (and therefore the permanence of the carbon credit) and the fact that in many places, these local actors are relatively disadvantaged (relatively poor) and therefore merit special focus.
2.1 Selecting a research design: Basic assumptions
In this guide, we describe a range of impact evaluation methods for REDD+ projects that are subnational activities—that is, projects that are implemented in a defined geographical area and/or with a defined subset of ‘forest users’, including households and possibly businesses that own, manage and use forest resources. These same methods can also be used to estimate the impact of participation in national programmes (e.g. PES in Costa Rica and Mexico), as long as there is variation in coverage (e.g. not all eligible forest users participate).

12 | pamela Jagger, erin O. sills, Kathleen lawlor and William D. sunderlin
With these types of projects and programmes, the overall impact is a function both of the proportion of the population covered (e.g. what regions are selected, or which forest users participate) and of the causal effect of the intervention on that population. The methods described in this guide are primarily concerned with estimating the causal effect on the covered population. In impact evaluation, this is typically called the effect of ‘treatment’. As discussed in later in this section ‘treatment’ can be defined in various ways, from a forest owner voluntarily entering into a contract for PES to forest-dependent communities around a concession being affected by changes in its management.
The impact evaluation methods described in this guide are based on statistical analysis of empirical evidence, i.e. observations (whether from surveys, remote sensing or secondary data) of outcomes in the real world. These methods apply under the following conditions regarding treatment.
1. There must be both ‘treated’ and ‘untreated’ forest regions and/or users. As a corollary, it must be possible to imagine that any treated region or forest user could have been untreated. For example, these methods would not apply to a national policy that affects everyone in a country or that affects everyone in a certain category, such as a law that applies to all indigenous groups.
2. There must be numerous participants, so that it makes sense to estimate the average effect of treatment (the average effect on either the treated or the entire population). For example, these methods would not be appropriate for estimating impacts on one large logging company in a country where only a few such companies are operating.
When multiple forest users are potentially affected by a project but not all of them are actually ‘treated’, then the methods described in this guide can be employed to evaluate the following types of impacts.
1. Ex post evaluation of realised impacts, that is, evaluation of what the project caused to happen. In terms of the current voluntary carbon market standards, this is most similar to a verification process in which the project baseline is also reassessed and updated. This is different from
the ex ante projections required for project validation under voluntary carbon market standards. Most of the methods described in this guide also differ from verification of what happened in the project area compared with the projected baseline, which is often required for initial project verification. Judging a project against a projected baseline reduces uncertainty about the carbon offset credits that can be expected, because it means that those credits depend only on what the project accomplishes relative to the projected baseline, and not on all of the factors outside of the project’s control that could potentially shape the counterfactual. The methods described in this guide provide less certainty from an investor’s perspective, because they quantify a project’s impacts compared to a counterfactual that represents what actually would have happened in the absence of the project. Thus, these methods for assessing project impact are perhaps more appropriate for learning for the future than for judging a project’s past performance.
2. Evaluation of impacts expected within the relevant time window for policymaking. For impact evaluation to inform the REDD+ policy debate, the evaluation results must be available in a time frame relevant to that policy debate. This does not allow time for empirical observation of the long-term impacts of REDD+ projects, if we assume that decisions about climate change mitigation policy will be made before long-term impacts (10+ years from now) are observed. However, as described in Worksheet 8, the observed outcomes could be intermediate steps in a long-run causal model. For example, observable changes in asset ownership or seasonal migration patterns might be critical variables in a model of long-term welfare gains and land use patterns. The long-term impacts of REDD+ are clearly fundamentally important for mitigation of climate change. We can have greater confidence in long-term projections that are based on assumptions consistent with the findings from empirical, ex post evaluations of intermediate impacts, using rigorous methods that rule out rival explanations.
a guide to learning about livelihood impacts of reDD+ projects | 13
3. Evaluation of the direct impacts of treatment. One simplification maintained in the description of methods in this guide is that this treatment is binary: a forest user either is or is not ‘treated’ by a project. This does not necessarily mean residence within the project boundaries, as defined for carbon accounting purposes. For example, treatment could be defined as residence (at the beginning of the project) in the project ‘zone’, including communities adjacent to the project area, as in the CCB standards. Clearly, reality is even more nuanced: most REDD+ projects have multiple dimensions or levels of participation, and most can affect households and firms both directly and indirectly. The challenges and variations regarding how participation, or treatment, can be defined are discussed below.
Table 1 provides a guide to the research design options for measuring the impact of REDD+ projects under the conditions described above. Given these conditions, the methods can be used to assess the impact of any type of REDD+ project intervention on any measurable outcome, including forest cover,
biodiversity and social welfare. In the welfare dimension, there are many possible outcomes and indicators. Selection of indicators is clearly an important decision (see Worksheet 2) but it is largely independent of the choice of research design. One key exception is that when the research design requires participants to recall conditions prior to the project (or imagine conditions without the project), then the evaluation should be limited to the types of outcomes and level of detail that respondents can reasonably be expected to remember (see Worksheet 6).
2.2 Selecting a research design: Basic questions
Five basic research designs for evaluating the impacts of a REDD+ project are set out in the rows of Table 1. The choice of design is constrained by answers to the 3 questions (in the left-hand columns of Table 1) detailed below. The table and these questions are written from the perspective of the simplest evaluation question: what is the
Table 1. Research design options for ex post evaluation of impacts based on empirical evidence
Beginning before project starts?
Interest/budget for data collection on controls?
Able to influence project design?
Research design Construct counterfactuals by…
Matching methods apply?
Yes Yes Yes Randomisation(Worksheet 3)
Random assignment of project and control sites
Maybe
Yes Yes No Before-After-Control-Intervention (BACI)(Worksheet 4)
Observational data at control sites before and after intervention
Yes
Yes No No Before-After (BA) + Projected Counterfactual(Worksheet 5)
Models, often based on historical trendsa
Maybe
No Yes No Matched Control-intervention (CI)(Worksheets 5 and 7)
Observational (and often recall) data at control sites after intervention
Yes
No No No Reflexive or Retrospective(Worksheet 6)
Estimated ‘changes due to project’ based on perceptions and/or recall data
No
a. Before–After data from the project may also be combined with simulation models of the counterfactual, or qualitative assessments of the counterfactual, based on the affected populations’ perceptions. This approach is most akin to how deforestation/degradation counterfactuals (i.e. reference levels or baselines) are established for REDD+ projects. See Worksheet 8.

14 | pamela Jagger, erin O. sills, Kathleen lawlor and William D. sunderlin
impact of the project? (In Section 3, we return to the question of evaluating the impact of how a project is implemented.)
Q1. Is the impact evaluation being designed ‘before’ the REDD+ intervention to be evaluated? Typically, impact evaluations are launched after an intervention has been designed and implemented, because all resources early in the project are dedicated to implementation—that is, getting the intervention underway. However, more credible ex post estimates of project impacts can be obtained by building experimental design into the project and/or collecting data ex ante, before the intervention begins. We discuss the issue of how to define the starting point of the project later in this section.
Q2. Are there sufficient resources for and commitment to evaluation to support collection of information on forest users who are not part of the project? This is a significant additional investment beyond the requirements of voluntary carbon market standards (e.g. for VCS or CCBA). Developing a baseline for validation typically requires an understanding of what is happening in the broader region, but not ongoing data collection outside the project area. Likewise, monitoring and verification focus on the project area, and—where relevant—a ‘leakage belt’ or buffer zone. Renewal of the crediting period generally requires assessment of land cover changes in the reference region (outside the project area), in order to develop another forward-looking baseline for the next crediting period. This is most often based on remote sensing supported by information gathered from forest users through participatory or qualitative methods. Collecting data on forest users outside the project area through surveys is not standard practice in REDD+ projects or any other conservation initiatives (for an exception, see Wilkie et al. 2006).
Q3. If the evaluation is being designed ‘before’ and there are sufficient resources to gather data on non-participants, the third question to consider is: Can the intervention itself be designed to facilitate the evaluation? Specifically,
can the evaluators influence who or which areas receive the intervention and when? This is a function both of the evaluators’ relationship with the project proponent and of the specific intervention being evaluated. It also depends on scale: it is unlikely that evaluators could (or would even want to) influence the choice of state or province where a project will be implemented; at the other end of the scale, PES is by definition a voluntary transaction and therefore participation of individual households or farms must be voluntary. However, it is possible that the particular areas (e.g. villages) where the PES programme is offered first could be selected to facilitate the ex post evaluation of the impact of that programme.
2.3 Selecting a research design: Basic options
We can also work backwards through the 3 questions in Table 1 to choose a research design, as illustrated in Figure 2. This highlights the critical decision of whether to incorporate experimental design into the intervention. To use experimental design to measure the impact of the overall project, the evaluation must be designed before the intervention and there must be resources to collect data on controls; that is, on the upper branch of Figure 2, the answers to Q1, Q2 and Q3 are all ‘yes’. In this case, treatment can be randomised (e.g. based on a lottery) to ensure that, on average, forest users selected for the project are similar to forest users not selected in terms of both observable characteristics, such as family size, and unobservable characteristics, such as preference for work in the forest. That is, because neither forest users nor programme administrators decide who is included in the project, but rather leave this to an independent randomisation process, there is no relationship between treatment and other factors that might affect outcome; thus, there is no selection bias (Worksheet 3). This provides the most credible estimates of causal impacts. In other policy domains, it has helped expand and disseminate policy models shown to be effective (e.g. rigorous impact evaluation of the conditional cash transfer programme in Mexico is widely credited with establishment of similar programmes in other countries (World Bank 2009)).

a guide to learning about livelihood impacts of reDD+ projects | 15
The randomisation could take several forms. For example, when a project is over-subscribed (e.g. more households are seeking PES contracts or project employment than there are funds available), participants could be randomly selected from the pool of applicants. When a phased rollout of the project is planned, the areas where it is implemented first could be randomly chosen. For example, the opportunity to participate in PES contracts might be offered first to forest users in a randomly selected group of villages, then 3 years later to another randomly selected group.
To draw conclusions about causal impacts, data must be collected on both the randomly selected (i.e. treated) and the randomly non-selected (i.e. control) forest users. If the project is offering benefits to forest users (e.g. PES contracts), then political or ethical motivations may require that the controls be brought into the project at a later date. In many cases, this will fit well with a project’s financial constraints and plans for intensifying implementation, but it can represent a challenge in projects with guaranteed funding for only a short timeline.
Ideally, data on selected and non-selected forest users should be collected before and after project implementation, in order to verify that their initial distribution of characteristics is similar (before the project) and to compare outcomes (after the project). (At the very least, data on characteristics and outcomes must be collected after the project
intervention.) Whilst we expect randomisation to result in similar samples of treated and control forest users, it is possible that any particular random draw will result in samples with some statistically significant differences in their initial characteristics. In that case, matching methods—described further below—may be employed to identify and weight a subsample of the controls.
Although Figure 2 shows 2 main branches, there is a third possibility: project proponents may by accident introduce a random element into the selection of forest users for the project, thereby creating a ‘natural experiment’. For example, imagine that project sites are selected partly based on the location of plots from some historical botanical inventory. If those plots are unrelated to current biophysical and socio-economic conditions, their location could serve as an ‘instrumental variable’ for project participation. For this to be useful for evaluation, the random element must be a strong determinant of selection into the project but otherwise unrelated to outcomes. It is rare to find such a random element, but in projects where one appears, it is worth collecting data on the element to proxy experimental design via the instrumental variables method (Angrist and Pischke 2009).
If experimental design (or a ‘natural experiment’) is not feasible, then Figure 2 leads to a matrix of ‘quasi-experimental’ research designs. The design most often employed by project proponents is BA,
Figure 2. Decision tree for research design
Q2 Q1 Starting before Starting after
Budget to study non-participants
BACI
(Worksheet 4)
CI
(Worksheets 5 + 7)
Budget for participants only
BA
(Worksheet 5)
Reflexive/retrospective
(Worksheet 6)
Q3: Influence project design?
Experimental (randomisation,
Worksheet 3)Yes
No

16 | pamela Jagger, erin O. sills, Kathleen lawlor and William D. sunderlin
comparing outcomes in the project area Before and After the intervention (often supplemented with a model of counterfactual outcomes). By contrast, the most common design in the scientific literature on ex post impact evaluation is CI, comparing outcomes in Control and Intervention areas. The best quasi-experimental design for credible estimates of impact—and the most difficult and expensive to implement—is BACI, or Before–After/Control–Intervention. Finally, if there are no data from before the project and it is not possible to collect data from non-participants during the project (due to budgetary or other restrictions), then the remaining option is to ask participants for either their own assessment of the project impact or their recollection of conditions before the project started. Whilst asking participants about their opinion and understanding of the project should surely be part of any comprehensive evaluation (e.g. as the qualitative or participatory component of mixed methods), this provides the weakest ‘observational’ evidence and thus is the research design of last resort for impact evaluation.
If the evaluation is being launched before the intervention (i.e. if the answer to Q1 is ‘yes’), then baseline data should be collected on (1) how forest users are selected for the project, often called the ‘selection mechanism’ (including data on rejected applicants, where relevant); (2) the initial level of outcome variables, such as income, wealth and forest dependence; and (3) household, farm and village characteristics that influence (1) and (2). This information should be collected at least for forest users in the project, to support the BA method (Worksheet 5). This should be relatively easy to integrate into the baseline data collection required to design the project and obtain validation in the voluntary carbon market. To fully implement the BA (or BACI) research design, the data need to be recorded in such a way that it is possible to return to the same villages and households in the ‘after’ phase (i.e. identifying information on specific forest users and not just averages must be recorded, in order to build a panel dataset). If this is not possible, then matching methods (described below) can be employed to identify similar cohorts of households in the before and after phases of the survey (Shadish et al. 2002).
Although the BA research design is likely to fit well with the data collection plans of project proponents, it does not provide a clear-cut way to assess causal impacts of the project. One option is simply to assume that conditions would not have changed without the project—but that is unlikely to represent reality. Another option is to extrapolate from trends observed in the ‘before’ period (e.g. if respondents report declining employment and income, assume that those declines would have continued). However, outcomes for forest users ‘treated’ by the project will be a function not only of previous trends and the project, but also of any other contemporaneous changes. Macro-economic shifts, policy or regulatory changes, abnormal weather or unrelated programmes or policies could all plausibly affect the outcome. These factors could either mask or exaggerate the intervention’s effect if prior conditions and trends are used as a ‘counterfeit counterfactual’ (see Box 5 for definition and examples). In methodologies being developed for the voluntary carbon market, these concerns are most often addressed by projecting the counterfactual outcome based on a model (see Worksheet 5).
Controlling for these contemporaneous changes empirically (based on observations rather than models) requires data on non-participants, or ‘controls’; that is, the answer to Q2 must be ‘yes’. To estimate the effect of treatment, these controls should be similar to the forest users in the project in terms of all characteristics that influence both selection into the project and outcomes (see Worksheet 10 on variables). This is true for both the CI and the BACI methods. Of course, every village and every household is unique in some respect; in the real world, there will not be exact mirror images of the forest users in the project. This would be true with randomisation as well—the randomly selected non-participants would not look exactly like the randomly selected participants. However, in expectation and on average, they would be similar because they would be drawn randomly from the same population. Quasi-experimental methods seek to replicate this by selecting a pool of controls that, in expectation and on average, look like the treated—that is, the samples of treated and controls are ‘balanced’.

a guide to learning about livelihood impacts of reDD+ projects | 17
As described in Worksheet 7, matching is often used to identify balanced samples of treated and controls. Prior to data collection, some form of ‘pre-matching’ on easily observable characteristics may be used to design a survey sample. For example, the survey sample might include potential controls who live in the same ecological zone or watershed as the forest users treated by the project. Or it might involve more elaborate pre-matching of villages or households based on secondary data. For example, statistical matching methods could be used to identify the control villages most similar to the project villages. The result would be a ‘matched’ set of treated and control villages from which forest users would be selected randomly as the final step in sampling. Popular econometric software programmes, such as STATA and R, offer packages or modules that automate matching and provide indicators of the resulting ‘balance’ in characteristics across the 2 samples. It is most important to achieve balance in characteristics that are potential confounders, that is, that influence both selection into the project and outcomes of interest.
Statistical matching is also employed after data are collected in order to identify the best controls from amongst those surveyed. One popular method is to estimate a model of selection into the project (a probit or logit regression model) based on a large number of variables collected through a survey, and then match based on the resulting ‘propensity score’, or probability of selection. Ex post matching is often done ‘with replacement’, allowing the same control to be selected multiple times. Thus, forest users in the project may be matched to a relatively small subsample of the controls who are most similar. Using these matched subsamples, outcomes are either compared directly (e.g. t-test for difference in mean income) or modelled using multivariate regressions (e.g. income as a function of household and farm characteristics, and an indicator for project participation). Because the regression is estimated with only the subsample selected by matching, the results are not based on extrapolation across very different groups of treated and control forest users.
In the CI method, secondary data from before the project (e.g. from census or remote sensing) may be used to select sample villages for a survey, but
the survey data on households are by definition collected after the intervention. This makes it challenging to identify controls who are similar to treated forest users before the project was initiated, in terms of confounders that influence both outcomes and selection into the project, but that are not in turn influenced by the project itself. In this case, matching is often based on retrospective data (e.g. asset ownership before the project) or ‘fixed’ characteristics (e.g. origin of household head), as described in Worksheet 7. This highlights a major potential drawback of the CI method: missing data on important confounders. This may result from the difficulty of reconstructing conditions before the project or, more fundamentally, from the difficulty of observing factors such as preferences of a household or the specific spatial configuration of a farm. Examples of the type of counterfeit counterfactual that can arise from inadequate matching of controls are given in Box 5.
If the unobserved characteristics of forest users do not change over time, then the influence of these characteristics can be removed by using the BACI research design (Worksheet 4). In BACI, a sample of controls is identified before the intervention and included in the baseline data collection. Outcomes and confounders are measured in that baseline phase, and possibly used to further narrow the sample of controls. Outcomes are then measured again ‘after’ the project. This allows analysis of 2 ‘differences’: the change in outcomes before and after the project, compared between controls and treated. This ‘difference-in-difference’ represents the impact of the project, uncontaminated by any unobserved differences, as long as those differences do not vary over time. Complementary mixed methods (such as direct observations and conversations in the field) should be employed to identify time-varying factors that are not adequately captured in the data. CIFOR’s GCS-REDD is employing the BACI approach, and thus the appendices of this guide provide extensive information on how to implement this method in the field.
Implementing the BACI approach typically requires planning the evaluation before the intervention begins; however, there may also be circumstances in which other data—from government statistics

18 | pamela Jagger, erin O. sills, Kathleen lawlor and William D. sunderlin
Box 5. The problem of counterfeit counterfactuals
Simply comparing post-project conditions with pre-project conditions, or with conditions at another site, and attributing any differences in observed outcomes to the project typically does a poor job of ruling out rival explanations for observed welfare outcomes. As such, these before–after or with–without comparisons are often referred to as ‘counterfeit counterfactuals’, and their inadequacy has motivated the development of the impact evaluation approaches discussed in this guide, such as randomisation and BACI (Khandker et al. 2010). Simple before–after comparisons and with–without comparisons have frequently been used to evaluate the impacts of conservation interventions. Notable examples include Bruner et al. (2001) and Oliveira et al. (2007), which both use with–without comparisons to estimate the impact of protected areas on biodiversity and forest loss, respectively. The following examples illustrate how these ‘counterfeit counterfactual’ approaches could incorrectly attribute differences in welfare outcomes to a REDD+ project.
Imagine a REDD+ project is begun in the forested area near the capital city in Country X. Detailed welfare data are collected in the communities in the REDD+ project zone just before project activities begin and then again 5 years later (see Figure 3). The data reveal that, on average, there have been significant declines in welfare. The evaluation attributes these welfare declines to the REDD+ project, much to the disappointment of the project proponents, the financiers and the government of Country X. However, just as the REDD+ project was starting, the currency of Country X was devalued and the size and salaries of the civil service were cut dramatically, leading to years of welfare decline across the country—especially in those communities heavily reliant on civil servant income and actively trading in the market economy. Although welfare did decline at the REDD+ project site, the carbon revenues that the project brought in to the communities actually led them to be better off than they would have been without the REDD+ project. However, the simple before–after comparison missed this impact.
Welfare
General trend in regiondue to currencydevaluation
REDD+ project site
Control site
Positive impact of REDD+ project missed byevaluation
Figure 3. Falsely attributing welfare declines to a REDD+ project due to before–after comparison
Now imagine a simple with–without comparison in the same setting (see Figure 4). Welfare is measured at one point in time, 5 years after project start, in both the REDD+ project communities and in another group of communities located in the same province, but outside the REDD+ project zone. The data reveal a large gap in welfare between the project and control sites, with average welfare much higher at the control site. This evaluation also concludes that the REDD+ project has caused the local community economic harm. However, when the civil service was cut, the jobs of those who belonged to the same ethnic group as the President were spared. This turned out to be the dominant ethnic group in the control communities but not in the REDD+ project communities. Because the control and intervention sites were not matched on ethnic composition, the simple with–without comparison falsely attributes welfare declines to the REDD+ project.

a guide to learning about livelihood impacts of reDD+ projects | 19
agencies or other studies—can be employed to approximate the BACI method. As with natural experiments, these are likely to be rare cases, but certainly worth watching for and exploiting. Some projects may be implemented in a large enough area (or with a large enough population of forest users) that they can be represented by secondary data from a sample survey such as the Demographic and Health Surveys (DHS), Living Standards Measurement Studies (LSMS) or country-specific surveys such as the Pesquisa Nacional por Amostra de Domicílios (PNAD) in Brazil or the Indonesia Family Life Survey (IFLS). Such sample surveys can be employed if (1) they occur both before project implementation and at some later stage and (2) they include questions on relevant confounders and outcomes. For reasons of sampling intensity and confidentiality, the results from such surveys are typically reported at fairly aggregated levels. For very large projects, these aggregate statistics may be useful. In other cases, it may be possible for evaluators to obtain confidential access to more disaggregate data. A second possibility is that a project happens to be implemented in part of an area where other researchers had previously collected data on forest users. If those researchers have and are willing to
share data on confounders and outcomes, the BACI method could be implemented by returning to and interviewing the same households in the after phase. Perhaps the most common approach to ex post project evaluation is retrospective or reflexive analysis, employing only data from forest users in the project only after project implementation. This is likely to be the most politically acceptable form of evaluation because it seeks information only from people who have potentially benefited from (by participating in) the project. The assessment of impact relies on forest users’ retrospective reports on outcomes before the project compared with their current outcomes after the project, or alternatively, their own stated evaluation of project impacts. Retrospective reports can be triangulated through a combination of household interviews and group or participatory methods; however, they are likely to work best with outcome measures that focus on direction of change or large discrete events or possessions (e.g. asset indices rather than measures of consumption or income); see Worksheet 6. Another approach would be to use stated preference techniques from non-market valuation to construct the value or cost of the hypothetical alternative (without the project).
Welfare
Before REDD+projectstart
AfterREDD+projectstart
General trend in regiondue to currencydevaluation
REDD+ project site
Positive impact of REDD+ project missed byevaluation
Figure 4. Falsely attributing welfare declines to a REDD+ project due to control–intervention comparison without matching

20 | pamela Jagger, erin O. sills, Kathleen lawlor and William D. sunderlin
Although the retrospective or reflexive approach is both common and convenient, it provides only weak evidence on impacts, compared with methods that employ data from before the intervention, controls without the intervention or both. It is unlikely to stand up to the demand for ‘evidence-based policymaking’ or to help resolve controversies over the local impacts of REDD+. In projects designed to pilot or demonstrate REDD+, we should seek to gather evidence more carefully and document medium-term impacts of the project more rigorously. These estimates of impact will be fundamental for projecting the very long-run and large-scale impacts that are the goal of international climate change mitigation.
2.4 Implementing a research design
2.4.1 Defining ‘before’ and ‘after’
Many REDD+ projects build on previous conservation and development initiatives. Thus, projects often do not have a clear-cut beginning. For example, the start of a project may be defined as the start date of the crediting period (e.g. for the voluntary carbon market) or it may be earlier if preparatory activities are believed to have a significant impact on welfare or land use. One way to address this issue is to define the start date in terms of a particular intervention implemented by a REDD+ project, such as a PES system or a real-time monitoring and enforcement system, and then evaluate the impact of that particular component over and above the impacts of prior and possibly ongoing activities. For the BA or BACI research designs, this will define when data on outcomes ‘before’ the project should be collected. For the other research designs, this will influence the collection of retrospective data.
Ideally, retrospective data—for matching or estimating impacts—should represent the time period immediately before the project started. Employing data from after the project start to establish the baseline is likely to underestimate the effects of the project (in the retrospective method) and could bias selection of controls (in the Control–Intervention method). However, employing data from long before the start of the project will also
make estimates less precise—but not introduce additional bias. As discussed in Worksheet 6, another practical consideration in choosing the time period for eliciting retrospective data is that major events (e.g. droughts, elections) can improve accuracy of recall.
The definition of ‘after’ can be as ambiguous as ‘before’. REDD+ projects by design have very long time horizons (i.e. to receive carbon credits from changes in deforestation and forest degradation, ‘permanence’ needs to be demonstrated). Waiting 20 to 30 years to evaluate the biophysical or social impacts of REDD+ interventions is not feasible if we are to learn from REDD+ pilots. A map of the causal chain, as described in Section 3, can be useful for identifying when in the project timeline we should expect to observe any impacts. Ideally, data on outcomes should be collected in several waves, to understand how impacts evolve over time and to make course corrections if desired project outcomes are not being observed. Realistically, the demand for information to inform policy decisions may mean that data on outcomes will be collected relatively soon after implementation and thus will reflect short-term impacts. For example, the GCS-REDD includes plans to assess social impacts 2 years after implementation. This time frame represents the minimum period in which we could expect to see social impacts.
2.4.2 Defining control and intervention
Table 1 and Figure 2 provide a guide to evaluating the impact of REDD+ projects as a whole, assuming that forest users can be classified as either participants (directly impacted) or non-participants (not impacted). Here, we consider how these concepts can be applied to other situations, including projects with multiple interventions and scales of implementation, and with indirect impacts or leakages. We illustrate this using an example of PES contracts with farmers to conserve the forested portions of their farms, but the concepts generalise to other interventions (e.g. employing local people to restore public forest) and other types of forest users (e.g. households that collect fuelwood for cooking and heating). We conclude this section with some recommended starting points for managing these issues.

a guide to learning about livelihood impacts of reDD+ projects | 21
When projects include multiple interventions, multiple ‘treatments’ can be defined. For example, farmers who sign PES contracts with the project proponent could be one treated group, and farmers who receive technical assistance could be a second treated group. These groups could be compared with each other and with a third group of non-participants who have similar characteristics but receive neither treatment. Although we have focused on a binary definition of treatment for purposes of exposition, all of the methods in Table 1 could be used to evaluate alternative interventions. In some cases, the most important question may not be the size of the project’s impact, but rather how a project can achieve the most impact. This can be addressed with experimental or quasi-experimental methods. For example, alternative forms of conditional benefits being considered by the project (cash payments to households vs. in-kind payments to communities) could be randomised across villages in the project area. Alternatively, quasi-experimental methods could be used to construct matched samples of forest users who have experienced different forms of project implementation. Different statistical techniques are required to analyse multiple or continuous treatments, but many econometric programmes are incorporating these into modules for estimating treatment effects.
In many REDD+ projects, there are different degrees of treatment at different scales. Continuing with the same example, the most ‘intense’ treatment could be contracts with individual farmers, who receive incentive payments, participate in training and education programmes and are subject to monitoring and enforcement of their contracts and related forest laws. The training and education programmes may actually involve entire villages (including but not limited to the farmers with contracts), and the increased enforcement may extend to the entire area (either by design or as a result of implementation ‘spillovers’ from processing remote sensing images and sending enforcement personnel through the area to check on the properties under contract). In this case, the ‘treated’ units could be the farmers with contracts, their villages or the region where the project is implemented. In part, this depends on the definition of ‘the project’ to be evaluated: do
we want to evaluate the impact of PES contracts, conditional on some background level of increased information and enforcement? Or do we want to evaluate the entire bundle of interventions, including PES contracts, information and enforcement?
The evaluation methods described in this guide generally assume that other forest users are not affected by the treatment of forest users in the project (in statistical terms, this is called the ‘stable unit treatment value assumption’ or SUTVA). As suggested by the literature on land use and carbon ‘leakages’, this assumption is often violated (see Annex B.5). PES contracts that effectively change farmers’ forest and land use are likely to also change those farmers’ demand for inputs (e.g. labour and equipment) and supply of outputs (e.g. crops and livestock products). This in turn will have an impact on others who interact with the participating farmers through local markets. Projects that are large compared with those local markets also influence prices; for example, if the intervention reduces the supply of agricultural products from the project area, this could result in higher prices, which would in turn encourage consumers to switch to substitute products and producers in other areas to increase supply.
In general, if a project reduces economic activity and deforestation in the project area, but that economic activity and deforestation leak to nearby areas, then we would overestimate the impact of the project by comparing activity in the project area with activity in the nearby area. On the other hand, if project benefits create an option value for forest conservation in nearby areas—e.g. if nearby forest owners seek to position themselves to also gain access to those benefits—then we would underestimate the impact of the project by comparing the 2 areas.
To help sort through these various ways that ‘treatment’ by a project could be defined and could have direct or indirect impacts, we recommend the following as default starting points for evaluation.
1. Unit of analysis. In most cases, projects are seeking to change the behaviour of households. Therefore, the unit of analysis

22 | pamela Jagger, erin O. sills, Kathleen lawlor and William D. sunderlin
should be the household, including all of its lands and activities—even if only one parcel is under a PES contract, or only one person is employed by the project. Most REDD+ projects are implemented in regions where markets for inputs and outputs are not complete. In this setting, households are likely to respond to an intervention by adjusting their activities within the household; for example, when the household reduces deforestation and production in one area, it is likely to compensate in other areas, dampening the total net carbon and welfare impacts (cf. Alix-Garcia et al. 2010). By examining the entire household, these ‘leakages’ are internalised to the analysis. Some REDD+ projects target entire villages, for example, providing improved public services in exchange for conservation of nearby public forests. In these cases, the logical unit of analysis is the village, meaning that the sample size for the impact evaluation is defined by the number of villages, rather than by the number of households.
2. Treatment. In most cases, the key question is the impact of the bundled set of interventions that constitute the project. Therefore, in most cases, the ‘treatment’ should be defined as that bundle of interventions that is paid for jointly and most likely to be scaled up jointly. If some other question—such as the effectiveness of alternative ways to implement the intervention—is of greater interest, then either the resources and the sample size for the evaluation need to be increased, or the evaluator needs to choose between estimating the total impact of the intervention and comparing the effectiveness of the alternatives. This definition of the project influences both which forest users should be sampled as the treated and which should be sampled as controls.
3. Controls. In addition to not being directly treated by the project, controls should generally be sampled from villages and areas that do not directly interact with the forest users
treated by the project; for example, they are not likely to sell or buy land from one another, share or hire labour from one another, sell products to one another or share information and techniques with one another. In effect, this means that households in the same or immediately adjacent villages are unlikely to be good controls, although clearly this depends on the structure of local social and transportation networks. Because controls should be similar—including facing similar biophysical and market conditions—the search for controls should start in the closest areas to the project where forest users do not directly interact with treated forest users.
4. Indirect effects. Many projects will have at least some indirect effects (leakages or spillovers). Evaluations should proactively look for these effects, whether through (1) mixed methods and qualitative assessment, (2) sampling design and/or (3) indicators elicited through the survey of treated forest users. First, as part of evaluating the process of project implementation, the possible types of leakages should be identified. For example, a project that offers PES contracts conditional on stopping all logging will have different implications for leakage (e.g. shifting demand to other areas and products) than a project that offers PES contracts conditional on adopting reduced impact logging techniques (e.g. spillover adoption of those techniques). Second, sampling could be expanded to include non-treated forest users who live or work in the project area, along a distance gradient from the project, or in the ‘leakage belt’ as defined by the proponent for certification in the voluntary carbon market. This would allow testing for evidence of indirect effects at certain geographical levels (e.g. village) or distances (e.g. within 5 km of the project). Third, the survey questionnaire could elicit evidence of indirect effects from treated forest users, by asking them about suspected leakage mechanisms such as purchase of land or seasonal migration outside the project area.4
4 Where indirect effects are identified as a major concern—either because they are suspected to be large or because they are an explicit goal of the project as in dissemination of a new technology—they may merit their own study. For example, experimental design employing multilevel randomisation could be used to estimate indirect effects, assuming that there is some prior knowledge of the structure of these effects. Methods outside the scope of this guide include CGE models that explicitly consider price formation, spatial econometrics, models of social networks or peer effects and agent-based models that focus on interactions amongst agents over space and time.

3.1 Understanding ‘what’ and ‘why’
Our discussion thus far has centred on causal inference by design (i.e. randomisation or quasi-experimental BACI, BA or CI)
and on using statistical approaches to control for confounders and to estimate the effects of covariates within an impact evaluation framework. These methods are the most credible way to test whether a project has impacts, and to determine the size of those impacts. These methods can also be used to examine how outcomes vary across demographic and socio-economic groups, either by subgroup analysis or by regression models estimated with carefully selected samples (Worksheet 9). All of this is the ‘what’ of impact evaluation.
To learn from these evaluations, we also need to understand ‘why’ impacts did or did not occur. To understand why a REDD+ intervention leads to some observed social welfare outcome, impact evaluation should be embedded in a mixed-methods approach that includes mapping the causal chain catalysed by project implementation. In fact, many project proponents will have gone through a similar process as part of designing their projects, especially if they received funding from or are part of an international aid organisation with its own framework, checklist or other requirements for causal models. These include logic models (e.g. the Logical Framework Approach) (Coleman 1987, Gasper 2000, Ortengren 2004, DFID 2009), outcome mapping (Earl et al. 2001), open standards (CMP
2007) and theory of change (Kusek and Rist 2004, Furman 2009) (see Box 6). Projects seeking CCBA or VCS certification may also undertake causal chain mapping as a way of understanding the anticipated social impacts of REDD+ projects.
Although causal mapping and rigorous impact evaluation are both commonly applied to development interventions, they are rarely used in tandem or integrated as a theory-based impact evaluation (Reynolds 1998, White 2009). Reynolds (1998) cites the following 3 reasons for the slow adoption of theory-driven evaluations.
1. Mapping the causal chain often requires the effective use of mixed methods. Approaches that integrate ethnographic, qualitative institutional analysis, participatory methods and quantitative analysis are outside the realm of conventional social science methods for programme evaluation (i.e. the goal of the evaluator is traditionally viewed as evaluating impact).
2. There has been limited interest among stakeholders and policymakers in theoretical evaluation, in part because theoretical models linking interventions and outcomes are not well developed in some substantive fields, including the field of conservation and development.
3. Theory is sometimes negatively viewed as normative in nature, suggesting what should happen rather than focusing on what does happen.
Our aim in this section is to integrate causal model development with rigorous impact evaluation of
Understanding the causal mechanisms that link REDD+ interventions to outcomes
3

24 | pamela Jagger, erin O. sills, Kathleen lawlor and William D. sunderlin
REDD+ projects. Taken together, impact evaluation that estimates the direction and magnitude of changes in key outcome variables and causal models that help us understand the processes that get us from REDD+ intervention to outcomes can be very powerful. The methods inform one another. However, we note that the diverse nature of REDD+ interventions is a major challenge for theory-based impact evaluation. The benefits from REDD+ interventions are realised through a diversity of mechanisms ranging from support to local governments for forest management and enforcement, to direct cash payments to households. REDD+ projects are implemented by a diversity of proponents ranging from bilateral donors to private sector carbon speculators. Identifying the causal mechanisms at work under this diversity of project models is a significant and important challenge for learning from REDD+
projects (see Annex B.4 for references on the diverse drivers and agents of deforestation in different tropical forest regions).
3.2 Situating causal model development in impact evaluation design
The discussion in Section 2 provides guidance on which research design to use to evaluate REDD+ project outcomes. The fundamental questions are:
1. whether evaluation is starting before or after the project has been implemented;
2. whether there are resources for collecting data on forest users that are not part of the project (i.e. control groups); and
Box 6. Comparing causal models for linking interventions and outcomes
Logic models, outcome mapping, open standards and theory of change methods have several common elements. In particular, they all:• recognise the importance of local and regional context; • ensure the experience and opinions of stakeholders are factored into monitoring and evaluation plans; • develop a conceptual model of change; • identify risks and threats and develop a mitigation strategy; and• focus on learning through iterative processes of stakeholder engagement, monitor for successes and
risks, link observed behavioural changes to observed outcomes and make course corrections to project implementation on the basis of findings.
There are also differences between the various frameworks. Some focus on attributing project implementation to observed outcomes (e.g. theory of change), whereas others focus on explaining how the project has changed the behaviour of various stakeholders, but do not seek to articulate or empirically test a theory of change (e.g. outcome mapping).
This is a list of web resources for conservation-based causal models.• Logic models
http://mande.co.uk/blog/wp-content/uploads/2009/06/logical-framework.pdf• Outcome mapping
http://www.idrc.ca/en/ev-9330-201-1-DO_TOPIC.html http://www.outcomemapping.ca/
• Open standards http://www.conservationmeasures.org/ https://miradi.org/
• Theory of change http://www.iucn.org/about/work/programmes/forest/?6268/Lessons-theory-change-ME

a guide to learning about livelihood impacts of reDD+ projects | 25
3. whether project implementation can be designed to facilitate evaluation (e.g. randomisation of a project being phased in across a landscape). These questions have some bearing on the development of causal models.
There are considerable gains from collecting data for mapping causal chains before and during project implementation:
• ‘Before’ data (i.e. BACI or BA) can influence the intervention; a causal model can tell you what is most interesting to test and how you should randomise the selection of project sites.
• Most projects are implemented in heterogeneous landscapes and with heterogeneous actors. In BACI and BA, a causal model can suggest where you should concentrate or how you should distribute your sample to learn the most.
• A causal model should integrate process evaluation and understanding of what is actually implemented on the ground; therefore, in BA and BACI, there may be an initial model, which is then updated following observations of how the project is implemented on the ground.
• Many projects are phased, and planning the evaluation from the beginning—whether experimental or BA/BACI—should include planning for how evaluation results will be used to guide future phases of the project.
• Both the BACI and the BA designs provide opportunities for ex ante modelling of causal chains; data collection and analysis at a mid-point in the project can identify problems and proposed solutions that serve as the basis for course corrections and better livelihood outcomes.
As with rigorous impact evaluation, making a decision early (i.e. before the REDD+ intervention takes place) about how to map causal chains provides the greatest opportunity for developing a clear understanding of causal processes.
Mapping causal chains has both short-term and long-term objectives. The short-term potential for learning is greatest when REDD+ projects are randomly phased in across communities or landscapes. Testing hypotheses about causal
processes early and integrating findings into subsequent phases of the REDD+ intervention could improve the expected outcomes of the intervention. This is a clear benefit of investing in mapping causal chains. Designs that focus evaluation efforts after interventions are initiated (i.e. CI, retrospective) also provide valuable opportunities for learning about how to design future phases and future REDD+ projects, and can contribute to our collective knowledge of the determinants of favourable welfare outcomes. With CI and retrospective designs, theoretical and observed processes should be integrated into the causal model as it is developed.
In the GCS-REDD, and probably in other evaluation efforts, there is time pressure for results. This implies that if you are starting before, you will be evaluating indicators of short-term outcomes. A causal model is thus critical for choosing indicators and thinking about how they are related to the long-term outcomes that are clearly expected of REDD+ projects, given the goal of ‘permanence’. By contrast, many retrospective evaluations are launched long after the project is initiated. In these cases, the causal model is critical for reconstructing the intermediate steps and mechanisms that could have led to the long-term observed outcomes.
3.3 Mapping and testing causal models
Making a clear causal connection between observed outcomes and project interventions requires careful planning, data collection and analysis. How REDD+ interventions serve as a lever for local-level change is the critical issue. Some causes of deforestation and forest degradation, as well as changes in social welfare, are susceptible to manipulation at the local or project level; others are not (see Annex B.4). A theory-based impact evaluation frames learning within an understanding of what a REDD+ intervention can and cannot do, and of how it complements wider national policy efforts and change patterns. Theory-driven evaluation requires the development of an a priori model of how the intervention is expected to exert its influence (Chen and Rossi 1983, Lipsey 1993, Reynolds 1998, White 2009). Understanding

26 | pamela Jagger, erin O. sills, Kathleen lawlor and William D. sunderlin
the causal pathways through which REDD+ interventions influence outcomes helps with repeating successes and with pinpointing areas for revising and updating project implementation.
Causal models, or theories of change, are conceptual models that identify relationships between implementation activities, outcomes and impacts (Table 2). They can identify inputs, activities and outputs associated with implementation, and how they result in short- to medium-term changes in outcomes of interest, as well as longer-term changes or impacts (Greene and Caracelli 1997, White 2009). We can use the various components of a theory of change to develop a model that describes how interventions lead to desired results. Causal models can be qualitative (i.e. when there is a small sample size or insufficient variation in the process variables to do quantitative analysis) or can adopt a mixture of qualitative and quantitative methods that involves an ex ante statistical model that predicts what social impact can be attributed to the REDD+ intervention.
Building a map of the causal chain is an iterative process that requires the following steps:
1. Understanding the context of the project site
2. Characterising the intervention
3. Developing testable hypotheses
4. Mapping data needs
5. Testing hypotheses and updating initial assumptions
We have distilled these into 5 key steps to develop a map of the causal chain for articulating the process by which REDD+ interventions result in changes to social welfare outcomes. These steps are further clarified in Worksheet 8.
3.3.1 Understanding the context of the project site
White (2009) identifies understanding context and anticipating heterogeneity as 2 critical elements of theory-based impact evaluation. Context has a direct influence on process within the causal chain. Context is the socioeconomic, demographic, institutional and biophysical setting in which projects are implemented. Context should encompass a description of factors operating at multiple scales; local-level phenomena may be influenced by actions taking place at the subnational or national level. Before developing a map of the causal chain, evaluators should have a clear understanding of the social and ecological
Table 2. Components of a map of the causal chain
Component Description Application to REDD+ projects
Implementation Inputs Resources that go into the project
Funds to provide monitoring and enforcement of forest resource use; support of training in sustainable forest management; employment of local people; investment in infrastructure etc.
Activities What we do Monitor activities; enforce rules; train local people; facilitate workshops; build infrastructure
Outputs What we produce Forest area preserved; reduced forest degradation; knowledgeable people; tangible things that can be counted
Results Outcomes What we do; the behavioural changes that result from project outputs
Increased income; improved health status; provision of environmental services (all ways in which welfare can be enhanced)
Impacts Long-term changes that result from an accumulation of outcomes
Movement up or down income quartiles; movement in or out of poverty; asset accumulation or loss
Adapted from Kusek and Rist 2004.

a guide to learning about livelihood impacts of reDD+ projects | 27
conditions in the project site; indeed, most project design documents (PDDs) include much of the information required to characterise the site’s demographic, socio-economic, institutional and biophysical conditions. Both qualitative and quantitative data provide important insights into the starting conditions within which projects operate.
The most important local-level factors to understand include:
• local drivers of deforestation and forest degradation, including characterising the most important actors affecting land use change (i.e. smallholder agriculturalists, pastoralists, concession holders etc.);
• rights and tenure of land, trees and carbon;
• level of monitoring and enforcement, and contestation of property rights;
• dominant livelihood strategies in the project area;
• degree of forest dependence of households (i.e. in terms of goods extracted from the forest as well as services provided by the forest);
• heterogeneity of forest dependence (i.e. relative importance of forests to female-headed households, migrant households etc.);
• presence and function of groups focused on natural resource management and social welfare; and
• relationship between REDD+ proponent and community members.
In addition, several contextual variables help situate the project site in a larger context. The importance of context in theory-based impact evaluation implies that the same intervention implemented in different settings may result in different outcomes. This is why context is so important. We need to be able to understand why we observe different outcomes in different settings, and to pinpoint the contextual factors that can be credited with success or failure. Data on coarser-scale structural variables help to situate the analysis in the broader context of the subnational or national landscape, and inform about the generalisability. Typical variables useful for addressing the issues of generalisability
of findings include: forest type; location in the forest transition; agroecological zone; market access; income levels; major economic activities; population density; and dominant ethnic or linguistic group.
Contextual information helps anticipate potential sources of impact heterogeneity (i.e. impact can vary according to intervention design, beneficiary characteristics or socio-economic setting). The social welfare impact of REDD+ interventions might vary by ethnicity, gender, age, migrant status or relative wealth, among others. Gaining an understanding of marginalised and vulnerable groups, wealthy elites, or other groups prior to the collection of outcome data means the evaluation can be designed using sample sizes that are representative of each group; it also helps to narrow the focus of distributional analysis to groups that are known or expected to be differentially affected by the intervention (Worksheet 9). Ex post analysis of impact heterogeneity requires a priori knowledge of which groups are likely to be differentially affected by the REDD+ intervention. Participatory methods are particularly useful for understanding areas of potential heterogeneity.
Evaluation designs that include controls should collect the same contextual data for control group sites. These data provide important control variables that inform outcomes observed in intervention sites. Contextual information from control sites also provides a basis for ruling out alternative explanations for observed impacts in intervention sites, which increases the external validity of estimated welfare impacts.
3.3.2 Characterising the REDD+ intervention
PDDs generally lay out a short- to medium-term implementation strategy. Distinguishing between how the project is designed and how the project is actually implemented is critical for correctly characterising the intervention (see Box 7 on GCS-REDD methods for characterising and understanding implementation process). Theory-based impact evaluation assumes that the objectives of the programme can be accurately

28 | pamela Jagger, erin O. sills, Kathleen lawlor and William D. sunderlin
articulated, that programme implementation has been verified (i.e. the project was implemented according to the PDD) and that the programme theory and associated causal mechanisms can be specified and measured (Khandker et al. 2010).
Conservation and development projects are often not implemented exactly as originally planned due to logistical, financial and institutional constraints that alter the course of interventions. For example, the PDD may describe a REDD+ benefit-sharing mechanism that transfers carbon payments from the project proponent directly to households. However, project managers on the ground may decide that it would be more effective to create a village-level carbon revenue management committee to act as an intermediary between the implementing organisation and the local population. Simply tracking the budget for payments to households
could miss identification of the causal mechanisms responsible for changes in welfare and well-being. Process evaluation needs to be designed in such a way that it anticipates these possible changes in project implementation, collects data on these key aspects of process and uses outcome indicators capable of detecting both intended and unintended changes in well-being and land use. In cases where implementation deviates from the inputs, activities and outputs articulated in PDDs, qualitative methods are particularly important for providing new insights and understanding implementation. Observations and in-depth interviews help with understanding whether the plans in PDDs actually reflect the on-the-ground situation.
CIFOR’s GCS-REDD includes a detailed analysis of the process of REDD+ implementation and its relationship to changes in social welfare (Box 7).
Box 7. GCS-REDD survey of project implementation
The GCS-REDD is using an iterative process to gather information about the process and costs of implementing REDD+ projects. In the ‘before’ phase of research, basic information on the project is gathered through a ‘proponent appraisal’ or PA (see Annex C for the research instrument). This elicits basic information on the proponent organisation, the major components of the REDD+ project, methods for MRV and FPIC, key partner organisations, plans to certify and sell credits and the project location. The PA also asks the proponent to list the stakeholders (groups of people or firms) who use the forest in the project site and who are expected to change their forest use as part of the project’s strategy to reduce carbon emissions. The proponent is then asked about specific strategies for inducing those changes in forest use. In essence, this is the causal model of the project. Further, the PA is designed to obtain details on how specific villages are selected for the project intervention, thereby identifying key factors that must be considered when matching intervention and control villages and households. In addition to the proponent appraisal, researchers write a site narrative, which characterises the project region, including the key deforestation drivers and the antecedents of the REDD+ project.
In the ‘intermediate’ phase of research, the process, costs and politics of project implementation are tracked via the ‘survey of project implementation’ or SPI (the research instrument will be available on the CIFOR website in 2011). Through the SPI, researchers identify project activities that have taken place. This requires determining both which activities can be attributed to the project (e.g. deciding whether titling of land in the project area is part of the project, or a complementary activity that is a prerequisite for the project but may have happened without it) and which activities have actually happened in practice (and not just in written plans). Both of these determinations are best made as and where the project is being implemented. In the GCS-REDD, researchers will take the opportunity to collect this information when they return to project sites to report on the first phase of research. The SPI also quantifies the start-up costs of the project—including all planning, administrative and transaction costs—and, where relevant, the running costs of the project in the initial phases of implementation.

a guide to learning about livelihood impacts of reDD+ projects | 29
3.3.3 Developing hypotheses, identifying data needs and testing hypotheses
Hypotheses are motivated by some variant of the question ‘what are the social impacts of REDD+ projects?’ A hypothesis is a reasonable scientific proposal or an educated guess about the expected relationship between 2 variables. Hypotheses have 2 requirements: they must fit the known facts and they must be testable. Important questions are:
• Can the variable be measured directly or do you need a proxy variable?
• Can you obtain the data you need given time and resource constraints?
• Is there enough variation in the data to test the hypothesis?
Project evaluators face several challenges when undertaking theory-based impact evaluation of REDD+ interventions. First, and most importantly, understanding socio-ecological systems is difficult because most systems are incredibly complex (Chhatre and Agrawal 2009, Ostrom 2009). In a multilevel framework for understanding socio-ecological systems, Ostrom (2009) identifies more than 40 variables falling within the categories of resource systems, users and units, governance systems, interactions, outcomes and related ecosystems. Thus, identifying which of these sets of variables and relationships are central to understanding the causal pathway between intervention and observed outcomes is a huge challenge.
Another problem is that many theories of change have not been rigorously and empirically tested in the field of environment and development. Schreckenberg et al. (2010) note that there is a lack of econometric research showing how conservation and development field projects are correlated with social welfare outcomes; this means that no generic causal models for defining indicators are available. When building a map of the causal chain, findings and inferences are largely dependent on the validity of the programme theory and explanatory analysis. If there are good theories that have been empirically tested regarding elements of successful REDD+ project implementation, theory-based impact evaluation is easier. More
often than not, specific theoretical relationships that apply to conservation and development are contested. For example, we have some empirical evidence that groups that are too large or too heterogeneous often hinder successful collective action for sustainable forest management (Poteete and Ostrom 2004); however, the authors of that study stress the uncertainty of their empirical results. More recent studies add to the debate rather than bring resolution (for example, Baland et al. 2007) find that inequality affects cooperation in a non-linear fashion). For a causal model to be fully tested, we need a well-developed theory that allows us to hypothesise the linkages between REDD interventions and social welfare outcomes (Reynolds 1998).
Examples of ‘process variables’ to track and formulate hypotheses linking REDD+ interventions to outcomes include:
• forest access;
• tree, forest and forest carbon property and management rights;
• participation in project design and implementation;
• existence of, access to and effectiveness of grievance mechanisms;
• the process by which the project is initiated (top down vs. consultation vs. free, prior and informed consent (FPIC) vs. community initiated);
• information disclosure and sensitisation to project activities;
• information disclosure regarding carbon financial flows;
• social capital;
• intra-community dissent;
• volatility of carbon finance and payments/benefits to population;
• changes in attitudes regarding forest use (is REDD+ creating perverse incentives to increase clearing?);
• existence of, design and effectiveness of benefit-sharing mechanisms;
• effectiveness of how the planned mitigation measures address the actual drivers of forest loss at the project site and reward.

30 | pamela Jagger, erin O. sills, Kathleen lawlor and William D. sunderlin
It is likely that to fully understand the causal chain between intervention and outcome, several hypotheses will need to be articulated and tested. Causal processes involving social and ecological systems are generally not linear, nor do they operate in isolation. The GCS-REDD includes the testing of several hypotheses about how REDD+ projects are affecting forest condition and household welfare (Box 8).
Developing and testing a map of the causal chain requires more data than for other impact evaluation methods. Measuring intervening causal mechanisms, defining and operationalising precise treatment exposure, collecting data for a large number of process variables and maintaining extensive longitudinal follow-up with programme participants throughout the duration of implementation can be time consuming and costly (Reynolds 1998). Causal models and specific hypotheses are particularly useful for mapping out
data needs. Theories of change or causal pathways provide guidance on specific variables, articulate how variables will be measured (i.e. data collected using quantitative or qualitative methods) and the scale at which the data should be collected. We identify 4 main types of variables: outcome variables; explanatory variables; confounders; and process variables (Worksheet 10). Understanding the causal process of getting from REDD+ intervention to social welfare outcomes often requires a mixed-methods approach. Qualitative data are particularly important as the mechanisms underlying impacts may be quite diverse, including aspects of project implementation (e.g. degree of meaningful and informed participation of local forest users), institutional conditions (e.g. tenure, degree of devolution of management authority, property rights etc.), and community characteristics (e.g. dominance of elites, ethnic heterogeneity, groups and associations focused on forest management or on improving social welfare etc.).
Box 8. Core hypotheses of GCS-REDD
CIFOR’s GCS-REDD is testing several hypotheses about how the design and implementation of REDD+ projects affects forests and household welfare. Many of the ideas underlying these hypotheses pertain to questions about how welfare/well-being impacts in REDD+ may in turn affect forest impacts in REDD+. The following are some of the general hypotheses the GCS-REDD will test.
Effectiveness (defined as success in reducing forest emissions and increasing carbon removals) in REDD requires:
1. sufficient attention to efficiency, equity and co-benefits
2. accurate identification of the drivers of deforestation and degradation
3. appropriate interventions that target the drivers of deforestation and degradation
4. prior resolution of contested property rights over land, natural resources and carbon
5. guaranteed local acceptance of, and participation in, REDD+, through, e.g.:a. obtaining local permission for REDD+b. local education about climate change and REDD+c. local involvement in the design and implementation of REDD+d. transparency in implementation
6. appropriate targeting of benefits, through, e.g.:a. sufficient portion to communities in relation to other stakeholdersb. household-level benefits as opposed to community-level benefitsc. ensuring that the poor and women benefit
7. distribution of benefits and costs between the major stakeholders that is considered fair; i.e.:a. all major stakeholders have net benefits from the REDD projectb. legitimacy is supported because no single stakeholder group has a disproportionate share c. no group gets benefits that are well above others’ benefits

a guide to learning about livelihood impacts of reDD+ projects | 31
If there is sufficient variation in the sample’s process variables, it may be possible to formulate hypotheses regarding these factors that can be tested quantitatively using impact evaluation techniques. However, this may not be feasible if the sample size is small or if there is not much variation in the process variable of interest. That is, if you want to test how forest carbon property rights affect forest and welfare outcomes, but either none or all of the villages in your sample have such rights, then there is insufficient variation for empirically testing any hypotheses related to this topic. Even if there is sample variation, it may not be desirable to investigate some causal mechanism hypotheses quantitatively, as that would require oversimplification or artificial categorisation of complex processes/institutional conditions.
In developing causal models, it is important to think about the scale at which you expect to see variation in intervention outcomes. There should be a close synergy between the scale at which intervention activities are implemented and the scale of the analysis of outcomes and impacts. First-generation REDD+ projects focus their interventions at a variety of scales, including the subnational, village or, in the case of PES-type projects, the household level. Collecting only village-level data to understand the effect of a REDD+ project that involves direct payments to households would not provide good information about how individual households are affected. Conversely, if the intervention involves establishing a community health centre in a village, collecting household-level data is going to be of limited interest as all households either benefit or have the potential to benefit from the new public service equally.
There may, of course, be other factors affecting ecological and social outcomes that are important to consider (external and internal to the project
site). Ideally, to minimise the chance of these factors confounding identification of impact, data will be collected from both control and REDD+ sites and matched on those factors that may affect outcomes; this will effectively net out the effect of these potential confounders. However, the matching may not be perfect, either on identified factors or on other factors that become apparent over time. For example, if wage rates increase at the control site but not at the REDD+ site (for reasons other than REDD+), this could bias the results. Or another development project—not related to the REDD+ project—could commence at either the REDD+ or the control site. It is essential to think through these possible scenarios a priori and remain alert to these possibilities throughout the study, in order to rule out rival explanations for any differences in observed outcomes at the REDD+ site.
We have highlighted the challenge of identifying and validating the causal pathway from intervention to outcomes. The complex nature of socio-ecological systems means that a large number of variables influence how REDD+ interventions lead to changes in welfare or well-being. Adding to this complexity is the fact that much of the theory surrounding conservation and development interventions has not been tested using methods designed to identify causal effects. Most analyses of sustainable forest management initiatives, integrated conservation and development programmes and community-based forest management are case study analyses that rarely explicitly test hypotheses about the relationships between variables. Embedding an analysis of causal models into a rigorous impact evaluation framework has the potential to yield significant new insights for a wide range of REDD+ and conservation and development practitioners.

4.1 Budgets and evaluation capacity
Evaluation of projects that are meant to serve as pilots or demonstrations is worthy of significant budget support. However,
evaluation typically represents a very minor component of most conservation and development project budgets. Furthermore, in the context of REDD+, there is a heavy emphasis on carbon MRV, which can be very costly. In combination, these may make it challenging to allocate sufficient resources to high-quality, evidence-based evaluation of impacts on social welfare. There is a common perception that baseline and control group data collection is very costly, and that the skills involved in designing evaluation studies and processing and analysing data are beyond the scope (and outside the responsibilities) of project staff. However, evaluation of social impacts can be an important way to manage the legal, political and public relations risks of REDD+ by proactively identifying and assembling evidence on those impacts. This evaluation can complement the understanding of project impacts on carbon emissions, as both are mediated by the decisions and behaviours of forest users. For guidance on the various components of an evaluation budget and how to minimise evaluation costs, as well as examples of evaluation budgets, see Bamberger (2006), Bamberger et al. (2004) and Baker 2000.
Proponents and collaborating researchers and evaluators should consider several factors when
developing a budget for evaluating social impacts, including the stage of project implementation (i.e. pre-project, in process or post-project); evaluation capacity; and resources available to undertake evaluation. When evaluation begins pre-project, the most rigorous—but also the most expensive—research designs are feasible. These involve collecting data from treatment (and preferably also control) areas or forest users before the intervention begins. Based on the data collected in this initial stage, it may be possible to identify a subsample of controls who are well matched to treated forest users, and limit later data collection only to those matched controls. Nonetheless, these research designs are inherently more expensive because they involve multiple rounds of fieldwork over an extended time frame.
We propose the following framework for deciding on the impact evaluation design you can undertake for a given budget level.
• High budget for evaluating social welfare impacts: Undertake detailed household surveys for a large number of households; collect data for carefully selected control and impact sites; triangulate findings with key informant interviews and village meetings; undertake causal chain mapping before, during and after intervention for a number of defined qualitative and quantitative indicators.
• Medium budget for evaluating social welfare impacts: As for high budget, but use a smaller number for household surveys and stratify samples by identity group (e.g. income,
Practical considerations for understanding the social welfare impacts of REDD+
4

a guide to learning about livelihood impacts of reDD+ projects | 33
ethnicity, gender, occupation); results have a lower confidence interval; causal chain mapping may involve less frequent and less data-intensive hypothesis testing.
• Low budget for evaluating social welfare impacts: Employ participatory methods at village level with data collection before and after, in control and impact sites, or both; use retrospective methods if no ‘before’ data are available; use participatory methods at intervals to understand how the REDD+ project is being implemented to map the causal chain.
Evaluation capacity is a constraint that many project proponents may find daunting. There are 2 major considerations. First, does the project have staff or collaborators with the necessary skills and training to collect the data required for an impact evaluation? A focus on local social impacts necessitates the collection of data at the village and household levels, but village and household survey formulation and implementation require a range of different skills and capabilities. The resources provided by CIFOR’s GCS-REDD include materials for implementing socio-economic surveys (see Annex C). For additional resources for developing and implementing surveys focused on social welfare and forest/environmental dependence, see Angelsen et al. 2011. The second consideration is the availability of someone to process and analyse the collected data. The necessary basic data analysis skills include the ability to manipulate, clean and document datasets, calculate descriptive statistics and run regression models and matching routines. See Annex B.1 for an overview of impact evaluation resources.
We emphasise that evaluation of social impacts should be included in a project’s design and implementation plans before the project starts. This allows for the most flexible approach to evaluation, and also increases the likelihood of resources being invested in impact evaluation. We reiterate that the costs of estimating social impacts are likely to be significantly less than the costs of carbon MRV, and that investment in estimating these impacts is justified given that the livelihoods impacts of REDD+ are likely to be a major determinant of its political and social viability and the permanence of its contributions to climate change mitigation.
4.2 Ethical considerations
Any type of research involving people can pose a risk to those people; project proponents, researchers and other stakeholders have an obligation to protect them from those risks. One commonly accepted set of principles for behavioural and biomedical research on human subjects is the Belmont Report (1979). It defines 3 principles for ethical human subject research:
1. respect for and protection of the individual’s autonomy
2. do no harm and do good (i.e. secure the individual’s well-being)
3. justice (i.e. equitable distribution of costs and benefits of research)
One requirement resulting from these principles is that researchers must obtain a potential research subject’s free, prior and informed consent (FPIC) to participate in the research. This is a fundamental, but complex, tenet of human subject research. On the one hand, researchers must give potential participants enough information about the study so that they can make an informed decision about whether they want to participate. On the other hand, if researchers give participants too much information about the phenomena they are studying, they may undermine some of their own research questions. For example, in the GCS-REDD study, CIFOR researchers are trying to gauge study participants’ knowledge of REDD+. This requires striking a delicate balance between informing potential survey respondents about the subject of the study and yet not explaining the local REDD+ project in such detail that it is no longer possible to assess local knowledge of REDD+ and how well project developers have informed the local population.
Confidentiality is another important issue for research involving human subjects. Application of the ‘do no harm and do good’ principle means that researchers need to assess and protect respondents from any potential risks of participating in the study. In the context of REDD+ projects, it is possible to imagine risks from revealing information such as the quantity of forest products illegally harvested or negative feelings about how the project is being

34 | pamela Jagger, erin O. sills, Kathleen lawlor and William D. sunderlin
withhold their FPIC for activities affecting their lands and resources. Experts have noted that involving the local population in monitoring and evaluating social and environmental impacts is an effective way to ensure that potential and actual impacts are understood (Colchester and Ferrari 2007, Forest Peoples Programme 2008). Such understanding is a precondition for populations giving their FPIC. Furthermore, this understanding needs to be constantly updated, as FPIC is supposed to be an iterative process, with new information and continued grants of consent flowing back and forth between parties.
Many project proponents are actively seeking ways to involve the local population in the design, implementation and monitoring of the project. Jenkins (2010) identifies 5 levels of community participation in research (Figure 5), which could also apply to project implementation.
Of course, involving the local population in evaluation of social impacts or carbon MRV may present risks to project developers: what if the population becomes aware of negative impacts or realises that they are receiving only a small share of the international price for forest carbon offsets? However, involving communities in research could also further understanding of the project and help prevent misunderstandings and unreasonable expectations. Finally, we note that broadening involvement in research—e.g. involving the local community and project proponent in developing causal models, identifying appropriate indicators and interpreting results—can improve the quality of the research, making it more relevant and less susceptible to bias or misinterpretation by any one party to the collaborative research process (cf. Rao 2002 and Udry 2003).
Community originationParticipation,
ownershipCommunity consent
Community advice
Community endorsement
Community notification
Figure 5. Levels of community participation in research
Source: Jenkins (2010)
implemented. Evaluators should therefore take care to ensure that individual households, key informants and villages are not identified by name in any reports, and that data are stored securely. Each household, village, key informant, proponent etc. should be given a unique numeric identifier. After data are entered, any information that could be used to trace specific individuals (e.g. names or GPS coordinates for households) should be removed from shared datasets. However, for the BA or BACI research designs, this identifying information must be maintained in the master dataset, so that those same respondents can be revisited and the data matched in the ‘after’ phase.
Application of the justice principle implies that the costs and benefits of the research are equitably distributed. Recognition of this principle is important when we consider that research involving long interviews and community meetings is quite extractive in nature and people’s time is valuable. The beneficence principle explicitly embraces the notion that participants should benefit in some way from the research. This means that researchers should return to the community after study completion to deliver and explain the results and their implications. Knowledge of project outcomes provides local resource users with information they can use to advocate for favourable social change. Many social science researchers also believe it is appropriate to compensate respondents for their time with a small cash or in-kind gift.
The combination of FPIC and the beneficence principle suggests that researchers should explain the potential benefits of their research (or lack thereof ). This is challenging because it is clearly too early to say what are the potential gains to individuals living in REDD+ project sites. Much depends on what happens with international climate negotiations, the market for carbon and the willingness of the donor community to continue to support REDD+ initiatives until market mechanisms fall into place. What is clear is that project proponents, civil society organisations, researchers and other interested parties should be very careful not to raise expectations about REDD+ and to present the potential gains from REDD+ projects in a neutral manner.
Finally, we return to the concept of FPIC, which is as applicable to projects as it is to research. For example, the 2007 UN Declaration on the Rights of Indigenous Peoples upholds the rights of populations to give or
This guide is solidly focused on evaluating the social impacts of REDD+ interventions. The aim of our discussion is to provide the
rationale and tools for project proponents, donors, civil society organisations and local resource users to maximise learning from first-generation REDD+ projects. We have argued that evaluation of social impacts should not be an afterthought, or a minor addition to an M&E plan squarely focused on assessing the biophysical outcomes attributable to REDD+ projects. Rather, it should be a central component of the M&E plans and budgets of project proponents.
Our discussion encompasses 4 core elements:
1. A new standard of rigour is required for evaluating environment and development interventions. REDD+ projects present an excellent opportunity to bring a rigorous results-based approach to learning, which will inform the global discussion on the effectiveness of REDD+ interventions for achieving favourable environmental and social objectives. REDD+ is particularly well positioned to do this because REDD+ projects by their nature require rigorous evaluation of impacts (i.e. otherwise carbon credits will not be sold), and because the considerable investment in REDD+ projects suggests that results-based evaluation is important and can be integrated into project budgets.
2. Evaluation of social impacts should integrate the concept of counterfactuals, which is applied by necessity to the evaluation of biophysical
impacts; that is, the emphasis is on what would have happened in the absence of the REDD+ intervention. The benefit of research designs that incorporate counterfactuals is that the observed outcomes of the REDD+ intervention can be directly attributed to the inputs. We have presented a range of impact evaluation designs that span the spectrum of counterfactual scenarios: randomisation is considered the best approach for assigning attribution of outcomes to interventions; retrospective analyses that seek to construct counterfactuals using recall data are amongst the weakest of the designs presented in this guide. Between these ends of the spectrum, we review 3 additional impact evaluation designs that involve varying combinations of before, after, control and intervention data collection.
3. Understanding the process by which outcomes are achieved is critical to the learning process. Results-based impact evaluation is extremely informative about what happened as a result of a REDD+ intervention. However, learning from first-generation projects, including lessons for scaling-up REDD+ to the national and subnational levels, requires analysis of why observed changes in social welfare occurred. Lessons for future REDD+ initiatives must come from careful consideration of the causal mechanisms underlying observed outcomes. Developing and mapping a causal chain and testing theories of change using both qualitative and quantitative data is the best way to develop an understanding of what specific mechanisms have led to observed outcomes.
Moving ahead with realising REDD+: Guidance for learning about social impacts
5

36 | pamela Jagger, erin O. sills, Kathleen lawlor and William D. sunderlin
4. We have provided guidance on important considerations related to budgeting, evaluation capacity and ethical considerations for evaluating the social welfare impacts of REDD+ projects. We have argued that clearly understanding the social welfare impacts of REDD+ is essential for learning how to design future REDD+ initiatives that will be sustainable and equitable, and as such, resources should be invested in evaluating social impacts. We have provided guidance on how to ethically approach evaluating REDD+ projects. Great care should be taken to ensure that local forest users living in REDD+ intervention sites, as well as those who fall within control group sites, are protected from risks involved in participating in evaluation activities.
Our best estimate is that there are approximately 150 REDD+ projects being planned throughout the developing world. These projects lay the foundations for future forest-based climate change mitigation projects, programmes and policies. Past M&E work undertaken by project developers, researchers and evaluators in conservation and
development and in early forest carbon projects has failed to yield a coherent set of principles for what works and what doesn’t work with respect to reducing deforestation and forest degradation whilst doing no harm to or improving the welfare of local forest users. The global push to provide proof of concept using first-generation REDD+ projects requires concerted commitment to rigorous learning.
Our final point is that the universe of REDD+ projects is extremely heterogeneous. Projects are led by a diverse range of proponents, and are implemented using a wide array of implementation strategies and benefit-sharing agreements. This diversity highlights the need for rigorous methods that get to the heart of attribution (i.e. what is the impact of the REDD+ project on the well-being of local people?), and an understanding of why the project had the observed effect. The aggregation of information on attribution, and the reasons for relative successes or failures of REDD+ interventions, will move us collectively towards a clearer picture of how to move ahead with realising REDD+. A global learning initiative is required.
Field research supervisor Tadeu Melo meets with the community of Barro Alto in Acre, Brazil, to carry out the village survey for the Global Comparative Study on REDD+. © Amy Duchelle/CIFOR

Adato, M., Carter, M.R. and May, J. 2006 Exploring poverty traps and social exclusion in South Africa using qualitative and quantitative data. Journal of Development Studies 42(2): 226–247.
Aldrich, M. and Sayer, J. 2007 In practice: landscape outcomes assessment methodology (LOAM). WWF Forest for Life Programme. http://assets.panda.org/downloads/loaminpracticemay07.pdf (November 2010).
Alix-Garcia, J.M., Shapiro, E.N. and Sims, K.R.E. 2010 Forest conservation and slippage: evidence from Mexico’s national payments for ecosystem services program. Working paper. https://www.amherst.edu/media/view/209730/original/Alix-Garcia%2BShapiro%2Band%2BSims%2BPES%2BMexico%2B8-6-10.pdf (November 2010).
Alkire, S. and Santos, M.E. 2010 Acute multidimensional poverty: a new index for developing countries. OPHI Working Paper No. 38. University of Oxford, UK.
American Carbon Registry (ACR) 2010 American Carbon Registry methodology for REDD – avoiding planned deforestation, version 1.0. Winrock International, Little Rock, AK, USA.
Andam, K.S., Ferraro, P.J. and Holland, M.B. 2009 What are the social impacts of land use restrictions on local communities? Empirical evidence from Costa Rica. Paper presented at the Conference of the International Association of Agriculture Economists. Beijing, China, 16–22 August.
Andam, K.S., Ferraro, P.J., Pfaff, A., Sanchez-Azofeifa, G.A. and Robalino, J.A. 2008 Measuring the effectiveness of protected area networks in reducing deforestation. Proceedings of the National Academy of Sciences USA 105(42): 16089–16094.
References
Andam, K.S., Ferraro, P.J., Sims, K.R.E., Healy, A. and Holland, M.B. 2010. Protected areas reduced poverty in Costa Rica and Thailand. Proceedings of the National Academy of Sciences USA 107(22): 9996–10001.
Angelsen, A. 1995 Shifting cultivation and ‘deforestation’: a study from Indonesia. World Development 23(10): 1713–1729.
Angelsen, A. 2008a REDD models and baselines. International Forestry Review 10(3): 465–475.
Angelsen, A. 2008b How do we set the reference levels for REDD payments? In: Angelsen, A. (ed.) Moving ahead with REDD: issues, options and implications, 53–64. CIFOR, Bogor, Indonesia.
Angelsen, A. 2009 Introduction. In: Realising REDD+: national strategy and policy options, Angelsen, A. et al. (eds), CIFOR, Bogor, Indonesia.
Angelsen, A., Brown S., Loisel C., Peskett L., Streck C. and Zarin, D. 2009. Reducing emissions from deforestation and forest degradation (REDD): an options assessment report. Meridian Institute, Washington, DC, USA.
Angelsen, A. and Kaimowitz, D. 1999 Rethinking the causes of deforestation: lessons from economic models. The World Bank Research Observer 14(1): 73–98. World Bank, Washington, DC.
Angelsen, A., Olsen, C.S., Larsen, H.O., Lund, J.F. and Wunder, S. (eds) [in press] Measuring livelihoods and environmental dependence: methods for research and fieldwork. Earthscan, London.
Angelsen, A., Streck, C., Peskett, L., Brown, J. and Luttrell, C. 2008 What is the right scale for REDD? The implications of national, subnational and nested approaches. CIFOR InfoBrief No. 15. CIFOR, Bogor, Indonesia.

38 | pamela Jagger, erin O. sills, Kathleen lawlor and William D. sunderlin
Angelsen, A. and Wunder, S. 2003 Exploring the forest–poverty link: key concepts, issues and research implications. CIFOR Occasional Paper No. 40. CIFOR, Bogor, Indonesia.
Angrist, J.D. and Pischke, J.S. 2008 Mostly harmless econometrics: an empiricist’s companion. Princeton University Press, Princeton, New Jersey, USA.
Appiah, M., Blay, D., Damnyag, L., Dwomoh, F.K., Pappinen, A. and Luukkanen, O. 2009 Dependence on forest resources and tropical deforestation in Ghana. Environment, Development and Sustainability 11: 471–487.
Araujo, C., Araujo Bonjean, C., Combes, J.-L., Combes Motel, P. and Reis, E.J. 2009 Property rights and deforestation in the Brazilian Amazon. Ecological Economics 68: 2461–2468.
Arnold, J.E.M. 2002 Clarifying the links between forests and poverty reduction. International Forestry Review 4(3): 231–233.
Arriagada, R.A. 2008 Private provision of public goods: applying matching methods to evaluate payments for ecosystem services in Costa Rica. PhD Thesis. North Carolina State University, Raleigh, North Carolina.
Asner, G.P., Knapp, D.E., Broadbent, E.N., Oliveira, P.J.C., Keller, M. and Silva, J.N. 2005 Selective logging in the Brazilian Amazon. Science 310: 480–482.
Bajracharya, D. 1983 Deforestation in the food/fuel context: historical and political perspectives from Nepal. Mountain Research and Development 3(3): 227–240.
Baker, J. 2000 Evaluating the impact of development projects on poverty: A handbook for practitioners. World Bank, Washington, DC.
Baker, T.R., Jones, J.P.G., Rendon Thompson, O.R., Cuesta, R.M.R., del Castillo, D., Aguilar, I.C., Torres, J., Healey, J.R. 2010 How can ecologists help realise the potential of payments for carbon in tropical forest countries? Journal of Applied Ecology 47: 1159–1165.
Baland, J-M., Bardhan, P., Bowles, S. 2007 Introduction. In: Baland, J-M., Bardhan, P., Bowles, S. (eds). Inequality, cooperation, and environmental sustainability. Princeton University Press, Princeton, New Jersey, USA.
Bamberger, M. 2006 Conducting quality impact evaluations under budget, time and data constraints. World Bank, Washington, DC.
Bamberger, M. 2009 Strengthening the evaluation of programme effectiveness through reconstructing baseline data. Journal of Development Effectiveness 1(1): 37–59.
Bamberger, M., Rugh, J., Church, M. and Fort, L. 2004 Shoestring evaluation: designing impact evaluations under budget, time, and data constraints. American Journal of Evaluation 25(1): 5–37.
Bandyopadhyay, S. and Tembo, G. 2009 Household welfare and natural resource management around national parks in Zambia. Policy Research Working Paper 4932. World Bank, Washington, DC.
Barbier, E.B. 2001 The economics of tropical deforestation and land use: an introduction to the special issue. Land Economics 77(2): 155–171.
Barbier, E.B. and Benhin, J.K.A. 2001 The effects of the structural adjustment program on deforestation in Ghana. Agricultural and Resource Economics Review 30(1): 66–88.
Barbier, E.B., Bockstael, N., Burgess, J.C. and Strand, I. 1995 The linkages between the timber trade and tropical deforestation – Indonesia. World Economy 18(3): 411–442.
Barbier, E.B. and Burgess, J.C. 1996. Economic analysis of deforestation in Mexico. Environment and Development Economics 1: 203–239.
Barrett, C.B., Marenya, P., McPeak, J., Minten, B., Murithi, F., Oluoch-Kosura, W., Place, F., Randrianarisoa, J., Rasambainarivo, J., and Wangila, J. 2006 Welfare dynamics in rural Kenya and Madagascar. Journal of Development Studies 42(2): 248-277.
Beckett, M., Da Vanzo, J., Sastry, N., Panis, C. and Petersonet, C. 2001 The quality of retrospective data. Journal of Human Resources 36(3): 593–625.
Bento, A., Towe, C. and Geoghegen, J. 2007 The effects of moratoria on residential development: evidence from a matching approach. American Journal of Agricultural Economics 89(5): 1211–1218.
Bernard, H.R., Killworth, P., Kronenfeld, D. and Sailer, L. 1985 On the validity of retrospective data: the problem of informant accuracy. Annual Review of Anthropology, 13, 495–517.
Blom, B., Sunderland, T. and Murdiyarso, D. 2010 Getting REDD to work locally: lessons learned from integrated conservation and development projects. Environmental Science and Policy 13(2): 164–172.
Boucher, S., Stark, O. and Taylor, J.E. 2005 A gain with a drain? Evidence from rural Mexico on the new economics of the brain drain. Department

a guide to learning about livelihood impacts of reDD+ projects | 39
of Agricultural and Resource Economics, University of California-Davis, California, USA.
Brown, S., Hall, M., Andrasko, K., Ruiz, F., Marzoli, W., Guerrero, G., Masera, O., Dushku, A., DeJong, B. and Cornell, J. 2007 Baselines for land-use change in the tropics: application to avoided deforestation projects. Mitigation and Adaptation Strategies for Global Change 123(86): 1001–1026.
Bruner, A.G., Gullison, R.E., Rice, R.E. and da Fonseca, G.A.B. 2001 Effectiveness of parks in protecting tropical biodiversity. Science 291: 125–128.
Bush, G., Nampindo, S., Aguti, C. and Plumptre, A. 2004 The value of Uganda’s forests: a livelihoods and ecosystems approach. Report from Wildlife Conservation Society, EU Forest Resources Management and Conservation Programme and Uganda National Forest Authority. http://programs.wcs.org/portals/49/media/file/sForests.pdf (November 2010).
Butler, R.A. and Lawrence, W.F. 2008 New strategies for conserving tropical forests. Trends in Ecology and Evolution 23(9): 469–472.
Caplow, S., Jagger, P., Lawlor, K. and Sills, E. [in press] Evaluating the land use and livelihood outcomes of early forest carbon projects: lessons for REDD+. Environmental Science and Policy.
Carbon Offset Research and Education (CORE) 2010 Carbon Offset Research and Education, Stockholm Environment Institute. http://www.co2offsetresearch.org (November 2010).
CARE 2002 Household livelihood security assessments: a toolkit for practitioners. Prepared for the PHLS Unit by TANGO International Inc., Tucson, Arizona. http://www.proventionconsortium.org/themes/default/pdfs/CRA/HLSA2002_meth.pdf (November 2010).
Carney, D. (ed.) 1998 Sustainable rural livelihoods: what contribution can we make? DFID, London.
Carter, M.R. and Barrett, C.B. 2006 The economics of poverty traps and persistent poverty: an asset-based approach. Journal of Development Studies 42(2): 178–199.
Carter, M.R. and May, J. 2001 One kind of freedom: poverty dynamics in post-apartheid South Africa. World Development 29(12): 1987-2006.
Castella, J.-C., Kam, S.P., Quang, D.D., Verburg, P.H. and Hoanh, C.H. 2007 Combining top-down and bottom-up modeling approaches of land use/cover change to support public policies: application to sustainable management of
natural resources in northern Vietnam. Land Use Policy 24: 531–545.
Catley, A., Burns, J., Adebe, D. and Suji, O. 2007 Participatory impact assessment: a guide for practitioners. Feinstein International Center, Tufts University, Medford, Massachusetts. http://www.reliefweb.int/rw/lib.nsf/db900SID/SHIG-7L2K8C?OpenDocument (November 2010).
Cavendish, W. 2000 Empirical regularities in the poverty-environment relationship of rural households: evidence from Zimbabwe. World Development 28 (11):1979–2003.
Cavendish, W. 2002 Quantitative methods for estimating the economic value of resource use to rural households. In: Campbell, B.M. and Luckert, M.K.L. (eds) Uncovering the hidden harvest: valuation methods for woodland and forest resources, p. 17–65. Earthscan, London.
Cavendish, W. and Campbell, B.M. 2008 Poverty, environmental income and rural inequality: a case study from Zimbabwe. In: Dewees, P. and Campbell, B.M. (eds) Managing the Miombo woodlands of southern Africa: policies, incentives and options for the rural poor. World Bank, Washington, DC.
Caviglia-Harris, J.L. and Harris, D.W. 2005 Examining the reliability of survey data with remote sensing and geographic information systems to improve deforestation modeling. Review of Regional Studies 35: 187–205.
Caviglia-Harris, J.L. and Harris, D.W. 2008 Integrating survey and remote sensing data to analyze land use at a fine scale: insights from agricultural households in the Brazilian Amazon. International Regional Science Review 31: 115–137.
Cerbu, G., Minang, P.A., Swallow, B. and Meadu, V. 2009 Global survey of REDD projects: what implications for global climate objectives? ASB Policy Brief No. 12. ASB Partnership for the Tropical Forest Margins, Nairobi, Kenya. http://www.asb.cgiar.org/pdfwebdocs/ASBPB12.pdf
Chambers, R. and Conway, G. 1992 Sustainable rural livelihoods: practical concepts for the 21st century. Institute of Development Studies, Brighton, UK.
Chen, H and Rossi, P.H. 1983 Evaluating with sense: the theory driven approach. Evaluation Review 7: 283–302.
Chhatre, A. and Agrawal, A. 2009 Synergies and trade-offs between carbon storage and livelihood benefits from forest commons.

40 | pamela Jagger, erin O. sills, Kathleen lawlor and William D. sunderlin
Proceedings of the National Academy of Sciences 106: 17667–17670.
Chomitz, K., Balmford, A., Whitten, T., Richards. M. and Berlin, A. 2007 At loggerheads? Agricultural expansion, poverty reduction, and environment in tropical forests. World Bank Policy Research Report. World Bank, Washington, DC. http://go.worldbank.org/TKGHE4IA30.
Climate, Community and Biodiversity Alliance. 2010 Climate, Community and Biodiversity Project Design Standards http://www.climate-standards.org/standards/index.html (November 2010).
Climate Funds Update http://www.climatefundsupdate.org (November 2010).
Coria, J., Hennlock, M., Löfgren, A., Persson, M., Söderholm, P., Sterner, T. and Wrake, M. 2010 The progress of GHG markets: opportunities and risks. Gothenburg Environmental Economics Report: http://www.efdinitiative.org/research/publications/publications-repository/the-progress-of-ghg-markets-opportunities-and-risks/files/TheProgessOfGHGMarkets20100928.pdf (November 2010).
Cohen, M. and Barnes, C. 1996 Assets and the impact of microenterprise finance programs. AIMS Project. Management Systems International, Washington, DC.
Colchester, M. and Ferrari, M.F. 2007 Making FPIC work: challenges and prospects for indigenous peoples. Forest Peoples Programme, Moreton-in-Marsh, UK.
Coleman, G. 1987. Logical framework approach to the monitoring and evaluation of agricultural and rural development projects. Project Appraisal 2(4): 251–259.
Colfer, C.J.P., Brocklesby, M.A., Diaw, C., Etuge, P., Günter, M., Harwell, E., McDougall, C., Porro, N.M., Porro, R., Prabhu, R. et al. 1999 The BAG: basic assessment guide for human well-being. Criteria and Indicators Toolkit No. 5. CIFOR, Bogor, Indonesia.
Colfer, C.J.P., Brocklesby, M.A., Diaw, C., Etuge, P., Günter, M., Harwell, E., McDougall, C., Porro, N.M., Porro, R., Prabhu, R. et al. 1999 The Grab Bag: supplementary methods for assessing human well-being. Criteria and Indicators Toolkit No. 6. CIFOR, Bogor, Indonesia.
Compliance Advisor Ombudsman (CAO). 2008 Participatory water monitoring: a guide for preventing and managing conflict. CAO,
Washington, DC. http://www.cao-ombudsman.org/howwework/advisor/documents/watermoneng.pdf (November 2010).
Conservation Measures Partnership (CMP). 2007 Open standards for the practice of conservation. http://www.conservationmeasures.org/wp-content/uploads/2010/04/CMP_Open_Standards_Version_2.0.pdf (November 2010).
Costello, C., Gaines, S.D. and Lynham, J. 2008 Can catch shares prevent fisheries collapse? Science 321(5896): 1678–1681.
Curran, L.M., Trigg, S.N., McDonald, A.K., Astiani, D., Hardiono, Y.M., Siregar, P., Caniago, I. and Kasischke, E. 2004 Lowland forest loss in protected areas of Indonesian Borneo. Science 303(5660): 1000–1003.
Davies, R. 1997 Beyond wealth ranking: the democratic definition and measurement of poverty. http://www.mande.co.uk/docs/democrat.htm (November 2010).
Davies, R. and Dart, J. 2005 Most significant change (MSC) technique: a guide to its use. http://mande.co.uk/docs/MSCGuide.pdf (November 2010).
DeFries, R.S., Rudel, T., Uriarte, M. and Hansen, M. 2010 Deforestation driven by urban population growth and agricultural trade in the twenty-first century. Nature Geoscience 3: 178–181.
Department for International Development (DFID) 2009 Guidance on using the revised logical framework. DFID Practice Paper. DFID, London.
De Wasseige, C., Devers, D., de Marcken, P., Eba’a Atyi, R., Nasi, R. and Mayaux, P. (eds) 2009 The forests of the Congo Basin: state of the forest 2008. Publications Office of the European Union, Luxembourg. http://carpe.umd.edu/resources/sof/ (November 2010),
Earl, S., Carden, F. and Smutylo, T. 2001 Outcome mapping: building learning and reflecting into development programs. International Development Research Centre, Ottawa.
Ecosecurities 2010 The forest carbon offsetting report 2010. http://www.ecosecurities.com/Registered/ForestCarbonOffsettingReport2010.pdf (November 2010).
Estrada, M. [in press] Standards and methods available for estimating project-level REDD+ carbon benefits: reference guide for project developers. CIFOR, Bogor, Indonesia.
Evans, T.P. and Kelley, H. 2004 Multi-scale analysis of a household level agent-based model of

a guide to learning about livelihood impacts of reDD+ projects | 41
land cover change. Journal of Environmental Management 72: 57–72.
Fairhead, J. and Leach, M. 1998 Reframing deforestation: global analyses and local realities with studies in West Africa. Routledge, London.
Ferraro, P.J. 2009 Counterfactual thinking and impact evaluation in environmental policy. New Directions for Evaluation 122: 75–84.
Ferraro, P.J. and Pattanayak, S.K. 2006 Money for nothing? A call for empirical evaluation of biodiversity conservation investments. Public Library of Science Biology 4(4): 0482–0488.
Filmer, D. and Pritchett, L.H. 2001 Estimating wealth effects without expenditure data—or tears: an application to educational enrollments in states of India. Demography 38(1): 115–132.
Fisher, M. 2004 Household welfare and forest dependence in southern Malawi. Environment and Development Economics 9: 135–154.
Fitzherbert, E.B., Struebig, M.J., Morel, A., Danielsen, F., Bruhl, C.A., Donald, P.F. and Phalan, B. 2008 How will oil palm expansion affect biodiversity? Trends in Ecology and Evolution 23(10): 538–545.
Forest Peoples Programme 2008 Free, prior and informed consent and the roundtable on sustainable palm oil: a guide for companies. Forest Peoples Programme, Moreton-in-Marsh, UK.
Furman, R. 2009 Lessons from implementing a theory of change: M&E system in the livelihoods and landscapes strategy initiative. IUCN, Gland, Switzerland.
Gasper, D. 2000 Evaluating the logical framework approach towards learning-oriented development evaluation. Public Administration and Development 20(1): 17–28.
Gaveau, D.L.A., Epting, J., Lyne, O., Linkie, M., Kumara, I., Kanninen, M. and Leader-Williams, N. 2009a Evaluating whether protected areas reduce tropical deforestation in Sumatra. Journal of Biogeography 36(11): 2165–2175.
Gaveau, D.L.A., Wandono, H. and Setiabudi, F. 2007 Three decades of deforestation in southwest Sumatra: have protected areas halted forest loss and logging, and promoted regrowth? Biological Conservation 134: 495–504.
Gaveau, D.L.A., Wich, S., Epting, J., Juhn, D., Kanninen, M. and Leader-Williams, N. 2009b The future of forests and orangutans (Pongo abelii) in Sumatra: predicting impacts of oil palm plantations, road construction, and mechanisms for reducing carbon emissions from deforestation. Environmental Research Letters 4: 034013. doi: 10.1088/1748-9326/4/3/034013.
Geist, H.J. and Lambin, D.F. 2002 Proximate causes and underlying driving forces of tropical deforestation. BioScience (52)2: 143–150.
Glewwe, P., Kremer, M., Moulin, S. and Zitzewitz, E. 2004 Retrospective vs. prospective analyses of school inputs: the case of flip charts in Kenya. Journal of Development Economics 74(1): 251–268.
Global Environment Facility (GEF) 2010 Developing an experimental methodology for testing the effectiveness of payments for ecosystem services to enhance conservation in productive landscapes in Uganda. http://www.thegef.org/gef/node/2772 (November 2010).
Global Observation for Forest and Land Cover Dynamics (GOFC-GOLD) 2009 A sourcebook of methods and procedures for monitoring and reporting anthropogenic greenhouse gas emissions and removals caused by deforestation, gains and losses of carbon stocks in forests remaining forests and forestation. http://www.gofc-gold.uni-jena.de/redd/ (November 2010).
Global Witness 2005 Timber, Taylor, soldier spy: how Liberia’s uncontrolled resource exploitation, Charles Taylor’s manipulation and the re-recruitment of ex-combatants are threatening regional peace. Report to the UN Security Council, Global Witness.
Global Witness 2007 Cambodia’s family trees: illegal logging and the stripping of public assets by Cambodia’s elite. Global Witness, London.
Greene, J.C. and Caracelli, V.J. (eds) 1997 Advances in mixed method evaluation: the challenges and benefits of integrating diverse paradigms. New Directions in Evaluation, 74. Jossey Bass, San Francisco, California.
Griscom, B., Shoch, D., Stanley, B., Cortez, R. and Virgillo, N. 2009 Sensitivity of amounts and distribution of tropical forest carbon credits depending on baseline rules. Environmental Science and Policy 12(7): 897–911.
Hamilton, K., Sjardin, M., Peters-Stanley, M. and Marcello, T. 2010 Building bridges: state of the voluntary carbon markets 2010. Report, Ecosystem Marketplace and Bloomberg New Energy Finance. http://moderncms.ecosystemmarketplace.com/repository/moderncms_documents/vcarbon_2010.2.pdf (November 2010).

42 | pamela Jagger, erin O. sills, Kathleen lawlor and William D. sunderlin
Hansen, C.P. and Treue, T. 2008 Assessing illegal logging in Ghana. International Forestry Review 10(4): 573–590.
Hansen, M.C., Roy, D.P., Lindquist, E., Adusel, B., Justice, C.O. and Altstatt, A. 2008 A method for integrating MODIS and Landsat data for systematic monitoring of forest cover and change in the Congo Basin. Remote Sensing of Environment 112(5): 2495–2513.
Hertel, T., Rose, S. and Tol, R. 2009 Land use in computable general equilibrium models: an overview. In: Hertel, T., Rose, S. and Tol, R. (eds) Economic analysis of land use in global climate change policy, chapter 1. Routledge, New York.
Honey-Roses, J., Lopez-Garcia, J., Rendon-Salinas, E., Peralta-Higuera, A. and Galindo-Leal, C. 2009 To pay or not to pay? Monitoring performance and enforcing conditionality when paying for forest conservation in Mexico. Environmental Conservation 36(2): 120–128.
International Fund for Agricultural Development (IFAD) 2009 Evaluation manual: methodology and processes. IFAD Office of Evaluation, IFAD, Rome. http://www.ifad.org/evaluation/process_methodology/index.htm (November 2010).
Jagger, P. [in press] Environmental income, rural livelihoods and income inequality in western Uganda. In: Benin, S. and Benson, T. (eds) In pursuit of prosperity in rural Uganda: opportunities and constraints. International Food Policy Research Institute, Washington, DC.
Jagger, P. 2008 Forest incomes after Uganda’s forest sector reform: are the rural poor gaining? CGIAR Systemwide Program on Collective Action and Property Rights (CAPRi), Working Paper Series No. 92. International Food Policy Research Institute, Washington, DC.
Jagger, P. and Angelsen, A. [in press] What surveys to undertake? In: Angelsen, A., Olsen, C.S., Larsen, H.O., Lund, J.F. and Wunder, S. (eds) Measuring livelihoods and environmental dependence: methods for research and fieldwork. Earthscan, London.
Jagger, P., Atmadja, S., Pattanayak, S.K., Sills, E. and Sunderlin, W.D. 2009 Learning while doing: evaluating impacts of REDD+ projects. In: Angelsen, A. (ed.) Realising REDD+: national strategy and policy options, 281–292. CIFOR, Bogor, Indonesia.
Jenkins, M. 2008 Who murdered the Virunga gorillas? National Geographic, July, p. 34–65.
Jenkins, W. 2010 The Tuskegee syphilis study: implications for current research. Presentation
to the Carolina Population Study, University of North Carolina, Chapel Hill, 8 October.
Jindal, R. 2010 Livelihood impacts of payments for forestry carbon services: field evidence from Mozambique. In: Tacconi, L. Mahanty, S. and Suich, H. (eds) Livelihoods in the REDD? Payments for environmental services, forest conservation and climate change. Edward Elgar, Cheltenham, UK.
Joppa, L.N. and Pfaff, A. 2009 High and far: biases in the location of protected areas. Public Library of Science ONE 4(12): e8273.
Jumbe, C. and Angelsen, A. 2006 Do the poor benefit from devolution policies? Evidence from forest co-management in Malawi. Land Economics 82(4): 562–581.
Kaimowitz, D. 1996 Livestock and deforestation in Central America in the 1980s and 1990s: a policy perspective. CIFOR, Bogor, Indonesia.
Kanninen, M., Murdiyarso, D., Seymour, F., Angelsen, A., Wunder, S. and German, L. 2007 Do trees grow on money? The implications of deforestation research for policies to promote REDD. CIFOR, Bogor, Indonesia.
Karsenty, A. 2008 The architecture of proposed REDD schemes after Bali: facing critical choices. International Forestry Review 10(3): 443–457.
Kerr, J. and Pender, J. 2005 Farmers’ perceptions of soil erosion and its consequences in India’s semiarid tropics. Land Degradation and Development 16: 257–271.
Khandker, S.R., Koolwal, G.B. and Samad, H.A. 2010 Handbook on impact evaluation: quantitative methods and practices. World Bank, Washington, DC.
Krishna, A. 2005 Stages of Progress field manual: a community based methodology for defining and understanding poverty. Version 2.0. http://sanford.duke.edu/krishna/SoP.pdf (November 2010).
Kusek, J.Z. and Rist, R.C. 2004 Ten steps to building a results based monitoring and evaluation system. World Bank, Washington, DC.
Laporte, N.T., Stabach, J.A., Grosch, R., Lin, T.S. and Goetz, S.J. 2007 Expansion of industrial logging in Central Africa. Science 316(5830): 1451.
Lawlor, K. 2009 Addressing the causes of tropical deforestation: lessons learned and the implications for international forest carbon policy. In: Olander, L.P., Boyd, W., Lawlor, K., Myers Madeira, E. and Niles, J.O. (eds) International forest carbon and the climate change challenge: issues and options, 43–53.

a guide to learning about livelihood impacts of reDD+ projects | 43
Nicholas Institute for Environmental Policy Solutions, Duke University, Durham, North Carolina, USA.
Leeuw, F. and Vaessen, J. 2009 Impact evaluations and development: NONIE guidance on impact evaluation. World Bank, Washington, DC. http://www.worldbank.org/ieg/nonie/guidance.html (November 2010).
Lele, N., Nagendra, H. and Southworth, J. 2010 Accessibility, demography and protection: drivers of forest stability and change at multiple scales in the Cauvery Basin, India. Remote Sensing 2: 306–332.
Lerman, R. and Yitzhaki, S. 1985 Income inequality effects by income source: a new approach and application to the United States. Review of Economics and Statistics 67: 151–156.
Lipsey, M.W. 1993 Theory as method: small theories as treatments. New Directions for Program Evaluation 57: 5–38.
Lopez-Feldman, A. 2006 Decomposing inequality and obtaining marginal effects. Stata Journal 6: 106–111.
Lopez-Feldman, A., Mora, J. and Taylor, J.E. 2007 Does natural resource extraction mitigate poverty and inequality? Evidence from rural Mexico and Lacandona Rainforest community. Environment and Development Economics 12: 251–269.
Madeira, E.M., Sills, E., Brockhaus, M., Verchot, L. and Kanninen, M. 2010 What is a REDD+ pilot? A preliminary typology based on early actions in Indonesia. CIFOR InfoBrief. CIFOR, Bogor, Indonesia.
Margoluis, R., Stem, C., Salafsky, N. and Brown, M. 2009 Design alternatives for evaluating the impact of conservation projects. New Directions for Evaluation 2009 (122): 85–96.
Mathiowetz, N.A. and Duncan, G.J. 1988 Out of work, out of mind: response errors in retrospective reports of unemployment. Journal of Business and Economic Statistics 6(2): 221–229.
McAlpine, C.A., Etter, A., Fearnside, P.M., Seabrook, L. and Laurance, W.F. 2009 Increasing world consumption of beef as a driver of regional and global change: A call for policy action based on evidence from Queensland (Australia), Colombia and Brazil. Global Environmental Change 19: 21–33.
McCracken, S., Siqueira, A.D., Moran E.F. and Brondizio, E.S. 2002 Land-use patterns on an agricultural frontier in Brazil: insights and
examples from a demographic perspective. In: Wood, C.H. and Porro, R. (eds) Deforestation and land use in the Amazon, 162–192. University Press of Florida, Gainesville, Florida, USA.
McGee, R. 2000 Analysis of participatory poverty assessment (PPA) and household survey findings on poverty trends in Uganda. Mission report, 10–18 February 2010. www.eldis.org/vfile/upload/1/document/0708/DOC8301.pdf (November 2010).
McKenzie, D.J. 2005 Measuring inequality with asset indicators. Journal of Population Economics 18(2): 229-260.
Mertens, B., Sunderlin, W.D., Ndoye, O. and Lambin, E.F. 2000 Impact of macroeconomic change on deforestation in south Cameroon: integration of household survey and remotely-sensed data. World Development 28(6): 983–999.
Miguel, E. and Kremer, M. 2004 Worms: identifying impacts on health and education in the presence of treatment externalities. Econometrica 72(1): 159–217.
Moran, E.F., Siqueira, A. and Brondizio, E. 2003 Household demographic structure and its relationship to deforestation in the Amazon basin. People and the Environment: 61–89. doi: 10.1007/0-306-48130-8_3.
Morton, D., DeFries, R.S., Shimabukuro, Y.E., Anderson, L.O., Arai, E., Bon Espirito-Santo, F., Freitas, R. and Morisette, J. 2006 Cropland expansion changes deforestation dynamics in the southern Brazilian Amazon. Proceedings of the National Academy of Sciences USA 103(39): 14637–14641.
Moser, C.O.N. 1998 The asset vulnerability framework: reassessing urban poverty reduction strategies. World Development 26(1): 1-19.
Motel, P.C., Pirard, R. and Combes, J.-L. 2008 A methodology to estimate impacts of domestic policies on deforestation: Compensated Successful Efforts for ‘avoided deforestation’. Ecological Economics 68(3): 680–691.
Mullan, K., Sills, E. and Bauch, S. 2010 The reliability of retrospective data on asset ownership as a measure of past household wealth. Working Paper, North Carolina State University.
Murray, B.C. 2009 Leakage from an avoided deforestation compensation policy: concepts, empirical evidence, and corrective policy options. In: Palmer, C. and Engel, S. (eds) Avoided deforestation: prospects for mitigating climate change, p. 11–38. Routledge, New York.
Narain, U., Gupta, S. and van’t Veld, K. 2005 Poverty and environment: exploring the relationship

44 | pamela Jagger, erin O. sills, Kathleen lawlor and William D. sunderlin
between household incomes, private assets, and natural assets. RFF Discussion Paper No. 05-18. Resources for the Future, Washington, DC.
National Commission for the Protection of Human Subjects of Biomedical and Behavioral Research 1979 The Belmont Report: ethical principles and guidelines for the protection of human subjects of research. http://www.hhs.gov/ohrp/humansubjects/guidance/belmont.htm#xassess (November 2010).
Nelson, A. and Chomitz, K.M. 2009 Protected area effectiveness in reducing tropical deforestation: a global analysis of the impact of protection status. World Bank, Washington, DC. http://siteresources.worldbank.org/INTOED/Resources/protected_areas_eb.pdf (November 2010).
Neter, J. and Waksberg, J. 1964 A study of response errors in expenditures data from household interviews. Journal of the American Statistical Association 59(305): 18–55.
Norway 2010 What does the Norwegian Climate and Forest Initiative finance? http://www.regjeringen.no/en/dep/md/Selected-topics/climate/the-government-of-norways-international-/what-do-we-finance.html?id=557700 (November 2010).
Oliveira, P.J.C., Asner, G.P., Knapp, D.E., Almeyda, A., Galvan-Gildemeister, R., Keene, S., Raybin, R.F. and Smith, R.C. 2007 Land-use allocation protects the Peruvian Amazon. Science 317: 1233–1236.
Ortengren, K. 2004 The logical framework approach: a summary of the theory behind the LFA Method. Swedish International Development Agency, Stockholm, Sweden.
Ostrom, E. 2009 A general framework for analyzing sustainability of social-ecological systems. Science 325: 419–422.
Ostrom, E. and Wertime, M.B. 2000 International forestry resources and institutions research strategy. In: Gibson, C., McKean, M. and Ostrom, E. (eds) People and forests: communities, institutions, and governance, p. 1–28. MIT Press, Cambridge, Massachusetts, USA.
Palmer, C. 2001 The extent and causes of illegal logging: an analysis of a major cause of deforestation in Indonesia. CSERGE Working Paper. Centre for Social and Economic Research on the Global Environment (CSERGE), London.
Parker, C., Mitchell, A., Trivedi, M. and Mardas, N. 2009 The little REDD+ book. 2nd ed. Global Canopy Foundation, Oxford, UK.
Parker, D.C., Manson, S.M., Janssen, M.A., Hoffmann, M.J. and Deadman, P. 2003 Multi-agent systems for the simulation of land-use and land-cover change: a review. Annals of the Association of American Geographers 93(2): 314–337.
Pattanayak, S.K. 2009 Rough guide to impact evaluation of environmental and development programs. SANDEE Working Paper No. 20-09. South Asian Network for Development and Environmental Economics, Kathmandu.
Pattanayak, S.K. and Sills, E.O. 2001 Do tropical forests provide natural insurance? The microeconomics of non-timber forest product collection in the Brazilian Amazon. Land Economics 77(4): 595–612.
Pattanayak, S.K., Wunder, S. and Ferraro, P.J. 2010 Show me the money: do payments supply environmental services in developing countries? Review of Environmental Economics and Policy 4(2): 254–274.
Pfaff, A. 1999 What drives deforestation in the Brazilian Amazon? Evidence from satellite and socioeconomic data. Journal of Environmental Economics and Management 37(1): 26–43.
Pfaff, A., Robalino, J.A. and Sanchez-Azofeifa, G.A. 2008. Payments for environmental services: empirical analysis for Costa Rica. Duke University Sanford School of Public Policy Working Paper SAN08-05. http://www.sanford.duke.edu/research/papers/SAN08-05.pdf (November 2010).
Pfaff, A., Robalino, J., Sanchez-Azofeifa, G.A., Andam, K.S. and Ferraro, P.J. 2009 Park location affects forest protection: land characteristics cause differences in park impacts across Costa Rica. B.E. Journal of Economic Analysis and Policy 9(2).
Plantinga, A.J. and Richards, K.R. 2008 International forest carbon sequestration in a post-Kyoto agreement. Harvard Project on International Climate Agreements Discussion Paper 2008-11. Cambridge, Massachusetts, USA.
Plewis, I. 2002 Modeling impact heterogeneity. Journal of the Royal Statistical Society: Series A Statistics in Society 165(1): 31–38.
Poteete, A.R. and Ostrom, E. 2004 Heterogeneity, group size and collective action: the role of institutions in forest management. Development and Change 35(3): 435–461.

a guide to learning about livelihood impacts of reDD+ projects | 45
Potvin, C., Tschakert, P., Lebel, F., Kirby, K., Barrios, H., Bocariza, J., Caisamo, J., Caisamo, L., Cansari, C., Casamá, J., et al. 2007 A participatory approach to the establishment of a baseline scenario for a reforestation Clean Development Mechanism project. Mitigation and Adaptation Strategies for Global Change 12: 1341–1362.
Pradhan, M. and Rawlings, L.B. 2002 The impact and targeting of social infrastructure investments: lessons from the Nicaraguan social fund. World Bank Economic Review 16: 275–295.
Pro Poor Center and Davies, R. 2006 The 2006 Basic Necessities Survey (BNS) in Can Loc District, Ha Tinh Province, Vietnam. http://mande.co.uk/special-issues/the-basic-necessities-survey (November 2010).
Rao, V. 2002 Experiments in ‘participatory econometrics’: improving the connection between economic analysis and the real world. Economic and Political Weekly 37(20): 1887–1889, 1891.
Ravallion, M. 2009 Evaluation in the practice of development. World Bank, Washington, DC and Oxford University Press, Oxford, UK.
Reynolds, A.J. 1998 Confirmatory program evaluation: A method for strengthening causal inference. American Journal of Evaluation. 19(2): 203–222.
Richards, K. and Andersson, K. 2001 The leaky sink: persistent obstacles to a forest carbon sequestration program based on individual projects. Climate Policy 1: 41–54.
Richards, M. and Panfil, S. 2010 Manual for social impact assessment of land-based carbon projects. Version 1.0. Forest Trends, Climate Community Biodiversity Alliance, Fauna and Flora International and Rainforest Alliance, Washington, DC. http://www.forest-trends.org/documents/files/doc_2436.pdf (November 2010).
Sahn, D.E. and Stifel, D. 2003 Exploring alternative measures of welfare in the absence of expenditure data. Review of Income and Wealth 49(4): 463–489.
Salim, A., Colfer, C.J.P. and McDougall, C. 1999 The scoring and analysis guide for assessing human well-being. Criteria and Indicators Toolkit No. 7. CIFOR, Bogor, Indonesia.
Sayer, J., Campbell, B., Petheram, L., Aldrich, M., Ruiz Perez, M., Endamana, D., Nzooh Dongmo, Z.-L., Defo, L., Mariki. S., Doggart, N. and Burgess, N. 2007 Assessing environment and development outcomes in conservation
landscapes. Biodiversity Conservation 16(9): 2677–2694.
Schlamadinger, B., Ciccarese, L., Dutschke, M., Fearnside, P.M., Brown, S. and Murdiyarso, D. 2005 Should we include avoidance of deforestation in the international response to climate change? In: Murdiyarso, D. and H. Herawati, H. (eds) Carbon forestry: who will benefit? Proceedings of Workshop on Carbon Sequestration and Sustainable Livelihoods, Bogor, Indonesia, 16–17 February. CIFOR, Bogor, Indonesia.
Schreckenberg, K., Camargo, I., Withnall, K., Corrigan, C., Franks, P., Roe, D., Scherl, L.M. and Richardson, V. 2010 Social assessment of protected areas: a review of rapid methodologies. Report for the Social Assessment of Protected Areas Initiative. International Institute for Environment and Development, London.
Shadish, W.R., Cook, T.D. and Campbell, D.T. 2002 Experimental and quasi-experimental designs for generalized causal inference. 2nd ed. Houghton Mifflin, New York.
Siegmund-Schultze, M., Rischkowsky, B., da Veiga, J.B., and King, J.M. 2007 Cattle are cash generating assets for mixed smallholder farms in the Eastern Amazon. Agricultural Systems 94(3): 738–749.
Sills, E., Madeira, E., Sunderlin W.D. and Wertz-Kanounnikoff, S. 2009 The evolving landscape of REDD+ projects. In: Angelsen, A. (eds) Realising REDD+: national strategy and policy options, p. 265–280. CIFOR, Bogor, Indonesia.
Sims, K.R.E. 2010 Conservation and development: evidence from Thai protected areas. Journal of Environmental Economics and Management 60(2): 94–114.
Skutsch, M.M. and McCall, M.K. 2010 Reassessing REDD: governance, markets and the hype cycle: an editorial comment. Climatic Change 100: 395–402.
Soares-Filho, B., Moutinho, P. Nepstad, D., Anderson, A., Rodrigues, H., Garcia, R., Dietzsch, L., Merry, F., Bowman, M., Hissa, L. et al. 2010 Role of Brazilian Amazon protected areas in climate change mitigation. Proceedings of the National Academy of Sciences USA 107(24): 10821–10826.
Somanathan, E., Prabhakar, R. and Mehta, B.S. 2009 Decentralization for cost-effective conservation. Proceedings of the National Academy of Sciences USA 106(11): 4143–4147.
Springate-Baginski, O. and Wollenberg, E. (eds) 2010 REDD, forest governance and rural livelihoods: the emerging agenda. CIFOR, Bogor, Indonesia.

46 | pamela Jagger, erin O. sills, Kathleen lawlor and William D. sunderlin
Sudman, S. and Bradburn, N.M. 1973 Effects of time and memory factors on response in surveys. Journal of the American Statistical Association 68(344): 805–815.
Sudman, S., Bradburn, N.M. and Schwarz, N. 1995 Thinking about answers: the application of cognitive processes to survey methodology. Jossey-Bass, San Francisco, California, USA.
Sunderlin, W.D. and Atmadja, S. 2009 Is REDD+ an idea whose time has come, or gone? In: Angelsen, A. et al. (eds) Realising REDD+: national strategy and policy options. CIFOR, Bogor, Indonesia.
Sunderlin, W.D. and Resosudarmo, I.A.P. 1996 Rates and causes of deforestation in Indonesia: towards a resolution of the ambiguities. CIFOR Occasional Paper No. 9. CIFOR, Bogor, Indonesia.
Sunderlin, W.D., Angelsen, A., Resosudarmo, D.P., Dermawan, A. and Rianto, E. 2001 Economic crisis, small farmer well-being, and forest cover change in Indonesia. World Development 29(5): 767–782.
Tacconi, L. 2009 Compensated successful efforts for avoided deforestation vs. compensated reductions. Ecological Economics 68(8–9): 2469–2472.
Takasaki, Y., Barham, B.L. and Coomes, O.T. 2000 Rapid rural appraisal in humid tropical forests: an asset possession-based approach and validation methods for wealth assessment among forest peasant households. World Development 28(11): 1961–1977.
Teobaldelli, M., Doswald, N. and Dickson, B. 2010 Monitoring for REDD+: carbon stock change and multiple benefits. Multiple Benefits Series 3. UNEP World Conservation Monitoring Centre, Cambridge, UK.
Uchida, E., Rozelle, S. and Xu, J. 2009 Conservation payments, liquidity constraints, and off-farm labor: impact of the grain-for-green program on rural households in China. American Journal of Agricultural Economics 91(1): 70–86.
Udry, C. 2003 Fieldwork, economic theory and research on institutions in developing countries. www.econ.yale.edu/~cru2//pdf/fieldwork.pdf (November 2010).
Veldkamp, A. and Lambin, E.F. 2001 Editorial: predicting land-use change. Agriculture, Ecosystems and Environment 85: 1–6.
Veldkamp, A. and Verburg, P.H. 2004 Editorial: modeling land use change and environmental
impact. Journal of Environmental Management 72: 1–3.
Vedeld, P., Angelsen, A., Sjaastad, E. and Berg, G.K. 2004 Counting on the environment: forest incomes and the rural poor. Environmental Economics Series, No. 98. World Bank, Washington, DC. http://www-wds.worldbank.org/external/default/WDSContentServer/WDSP/IB/2004/09/30/000090341_20040930105923/Rendered/PDF/300260PAPER0Counting0on0ENV0EDP0198.pdf (November 2010).
Voluntary Carbon Standard (VCS). 2010 http://www.v-c-s.org (November 2010).
Walsh, S.J., Crawford, T.W., Crews-Meyer, K.A. and Welsh, W.F. 2001 A multiscale analysis of land use land cover change and NDVI variation in Nang Rong district, northeast Thailand. Agriculture, Ecosystems and Environment 85: 47–64.
Weber, J., Sills, E.O., Bauch, S. and Pattanayak, S. [in press] Do ICDPs work? An empirical evaluation of forest-based microenterprises in the Brazilian Amazon. Land Economics.
Wertz-Kanounnikoff, S. and Kongphan-apirak, M. 2009 Emerging REDD+: a preliminary survey of demonstration and readiness activities. Working Paper No. 46. CIFOR. Bogor, Indonesia.
White, H. 2009 Theory-based impact evaluation: principles and practice. 3ie Working Paper No. 3. International Initiative for Impact Evaluation, New Delhi, India.
Wildlife Conservation Society [no date] Assessing the impact of conservation and development on rural livelihoods: using a modified basic necessities survey in experimental and control communities. Wildlife Conservation Society Living Landscapes Program, Bronx, NY, USA.
Wildlife Conservation Society (WCS). 2006 Household surveys: a tool for conservation design, action and monitoring. Technical Manual 4. Wildlife Conservation Society Living Landscapes Program, Bronx, NY. http://wcslivinglandscapes.com/landscapes/90119/bulletins/manuals.html (November 2010).
Wilkie, D., Morell, G.A., Demmer, J., Starkey, M., Telfer, P. and Steil, M. 2006 Parks and people: assessing the human welfare impacts of establishing protected areas for biodiversity conservation. Conservation Biology 20(1):247–249.
Wooldridge, J.M. 2002 Econometric analysis of cross section and panel data. MIT Press, Cambridge, MA.

a guide to learning about livelihood impacts of reDD+ projects | 47
World Bank Institute 2005 Introduction to poverty analysis. World Bank, Washington, DC.
World Bank 2009 Making smart policy: using impact evaluation for policy making case studies on evaluations that influenced policy. Doing Smart Impact Evaluation No. 14. http://siteresources.worldbank.org/INTISPMA/Resources/383704 1146752240884/Doing_ie_series_14.pdf (November 2010).
Wunder, S. 2008 How do we deal with leakage? In: Angelsen, A. (ed.) Moving ahead with REDD: issues, options and implications, p. 65–76. CIFOR, Bogor, Indonesia.
Zhang, Q., Devers, D., Desch, A., Justice, C.O. and Townshend, J. 2005 Mapping tropical deforestation in Central Africa. Environmental Monitoring and Assessment 101(1–3): 69–83.
Zhao, Y. 2003 The role of migrant networks in labor migration: the case of China. Contemporary Economic Policy 21(4): 500–511.
Estrada, M. [in press] Standards and methods available for estimating project-level REDD+ carbon benefits: reference guide for project developers. CIFOR, Bogor, Indonesia.

Attribution: Identifying the cause(s) of observed outcomes by eliminating rival explanations.
Attrition: Exit of an individual, household, site or other unit of analysis from a study sample due to a change in status or eligibility, migration, inability to be located, voluntary resignation, or any other reason.
Average treatment effect (ATE): The average (mean) effect of a treatment on the population or sites of interest, calculated by subtracting the average effect in the control group from the average effect in the treatment group if and only if every person/site in the general population has an equally likely chance of being assigned to the treatment group. Due to this assumption of randomised treatment, calculation of ATE is only possible through experimental research design.
Average treatment effect on treated (ATT): The average (mean) effect of a treatment on the population or sites of interest, conditional on these populations or sites receiving the treatment. Calculated by subtracting the average effect in the control group from the average effect in the treatment group. Also denoted as TOT.
Baseline: (1) In impact evaluation and many other fields, ‘baseline’ is used to describe initial, pre-project conditions. (2) In REDD+, ‘baseline’ is often used interchangeably with ‘reference emission level’ to refer to the amount of deforestation/degradation emissions estimated to have occurred in the absence of REDD+ (Angelsen 2008a). (3) Angelsen et al. (2009) point out the critical conceptual distinction between business as usual (BAU) baselines and crediting lines. Crediting lines are the forest loss level that parties agree must be ‘beaten’ in order to demonstrate reductions and receive payments, which may differ from BAU baselines projected by scientists. Reference level sometimes is used to refer specifically to the crediting line.
Co-benefits: Benefits arising from REDD+ in addition to climate mitigation benefits, such as conserving biodiversity, enhancing adaptation to climate change, alleviating poverty, improving local livelihoods, improving forest governance and protecting rights.
Confounding variable (or confounder): A characteristic that influences both the likelihood of participation in or response to the intervention and the outcomes of interest. The effects of such characteristics must be controlled for through research design and statistical techniques in order to identify an intervention’s true impact.
Consumption: The value of goods purchased and/or consumed by a household.
Control: The population/site that is not affected by the treatment or intervention.
Counterfactual: What would have happened to the population/site of interest in the absence of the intervention. Because this hypothetical state is never actually observed, it must be estimated through modelling, observing outcomes at a control site, constructing a control group through quasi-experimental impact evaluation techniques or some combination thereof.
Covariate matching: Matching control and treatment units on the ‘distance’ between those variables that might affect the outcome(s) of interest and thus be confounding (covariates). The ‘distance’ is a weighted average of all covariates, where the weights are the inverse of variance.
Deforestation: The long-term or permanent conversion of land from forest to non-forest. The UNFCCC defines ‘forest’ as an area with minimum crown cover of 10–30%.
Glossary

a guide to learning about livelihood impacts of reDD+ projects | 49
Degradation: Alteration of forest that reduces forest density and forest carbon but does not result in conversion to non-forest.
Experimental impact evaluation: See ‘Randomisation’.
Explanatory variable: A variable used to explain or to predict changes in the values of the dependent variable. Also known as an independent variable.
External validity: Generalisability of results to the broader (general) population of interest.
Forest loss: Encompasses both deforestation and degradation.
Gini coefficient: A measure of the inequality of a distribution.
Grievance mechanism: An institution established for the purpose of addressing the concerns of individuals and communities affected by a specific conservation and/or development project, programme or policy.
Impact evaluation: A specific set of research designs and methods for assessing and understanding the impacts of public policies, programmes and projects that makes specific effort to determine the extent to which the measured effects (both intended and unintended) can be attributed to the intervention and not to other causes (Khandker et al. 2010). This set of methods includes both experimental and quasi-experimental techniques. Also called ‘programme evaluation’.
Impact heterogeneity: Differences in impact across subpopulations.
Income: Value-added production to fixed assets; the value of all production minus the value of purchased inputs (but not minus the value of household labour or natural capital, such as forest).
Instrumental variable: A variable that is correlated with the likelihood of receiving the treatment but is not correlated with any unobserved characteristics that may affect the outcomes of interest. Such a variable can be used to ‘instrument’
for the treatment and identify impacts using the quasi-experimental instrumental variables method.
Internal validity: Accuracy of estimated causal effect and impact within the selected study sample.
Leakage: The amount of deforestation/degradation emissions reduced by a project or programme that is effectively cancelled out because the forest loss activities are shifted to another location outside the project/programme boundaries.
Multivariate regression: Statistical technique that simultaneously analyses the relationships between a dependent variable and multiple independent variables (or ‘predictors’ or ‘explanatory variables’) by estimating how the value of the dependent variable changes as each independent variable changes while the effects of the other independent variables remain constant. Allows the analyst to identify the significance of independent variables (i.e. whether they account for much change in the dependent variable) as well as the magnitude of their effects.
Panel data: Observations from the exact same unit (e.g. the same individual, same household) at multiple points in time.
Process variable: A variable that captures a key attribute of project/programme design and implementation that may affect how the intervention leads to outcomes.
Propensity score: The probability of a unit being assigned to the treatment group given a set of observed characteristics. Used to match control and treatment units in the quasi-experimental propensity score matching (PSM) method.
Proponent: The REDD+ project proponent is the individual or organisation that has overall control and responsibility for the design and implementation of the project.
Quasi-experimental impact evaluation: Methods that use information about the treatment group to select or statistically construct control groups. These methods include Before–After/Control–Intervention (BACI), Propensity Score and Covariate Matching, Regression Discontinuity Design, and Instrumental Variables.

50 | pamela Jagger, erin O. sills, Kathleen lawlor and William D. sunderlin
Randomisation: Assigning participants to either the control or the treatment group totally by chance, with no relation to any other factor (e.g. by the flip of a coin). When control and treatment groups are formed by randomly selecting individual persons or sites from the general population of interest, both groups should be representative of the general population and possess the same average and distribution of characteristics. Also called ‘Experimental Impact Evaluation’.
REDD+: Projects, policies and programmes aimed at reducing emissions from deforestation and forest degradation and conserving, sustainably managing and enhancing forest carbon stocks. The ‘+’ refers to the recent expansion of the accounting and incentives scope to the latter 3 activities.
Reference emission level (REL): See ‘Baseline’.
Remote sensing (of forests): Satellite imagery of forests, which can be used to detect changes in area over time and, in some cases, disturbance.
Retrospective data and analysis: Using only data available in the current time period to reconstruct the ‘before’ (pre-intervention) conditions in order to make a comparison between the ‘before’ and ‘after’ conditions and establish attribution. Sources of retrospective data include remote sensing images and archival or government records; data can also be collected from experts and study participants by asking them about pre-project conditions and their perceptions of what factors, including the intervention, may have caused any perceived changes in conditions over time.
Rival explanations: Other possible explanations for observed changes in outcomes besides the intervention (‘treatment’) being studied. Impact evaluation techniques use methods that can robustly eliminate rival explanations, with some being able to eliminate both observable and unobservable explanations.
Sampling frame: The actual set of units from which a sample has been drawn.
Selection bias: A characteristic of the treatment or intervention group that makes members of a group more likely to participate in and/or respond to the intervention in a certain way and makes them systematically different from the control group and the general population.
Spillover: Effects of the intervention on populations or areas that are not directly involved in/affected by the intervention. Includes both positive and negative effects. Despite careful selection/construction of control groups by the researcher, there still may be spillovers that affect the control group.
Treatment: The programme, policy, project or intervention under study.
Validation: Independent third-party assessment of a project plan or design against defined standards, e.g. to determine eligibility for a certification standard, such as the Voluntary Carbon Standard (VCS) or the Climate, Community and Biodiversity Alliance (CCBA) standards.
Verification: Independent third-party assessment of the actual emissions reductions (in the case of VCS) or co-benefits (in the case of CCBA) achieved by a particular forest carbon project.
Welfare: The human condition, typically measured in economic terms.
Well-being: The human condition. It can be measured in economic terms as with welfare, but can also be more broadly construed to consider other aspects such as physical and psychological well-being; access to education, health care and other services; participation in and control over decisions affecting one’s life; and risks and opportunities.

1A guide to learning about livelihood impacts of REDD+ projects: Worksheets
Worksheet 1 www.cifor.cgiar.org
De� nitions of impact evaluation and REDD+ terms
Some readers of this guide may be quite familiar with REDD+, but new to the field of impact evaluation; others may be more familiar with impact evaluation than they are with the rapidly evolving world of REDD+. The purpose of this worksheet is to define key terms from both these fields that are used frequently in this guide.
A few key concepts underpin the design of both REDD+ and impact evaluations; however, these are often described using different terminology (see Table 1). First, impact evaluation focuses on constructing the unobservable ‘counterfactual’ outcome—what would have happened to the area or people targeted by an intervention in the absence of that intervention. Counterfactual thinking is also a distinguishing feature of REDD+. Because it is results based, with payments conditional on new net reductions in carbon emissions, REDD+ requires explicit consideration of counterfactual scenarios. Most commonly, this is the amount of forest loss (or reforestation) that would have occurred in the absence of the project or programme. This concept is referred to as the ‘reference emission level’ (REL) or ‘baseline’ in REDD+ (Angelsen 2008a). Whilst RELs and ‘baselines’ are frequently used interchangeably in REDD+, Angelsen et al. (2009) point out that there is a critical conceptual distinction between business as usual (BAU) baselines and crediting lines. BAU baselines are the net deforestation or degradation that scientists estimate would occur without REDD+, whereas crediting lines are the product of political negotiations—they are the level of forest loss that parties agree must be ‘beaten’ in order to demonstrate reductions and receive payment. The term “reference emission level” sometimes refers specifically to the crediting line, which in turn may be the same as a BAU baseline projected by scientists but in practice is likely to be adjusted by various factors. The term ‘counterfactual’ as used in impact evaluation is closest to the term BAU baseline in REDD+. The term ‘baseline’ is also used in impact evaluation to mean initial, pre-project conditions.
Another concept in both fields is ‘spillovers’. A key underlying assumption of impact evaluation methods is that treatment of one unit (e.g. a village or household in
Table 1. Same concept, di� erent terms: comparison of key impact evaluation and REDD+ terminology
Concept Described in impact evaluation as…
Applied to deforestation and described in REDD+ as…
Estimate of what would have happened in the absence of the intervention
Counterfactual BAU, Baseline
Intervention’s e� ect on populations or areas that are not directly involved in/covered by the intervention
Spillovers Leakage
the project) does not influence the outcomes of other units (e.g. villages or households not in the project). In reality, public policy interventions do often induce changes in the economy or environment that result in positive or adverse effects on other populations or areas. These effects are known as ‘spillovers’, and impact evaluation is designed either to exclude these (by selecting controls unlikely to be affected by participants) or to test for these (e.g. via multilevel randomisation including subsamples believed to be subject to spillover effects). In REDD+, this is conceptualised as the leakage problem: We can always expect a certain amount of deforestation/degradation ‘stopped’ by REDD+ to continue by simply being moved outside the project/programme boundaries.
Impact evaluation termsAttribution: Identifying the cause(s) of observed outcomes by eliminating rival explanations.
Confounding variable (or confounder): A characteristic that influences both the likelihood of participation in or response to the intervention and the outcomes of interest. The effects of such characteristics must be controlled for through research design and statistical techniques in order to identify an intervention’s true impact.
Control: The population/site that is not affected by the treatment or intervention.
Counterfactual: What would have happened to the population/site of interest in the absence of the intervention. Because this hypothetical state is never actually observed, it must be estimated through modelling, observing outcomes at a control site, constructing a control group through quasi-experimental impact evaluation techniques or some combination thereof.
Experimental impact evaluation: See ‘Randomisation’.
Explanatory variable: A variable used to explain or to predict changes in the values of the dependent variable. Also known as an independent variable.
Annex A. WorksheetsWorksheet 1

52 | Pamela Jagger, Erin O. Sills, Kathleen Lawlor and William D. Sunderlin
1A guide to learning about livelihood impacts of REDD+ projects: Worksheets
Worksheet 1 www.cifor.cgiar.org
External validity: Generalisability of results to the broader (general) population of interest.
Impact evaluation: A specific set of research designs and methods for assessing and understanding the impacts of public policies, programmes and projects that makes specific effort to determine the extent to which the measured effects (both intended and unintended) can be attributed to the intervention and not to other causes (Khandker et al. 2010). This set of methods includes both experimental and quasi-experimental techniques. Also called ‘programme evaluation’.
Impact heterogeneity: Differences in impact across subpopulations.
Internal validity: Accuracy of estimated causal effect and impact within the selected study sample.
Process variable: A variable that captures a key attribute of project/programme design and implementation that may affect how the intervention leads to outcomes.
Quasi-experimental impact evaluation: Methods that use information about the treatment group to select or statistically construct control groups. These methods include Before–After/Control–Intervention (BACI), Propensity Score and Covariate Matching, Regression Discontinuity Design, and Instrumental Variables.
Randomisation: Assigning participants to either the control or the treatment group totally by chance, with no relation to any other factor (e.g. by the flip of a coin). When control and treatment groups are formed by randomly selecting individual persons or sites from the general population of interest, both groups should be representative of the general population and possess the same average and distribution of characteristics. Also called ‘Experimental Impact Evaluation’.
Sampling frame: The actual set of units from which a sample has been drawn.
Selection bias: A characteristic of the treatment or intervention group that makes members of that group more likely to participate in and/or respond to the intervention in a certain way and makes them systematically different from the control group and the general population.
Spillover: Effects of the intervention on populations or areas that are not directly involved in/affected by the intervention. Includes both positive and negative effects.
Treatment: The programme, policy, project or intervention under study.
REDD+ termsBaseline: (1) In impact evaluation and many other fields, ‘baseline’ is used to describe initial, pre-project conditions. (2) In REDD+, ‘baseline’ is often used interchangeably with ‘reference emission level’ to refer to the amount of deforestation/degradation emissions estimated to have occurred in the absence of REDD+ (Angelsen 2008a). (3) Angelsen et al. (2009) point out the critical conceptual distinction between business as usual (BAU) baselines and crediting lines. Crediting lines are the forest loss level that parties agree must be ‘beaten’ in order to demonstrate reductions and receive payments, which may differ from BAU baselines projected by scientists. Reference level sometimes is used to refer specifically to the crediting line.
Deforestation: The long-term or permanent conversion of land from forest to non-forest. The UNFCCC defines ‘forest’ as an area with minimum crown cover of 10–30%.
Degradation: Alteration of forest that reduces forest density and forest carbon but does not result in conversion to non-forest.
Forest loss: Encompasses both deforestation and degradation.
Leakage: The amount of deforestation/degradation emissions reduced by a project or programme that is effectively cancelled out because the forest loss activities are shifted to another location outside the project/programme boundaries.
Proponent: The REDD+ project proponent is the individual or organisation that has overall control and responsibility for the design and implementation of the project.
Reference emission level (REL): See ‘Baseline’.
REDD+: Projects, policies and programmes aimed at reducing emissions from deforestation and forest degradation and conserving, sustainably managing and enhancing forest carbon stocks. The ‘+’ refers to the recent expansion of the accounting and incentives scope to the latter 3 activities.
Validation: Independent third-party assessment of a project plan or design against defined standards, e.g. to determine eligibility for a certification standard, such as the Voluntary Carbon Standard (VCS) or the Climate, Community and Biodiversity Alliance (CCBA) standards.
Verification: Independent third-party assessment of the actual emissions reductions (in the case of VCS) or co-benefits (in the case of CCBA) achieved by a particular forest carbon project.
www.cifor.cgiar.org www.ForestsClimateChange.org
Center for International Forestry Research CIFOR advances human wellbeing, environmental conservation and equity by conducting research to inform policies and practices that a� ect forests in developing countries. CIFOR is one of 15 centres within the Consultative Group on International Agricultural Research (CGIAR). CIFOR’s headquarters are in Bogor, Indonesia. It also has o� ces in Asia, Africa and South America.

2A guide to learning about livelihood impacts of REDD+ projects: Worksheets
Worksheet 2 www.cifor.cgiar.org
Measuring welfare and well-being outcomes
Box 1. Household income in CIFOR’sGCS-REDD
CIFOR’s GCS-REDD is collecting data using a full household income accounting approach. These data on the complete income portfolio allow for identi� cation of the direct impact of REDD+ interventions on total income, as well as absolute and relative forest income (i.e. forest dependence). Seasonal variation in sources of income has been taken into account in the design of the household questionnaire, for example with variable recall periods. See Section 8 of the GCS-REDD technical guidelines and Section 3 of the GCS-REDD household questionnaire.
IntroductionWhat is the best way to measure welfare and well-being? This is as much a philosophical question as it is a practical and empirical one. To some, traditional measures of welfare seem most appropriate (i.e. income or consumption); for others, measures of happiness, health or ability to exercise rights are equally important. There are also debates over which indicators of well-being can feasibly be accurately measured. Competing conceptions of welfare and well-being have produced numerous tools and methods for measuring and tracking changes in the human condition. The various tools/methods can be grouped into 5 categories: (1) measuring income, either as value-added production to household fixed assets or as consumption, using definitions that are comparable across sites; (2) accounting of capital or assets, with indicators that may be subjective and locally defined; (3) measuring physical well-being (health and nutrition status); (4) measuring perceptions or well-being and change in well-being (e.g. happiness); and (5) using indicators of rights, livelihood security/vulnerability and opportunities. Each approach has its own strengths and weaknesses. Approaches that employ multiple methods can help to minimise weaknesses and provide a more holistic characterisation of well-being. Ideally, standardised quantitative measures (1 or 3) should be combined with a method that elicits people’s own perceptions of their well-being (2, 4 or 5). Several commonly used tools and methods for measuring welfare and well-being are reviewed in Annex B.
Measuring value added to household � xed assetsIn rural areas of developing countries, income is typically measured as ‘value added’ to household fixed assets, or the value of all production minus the value of purchased inputs (but not minus value of household labour, or value of natural capital such as land or forest). Income can be either invested/saved or used for consumption. Development economists often measure welfare using consumption data. Tracking people’s consumption may be easier than tracking income where there is a high degree of participation in subsistence activities (Sahn and Stifel 2002). Consumption smoothing (i.e. balancing out spending and savings to attain and maintain the highest possible living standard) means that there is less variability in consumption data than in income data. Further, it is
often easier and more comfortable for respondents to recall and report consumption—especially if cash expenditures form a large portion—than income.
Because REDD+ interventions are likely to affect access to forest resources, which in turn affects forest dependence, careful attention should be given to the best methods for capturing the impact of changes in forest access on the welfare of forest users. Due to the seasonal nature of consumption and sale of most forest products, and the common subsistence use (i.e. direct consumption) of many forest products, data on full annual income (subsistence and cash) and full consumption (subsistence and expenditures) provide the most holistic picture of rural livelihoods (Vedeld et al. 2004). The Household Questionnaire for GCS-REDD includes questions to elicit data for full income accounting (Box 1).
Advantages of measuring welfare in income and consumption terms include the detailed picture these present, which might be necessary for detecting variance in welfare distribution between subgroups (i.e. who gains and who loses). Further, because these metrics are standardised, they can be used to compare impacts across sites. The fact that they are standardised and objective and that they aim to provide a complete accounting of household welfare also means that these metrics should be able to capture unintended or unexpected effects of REDD+ projects, such as loss of certain income sources or overall welfare declines.
However, several challenges are associated with collecting data on annual household income or
Worksheet 2

54 | Pamela Jagger, Erin O. Sills, Kathleen Lawlor and William D. Sunderlin
2A guide to learning about livelihood impacts of REDD+ projects: Worksheets
Worksheet 2 www.cifor.cgiar.org
consumption over a long period of time, including memory lapses due to long recall periods (Cavendish 2002) (see Worksheet 6 for a discussion of methods that involve recall data to establish ‘before’ conditions). The recall period for accurately reporting the quantity of goods consumed or collected regularly may be as short as 48 hours (Wilkie personal communication). Another challenge is the sensitive nature of forest product harvesting; often a large share of forest products are illegally harvested, making respondents cautious about revealing too much information about forest income or consumption. Further, summing up the total value of income or consumption requires prices (value weights) for all products, which can be challenging for subsistence products that are consumed directly by the household. Finally, collecting and processing household income and consumption are very time consuming and require evaluators to have basic skills in aggregating and summarising quantitative data.
Asset-based approachesAsset ownership is frequently used to assess the welfare or poverty status of households in developing countries for several reasons. First, assets are not subject to short-term fluctuations of income and consumption, and therefore provide information on households’ structural income levels and underlying welfare (Cohen and Barnes 1996, Carter and May 2001, Filmer and Pritchett 2001). Second, they are more straightforward to measure than alternative indicators such as household income, agricultural profit or consumption expenditure (McKenzie 2005, Vu et al. 2010). Income and consumption data are time consuming to collect and are subject to considerable measurement error (Sahn and Stifel 2003). As well as its direct contribution to household well-being, asset ownership can provide an indication of the vulnerability of households (Moser 1998) and their ability to move out of poverty (Sahn and Stifel 2003). Ownership of productive assets determines the income-generation strategies available to households (Adato et al. 2006, Carter and Barrett 2006), whilst ownership of assets such as cattle allows consumption smoothing where credit markets are incomplete (Siegmund-Schultze et al. 2007). As a result, a household’s current circumstances can be closely related to its past wealth (Barrett et al. 2006). Another advantage is that asset portfolios that characterise the relatively wealthy and the relatively poor can be locally defined. For example, CIFOR’s GCS-REDD develops a village-specific scale of the values of materials used in home construction (see Section 4 of GCS-REDD
Technical Guidelines). Applying this concept even more broadly, the Basic Necessities Survey uses participatory methods to develop a list of assets that ‘everyone should be able to have and nobody should have to go without’ (Davies 1997). Basic necessities could include such assets as a bicycle, a quarter hectare of farmland, 3 meals per day or access to a school—the list is unique to each community. Standardisation of asset indices allows for cross-community comparisons.
There are limitations to using asset lists and metrics of well-being that are locally defined. For example, if an intervention raises people’s expectations about what every household should have or changes their conceptions about what constitutes a relatively poor household, this will complicate comparisons of the ‘before’ and ‘after’ periods. Even without the project intervention, changing technology and socio-economic conditions are likely to result in changes in the locally relevant assets. GCS-REDD seeks to avoid this problem by asking about a very extensive list of assets (see Section 2 of the Household Questionnaire). Further, asset-based measures might miss key sources of income and consumption critical to our understanding of the effect of REDD+ interventions on well-being, such as the relative importance of forest products to rural livelihoods. Finally, assets may change slowly, relative to income and consumption, and thus may not be a very sensitive measure of medium-term project impacts.
Approaches based on physical well-being Some approaches to assessing welfare emphasise the importance of physical well-being. Good health in itself may be viewed as a valid quality of life measure, and certain health measures are strong predictors of economic development (e.g. infant mortality and GDP are highly correlated). Many prominent welfare and well-being indices make use of health measures. For example, the United Nations Development Programme’s (UNDP) Human Development Index (HDI) considers health (along with literacy, school enrolment rates and per capita purchasing power parity GDP) by measuring life expectancy at birth. Similarly, the new Multidimensional Poverty Index (created by the UNDP in 2010 to better measure acute poverty in developing countries) considers child mortality and nutrition (i.e. presence of malnutrition in household) along with 8 other indicators of education and standard of living (Alkire and Santos 2010). Malnutrition can be assessed by collecting data for a variety of anthropometric measures including comparing a respondent’s body

A guide to learning about livelihood impacts of REDD+ projects | 552A guide to learning about livelihood impacts of REDD+ projects: Worksheets
Worksheet 2 www.cifor.cgiar.org
mass index (BMI) to the average for their height, or by measuring their mid-upper-arm circumference and comparing the data with the average circumference for people of similar heights. Both of these approaches can be combined with information on self-reported illness (as well as asset and income measures) to assess the well-being of local households.
Perceptions of well-being or happinessSurvey respondents can be asked directly for their own assessment of their households’ well-being. For example, 2 questions in the GCS-REDD household questionnaire are: ‘Has your household’s income over the past 2 years been sufficient to cover the needs of the household?’ and ‘Overall, what is the well-being of your household today compared with the situation 2 years ago?’ (see Section 4 of the GCS-REDD Household Questionnaire). Rural households can be asked directly about what constitutes well-being in their local context, and how their household or some group of households compares with those who are perceived to be better off or worse off. In this context, well-being is generally understood as the sum of many factors including endowments of financial, physical, social, human and natural capital as well as general psychological happiness. Data on objective measures of happiness such as the number of times a respondent smiles or laughs during an interview can also serve as an important indicator of overall well-being.
Approaches based on rights, livelihood security/vulnerability or opportunitiesAnother set of approaches to measuring well-being focuses on people’s ability to exercise rights, take advantage of opportunities or adapt to economic shocks (either covariate shocks that affect all households such as droughts or floods, or idiosyncratic shocks that affect a single household or some subset of households such as the death of a productive-aged household member). These approaches tend to rely heavily on qualitative and participatory methods and therefore yield rich information about how livelihoods and the forces that affect them are changing in a particular location. For example, the Basic Assessment for Human Well-being approach seeks to understand
whether ‘concerned stakeholders have acknowledged rights and means to manage forests cooperatively and equitably’ (Colfer et al. 1999). The emphasis on food security in some approaches (e.g. CARE 2002) may be particularly appropriate in the context of climate change and facilitate identification of vulnerabilities early in the project cycle to help improve design of interventions for both climate change mitigation (i.e. REDD+) and adaptation.
Including locally provisioned ecosystem services in your assessmentIntact forests provide critical ecosystem services to local communities by provisioning forest products and clean water, protecting against floods and storm surges and mitigating the spread of vector-borne disease. If these ecosystem services are important inputs to production, then they should be captured in income accounting; if they are important inputs directly to utility (spiritual values), then additional indicators will be required to capture changes in their availability and value. Locally provisioned ecosystem services may be important intermediate variables in the causal chain from a REDD+ project intervention to changes in welfare (i.e. the theory of change). To directly examine changes in the value of these ecosystem services, non-market valuation techniques from environmental economics can be used to convert these assets, services and subsistence ‘income’ into monetary values so they can be bundled and compared with other measures of income or consumption. Consideration of such natural services and assets in both the social reference scenario and project site measurements is likely to be critical to capturing the full benefits that REDD+ interventions provide to local populations.
Which welfare or well-being indicator/method to choose?This worksheet has reviewed several commonly used approaches for collecting data on changes in welfare and well-being. A summary of the strengths and weaknesses of various approaches is given in Table 1. Perhaps most important for understanding the welfare impacts of REDD+ interventions is the ability to measure changes in forest dependence over time, and to use measures that are likely to retain their relevance in both pre- and post-intervention periods.

56 | Pamela Jagger, Erin O. Sills, Kathleen Lawlor and William D. Sunderlin
2A guide to learning about livelihood impacts of REDD+ projects: Worksheets
Worksheet 2 www.cifor.cgiar.org
www.cifor.cgiar.org www.ForestsClimateChange.org
Center for International Forestry Research CIFOR advances human wellbeing, environmental conservation and equity by conducting research to inform policies and practices that a� ect forests in developing countries. CIFOR is one of 15 centres within the Consultative Group on International Agricultural Research (CGIAR). CIFOR’s headquarters are in Bogor, Indonesia. It also has o� ces in Asia, Africa and South America.
Table 1. Choosing a welfare or well-being indicator
Measuring value added to household � xed assets
Assets or capital Health Rights, opportunities and vulnerabilities
Provides direct measures of forest dependence
Yes Yes, if include forest harvesting equipment, participation in forest user groups etc.
No Yes
Good for measuring short-term changes
Yes Maybe Maybe Maybe
Can use locally de� ned measure
No (except for local prices or value weights for subsistence goods)
Yes Yes, taking into account regional context
Yes
Requires quantitative data collection
Yes Usually Yes No

3A guide to learning about livelihood impacts of REDD+ projects: Worksheets
Worksheet 3 www.cifor.cgiar.org
Experimental research design: randomisation
IntroductionOne problem that is often present when participation is voluntary and/or targeted to a group with particular characteristics is ‘selection bias’. Selection bias results in a ‘treatment’ group fundamentally different from the general population in terms of characteristics that could influence how they respond to the intervention. Selection bias therefore poses a challenge for robustly identifying the impacts of many public policy interventions (e.g. job training programmes, poverty reduction initiatives, payments for ecosystem services programmes), because these interventions are by definition targeted to certain groups (e.g. unemployed, poor, those living close to protected areas) or voluntary. Even in programmes that are not explicitly targeted, there may be selection bias. For example, national parks across the world tend to be established in remote areas far from roads and markets (Joppa and Pfaff 2009). Because remote areas tend to be under less deforestation threat and have poorer populations than areas closer to roads, selection bias complicates the identification of the impact of park establishment on forests and people.
In the natural and health sciences, volunteering to receive a treatment is generally not a problem, and other forms of selection bias are avoided by careful sample design. Medical researchers seek to control selection bias by randomised trials that assign volunteers to either the control or the treatment group. Because treatment is randomly assigned, the control and treatment groups should be similar in terms of the average and distribution of characteristics that may affect how they respond to the intervention. This eliminates selection bias, and effectively reduces the ability of these characteristics to confound identification of the treatment’s impact. Randomisation does a better job of eliminating selection bias than the quasi-experimental methods discussed in this guide (i.e. matching methods or BACI combined with matching), because it eliminates the effect of both observable (e.g. distance to roads) and unobservable (e.g. motivation) confounding variables. Matching methods, on the other hand, can only control the effect of observable characteristics. BACI plus matching can also control for unobservables that remain constant over time—but not any unobservable characteristics that affect selection and outcomes and that do change over time. With large sample sizes, rigorous implementation of the randomisation design allows impacts to be estimated directly from the differences between treatment and control groups. The estimation of impacts is more robust if studies have large sample sizes and limited or no attrition.
While the idea of randomly locating REDD+ interventions across a landscape may sound unfeasible or undesirable, this research strategy can be applied to a variety of methods and scales. Use of randomised impact evaluation methods in conservation is extremely rare and there are indeed many financial, political and practical challenges in its use (Ferraro 2009). However, many of these challenges also apply to
other sectors, and randomisation methods are increasingly used to understand the impacts of development interventions (for example, see the work of the Abdul Latif Jameel Poverty Action Lab). This worksheet provides an overview of the randomisation (or experimental) approach to impact evaluation and discusses practical issues regarding its use in and application to REDD+ interventions.
Randomised research designs can yield results that possess both strong internal and external validity. Internal validity is achieved when the effect of potentially confounding variables is controlled for, which ensures that observed outcomes are due to the intervention and not to some other factor or set of factors. External validity is achieved when it is ensured that the results are generalisable to the larger population of interest.
Implementing randomisationThe distinct advantages of the randomisation design (no selection bias and robust estimation of impacts) may be outweighed by some of the practical challenges to its implementation. A common concern is whether it is ethical to withhold the programme from those who could potentially benefit from it. Another critique relates to the problem of external validity or how generalisable the results are to the larger population of interest. Some question whether the results from randomised studies can tell us much about what the results would be like in the real world (Ravallion 2009). One problem is that some interventions, such as regional or national policy change, cannot effectively be randomised. A second problem is that the particular characteristics that affect how the population (or community, forest etc.) responds to the intervention have been cancelled out through the randomised design, yet in the real world, policymakers may target the policy according to those same characteristics. For example, learning about the average impact of REDD+ interventions on Indonesian forests, in general, may be of little policy relevance, because in the real world, we would expect REDD+ policy to target areas under high conversion threat (Box 1 describes this in further detail).
However, both of these concerns about randomisation (ethics and the policy relevance of results) can be addressed by using one of the following implementation strategies.
Phased rolloutInterventions are often rolled out in a phased manner because of logistical and resource constraints. This reality can facilitate evaluation, if the timing of implementation in different areas can be randomised. First, the entire area for a REDD+ intervention is defined. The intervention can be at any scale ranging from a group of villages in a fairly small area to a subnational administrative region. The REDD+ intervention is then implemented in randomly selected villages or landscapes in a staggered fashion. The key is that the first implementation sites are selected
Worksheet 3
2A guide to learning about livelihood impacts of REDD+ projects: Worksheets
Worksheet 2 www.cifor.cgiar.org
www.cifor.cgiar.org www.ForestsClimateChange.org
Center for International Forestry Research CIFOR advances human wellbeing, environmental conservation and equity by conducting research to inform policies and practices that a� ect forests in developing countries. CIFOR is one of 15 centres within the Consultative Group on International Agricultural Research (CGIAR). CIFOR’s headquarters are in Bogor, Indonesia. It also has o� ces in Asia, Africa and South America.
Table 1. Choosing a welfare or well-being indicator
Measuring value added to household � xed assets
Assets or capital Health Rights, opportunities and vulnerabilities
Provides direct measures of forest dependence
Yes Yes, if include forest harvesting equipment, participation in forest user groups etc.
No Yes
Good for measuring short-term changes
Yes Maybe Maybe Maybe
Can use locally de� ned measure
No (except for local prices or value weights for subsistence goods)
Yes Yes, taking into account regional context
Yes
Requires quantitative data collection
Yes Usually Yes No

58 | Pamela Jagger, Erin O. Sills, Kathleen Lawlor and William D. Sunderlin
3A guide to learning about livelihood impacts of REDD+ projects: Worksheets
Worksheet 3 www.cifor.cgiar.org
randomly, allowing those sites that are not initially involved in the REDD+ intervention to serve as controls. These sites then also receive REDD+ interventions at a later date. One important issue to consider is whether the later sites are aware that they will be eligible for the intervention in the future, as this expectation can change behaviour in advance (e.g. conserving forest in the hope of receiving REDD+ payments and other incentives).
The following is a 2-stage randomisation process (Khandker et al. 2010) using a phased rollout design.
Step 1 Define the characteristics of populations or geographical areas where you expect REDD+ projects to be targeted. This defines the general population to which you want to infer your results.
Step 2 Randomly select a subsample of sites from this general population. This is the first randomisation stage, which defines the sampling frame and ensures the results have external validity.
Step 3 Initially implement the REDD+ intervention across a random sample of the selected sites. From the sampling frame, also randomly select a sample of sites to initially serve as controls. This is the second randomisation stage, which ensures that the results have internal validity.
Step 4 Collect data from the project and control sites (ideally before and after project implementation).
Step 5 Analyse data using difference of means t-tests, difference-in-differences estimations or regression analysis.
Step 6 Identify lessons for improving design and implementation of future REDD+ projects.
Step 7 Roll out REDD+ intervention in the sites that initially served as controls.
OversubscriptionThis approach (Khandker et al. 2010) is similar to the phased rollout and also applies to cases where logistical or financial constraints mean that the project proponent cannot implement the project in all targeted sites, or cannot include all households that would like to volunteer (subscribe) for participation. In this method, the area or population that would be considered optimal for or volunteer for participation in REDD+ is first identified, and then a random sample of that group is selected for implementation. Those that cannot be funded serve as controls. Funding constraints frequently (if not always) limit the number of places that can receive conservation and development projects; the oversubscription method requires choosing which places or people will actually participate in the project through random sampling, rather than through political or other factors.
These 2 randomisation designs address concerns about the ethics of using control sites either by making sure that all sites eventually receive REDD+ interventions or by simply accepting the reality that funding often limits the number of sites that can receive interventions. These designs address concerns about external validity and the policy relevance of any findings by carefully defining in the beginning the characteristics of the general area/population where future REDD+ projects are expected to be located.
Box 1. Implementing randomisation design An example with REDD+ in Indonesia
REDD+ projects in Indonesia tend to be located in districts where there is higher conversion pressure (i.e. road density and population density), higher carbon density (peat), and higher conservation value (national park), after controlling for size of district and percent forest cover. This suggests that the external validity of evaluations of these projects would be limited to these types of districts. Another key factor in the decision of where to locate a REDD+ project is the proponent’s previous experience in the region, either directly or through a partners’ conservation activities (Cerbu et al. 2009). Such factors are hard to observe and therefore hard to account for in quasi-experimental approaches. In this context, introducing some randomisation into project location would greatly strengthen the validity of evaluation results. For example, a programme of funding for REDD+ could identify the set of eligible districts and then randomly select districts where REDD+ projects would be funded � rst. Clearly, this would be politically challenging—illustrating why experimental methods are rarely employed despite their power to credibly assess the true impacts of conservation projects.
www.cifor.cgiar.org www.ForestsClimateChange.org
Center for International Forestry Research CIFOR advances human wellbeing, environmental conservation and equity by conducting research to inform policies and practices that a� ect forests in developing countries. CIFOR is one of 15 centres within the Consultative Group on International Agricultural Research (CGIAR). CIFOR’s headquarters are in Bogor, Indonesia. It also has o� ces in Asia, Africa and South America.
4A guide to learning about livelihood impacts of REDD+ projects: Worksheets
Worksheet 4 www.cifor.cgiar.org
Before–After/Control–Intervention
IntroductionRandomisation is often considered the ‘gold standard’ for evaluating interventions. When it is not possible to randomly select control and treatment groups, the Before–After/Control–Intervention (BACI) design provides nearly as rigorous an approach to evaluating causality, as long as there are no time-varying confounders that cannot be measured. For the BACI approach, control sites must be selected before REDD+ project implementation, so that baseline data can be collected on treatment and control sites. By selecting control sites that are very similar to the REDD+ project sites, it can be expected that social outcomes (on average) would be very similar in both locations, were it not for the REDD+ project. Data on outcomes are collected again at the control and intervention sites after the project is underway; the difference between the changes observed at treatment and control sites is then used to calculate the average impact of the project. This type of analysis is known as ‘difference-in-difference’.
Implementation of the BACI research design does require overcoming some important challenges: first, good control sites may not exist, and second, there is often resistance to investing time and resources in identifying and collecting data from forest users at control sites. If control sites nearly identical to REDD+ intervention sites (with the exception of having the REDD+ intervention) can be identified, then a distinct advantage of BACI is the simple research design (compared with the more complicated propensity score matching or structural modelling approaches), allowing for straightforward and transparent analysis. In addition to estimating the direct impacts of a project, BACI can be used to assess leakages (or spillovers) through difference-in-difference comparisons of the project site, nearby sites thought to be subject to those leakages and control sites (cf. Miguel and Kremer 2002). Likewise, BACI can be used to compare alternative methods of implementing a project, by collecting data on and comparing subsamples of forest users who participate in those alternatives. Finally, to better understand the causal mechanism leading to the observed impacts estimated in a BACI study, BACI estimates can be compared with ex ante projections of impacts, which may be based on economic and land use theory and/or the perceptions of local forest users (Ravallion 2009, Khandker et al. 2010). This may help to explain how observed impacts are produced and to how to improve methods for ex ante projections (e.g. for validation of projects in the voluntary carbon market).
Implementing BACI
Step 1: Select control sitesIdeally, the evaluator should identify the factors that might affect both participation in the intervention and the outcome of interest (welfare). These are likely to include
biophysical, infrastructure, institutional, socio-economic and demographic characteristics. Data should be collected on a large number of potential control sites, and then the subset most similar to the treatment villages should be selected by ‘matching’ on these variables (see Worksheet 7). In practice, only limited secondary data may be available to select control sites before the project starts. It is important to remember that the reason for collecting data from control sites is to establish attribution—to rule out possible rival explanations for the observed outcomes at the project site so that the observed changes at the project site can be attributed to the intervention and not to some other factor. Evaluations without controls create reputational risks for projects by their potential to falsely attribute welfare declines to the REDD+ project when in fact they are caused by other factors not under the project’s control (Figure 1).
Step 2: Consider other potentially confounding variablesEven if control sites are selected based on matching with secondary data, there may still be systematic differences between populations and conditions at control and intervention sites in other important dimensions. Therefore, data on other potentially confounding variables, which were not available from secondary sources, should be collected as part of the study. These variables will typically include characteristics of the site (e.g. seasonality of access, measures of social capital) and of the forest users (age, gender and ethnicity of household heads; years of residence in the locality; measures of social capital). Matching on these additional confounding variables can be used to reduce or narrow down the sample size for the ‘after’ data collection, especially if there are time or budget constraints that limit the number of villages and households that can be included in the post-intervention data collection effort.
Step 3: Collect data before and after the REDD+ interventionCollecting data both before and after the REDD+ intervention and at both the control and the intervention sites is necessary because it is impossible to find 2 sites or 2 groups of people that are 100% identical in both their observable and their unobservable characteristics. Unobservable characteristics include attributes such as motivation, which clearly could affect both participation in the project and outcomes, but for which secondary data likely do not exist and which may not even be perceptible to the researcher. As long as these unobservable characteristics do not change over time (i.e. they are time invariant), then they will affect outcomes equally before and after the intervention. Thus the difference in outcomes over time can be compared across sites without being confounded by these unobserved characteristics. If possible, the same households should be surveyed during the ‘before’ and ‘after’ periods, creating a household level ‘panel’ dataset. Panel data contain observations for multiple
Worksheet 4

60 | Pamela Jagger, Erin O. Sills, Kathleen Lawlor and William D. Sunderlin
4A guide to learning about livelihood impacts of REDD+ projects: Worksheets
Worksheet 4 www.cifor.cgiar.org
variables observed over multiple time periods for the same unit of observation. However, if it is not possible to survey the same households in both time periods, another option is to draw a new random sample of villages or households in the second time period to create a pooled cross-sectional dataset (Wooldridge 2002).
AnalysisBACI data can be analysed using various difference-in-difference methods. The first step is often some form of matching to identify the subsample of controls that are most comparable to the treatment (see Worksheet 7). Matched samples can then be analysed using simple
difference of means tests or multivariate regression with covariates to control for differences in confounding variables. If it turns out there is selection bias (because you did not match the control and intervention sites on key variables or your matching did not work as planned), you can use a ‘non-equivalent comparison group design’ to control for systematic differences in control and intervention groups (Shadish et al. 2002). If you do not have panel data, you can employ a ‘conditional difference-in-difference’ method to control for systematic differences in the ‘before’ and ‘after’ groups. Jagger (2008) employs both of these methods to evaluate the impacts of Uganda’s decentralisation reform on forest-based income for different income groups.
www.cifor.cgiar.org www.ForestsClimateChange.org
Center for International Forestry Research CIFOR advances human wellbeing, environmental conservation and equity by conducting research to inform policies and practices that a� ect forests in developing countries. CIFOR is one of 15 centres within the Consultative Group on International Agricultural Research (CGIAR). CIFOR’s headquarters are in Bogor, Indonesia. It also has o� ces in Asia, Africa and South America.
Figure 1. Designing and implementing BACI (adapted from Jagger et al. 2009)
Step 4Disseminate
lessons learned
Step 1Identify indicators
Step 2Collect data
Step 3Analysis
Processes - Impacts
BACI Approach
Control
Intervention
Before AfterOutcome variables
Outcome variables
Outcome and process variables
Outcome and process variables
• Intervention to be evaluated• Observable process indicators• Specific outcomes of interest• Observable outcome indicators• Identity control group

5A guide to learning about livelihood impacts of REDD+ projects: Worksheets
Worksheet 5 www.cifor.cgiar.org
Modi� ed control–intervention and modi� ed before–after approaches
IntroductionWhen the randomisation and Before–After/Control–Intervention (BACI) approaches are not feasible, a matched Control–Intervention (CI) comparison or a Before–After (BA) comparison that considers a projected counterfactual are next-best research design options. This worksheet discusses the rationale behind these modified CI and BA approaches and how to implement these research designs.
Overcoming ‘counterfeit counterfactuals’: modi� ed CI and BA approaches Simply comparing post-project conditions with pre-project conditions or with the conditions at another site and then attributing any differences in observed outcomes to the project typically does a poor job of ruling out rival explanations for observed welfare outcomes. For this reason, simple before–after comparisons and with–without comparisons are often referred to as ‘counterfeit counterfactuals’. However, collecting data from just the project site at 2 points in time (as in BA) or from multiple sites but at just one point in time (as in CI) does have the advantage of being less resource intensive than BACI. Luckily, it is possible to improve the accuracy of these approaches by adding on a few key steps. We label these ‘modified’ CI and BA approaches to emphasise that they are not just simple comparisons of project outcomes to conditions before the project or in unmatched control areas. These modified approaches can be good options in the face of budget constraints or the reality that planning for rigorous impact evaluation may not begin until well after projects have started.
Modifying the CI research design so that the control and intervention sites are well matched can overcome some of the weaknesses of the typical CI approach. Matching control and intervention sites on observable characteristics that affect both participation in the intervention and the outcomes of interest can significantly improve the accuracy of the estimated impact. For example, Andam et al. (2008) evaluate the impact of Costa Rica’s protected areas on deforestation and find that if matching methods are not used, simple control–intervention comparisons overestimate the amount of deforestation prevented by the parks by as much as 65%. However, there still may be systematic and unobservable differences between even well-matched control and intervention sites that confound identification of impact. Guidance on matching methods is provided in Worksheet 7.
Some of the problems of a simple before–after comparison can be overcome by embracing counterfactual thinking and making an attempt to develop a rough estimate of what would have happened in the absence of the project. Such a modified approach could take the following steps.
Step 1 Collect data that describe the initial conditions at the project site.
Step 2 Use these ‘before’ data and other sources to estimate what would have happened in the absence of the project.
Step 3 Collect a second round of ‘after’ data.
Step 4 Compare the observed change between the ‘before’ and ‘after’ conditions with the change projected in Step 2.
In Step 2, the counterfactual can be estimated ex ante by extrapolating historical trends into the future or predicting future trends using statistical models or the perceptions of local experts—including local resource users. Note that this ex ante prediction approach is most akin to how deforestation/degradation counterfactuals (i.e. ‘reference levels’ or ‘baselines’) are established in REDD+. However, this approach may not be able to overcome the problem of the validity of the assumptions underlying the predicted counterfactual. If these assumptions are not accurate, then the approach will not work well—and testing these assumptions likely requires observational data from a control site or reference region. However, if the ex ante predictions are modified during the ‘after’ period using relevant secondary data on possible rival explanations for welfare changes (e.g. currency devaluations, droughts), then this may help to improve the accuracy of the without-project estimate. This is again similar to the approach taken with deforestation/degradation reference levels, which are supposed to be periodically ‘trued-up’ as models and carbon estimates improve.
The Climate, Community and Biodiversity Alliance (CCBA) is currently developing guidance for project proponents on measuring social impacts using a modified BA approach (Richards and Panfil 2010). Specifically, the approach involves prediction of a counterfactual ex ante, and collection of data ‘before’ and ‘after’ on a set of indicators that relate to the project’s causal model or theory of change. Box 1 describes this approach in further detail.
Worksheet 5
4A guide to learning about livelihood impacts of REDD+ projects: Worksheets
Worksheet 4 www.cifor.cgiar.org
variables observed over multiple time periods for the same unit of observation. However, if it is not possible to survey the same households in both time periods, another option is to draw a new random sample of villages or households in the second time period to create a pooled cross-sectional dataset (Wooldridge 2002).
AnalysisBACI data can be analysed using various difference-in-difference methods. The first step is often some form of matching to identify the subsample of controls that are most comparable to the treatment (see Worksheet 7). Matched samples can then be analysed using simple
difference of means tests or multivariate regression with covariates to control for differences in confounding variables. If it turns out there is selection bias (because you did not match the control and intervention sites on key variables or your matching did not work as planned), you can use a ‘non-equivalent comparison group design’ to control for systematic differences in control and intervention groups (Shadish et al. 2002). If you do not have panel data, you can employ a ‘conditional difference-in-difference’ method to control for systematic differences in the ‘before’ and ‘after’ groups. Jagger (2008) employs both of these methods to evaluate the impacts of Uganda’s decentralisation reform on forest-based income for different income groups.
www.cifor.cgiar.org www.ForestsClimateChange.org
Center for International Forestry Research CIFOR advances human wellbeing, environmental conservation and equity by conducting research to inform policies and practices that a� ect forests in developing countries. CIFOR is one of 15 centres within the Consultative Group on International Agricultural Research (CGIAR). CIFOR’s headquarters are in Bogor, Indonesia. It also has o� ces in Asia, Africa and South America.
Figure 1. Designing and implementing BACI (adapted from Jagger et al. 2009)
Step 4Disseminate
lessons learned
Step 1Identify indicators
Step 2Collect data
Step 3Analysis
Processes - Impacts
BACI Approach
Control
Intervention
Before AfterOutcome variables
Outcome variables
Outcome and process variables
Outcome and process variables
• Intervention to be evaluated• Observable process indicators• Specific outcomes of interest• Observable outcome indicators• Identity control group

62 | Pamela Jagger, Erin O. Sills, Kathleen Lawlor and William D. Sunderlin 5A guide to learning about livelihood impacts of REDD+ projects: Worksheets
Worksheet 5 www.cifor.cgiar.org
www.cifor.cgiar.org www.ForestsClimateChange.org
Center for International Forestry Research CIFOR advances human wellbeing, environmental conservation and equity by conducting research to inform policies and practices that a� ect forests in developing countries. CIFOR is one of 15 centres within the Consultative Group on International Agricultural Research (CGIAR). CIFOR’s headquarters are in Bogor, Indonesia. It also has o� ces in Asia, Africa and South America.
Box 1. Social impact assessment for the Climate, Community and Biodiversity Standards
The standards of the Climate, Community and Biodiversity Alliance (CCBA) require that forest carbon projects demonstrate net positive social impacts for local communities. To achieve this, projects are required to (1) describe the socio-economic conditions of the community at project start; (2) estimate a socio-economic ‘without project’ scenario; (3) explain how the project is expected to improve socio-economic conditions; (4) establish a social impacts monitoring system; and (5) estimate the socio-economic conditions after the project. Until recently, the CCBA had not provided specific guidance to project developers on how to implement these 5 steps and provide evidence of net positive social impacts attributable to the project at project validation. To fill this gap, the CCBA and partners recently developed the Manual for Social Impact Assessment of Land-Based Carbon Projects (henceforth, ‘the Manual’). The first version of the Manual (Richards and Panfil 2010) is currently being tested at field sites with a revised version expected in 2011.
The Manual suggests methods for demonstrating compliance with the CCB standards, whilst noting that a wide variety of methods could be used to meet the requirements. Striking a balance between monitoring and evaluation costs on the one hand and rigorous demonstration of attribution on the other is clearly critical for keeping the CCB standards accessible and widely used, and the Manual points to methods compatible with maintaining this balance. The Manual emphasises the importance of developing a good theory of change (why a project could have both positive and negative impacts) and then focusing data collection efforts on key links in this causal chain as a way to achieve cost-effective social impact assessment. The Manual recognises development of a ‘without project’ social reference scenario as key to establishing attribution, and generally recommends participatory methods that ask stakeholders to predict what social conditions would be like without the project.

6A guide to learning about livelihood impacts of REDD+ projects: Worksheets
Worksheet 6 www.cifor.cgiar.org
Reconstructing ‘before’ with retrospective data
IntroductionEvaluations are often initiated well after the start of a project, making it challenging to assess and attribute change. New REDD+ projects are likely to collect some form of baseline information to satisfy certification requirements and should design and archive such data to provide a baseline for later evaluations. However, REDD+ project proponents may still find themselves engaged in ex post evaluation of previous forest conservation efforts that have tested potential strategies for reducing deforestation and degradation.
When evaluating a project without baseline data, the basic decision to be made about research design is whether to collect data on control sites or households (henceforth called ‘units’) not affected by the project. When data on controls are collected (the control–intervention research design), matching is often employed to select and weight a sample of those controls to compare to the intervention units affected by the project. As described in Worksheet 7, intervention and control units should be matched on factors that drive both participation in the project and the outcomes of interest, but that are not influenced by the project. These may be fixed, permanent characteristics (such as the average slope of land in a community area, or the ethnic origin of household heads) or predetermined characteristics (such as forest cover in the community, or wealth of the household before the project). Predetermined characteristics must be somehow reconstructed.
If collecting data on control units is not feasible, due either to budgetary constraints or to lack of comparable units, then the final research design available is what we call ‘retrospective’. This involves collecting data only ‘after’ and only in the ‘intervention’ site and establishing attribution to the project through retrospective data on outcomes (pre-project levels or changes since the project began) or asking respondents directly about perceived impacts of the project (cf. ‘reflexive comparison’ method of attribution in Schreckenberg et al. 2010).
Sources of retrospective data can be broadly characterised as remote sensing, government statistics or direct elicitation in research instruments. Each of these approaches presents different challenges in terms of scale or unit of analysis (e.g. government statistics may not be available at the community or household level) and the outcome indicator (e.g. recall of income or consumption is typically more difficult than recall of discrete assets). One common methodological question that applies regardless of source is the relevant time frame: when is ‘before’?
Time periodIdeally, retrospective data—for matching or estimating impacts—should represent the time period immediately before the project was announced or started influencing
behaviour. Employing data from after the project start to establish the baseline is likely to underestimate the effects of the project (in the retrospective method) and could bias selection of controls (in the control–intervention method). On the other hand, employing data from long before the start of the project will also make estimates less precise—but not introduce additional bias. As discussed below, another consideration in choosing the time period for eliciting retrospective data is that major events (e.g. drought, election) can improve accuracy of recall.
With remote sensing or government data, data from 2 points in time before the project along with a third observation after the project can be very useful. In the retrospective design, this allows examination of whether the project changed the trend lines of outcomes. In the control–intervention design, the validity of the comparison group can be assessed by testing whether there are significant differences in the historical outcome across the intervention and control groups (essentially a falsification test, because current outcomes should not be affected by future assignment to treatment).
Secondary or remote sensing dataRemote sensing and secondary data are commonly used to determine the level of outcome variables ‘before’ a project, either for direct comparison with outcomes after the project or for matching to select and weight the best comparison group. For example, Andam et al. (2010), Joppa and Pfaff (2009), Nelson and Chomitz (2009) and Soares-Filho et al. (2010) use historical remote sensing and secondary data to assess the impacts of protected areas on forest cover.
The use of secondary data to evaluate REDD+ projects is likely to be constrained by a mismatch of scales or units, e.g. the communities considered by the project may not nest neatly in the census tracts or other administrative units used by government agencies. The use of remote sensing is also circumscribed by scale, as well as by cost (of acquiring and processing), time period (relative to when remote sensing images have been archived) and cloud cover. Another important consideration is that obtaining images from the same sensor classified using the same method for both ‘before’ and ‘after’ can greatly improve the quality of the analysis.
Household questionnaire recall Asking households to recall their asset ownership, land use or other economic activities in an earlier time period is common practice in studies of farm and household dynamics in rural areas of developing countries (e.g. Mertens et al. 2000, Takasaki et al. 2000, Walker et al. 2000, McCracken et al. 2002, Moran et al. 2003). Such retrospective or recall data have been used to assess the impact of financial crisis (Sunderlin et al. 2001), policy reform (Pradhan and Rawlings 2002, Uchida et al. 2009), protected
Worksheet 6
5A guide to learning about livelihood impacts of REDD+ projects: Worksheets
Worksheet 5 www.cifor.cgiar.org
www.cifor.cgiar.org www.ForestsClimateChange.org
Center for International Forestry Research CIFOR advances human wellbeing, environmental conservation and equity by conducting research to inform policies and practices that a� ect forests in developing countries. CIFOR is one of 15 centres within the Consultative Group on International Agricultural Research (CGIAR). CIFOR’s headquarters are in Bogor, Indonesia. It also has o� ces in Asia, Africa and South America.
Box 1. Social impact assessment for the Climate, Community and Biodiversity Standards
The standards of the Climate, Community and Biodiversity Alliance (CCBA) require that forest carbon projects demonstrate net positive social impacts for local communities. To achieve this, projects are required to (1) describe the socio-economic conditions of the community at project start; (2) estimate a socio-economic ‘without project’ scenario; (3) explain how the project is expected to improve socio-economic conditions; (4) establish a social impacts monitoring system; and (5) estimate the socio-economic conditions after the project. Until recently, the CCBA had not provided specific guidance to project developers on how to implement these 5 steps and provide evidence of net positive social impacts attributable to the project at project validation. To fill this gap, the CCBA and partners recently developed the Manual for Social Impact Assessment of Land-Based Carbon Projects (henceforth, ‘the Manual’). The first version of the Manual (Richards and Panfil 2010) is currently being tested at field sites with a revised version expected in 2011.
The Manual suggests methods for demonstrating compliance with the CCB standards, whilst noting that a wide variety of methods could be used to meet the requirements. Striking a balance between monitoring and evaluation costs on the one hand and rigorous demonstration of attribution on the other is clearly critical for keeping the CCB standards accessible and widely used, and the Manual points to methods compatible with maintaining this balance. The Manual emphasises the importance of developing a good theory of change (why a project could have both positive and negative impacts) and then focusing data collection efforts on key links in this causal chain as a way to achieve cost-effective social impact assessment. The Manual recognises development of a ‘without project’ social reference scenario as key to establishing attribution, and generally recommends participatory methods that ask stakeholders to predict what social conditions would be like without the project.

64 | Pamela Jagger, Erin O. Sills, Kathleen Lawlor and William D. Sunderlin 6A guide to learning about livelihood impacts of REDD+ projects: Worksheets
Worksheet 6 www.cifor.cgiar.org
www.cifor.cgiar.org www.ForestsClimateChange.org
Center for International Forestry Research CIFOR advances human wellbeing, environmental conservation and equity by conducting research to inform policies and practices that a� ect forests in developing countries. CIFOR is one of 15 centres within the Consultative Group on International Agricultural Research (CGIAR). CIFOR’s headquarters are in Bogor, Indonesia. It also has o� ces in Asia, Africa and South America.
areas (Schreckenberg et al. 2010) and household-specific events such as migration (Zhao 2003, Boucher et al. 2005). However, despite their common use, ‘best practices’ and the accuracy of recall data have rarely been assessed in the context of household questionnaires in developing regions. Exceptions include Beckett et al. (2001) on female marital and fertility history in Malaysia, and Glewwe et al. (2004) on the impact of school inputs on test scores in Kenya.
In household questionnaires, it is common practice to remind respondents of the desired time period by referring to some event (natural disaster, election, World Cup etc.) not directly related to the project being assessed. However, research suggests that different individuals use different types of information to organise memory. Thus, it is not clear what type of event or other reminder is most likely to provide an effective cue (Sudman et al. 1995). Nor is it clear that shorter recall periods necessarily lead to more accurate recall. Sudman and Bradburn (1973) report that respondents are more likely to overstate items or events when the recall period is short, and more likely to forget items or events when the recall period is long. Mathiowetz and Duncan (1988) find that the length of the recall period is less important than the importance of the event (length of unemployment in their case).
The factor that has been most consistently found to affect recall is the size or salience of the event or item being recalled. For example, lower value and more common assets (Mullan et al. 2010), less expensive repairs (Neter and Waksberg 1964) and minor illnesses (Bernard et al. 1985) are more likely to be forgotten. In a comparison of 9-year panel vs. recall data on assets, Mullan et al. (2010) find that poorer
households are more likely to accurately remember their previous asset ownership, perhaps because the same assets are more important to poorer households.
Mullan et al. (2010) also find that interviewing more than 1 person in the household results in fewer assets being forgotten, but increased the number of assets that respondents incorrectly remembered (that is, reported owning 9 years earlier whilst contemporary data from that wave of the panel suggest that they did not own). The researchers thus conclude that whilst retrospective data provide an approximate measure of prior household wealth, there is significant noise in the data, especially for lower valued assets and wealthier households.
Other methodsRetrospective data are also collected through group and/or participatory research instruments. These can have the advantage of providing built-in triangulation across group members to improve accuracy. Schreckenberg et al. (2010) describe 2 such methods, called ‘Most significant change’ and ‘Quantitative participatory assessment’. A third approach that employs group recall is ‘participatory poverty assessment’, which includes focus group discussions to generate community histories or timelines and time trend analysis by matrix scoring (McGee 2000). This allows cross-checking across people and variable time periods defined by the respondent. Whilst this may result in greater accuracy, it is less suitable for comparing change in outcomes across respondents, or for matching participants and non-participants in the project.

7A guide to learning about livelihood impacts of REDD+ projects: Worksheets
Worksheet 7 www.cifor.cgiar.org
Matching intervention and control sites/households
IntroductionTo compare welfare and land use outcomes at intervention and control sites and reach robust conclusions about whether any difference between them can be attributed to the intervention and not to some other factor or set of factors, control and intervention sites must be as similar as possible. Otherwise, selection bias will confound interpretation of impact. Matching sites on characteristics that might affect both placement/participation in the intervention (e.g. distance to roads or social capital) and the outcome of interest (e.g. welfare) is an effective strategy for minimising the problem of selection bias. Controlling for selection bias may be particularly important for performance-based interventions, such as REDD+, since sites selected for REDD+ projects precisely because they are perceived as different are more likely to succeed than other potential sites. Furthermore, within REDD+ projects, the probability of a household volunteering to participate (e.g. in a payment for ecosystem services (PES) scheme) is also likely to be partly determined by household characteristics that influence land use and welfare outcomes. This worksheet reviews the various types of matching and how to implement these methods. Throughout, we refer to matching ‘sites’, but matching can be done at any level of analysis including villages or households.
When to matchSites can be matched both before and after in-depth field research (e.g. household questionnaires). Under ideal conditions, both pre- and post-matching is done (see Figure 1). This involves (1) selecting control sites on the basis of how well they match intervention sites on key characteristics (pre-matching); (2) conducting research at the control and intervention sites before the start of the intervention; (3) refining the matching based on data collected during the field research (post-matching); and (4) conducting research at the control and intervention sites after the intervention has begun. In some cases, ample data may be available prior to the field research, in which case only pre-matching may be necessary. In other cases, only post-matching
may be done. Box 1 describes a more typical case where limited information at the village level is available prior to field research.
Types of matchingMatching typically refers to the statistical methods of covariate matching and propensity score matching. These methods can be implemented during either pre- or post-matching, provided data requirements can be met at that stage. For pre-matching small samples, this statistical process may be approximated by ‘hand-matching’. Regardless of the method, the objective is to select samples of intervention and control units that have similar distributions of characteristics (i.e. that are balanced).
Hand-matching Hand-matching is the simplest (and least precise) type of matching. In this method, units are matched intuitively, either by considering their overall character (holistically) or based on matching variables selected through informed judgement and often measured only approximately. The key is that these matching variables, or the overall character of the units, are relevant to both placement/participation in the intervention and the outcomes of interest. In its most basic form, hand-matching could simply involve asking people at the intervention sites which villages are most similar to their own. Hand-matching could also be informed by a review of the literature and available secondary data on matching variables (e.g. population density, distance to roads, agroecological potential). Whilst this approach is similar to other forms of matching in principle, it runs the risk of being influenced by researcher bias.
Propensity score and covariate matchingCovariate matching can be thought of as the statistical equivalent of hand-matching. Covariate matching involves matching control and intervention units on the ‘distance’ between those variables that might affect the outcome(s) of interest and thus be confounding (covariates). There are several metrics for measuring and minimising that distance. Propensity score matching (PSM) is perhaps the most commonly used method for impact evaluations. The propensity score is determined using a statistical model that calculates the probability of receiving the intervention (e.g. REDD+), based on observable characteristics. Each unit (be it forest site, village or household) is assigned its own propensity score. The distributions of both the control units’ propensity scores and the intervention units’ propensity scores are then plotted to identify the area of overlap (known as the ‘common support’). Matching may be restricted to this area of common support. For example, each intervention unit may be matched to the control unit with the closest propensity score, known as its nearest neighbour. This can be done with or without replacement, and with or without a ‘calliper’ that sets the maximum allowed distance between the neighbours. There are also a variety of other methods that statistically construct control units for each intervention unit (or at least each intervention unit in the common support).
PSM typically requires a large pool of potential control units, as well as data on many factors that might affect both placement/participation in the intervention and the outcome(s) of interest. The goal is to identify a subset of those control and intervention units that look the same in terms of all of the factors. There are various metrics for judging balance. The most basic approach is to examine histograms and density plots of the propensity Figure 1. Schedule for data collection and matching
BEFORE
Collect data
Pre-match
Collect data
Post-match
Test
AFTER
Worksheet 76A guide to learning about livelihood impacts of REDD+ projects: Worksheets
Worksheet 6 www.cifor.cgiar.org
www.cifor.cgiar.org www.ForestsClimateChange.org
Center for International Forestry Research CIFOR advances human wellbeing, environmental conservation and equity by conducting research to inform policies and practices that a� ect forests in developing countries. CIFOR is one of 15 centres within the Consultative Group on International Agricultural Research (CGIAR). CIFOR’s headquarters are in Bogor, Indonesia. It also has o� ces in Asia, Africa and South America.
areas (Schreckenberg et al. 2010) and household-specific events such as migration (Zhao 2003, Boucher et al. 2005). However, despite their common use, ‘best practices’ and the accuracy of recall data have rarely been assessed in the context of household questionnaires in developing regions. Exceptions include Beckett et al. (2001) on female marital and fertility history in Malaysia, and Glewwe et al. (2004) on the impact of school inputs on test scores in Kenya.
In household questionnaires, it is common practice to remind respondents of the desired time period by referring to some event (natural disaster, election, World Cup etc.) not directly related to the project being assessed. However, research suggests that different individuals use different types of information to organise memory. Thus, it is not clear what type of event or other reminder is most likely to provide an effective cue (Sudman et al. 1995). Nor is it clear that shorter recall periods necessarily lead to more accurate recall. Sudman and Bradburn (1973) report that respondents are more likely to overstate items or events when the recall period is short, and more likely to forget items or events when the recall period is long. Mathiowetz and Duncan (1988) find that the length of the recall period is less important than the importance of the event (length of unemployment in their case).
The factor that has been most consistently found to affect recall is the size or salience of the event or item being recalled. For example, lower value and more common assets (Mullan et al. 2010), less expensive repairs (Neter and Waksberg 1964) and minor illnesses (Bernard et al. 1985) are more likely to be forgotten. In a comparison of 9-year panel vs. recall data on assets, Mullan et al. (2010) find that poorer
households are more likely to accurately remember their previous asset ownership, perhaps because the same assets are more important to poorer households.
Mullan et al. (2010) also find that interviewing more than 1 person in the household results in fewer assets being forgotten, but increased the number of assets that respondents incorrectly remembered (that is, reported owning 9 years earlier whilst contemporary data from that wave of the panel suggest that they did not own). The researchers thus conclude that whilst retrospective data provide an approximate measure of prior household wealth, there is significant noise in the data, especially for lower valued assets and wealthier households.
Other methodsRetrospective data are also collected through group and/or participatory research instruments. These can have the advantage of providing built-in triangulation across group members to improve accuracy. Schreckenberg et al. (2010) describe 2 such methods, called ‘Most significant change’ and ‘Quantitative participatory assessment’. A third approach that employs group recall is ‘participatory poverty assessment’, which includes focus group discussions to generate community histories or timelines and time trend analysis by matrix scoring (McGee 2000). This allows cross-checking across people and variable time periods defined by the respondent. Whilst this may result in greater accuracy, it is less suitable for comparing change in outcomes across respondents, or for matching participants and non-participants in the project.

66 | Pamela Jagger, Erin O. Sills, Kathleen Lawlor and William D. Sunderlin
7A guide to learning about livelihood impacts of REDD+ projects: Worksheets
Worksheet 7 www.cifor.cgiar.org
www.cifor.cgiar.org www.ForestsClimateChange.org
Center for International Forestry Research CIFOR advances human wellbeing, environmental conservation and equity by conducting research to inform policies and practices that a� ect forests in developing countries. CIFOR is one of 15 centres within the Consultative Group on International Agricultural Research (CGIAR). CIFOR’s headquarters are in Bogor, Indonesia. It also has o� ces in Asia, Africa and South America.
scores. This should be done first for the full (unmatched) samples. The results of this examination might show that some of the intervention units have very little overlap with the control units; that is, some of the intervention units are so unique that adequate controls cannot be found. This is an important reality to confront. The characteristics of units that end up being excluded from the analysis should be considered in the interpretation of results.
Analysis and caveatsMatching is a way to define a sample of villages and/or households. This includes defining both which intervention and control units to include (the common support) and the weights to apply to each control unit. After matching, any variety of methods can be employed to assess impact. The matching routines in most statistical programmes calculate the difference in mean outcomes attributed to the project (e.g. the ‘average treatment effect on treated’, or ATT). This estimated impact can be bias-adjusted using regression methods, or multivariate regression models can be estimated using the matched sample. Matching in combination with regression is widely considered a robust way to estimate causal impacts.
When the key factors determining REDD+ placement/participation and the outcomes of interest are all observable (known and quantified to the researcher), matching works well to net out the effects of these potentially confounding variables. However, if there are also unobservable characteristics (that the researcher does not know about or cannot easily quantify) affecting REDD+ placement/participation and the outcomes, this may pose risks to the validity of the results obtained through matching. Motivation or presence of a dynamic community leader, for example, may be important unobservable characteristics. This concern can be partly alleviated if data on outcomes are available from both before and after the intervention.
SpilloversThe problem of spillovers (i.e. leakage) merits a final point of discussion. Leakage is a well-understood problem in the context of deforestation and forest degradation. REDD+ projects must demonstrate that reducing deforestation and degradation in the project site did not lead to leakage (i.e. deforestation or forest degradation displaced to areas outside the project area). There can be welfare leakage in addition to forest loss leakage from the REDD+ site to other areas. For example, timber jobs lost at the REDD+ site could move to another area (along with the degradation). This of course means that there is some risk that REDD+ will also affect the matched control sites. On the one hand, this could complicate interpretation of any comparisons between control and intervention sites. On the other hand, identifying both welfare and forest loss spillovers is an important piece of the story and is therefore desirable to capture. Project proponents will have identified a leakage belt for deforestation and forest degradation, i.e. some area that buffers the project site where leakage is expected to occur. Similar consideration should be given to identifying a welfare leakage belt. If possible, the area outside the leakage belt should provide the controls, but data should also be collected on sites from within the leakage belt in order to assess spillovers and leakages.
Statistical resources• STATA command for matching: ‘pscore.ado’; see Khandker et al.
(2010) for specifics
• R code for matching: see http://sekhon.berkeley.edu/matching/
Box 1. Pre-matching for sample selection in CIFOR’s GCS-REDD
At each REDD+ project site that is part of CIFOR’s GCS-REDD, household and village surveys are conducted at 4 intervention villages and 4 control villages. These villages are selected based on an early appraisal of key village characteristics and a statistical matching exercise. The appraisal and matching focus on characteristics that are expected to affect both the intervention villages’ participation in the REDD+ project and the outcomes of interest (human welfare and forest loss). Specific steps are as follows.
1. Identify up to 16 candidate intervention villages. In projects that cover a large region, identify the set of villages where direct project interventions are planned and where recent deforestation rates are average or higher than average for the project region.
2. Identify up to 16 candidate control villages, close enough to face broadly similar biophysical and market conditions, but far enough away that they are not expected to be affected by direct spillovers or leakages from the project.
3. Collect data on 22 key characteristics that are considered likely to influence both project placement and land use and welfare outcomes, based on secondary data, key informants and visits to the villages. The characteristics that ended up being most influential in matching were: (1) deforestation pressures; (2) presence of NGO; (3) forest tenure; (4) number of village organisations; (5) population; (6) village forest cover; (7) forest dependence; and (8) distance to main road.
4. Match treatment and control villages using covariate matching (based on Mahalanobis distance metric) applied to all project sites in a given country and all characteristics with complete data and variation across projects.
The GCS-REDD opted for matching at the country level, identifying the best set of treatment and control villages, rather than one-to-one matching of villages at the project level. This approach both increases the sample size for matching and ensures that even if a village is lost from the study (i.e. is no longer an intervention/control), the whole pair is not lost from the sample.

8A guide to learning about livelihood impacts of REDD+ projects: Worksheets
Worksheet 8 www.cifor.cgiar.org
Mapping the causal pathway from intervention to outcome
IntroductionUnderstanding the causal pathway between REDD+ interventions and outcomes requires mapping out a project’s causal chain or ‘theory of change’. There are several steps in this process, including: understanding context; characterising REDD+ interventions and their implementation; developing testable hypotheses; identifying data needs; and testing hypotheses. The results of hypothesis testing should inform a reassessment of data needs and the initial assumptions about site conditions and implementation. Maps of causal chains are more robust if they are based upon both scientific literature and data collected from multiple sources at multiple time intervals. We emphasise that participatory methods and key informant interviews can be tremendously helpful for tracking implementation when finer-scale data collection efforts are a challenge.
Working example: REDD+ intervention in 5 villages adjacent to a protected area in UgandaThis worksheet provides guidance for developing a map of the causal pathway(s) that link REDD+ interventions to observed social welfare outcomes. We use a hypothetical example to illustrate this process. Through this example we demonstrate the range of social, economic, institutional and biophysical factors that should be investigated to develop an accurate map of the causal pathway between intervention and social welfare outcomes. The information required to undertake this task can be obtained from project reports, grey literature and key informants, and by collecting primary data at the REDD+ project site.
Step 1: Understanding the context of the project siteLocal drivers of deforestation and degradation in the area are, respectively, slash and burn for small-scale agriculture and illegal logging of high-value tropical hardwoods by artisanal pit-saw loggers. There are no large or commercial landholders in the area that affect land use change. There is a community forest in each village and the villages are immediately adjacent to a national park managed for tourism and biodiversity. Since the national park was
established, it has had a history of encroachment and degradation, particularly in buffer zones around the perimeter of the park. To harvest anything from within the park requires permission from the Uganda Wildlife Authority, and harvesting for commercial sale is not permitted under any circumstances. Land tenure is customary; landowners have relatively strong tenure security over agricultural land. There are no de jure rights to trees or carbon articulated by Ugandan law. Informal rights are determined by customary law, frequently with overlapping claims on resources. There is minimal monitoring and enforcement of forest use due to limited resources of the government agencies and conservation organisations operating in the area. Smallholders derive most of their livelihoods from agriculture, as well as rearing small livestock and harvesting products from the forest for both home use and sale. Tourism provides revenue to villages through a parish-level benefit-sharing scheme. There is a significant influx of migrants from Rwanda and the Democratic Republic of the Congo due to conflict and limited economic opportunity in those regions. There are relatively high numbers of female-headed and landless households in the community. There is one defunct collaborative management group in one of the intervention villages. Population density is very high (>250 persons per square kilometre); market access is poor; and agricultural potential is limited due to soil degradation and steep slopes in the region.
Step 2: Characterising the interventionThe REDD+ proponent is an international conservation NGO that has been operating in the region for more than 10 years. The proponent has been collecting data on biodiversity and deforestation, and has trained several community members to participate in monitoring and enforcement of the park boundary, though the degree to which they are reporting illegal activity is questionable. The REDD+ intervention, which is funded by a 5-year grant from a bilateral donor, has 3 focal activities designed to reduce deforestation in the project site: Activity A, tree planting to demarcate the park boundary that incorporates the taungya system (i.e. landowners living adjacent to the park are allowed to cultivate crops within a buffer zone on either side of the boundary in exchange for maintaining the trees and monitoring
Worksheet 8
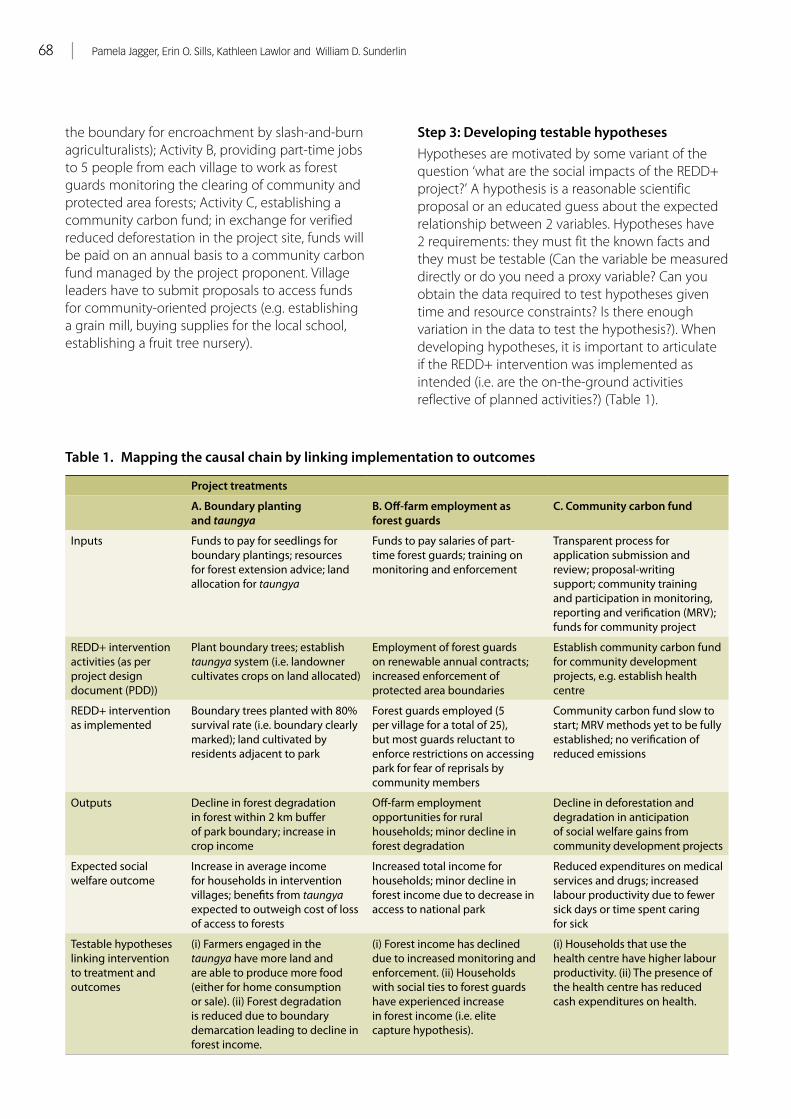
68 | Pamela Jagger, Erin O. Sills, Kathleen Lawlor and William D. Sunderlin
8A guide to learning about livelihood impacts of REDD+ projects: Worksheets
Worksheet 8 www.cifor.cgiar.org
the boundary for encroachment by slash-and-burn agriculturalists); Activity B, providing part-time jobs to 5 people from each village to work as forest guards monitoring the clearing of community and protected area forests; Activity C, establishing a community carbon fund; in exchange for verified reduced deforestation in the project site, funds will be paid on an annual basis to a community carbon fund managed by the project proponent. Village leaders have to submit proposals to access funds for community-oriented projects (e.g. establishing a grain mill, buying supplies for the local school, establishing a fruit tree nursery).
Step 3: Developing testable hypothesesHypotheses are motivated by some variant of the question ‘what are the social impacts of the REDD+ project?’ A hypothesis is a reasonable scientific proposal or an educated guess about the expected relationship between 2 variables. Hypotheses have 2 requirements: they must fit the known facts and they must be testable (Can the variable be measured directly or do you need a proxy variable? Can you obtain the data required to test hypotheses given time and resource constraints? Is there enough variation in the data to test the hypothesis?). When developing hypotheses, it is important to articulate if the REDD+ intervention was implemented as intended (i.e. are the on-the-ground activities reflective of planned activities?) (Table 1).
Table 1. Mapping the causal chain by linking implementation to outcomes
Project treatments
A. Boundary planting and taungya
B. O� -farm employment as forest guards
C. Community carbon fund
Inputs Funds to pay for seedlings for boundary plantings; resources for forest extension advice; land allocation for taungya
Funds to pay salaries of part-time forest guards; training on monitoring and enforcement
Transparent process for application submission and review; proposal-writing support; community training and participation in monitoring, reporting and veri� cation (MRV); funds for community project
REDD+ intervention activities (as per project design document (PDD))
Plant boundary trees; establish taungya system (i.e. landowner cultivates crops on land allocated)
Employment of forest guards on renewable annual contracts; increased enforcement of protected area boundaries
Establish community carbon fund for community development projects, e.g. establish health centre
REDD+ intervention as implemented
Boundary trees planted with 80% survival rate (i.e. boundary clearly marked); land cultivated by residents adjacent to park
Forest guards employed (5 per village for a total of 25), but most guards reluctant to enforce restrictions on accessing park for fear of reprisals by community members
Community carbon fund slow to start; MRV methods yet to be fully established; no veri� cation of reduced emissions
Outputs Decline in forest degradation in forest within 2 km bu� er of park boundary; increase in crop income
O� -farm employment opportunities for rural households; minor decline in forest degradation
Decline in deforestation and degradation in anticipation of social welfare gains from community development projects
Expected social welfare outcome
Increase in average income for households in intervention villages; bene� ts from taungya expected to outweigh cost of loss of access to forests
Increased total income for households; minor decline in forest income due to decrease in access to national park
Reduced expenditures on medical services and drugs; increased labour productivity due to fewer sick days or time spent caring for sick
Testable hypotheses linking intervention to treatment and outcomes
(i) Farmers engaged in the taungya have more land and are able to produce more food (either for home consumption or sale). (ii) Forest degradation is reduced due to boundary demarcation leading to decline in forest income.
(i) Forest income has declined due to increased monitoring and enforcement. (ii) Households with social ties to forest guards have experienced increase in forest income (i.e. elite capture hypothesis).
(i) Households that use the health centre have higher labour productivity. (ii) The presence of the health centre has reduced cash expenditures on health.

A guide to learning about livelihood impacts of REDD+ projects | 698A guide to learning about livelihood impacts of REDD+ projects: Worksheets
Worksheet 8 www.cifor.cgiar.org
Table 2. Qualitative and quantitative data needs to test hypotheses
Project treatments
A. Boundary planting and taungya B. O� -farm employment as forest guards
C. Community carbon fund
Hypotheses (i) and (ii) Hypotheses (i) and (ii) Hypotheses (i) and (ii)
Qualitative data Quantitative data
Qualitative data Quantitative data
Qualitative data Quantitative data
Household-level data
Perceptions of bene� ts and costs of taungya
Participation in taungya; income portfolio data (esp. agriculture and forestry shares); time devoted to monitoring by household
Perceptions of e� ectiveness of forest guards
Income portfolio data (esp. o� -farm and forestry shares); interactions with forest guards
Perceptions of health and well-being of household members
Number of sick days; expenditures on health-related items; labour productivity of the household; access to the health centre
Village Perceptions of taungya
Number of violations in bu� er zone
Past and present experience with elite capture
Number of violations recorded by forest guards
Preferences for established health service provider vs. traditional medicines
Number of visits to health centre
Step 4: Mapping data needsThe critical questions for data needs are as follows.
1. Specifically, what data are needed to test the hypotheses (i.e. what indicators or variables are required)?
2. At what scale are we likely to see variation in the indicator or variable?
3. Are the indicators most appropriately qualitative or quantitative? (Table 2; also see Worksheet 10.)
When considering data needs, important decisions must be made about whether to collect data both before and after the intervention, and whether data will be collected in both control and intervention sites.
Step 5: Testing hypothesesQualitative data can be used to construct a narrative about the relationship or correlation between variables that is proposed in the hypothesis. With a large enough sample size (i.e. N ≥ 80) of quantitative data, correlation or regression analysis can be used to test the relationship between variables. Where findings are unexpected, there should be further exploration of the inputs, activities and outputs of implementation, and how they link to outcomes. Recall that the initial question motivating hypotheses is: what is the social welfare impact of the REDD+ intervention? To fully understand the causal processes at work between intervention and outcomes as a REDD+ project evolves over time, data for mapping causal chains will need to be updated and revised.
8A guide to learning about livelihood impacts of REDD+ projects: Worksheets
Worksheet 8 www.cifor.cgiar.org
the boundary for encroachment by slash-and-burn agriculturalists); Activity B, providing part-time jobs to 5 people from each village to work as forest guards monitoring the clearing of community and protected area forests; Activity C, establishing a community carbon fund; in exchange for verified reduced deforestation in the project site, funds will be paid on an annual basis to a community carbon fund managed by the project proponent. Village leaders have to submit proposals to access funds for community-oriented projects (e.g. establishing a grain mill, buying supplies for the local school, establishing a fruit tree nursery).
Step 3: Developing testable hypothesesHypotheses are motivated by some variant of the question ‘what are the social impacts of the REDD+ project?’ A hypothesis is a reasonable scientific proposal or an educated guess about the expected relationship between 2 variables. Hypotheses have 2 requirements: they must fit the known facts and they must be testable (Can the variable be measured directly or do you need a proxy variable? Can you obtain the data required to test hypotheses given time and resource constraints? Is there enough variation in the data to test the hypothesis?). When developing hypotheses, it is important to articulate if the REDD+ intervention was implemented as intended (i.e. are the on-the-ground activities reflective of planned activities?) (Table 1).
Table 1. Mapping the causal chain by linking implementation to outcomes
Project treatments
A. Boundary planting and taungya
B. O� -farm employment as forest guards
C. Community carbon fund
Inputs Funds to pay for seedlings for boundary plantings; resources for forest extension advice; land allocation for taungya
Funds to pay salaries of part-time forest guards; training on monitoring and enforcement
Transparent process for application submission and review; proposal-writing support; community training and participation in monitoring, reporting and veri� cation (MRV); funds for community project
REDD+ intervention activities (as per project design document (PDD))
Plant boundary trees; establish taungya system (i.e. landowner cultivates crops on land allocated)
Employment of forest guards on renewable annual contracts; increased enforcement of protected area boundaries
Establish community carbon fund for community development projects, e.g. establish health centre
REDD+ intervention as implemented
Boundary trees planted with 80% survival rate (i.e. boundary clearly marked); land cultivated by residents adjacent to park
Forest guards employed (5 per village for a total of 25), but most guards reluctant to enforce restrictions on accessing park for fear of reprisals by community members
Community carbon fund slow to start; MRV methods yet to be fully established; no veri� cation of reduced emissions
Outputs Decline in forest degradation in forest within 2 km bu� er of park boundary; increase in crop income
O� -farm employment opportunities for rural households; minor decline in forest degradation
Decline in deforestation and degradation in anticipation of social welfare gains from community development projects
Expected social welfare outcome
Increase in average income for households in intervention villages; bene� ts from taungya expected to outweigh cost of loss of access to forests
Increased total income for households; minor decline in forest income due to decrease in access to national park
Reduced expenditures on medical services and drugs; increased labour productivity due to fewer sick days or time spent caring for sick
Testable hypotheses linking intervention to treatment and outcomes
(i) Farmers engaged in the taungya have more land and are able to produce more food (either for home consumption or sale). (ii) Forest degradation is reduced due to boundary demarcation leading to decline in forest income.
(i) Forest income has declined due to increased monitoring and enforcement. (ii) Households with social ties to forest guards have experienced increase in forest income (i.e. elite capture hypothesis).
(i) Households that use the health centre have higher labour productivity. (ii) The presence of the health centre has reduced cash expenditures on health.

9A guide to learning about livelihood impacts of REDD+ projects: Worksheets
Worksheet 9 www.cifor.cgiar.org
Distributional analysis
Box 1. GCS-REDD and distributional impactsWe have good evidence that access to a diversity of forest products is very important to the livelihoods of the rural poor, women and other vulnerable groups. If the implementation of a REDD+ project results in changes in the distance women need to walk to collect fuelwood, or in access to medicinal plants, wild foods, handicraft materials and other forest products important to poor or vulnerable groups, livelihoods may be compromised.
GCS-REDD is using a variety of methods to understand the effect of REDD+ interventions on poor and vulnerable populations. For example, village-level focus groups with women representing all demographics within a village are being conducted to learn about how women use and manage forests, the role of women in implementing REDD+ projects, how the project affects women and the source of women’s knowledge about REDD+ (see Women’s Questionnaire – Annex C).
At the household level, GCS-REDD is collecting data for a representative sample of households in each village (Household Questionnaire – Annex C). By estimating social welfare outcomes for subgroups, such as migrant vs. long-term residents, we can test the hypothesis that newcomers to a community are differentially affected by REDD+ interventions. More sophisticated statistical techniques involve interaction variables; for example, combining the treatment variable with a variable reflecting whether the household recently migrated allows us to estimate the effect of the reform on migrant households whilst controlling for covariates.
IntroductionUnderstanding whether REDD+ interventions produce different impacts for different groups is critical for understanding the equity and co-benefits dimensions of REDD+ and who gains and who loses from REDD+. For example, do impacts differ by socio-economic group, gender or ethnic group? Distributional analysis offers a variety of methods and tools for estimating how impacts vary across groups and for answering such questions.
Changes in the ability of rural households to access forests, or to harvest specific forest products, may have a considerable impact on rural people whose relative share of forest income or consumption was high before the intervention. Research undertaken over the past 10–15 years provides strong evidence that poor and vulnerable households have a high degree of dependence on subsistence forest products, whereas relatively wealthy households have the financial and social capital to take advantage of markets for high-value forest products (Cavendish 2000, Arnold 2002, Bush et al. 2004, Fisher 2004, Vedeld et al. 2004, Narain et al. 2005, Chomitz et al. 2007). Further, we know that the poor depend on forests to provide safety-net functions in times of crisis, and to support the current consumption needs of rural households (Pattanyak and Sills 2001, Angelsen and Wunder 2003). We also know that forest and environmental income have an equalising effect in rural societies. Standard estimates of income inequality using detailed income portfolio data with and without forest and environmental income clearly demonstrate that having access to forest products makes households more equal than they would be in the absence of forest income (Lopez-Feldman et al. 2007, Cavendish and Campbell 2008, Jagger in press). Evidence from these empirical studies gives us good reasons to explore the differential impact of REDD+ interventions (Box 1).
Distributional analysis can take many forms, including qualitative accounts of how particular groups are affected by project interventions, descriptive statistics that decompose impacts by group, measuring poverty or inequality for subgroups, and by incorporating interaction variables that reflect relevant subpopulations in a multivariate regression
analysis (e.g. examining the effects of being both poor and a woman, or how poverty and gender interact and affect the intervention’s impact).
Focus groups Focus groups and interviews with key informants are essential for identifying groups that might experience differential welfare impacts from REDD+ interventions. Qualitative information on socially or economically marginalised groups can be collected at various points throughout the monitoring and evaluation process. Conducting focus groups before the start of REDD+ interventions provides important information about forest-dependent and other vulnerable groups, and ensures that appropriate ‘before’ and ‘after’ data are collected for assessing variable welfare impacts. Focus groups can also be used for the collection of retrospective data; participants can provide qualitative accounts of perceptions of how vulnerable groups have been affected since the project was implemented. Focus groups are essential for understanding the process by which interventions affect poor and vulnerable groups. Group discussions generate data that reveal some of the mechanisms underlying differential impacts observed in quantitative estimates of welfare changes.
Mixed methods and distributional impactsMuch of the literature on early forest carbon projects, and on the welfare impacts of conservation and development projects in general, is qualitative in nature (Caplow et al. in press). Data generated through focus group discussions and key informant interviews are essential for providing not only important information about who the vulnerable groups are, but also an initial picture of how groups are affected. Quantitative analysis is a powerful companion to narratives of households escaping poverty, elite capture and vulnerable groups stuck in poverty traps. Using basic descriptive statistics, conducting multivariate regression analysis to estimate impact heterogeneity and estimating the effect of the intervention on inequality enable us to speak more
Worksheet 9

A guide to learning about livelihood impacts of REDD+ projects | 719A guide to learning about livelihood impacts of REDD+ projects: Worksheets
Worksheet 9 www.cifor.cgiar.org
Distributional analysis
Box 1. GCS-REDD and distributional impactsWe have good evidence that access to a diversity of forest products is very important to the livelihoods of the rural poor, women and other vulnerable groups. If the implementation of a REDD+ project results in changes in the distance women need to walk to collect fuelwood, or in access to medicinal plants, wild foods, handicraft materials and other forest products important to poor or vulnerable groups, livelihoods may be compromised.
GCS-REDD is using a variety of methods to understand the effect of REDD+ interventions on poor and vulnerable populations. For example, village-level focus groups with women representing all demographics within a village are being conducted to learn about how women use and manage forests, the role of women in implementing REDD+ projects, how the project affects women and the source of women’s knowledge about REDD+ (see Women’s Questionnaire – Annex C).
At the household level, GCS-REDD is collecting data for a representative sample of households in each village (Household Questionnaire – Annex C). By estimating social welfare outcomes for subgroups, such as migrant vs. long-term residents, we can test the hypothesis that newcomers to a community are differentially affected by REDD+ interventions. More sophisticated statistical techniques involve interaction variables; for example, combining the treatment variable with a variable reflecting whether the household recently migrated allows us to estimate the effect of the reform on migrant households whilst controlling for covariates.
IntroductionUnderstanding whether REDD+ interventions produce different impacts for different groups is critical for understanding the equity and co-benefits dimensions of REDD+ and who gains and who loses from REDD+. For example, do impacts differ by socio-economic group, gender or ethnic group? Distributional analysis offers a variety of methods and tools for estimating how impacts vary across groups and for answering such questions.
Changes in the ability of rural households to access forests, or to harvest specific forest products, may have a considerable impact on rural people whose relative share of forest income or consumption was high before the intervention. Research undertaken over the past 10–15 years provides strong evidence that poor and vulnerable households have a high degree of dependence on subsistence forest products, whereas relatively wealthy households have the financial and social capital to take advantage of markets for high-value forest products (Cavendish 2000, Arnold 2002, Bush et al. 2004, Fisher 2004, Vedeld et al. 2004, Narain et al. 2005, Chomitz et al. 2007). Further, we know that the poor depend on forests to provide safety-net functions in times of crisis, and to support the current consumption needs of rural households (Pattanyak and Sills 2001, Angelsen and Wunder 2003). We also know that forest and environmental income have an equalising effect in rural societies. Standard estimates of income inequality using detailed income portfolio data with and without forest and environmental income clearly demonstrate that having access to forest products makes households more equal than they would be in the absence of forest income (Lopez-Feldman et al. 2007, Cavendish and Campbell 2008, Jagger in press). Evidence from these empirical studies gives us good reasons to explore the differential impact of REDD+ interventions (Box 1).
Distributional analysis can take many forms, including qualitative accounts of how particular groups are affected by project interventions, descriptive statistics that decompose impacts by group, measuring poverty or inequality for subgroups, and by incorporating interaction variables that reflect relevant subpopulations in a multivariate regression
analysis (e.g. examining the effects of being both poor and a woman, or how poverty and gender interact and affect the intervention’s impact).
Focus groups Focus groups and interviews with key informants are essential for identifying groups that might experience differential welfare impacts from REDD+ interventions. Qualitative information on socially or economically marginalised groups can be collected at various points throughout the monitoring and evaluation process. Conducting focus groups before the start of REDD+ interventions provides important information about forest-dependent and other vulnerable groups, and ensures that appropriate ‘before’ and ‘after’ data are collected for assessing variable welfare impacts. Focus groups can also be used for the collection of retrospective data; participants can provide qualitative accounts of perceptions of how vulnerable groups have been affected since the project was implemented. Focus groups are essential for understanding the process by which interventions affect poor and vulnerable groups. Group discussions generate data that reveal some of the mechanisms underlying differential impacts observed in quantitative estimates of welfare changes.
Mixed methods and distributional impactsMuch of the literature on early forest carbon projects, and on the welfare impacts of conservation and development projects in general, is qualitative in nature (Caplow et al. in press). Data generated through focus group discussions and key informant interviews are essential for providing not only important information about who the vulnerable groups are, but also an initial picture of how groups are affected. Quantitative analysis is a powerful companion to narratives of households escaping poverty, elite capture and vulnerable groups stuck in poverty traps. Using basic descriptive statistics, conducting multivariate regression analysis to estimate impact heterogeneity and estimating the effect of the intervention on inequality enable us to speak more
9A guide to learning about livelihood impacts of REDD+ projects: Worksheets
Worksheet 9 www.cifor.cgiar.org
Box 2. Gini decomposition to measure income inequality
The Gini coefficient is a measure of inequality in the distribution of income. To better understand the role of environmental income as a determinant of income inequality, the Gini coefficient can be decomposed by income source to calculate the impact that a marginal change in forest and environmental income will have on inequality (for examples, see Jagger in press and Lopez-Feldman et al. 2007). Following Lerman and Yitzhaki (1985), the Gini coefficient for total income inequality, G, can be represented as
where Sk represents the share of component k in total income, Gk is the source Gini, corresponding to the distribution of income from source k, and Rk is the Gini correlation between income from source k and the distribution of total income. Gini decomposition provides information on how important an income source is to total income (Sk), how equally or unequally distributed the income source is (Gk) and how the income source and the distribution of total income are correlated (Rk). The final term, Rk, indicates the extent to which environmental income favours or does not favour the poor. For details of Gini decomposition and obtaining marginal effects using the STATA command ‘descongini’, see Lopez-Feldman (2006).
confidently and with a higher degree of precision about the magnitude of distributional impacts.
Decomposing welfare outcomesThere are several ways of decomposing household-level welfare outcome data to reflect how REDD+ interventions variably affect vulnerable groups, by including, for example, income quartile, ethnic group, gender or migrant status. Generating tables of means for welfare outcomes decomposed by group is a simple way to test hypotheses about significant differences in outcomes between subgroups of the sample. For example, decomposing welfare outcome data by female- vs. male-headed households is a powerful way to determine how women and men are differentially affected by interventions.
Assessing impact heterogeneity through multivariate regressionWhilst descriptive statistics and tests of differences of means are illustrative, multivariate regression analysis which takes into account covariates and confounders that may be influencing outcomes provides a more robust picture of how REDD+ interventions affect poor and vulnerable groups. There are 2 ways to approach regression analysis. The first involves splitting the sample of representative households using the variable that represents the vulnerable group. Running separate regressions for subgroups allows you to estimate the effect of the intervention on welfare outcomes for the vulnerable group (see Jagger 2008 for an example of this method applied to
the welfare impacts of Uganda’s forest sector reform). An alternative method for estimating the effect of a REDD+ intervention is to create an interaction term (i.e. a new variable) that combines participation in the intervention (i.e. in the intervention group (CI), in the after group (BA) or in both after/intervention groups (BACI)), and the variable that describes the vulnerable population (Plewis 2002, Khandker et al. 2010). For example, using the BACI or CI research design, to understand how a REDD+ intervention has affected female-headed households, create a new dummy variable REDDFhead coded as 0 if the household is outside the treatment group and a male headed household, and 1 if the household falls in the REDD+ project site and is female headed. This approach will allow you to explicitly estimate impact heterogeneity for the vulnerable group in your sample.
Inequality measures to illustrate welfare impacts on total sample or subgroupsOf the several measures of income or wealth inequality, the Gini coefficient, a measure of statistical dispersion, is amongst the most commonly used measures of income inequality (Box 2). Gini coefficients are bounded by 0 and 1 with higher coefficients reflecting a higher degree of income inequality. The important role of forest and environmental income in fostering a more equal society suggests that a comparison of Gini coefficient estimates in control and intervention sites, with ‘before’ and ‘after’ data or with BACI data, can demonstrate whether REDD+ interventions have had an equalising effect on rural households.
www.cifor.cgiar.org www.ForestsClimateChange.org
Center for International Forestry Research CIFOR advances human wellbeing, environmental conservation and equity by conducting research to inform policies and practices that a� ect forests in developing countries. CIFOR is one of 15 centres within the Consultative Group on International Agricultural Research (CGIAR). CIFOR’s headquarters are in Bogor, Indonesia. It also has o� ces in Asia, Africa and South America.

10A guide to learning about livelihood impacts of REDD+ projects: Worksheets
Worksheet 10 www.cifor.cgiar.org
IntroductionCausal models and theories of change are central to figuring out what variables you need to consider in your analysis. Models generally feature 4 types of variables important for learning from first-generation REDD+ projects: (1) outcome variables; (2) explanatory variables; (3) confounders; and (4) process variables. Causal models not only identify relevant variables but also predict the relationships and feedback loops between them. Before setting out to collect data to construct variables required to test the hypotheses laid out in causal models, considerable thought should be given to issues of scale. Most REDD+ interventions will require variables that represent phenomena occurring at a variety of scales including the subnational, village, household and perhaps intra-household levels. When variables are composed of data collected at a variety of scales, they are termed multiscale or nested variables. Scale and variation are closely related concepts. A key question is: at what scale do you expect to see variation in the data? Consider electricity use, for example. If you are collecting data in an area where villages either have electricity or do not have electricity, variation in the data will be at the village level and collecting household-level data would not yield any variation in a given village (Box 1).
Outcome variablesCollecting data on outcomes of interest is central to learning from REDD+ projects. Outcome variables need to be clearly defined such that they accurately and precisely
Variablesdescribe the outcome we are concerned with, and need to be collected at an appropriate scale. If REDD+ interventions are targeted at households, then variables that reflect household measures of income, consumption, expenditure, time use, health status and other common indicators of social welfare are most appropriate (see Worksheet 2). These should capture the different dimensions of welfare that matter more for different categories of people within households (e.g. women vs. men; adults vs. children). If interventions take place at the village level, then information reflecting welfare at the village level is appropriate, although as explained above, this may be represented by some combination of village and aggregate or average household indicators. The best outcome variables involve direct measures, for example, measuring the quantity of forest products harvested by a household and using local price data and costs incurred by the household to estimate net income from forest products. When direct measurement is too costly or time consuming, it is possible to use proxy measures, such as a Likert scale variable that describes the availability of a specific forest product such as fuel wood within the project area. Perceptions of local forest users, forest officials and other relevant stakeholders can also be used to construct variables that reflect REDD+ intervention outcomes.
With data on outcomes, it is possible to estimate the average change in social welfare by calculating differences across groups, defined by experimental design, sampling and/or matching. As shown in Table 2, the specific calculation depends on the research design.
Box 1. Which survey approach to take?
Once you have a good sense of which data you need, the question arises of which methods are suitable for collecting which types of data. We propose the following 2 key questions as the most effective way to determine how to approach collecting data.
1. Is this variable likely to vary within the village/community? If yes, the information should be collected at the household level. If no, it can be collected at the village level.
2. Can I get reliable quantitative figures for this variable, or better: do I need to get representative quantitative figures for this variable? If yes on both, put the question in the household survey. If no, choose key informant or focus group/village discussions.
The answers to these questions allow you to categorise the information that you are collecting into 1 of 4 possible categories (Table 1).
Table 1. Matrix for deciding which survey approach to take
Does the variable vary within the village?
Yes No
Are representative quantitative � gures obtainable and necessary?
Yes Structured household survey Structured village survey
No Key informants, focus groups Village meeting
Following this process to identify the scale at which data should be collected and whether you need quantitative data is essential to collecting the most accurate and precise data possible; it is also essential to minimising the burden on the respondents who are participating in your survey.
Adapted from Jagger and Angelsen 2011
Worksheet 10
10A guide to learning about livelihood impacts of REDD+ projects: Worksheets
Worksheet 10 www.cifor.cgiar.org
www.cifor.cgiar.org www.ForestsClimateChange.org
Center for International Forestry Research CIFOR advances human wellbeing, environmental conservation and equity by conducting research to inform policies and practices that a� ect forests in developing countries. CIFOR is one of 15 centres within the Consultative Group on International Agricultural Research (CGIAR). CIFOR’s headquarters are in Bogor, Indonesia. It also has o� ces in Asia, Africa and South America.
Explanatory variables Basic analysis of outcome variables allows you to tell a critical yet incomplete part of the story about the relationship between REDD+ projects and observed changes in social welfare. However, many other explanatory or independent variables can influence changes in outcome variables. By collecting data on these exogenous factors (not influenced by the project) at multiple scales, we can examine their impact on outcomes. At the household level, a standard set of variables generally accepted as determinants of household welfare includes endowments of land, human capital (e.g. education, household size, dependency ratio), financial capital, social capital, assets (including livestock) and type of dwelling. As with other types of variables, it is important to consider scale in collecting data for explanatory variables. Higher-order variables such as market access, population density, agricultural potential and presence of health and education infrastructure are good indicators of variation at the village level that may be influencing outcomes across diverse settings. With well-specified outcome variables and corresponding explanatory variables, as well as the treatment variable for each unit of observation, multivariate regression analysis can be used to estimate average treatment effects (ATE).
ConfoundersA simple behavioural model includes an outcome variable (i.e. dependent variable) explained by a series of variables (i.e. explanatory or independent variables), including the project or treatment variable of interest. Outcome variables allow us to say something about the observed change that results from a REDD+ project, and explanatory variables allow us to control for factors other than the intervention itself that might influence the outcome. Some of these explanatory variables may also be ‘confounders’, because they explain not only outcomes but also the treatment itself. Confounding variables represent a significant challenge for impact evaluation. They are factors that both
directly explain the outcome and are correlated with (but not caused by) treatment by the REDD+ project. They could be determinants of treatment or the correlation could be driven by some other unobserved influences that lead to correlation between these explanatory variables and treatment. Confounding variables cause problems for learning from REDD+ projects because, although they are suggestive of a relationship between the REDD+ project and the observed outcomes, they are not in fact telling us about the causal link between the REDD+ intervention and outcomes. Thinking about alternative explanations for your observed outcome is an important step in identifying confounders.
There are several ways to address confounders: by including carefully selected control groups; by including observed confounders in a multivariate regression analysis; if unobserved, by using an instrumental variable (i.e. a variable that does not itself belong in the explanatory equation and is correlated with the endogenous explanatory variables, conditional on the other covariates); or by employing a randomisation design.
Process variablesThis discussion of outcome, explanatory and confounding variables has focused on collecting data that allow you to explain observed outcomes and rule out alternative explanations for observed outcomes. These variables are critical to learning about the impacts of REDD+ projects ex post. However, these 3 sets of variables do not allow you to tell a complete story about why you observe particular outcomes. The ‘why’ is critical to learning from REDD+ projects. Identifying and understanding causal pathways depends on the analysis of what we term ‘process variables’. These variables describe conditions that influence implementation (see Worksheet 8). Process variables are generally identified and measured ex ante as part of developing a theory of change that links the REDD+ intervention to outcomes.
Table 2. Calculating the average social welfare e� ect of REDD+ project using income
Research design Description Formula (Y = income; t = treatment or intervention; c = matched control; 1 = after; 0 = before)
Randomisation Project control (Yt1–Yc1)
Before–After/Control–Intervention (BACI) Di� erence in di� erence (Yt1–Yt0) – (Yc1–Yc0)
Before–After After–Before (Yt1–Yt0)
Control–Intervention Intervention–Control (Yt1–Yc1)
Retrospective After adjusted (Yt1) x (estimated change)

A guide to learning about livelihood impacts of REDD+ projects | 7310A guide to learning about livelihood impacts of REDD+ projects: Worksheets
Worksheet 10 www.cifor.cgiar.org
www.cifor.cgiar.org www.ForestsClimateChange.org
Center for International Forestry Research CIFOR advances human wellbeing, environmental conservation and equity by conducting research to inform policies and practices that a� ect forests in developing countries. CIFOR is one of 15 centres within the Consultative Group on International Agricultural Research (CGIAR). CIFOR’s headquarters are in Bogor, Indonesia. It also has o� ces in Asia, Africa and South America.
Explanatory variables Basic analysis of outcome variables allows you to tell a critical yet incomplete part of the story about the relationship between REDD+ projects and observed changes in social welfare. However, many other explanatory or independent variables can influence changes in outcome variables. By collecting data on these exogenous factors (not influenced by the project) at multiple scales, we can examine their impact on outcomes. At the household level, a standard set of variables generally accepted as determinants of household welfare includes endowments of land, human capital (e.g. education, household size, dependency ratio), financial capital, social capital, assets (including livestock) and type of dwelling. As with other types of variables, it is important to consider scale in collecting data for explanatory variables. Higher-order variables such as market access, population density, agricultural potential and presence of health and education infrastructure are good indicators of variation at the village level that may be influencing outcomes across diverse settings. With well-specified outcome variables and corresponding explanatory variables, as well as the treatment variable for each unit of observation, multivariate regression analysis can be used to estimate average treatment effects (ATE).
ConfoundersA simple behavioural model includes an outcome variable (i.e. dependent variable) explained by a series of variables (i.e. explanatory or independent variables), including the project or treatment variable of interest. Outcome variables allow us to say something about the observed change that results from a REDD+ project, and explanatory variables allow us to control for factors other than the intervention itself that might influence the outcome. Some of these explanatory variables may also be ‘confounders’, because they explain not only outcomes but also the treatment itself. Confounding variables represent a significant challenge for impact evaluation. They are factors that both
directly explain the outcome and are correlated with (but not caused by) treatment by the REDD+ project. They could be determinants of treatment or the correlation could be driven by some other unobserved influences that lead to correlation between these explanatory variables and treatment. Confounding variables cause problems for learning from REDD+ projects because, although they are suggestive of a relationship between the REDD+ project and the observed outcomes, they are not in fact telling us about the causal link between the REDD+ intervention and outcomes. Thinking about alternative explanations for your observed outcome is an important step in identifying confounders.
There are several ways to address confounders: by including carefully selected control groups; by including observed confounders in a multivariate regression analysis; if unobserved, by using an instrumental variable (i.e. a variable that does not itself belong in the explanatory equation and is correlated with the endogenous explanatory variables, conditional on the other covariates); or by employing a randomisation design.
Process variablesThis discussion of outcome, explanatory and confounding variables has focused on collecting data that allow you to explain observed outcomes and rule out alternative explanations for observed outcomes. These variables are critical to learning about the impacts of REDD+ projects ex post. However, these 3 sets of variables do not allow you to tell a complete story about why you observe particular outcomes. The ‘why’ is critical to learning from REDD+ projects. Identifying and understanding causal pathways depends on the analysis of what we term ‘process variables’. These variables describe conditions that influence implementation (see Worksheet 8). Process variables are generally identified and measured ex ante as part of developing a theory of change that links the REDD+ intervention to outcomes.
Table 2. Calculating the average social welfare e� ect of REDD+ project using income
Research design Description Formula (Y = income; t = treatment or intervention; c = matched control; 1 = after; 0 = before)
Randomisation Project control (Yt1–Yc1)
Before–After/Control–Intervention (BACI) Di� erence in di� erence (Yt1–Yt0) – (Yc1–Yc0)
Before–After After–Before (Yt1–Yt0)
Control–Intervention Intervention–Control (Yt1–Yc1)
Retrospective After adjusted (Yt1) x (estimated change)


The number of evaluation guides and tools for assessing livelihood and land use change is vast. We do not summarise this large literature here. Rather, the aim of this annex is to complement existing guides and direct the reader to a diverse set of sources that, taken collectively, can inform the particular niche of learning addressed in this guide: understanding the impacts of REDD+ on local populations. This diverse set of relevant topics includes identifying the complex forces driving deforestation and degradation, establishing counterfactuals and attribution for both social and ecological outcomes, measuring changes in welfare and well-being as well as in forest area and conditions, and understanding people’s perception of land use change. To this end, this annex provides the reader with key references on (1) research design, (2) assessment of well-being and welfare outcomes, (3) assessment of how people use land as well as their perceptions of land use change, (4) deforestation and degradation drivers and (5) establishment of reference emission levels/baselines and other forest carbon measurement issues in REDD+.
1. Research design methods
A. Impact evaluation guides
Shoestring evaluation: designing impact evaluations under budget, time and data constraints (Bamberger et al. 2004) This article explains how to simplify evaluation designs when limited resources and data preclude application of preferred approaches. It provides an overview of 7 evaluation designs, including both ‘strong’ and ‘less robust’ designs. The considerations that should inform decisions regarding reduction
Annex B. Annotated bibliography
of sample size, reduction of data collection and analysis costs, and the reconstruction of baseline and control group data are discussed. The authors review how to integrate participatory methods, apply mixed-methods approaches and collect data on sensitive topics and from groups that are difficult to reach. The article also provides guidance on how to identify and overcome threats to validity in evaluation designs.
Bamberger, M., Rugh, J., Church, M. and Fort, L. 2004 Shoestring evaluation: designing impact evaluations under budget, time, and data constraints. American Journal of Evaluation 25(1): 5–37.
Evaluation manual: methodology and processes (IFAD 2009) Although this manual was developed for evaluation staff at the International Fund for Agricultural Development (IFAD; a specialised agency of the UN), some of the guidance and perspectives on evaluation it contains may be of interest to a broader audience. The manual provides a list of good-practice techniques for data collection, but leaves the choice up to the evaluator. It questions whether experimental and quasi-experimental impact evaluation methods should really be considered the ‘gold standard’, given the difficulty and costs associated with employing these methods, particularly in complex situations. The usefulness of qualitative and participatory approaches is noted. The IFAD evaluation approach to assessing impact is described as ‘a combination of counterfactual analysis (e.g., using control groups), “before and after” techniques, and triangulation methods’. The approach involves rating various criteria on a 6-point scale, with the ratings informed by the evaluator’s answers to

76 | Pamela Jagger, Erin O. Sills, Kathleen Lawlor and William D. Sunderlin
specific questions (which could presumably be informed by data analysis of household survey data, participatory methods or the evaluator’s own opinion based on a review of other sources). International Fund for Agricultural Development
(IFAD). 2009 Evaluation manual: methodology and processes. IFAD Office of Evaluation. IFAD, Rome. http://www.ifad.org/evaluation/process_methodology/index.htm
Handbook on impact evaluation: quantitative methods and practices (Khandker et al. 2010) This book provides an in-depth overview of experimental and quasi-experimental impact evaluation methods, including practical exercises (for use with STATA statistical software). It also discusses use of economic models for evaluating the impacts of large-scale policies and methods for measuring distributional impacts (heterogeneous impacts for different subgroups in the affected population). There is also some discussion of the differences between ex ante and ex post impact evaluations, as well as the potential for these approaches to complement one another.
Khandker, S.R., Koolwal, G.B. and Samad, H.A. 2010 Handbook on impact evaluation: quantitative methods and practices. World Bank, Washington, DC.
Impact evaluations and development: NONIE guidance on impact evaluation (Leeuw and Vaessen 2009)This book is produced by NONIE: The Network of Networks for Impact Evaluation, which is comprised of various evaluation groups, including those of the OECD and the UN. It provides in-depth guidance on both research design and management of the impact evaluation – including determining whether an impact evaluation is feasible and affordable. Experimental, quasi-experimental and non-quantitative approaches are discussed. The authors emphasise the synergies between various quantitative and qualitative methods. They advocate use of mixed-methods approaches in order to triangulate information and produce more in-depth and nuanced understandings of
impacts and the processes leading to them. This book also provides guidance on how to incorporate participatory evaluation techniques into an impact evaluation, recommending use of participatory techniques right from the beginning in order to hear from project-affected people what they value and what they think the evaluation should measure. Further, it discusses how to conduct impact evaluations when the programme to be studied is complex, encompassing a range of activities that might cut across sectors and geographical areas – which could be particularly useful for conducting impact evaluations of national- and subnational-level REDD+.
Leeuw, F. and Vaessen, J. 2009 Impact evaluations and development: NONIE guidance on impact evaluation. World Bank, Washington, DC. http://www.worldbank.org/ieg/nonie/guidance.html
Rough guide to impact evaluation of environmental and development programs (Pattanayak 2009)This short guide reviews experimental and quasi-experimental impact evaluation methods and discusses their application to environment and development programmes. The author also discusses current debates regarding nuanced impact evaluation, specifically the challenges associated with understanding the heterogeneous impacts of a given programme on different subgroups. Included in the guide is a learning exercise that involves re-running an impact evaluation of a real-world project using data from the original study.
Pattanayak, S.K. 2009 Rough guide to impact evaluation of environmental and development programs. SANDEE Working Paper No. 20-09. South Asian Network for Development and Environmental Economics, Kathmandu.
B. Impact evaluation websites
International Initiative for Impact Evaluation (3ie): http://www.3ieimpact.org/Abdul Latif Jameel Poverty Action Lab (J-PAL): http://www.povertyactionlab.org/Research Methods Knowledge Base: http://www.socialresearchmethods.net/kb/quasiexp.php

A guide to learning about livelihood impacts of REDD+ projects | 77
C. Participatory evaluation guides
Participatory water monitoring: a guide for preventing and managing conflict (CAO 2008)Participatory monitoring can help build and maintain support for local projects. This is the principal lesson from the Compliance Advisor Ombudsman’s experience working with communities affected by the Newmont/ Minera Yanacocha gold mine in Cajamarca, Peru. After a mercury spill in the area, the local population was concerned about water pollution from the gold mine. A participatory water monitoring programme was established that involved the local population in the collection, analysis and reporting of water quality and quantity data. This guide offers lessons for structuring a participatory monitoring process that may be applicable to REDD+ projects and reveals how participatory monitoring can be a tool for promoting the informed and meaningful participation of citizens in projects and for building local community support.
Compliance Advisor Ombudsman (CAO). 2008 Participatory water monitoring: a guide for preventing and managing conflict. CAO, Washington, DC. http://www.cao-ombudsman.org/howwework/advisor/documents/watermoneng.pdf.
Participatory impact assessment: a guide for practitioners (Catley et al. 2007)‘Participatory impact assessment’ (PIA), as defined by these authors, is ‘an extension of Participatory Rural Appraisal (PRA) and involves the adaptation of participatory tools combined with more conventional statistical approaches specifically to measure the impact of humanitarian assistance and development projects on people’s lives’. Recognising that pre-project and control group data may be difficult to obtain in many cases, the guide explains alternative, participatory methods for uncovering changes in well-being and attributing identified changes to project activities. These methods involve using comparative scoring and ranking of project and non-project factors. The guide outlines an 8-stage process for the PIA and identifies multiple tools and methods that can be used during each stage.
Catley, A., Burns, J., Adebe, D. and Suji, O. 2007 Participatory impact assessment: a guide for practitioners. Feinstein International Center, Tufts University, Medford, Massachusetts. http://www.reliefweb.int/rw/lib.nsf/db900SID/SHIG-7L2K8C?OpenDocument.
Most significant change (Davies and Dart 2005)See Section 2.D of Appendix B on page 83.
D. Evaluation guides uniquely suited for conservation interventions
Design alternatives for evaluating the impact of conservation projects (Margoluis et al. 2009)This article provides an overview of research design options for conservation evaluations. It outlines the various quasi-experimental, non-experimental and qualitative approaches available; what types of information they yield; and their strengths and weaknesses. The authors discuss the unique characteristics of conservation interventions that pose challenges to evaluation design as well as strategies for overcoming these challenges. Research design options suitable for a range of particular circumstances and conservation interventions are identified.
Margoluis, R., Stem, C., Salafsky, N. and Brown, M. 2009 Design alternatives for evaluating the impact of conservation projects. New Directions for Evaluation 2009 (122): 85–96.
Manual for social impact assessment of land-based carbon projects (Richards and Panfil 2010)The Climate, Community and Biodiversity Alliance (CCBA) standards require that forest carbon projects demonstrate net positive impacts for local communities. To achieve this, projects are also required to (1) describe the socio-economic conditions of the community at project start; (2) estimate a socio-economic counterfactual (‘without project’) scenario; (3) estimate the socio-economic conditions after the project; (4) justify how the project is expected to improve socio-economic conditions; and (5) establish a social impacts monitoring system. Until recently, however, the CCBA had not provided specific guidance to project developers on how to implement these 5 steps

78 | Pamela Jagger, Erin O. Sills, Kathleen Lawlor and William D. Sunderlin
and provide evidence of net positive impacts at project validation. This manual aims to fill this gap. The manual focuses on (1) a causal model approach to assess attribution, rather than collection of data from control sites and (2) some variation of the Sustainable Livelihoods Framework to understand welfare outcomes.
Richards, M. and Panfil, S. 2010 Manual for social impact assessment of land-based carbon projects. Version 1.0. Forest Trends, Climate Community Biodiversity Alliance, Fauna and Flora International, and Rainforest Alliance, Washington, DC. http://www.forest-trends.org/documents/files/doc_2436.pdf
Social assessment of protected areas: a review of rapid methodologies (Schreckenberg et al. 2010)In this comprehensive literature review, approximately 30 tools and methods that could be relevant to understanding the social impacts of conservation projects are summarised, and their strengths, weaknesses and conceptual frameworks identified. From the reviewed tools and methods, around 200 indicators are extracted and listed. The authors identify what they see as gaps in the current conceptual frameworks and indicators presented in the reviewed tools and methods. The authors also propose some slight modifications to the traditional Sustainable Livelihoods Framework as a new conceptual framework for understanding the social impacts of protected areas.
Schreckenberg, K., Camargo, I., Withnall, K., Corrigan, C., Franks, P., Roe, D., Scherl, L.M. and Richardson, V. 2010 Social assessment of protected areas: a review of rapid methodologies. A report for the Social Assessment of Protected Areas (SAPA) Initiative. International Institute for Environment and Development, London.
Household surveys – a tool for conservation design, action and monitoring (WCS 2006)This compact technical manual provides guidance on designing a study to assess well-being outcomes using the Before–After/Control–Intervention (BACI) method, with pre-matching of control and intervention sites to control for potential confounders. Recommendations are made regarding which variables should be used
to match control and intervention sites, as well as other potentially confounding variables for which data should be collected. The manual provides guidance on assessing household well-being using a variety of approaches, including the Modified Basic Necessities Survey, collecting data on cash income and consumption and using biological measures of well-being (such as taking upper-arm circumference measurements to determine malnourishment). Techniques for reducing bias in the analysis and presentation of data are also discussed, including how to use desirable levels of calorie intake for different genders and ages to estimate the number of ‘Adult Male Equivalents’ per household, converting income to purchasing power parity terms and developing a local consumer price index. Guidance is also provided on using participatory mapping and remote sensing techniques to understand how people use natural resources.
Wildlife Conservation Society (WCS). 2006 Household surveys: a tool for conservation design, action and monitoring. Technical Manual 4. Wildlife Conservation Society Living Landscapes Program, Bronx, NY. http://wcslivinglandscapes.com/landscapes/90119/bulletins/manuals.html
E. Example studies: Application of impact evaluation techniques to conservation interventions
Andam, K.S., Ferraro, P.J. and Holland, M.B. 2009 What are the social impacts of land use restrictions on local communities? Empirical evidence from Costa Rica. Paper contributed to the Conference of the International Associated of Agriculture Economists. Beijing, China, 16–22 August.
Andam, K.S., Ferraro, P.J., Pfaff, A., Sanchez-Azofeifa, G.A. and Robalino, J.A. 2008 Measuring the effectiveness of protected area networks in reducing deforestation. Proceedings of the National Academy of Sciences USA 105(42): 16089–16094.
Andam, K.S., Ferraro, P.J., Sims, K.R.E., Healy, A. and Holland, M.B. 2010 Protected areas reduced poverty in Costa Rica and Thailand. Proceedings of the National Academy of Sciences USA 107(22): 9996–10001.

A guide to learning about livelihood impacts of REDD+ projects | 79
Arriagada, R.A. 2008 Private provision of public goods: applying matching methods to evaluate payments for ecosystem services in Costa Rica. PhD Thesis. North Carolina State University, Raleigh, North Carolina.
Bandyopadhyay, S. and Tembo, G. 2009 Household welfare and natural resource management around national parks in Zambia. Policy Research Working Paper 4932. World Bank, Washington, DC.
Gaveau, D.L.A., Wandono, H. and Setiabudi, F. 2007 Three decades of deforestation in southwest Sumatra: have protected areas halted forest loss and logging, and promoted regrowth? Biological Conservation 134: 495–504.
Jagger, P. 2008 Forest incomes after Uganda’s forest sector reform: are the rural poor gaining? CGIAR Systemwide Program on Collective Action and Property Rights (CAPRi), Working Paper Series No. 92. International Food Policy Research Institute, Washington, DC.
Jindal, R. 2010 Livelihood impacts of payments for forestry carbon services: field evidence from Mozambique. In: Tacconi, L. Mahanty, S. and Suich, H. (eds) Livelihoods in the REDD? Payments for environmental services, forest conservation and climate change. Edward Elgar, Cheltenham.
Jumbe, C. and Angelsen, A. 2006 Do the poor benefit from devolution policies? Evidence from forest co-management in Malawi. Land Economics 82(4): 562–581.
Sims, K.R.E. 2010 Conservation and development: evidence from Thai protected areas. Journal of Environmental Economics and Management 60(2): 94–114.
Somanathan, E., Prabhakar, R. and Mehta, B.S. 2009 Decentralization for cost-effective conservation. Proceedings of the National Academy of Sciences USA 106(11): 4143–4147.
2. Measuring outcomes: Welfare and well-being
A. Tools and methods based on measuring assets and access to services (locally defined, subjective indicators)
Basic Necessities Survey (Davies 1997) and Modified Basic Necessities Survey (WCS) Developed by Rick Davies in 1997, the Basic Necessities Survey (BNS) embraces the idea of
consensual and democratic definitions of poverty, in which the population being studied helps to determine the well-being indicators and the definition of poverty. The BNS achieves this by using information from key informants and respondents to develop a list of 20–30 basic necessities, defined as assets, activities or services that ‘everyone should be able to have and nobody should have to go without’. Basic necessities could include a bicycle, a quarter hectare of farmland, 3 meals per day or access to a school – each list will be unique to that community. Households are then asked whether they think each item on the ‘menu’ is indeed a basic necessity and they are also asked if they have it. Those items not ranked by at least 50% of respondents as a basic necessity are dropped from the list. A measure of well-being is then developed for each household by weighting their possession (or not) of each basic necessity by the percentage of households that identified it as such.
The BNS has been used by ActionAid in Vietnam and by others in Mali and Uganda. Recently, the Wildlife Conservation Society (WCS) developed a Modified BNS and is using it to understand how protected areas are affecting livelihoods in Gabon, Guatemala and Cambodia.
Rick Davies’ Basic Necessities Survey website: http://mande.co.uk/special-issues/the-basic-necessities-survey/
Davies, R. 1997 Beyond wealth ranking: the democratic definition and measurement of poverty. http://www.mande.co.uk/docs/ democrat.htm.
Pro Poor Center and Rick Davies. 2006 The 2006 Basic Necessities Survey (BNS) in Can Loc District, Ha Tinh Province, Vietnam. http://mande.co.uk/special-issues/the-basic-necessities-survey/.
Wildlife Conservation Society (WCS). 2006 Household surveys: a tool for conservation design, action and monitoring. Technical Manual 4. Wildlife Conservation Society Living Landscapes Program, Bronx, NY. http://wcslivinglandscapes.com/landscapes/90119/bulletins/manuals.html.
Wildlife Conservation Society. No date. Assessing the impact of conservation and development on rural livelihoods: using a modified basic necessities survey in experimental and control communities. Wildlife Conservation Society Living Landscapes Program, Bronx, NY.

80 | Pamela Jagger, Erin O. Sills, Kathleen Lawlor and William D. Sunderlin
Stages of progress (Krishna 2005)Developed by Anirudh Krishna at Duke University, the Stages of Progress method seeks to understand poverty from the perspective of the poor themselves and to uncover what accounts for households’ movements in and out of poverty. The method has been used with thousands of households in India, Kenya, Peru, Uganda and the United States. The first step of the methodology involves holding a community meeting to collectively agree upon what constitutes ‘poor’ (e.g. not having enough to eat) and what distinguishes the poor and the very poor from other economic classes, i.e. the milestones that households might reach (e.g. buy a tin roof/goat/motorcycle/car, send child to school, pay off debts, etc.) as they climb out of poverty. Then, the group is presented with a list of all households in the village and a memorable milestone (e.g. an election or drought) to mark the past/pre-project year in question. They are then asked to rank each household’s movement in or out of poverty over time as (1) remained poor; (2) escaped poverty; (3) became poor; or (4) remained not poor. To ascertain reasons for the reported changes and non-changes in economic conditions, a random sample of households from each of the 4 groups is interviewed together and then individually.
Stages of Progress: disaggregating poverty for better policy impact website: http://sanford.duke.edu/krishna/index.html.
Krishna, A. 2005 Stages of Progress field manual: a community based methodology for defining and understanding poverty. Version 2.0. http://sanford.duke.edu/krishna/SoP.pdf.
Sustainable Livelihoods FrameworkThe original Sustainable Livelihoods Framework (SLF) (also known as ‘Sustainable Livelihoods Approach, or SLA) focuses on measuring a household’s possession of 5 key capitals: human (e.g. health, education); social (e.g. networks, formal and informal institutions); physical (e.g. infrastructure, tools); financial (e.g. income, savings, credit); and natural (e.g. forest products, land, water). The SLF has also been used to assess well-being at the community level. Indicators (which could be developed locally) are used to measure how much of each of the 5 capitals a household (or individual
or community) possesses; these scores in turn produce the respondent’s unique pentagon . The SLF also involves the analysis of key vulnerabilities and shocks to livelihoods. If a livelihood cannot cope with these vulnerabilities and maintain or enhance its 5 capitals without undermining natural resources, then it is not sustainable, according to the SLF.
Since its conception in the 1990s, the SLF has been used and modified by many development organisations, NGOs and – now – forest carbon certification standards. For example, the Landscape Outcomes Assessment Methodology (LOAM), developed by WWF, adds a sixth capital: global conservation assets. The Social Carbon Standard uses a modified SLF termed the ‘Social Carbon Methodology’, which considers 6 capitals: natural, financial, human, social, carbon and biodiversity. Most recently, the Social Assessment of Protected Areas (SAPA) Initiative has proposed that the Millennium Ecosystem Assessment framework be incorporated into the SLF so that natural capital is divided into provisioning, supporting and regulating ecosystem services and social capital includes ecosystems’ cultural services. SAPA also adds a sixth capital: political/legal capital, which considers human rights and participation.
Key referencesAldrich, M. and Sayer, J. 2007 In practice: landscape
outcomes assessment methodology (LOAM). WWF Forest for Life Programme. http://assets.panda.org/downloads/loaminpracticemay07.pdf.
Carney, D. (ed.) 1998 Sustainable rural livelihoods: what contribution can we make? DFID, London.
Chambers, R. and Conway, G. 1992 Sustainable rural livelihoods: practical concepts for the 21st century. Institute of Development Studies, Brighton, UK.
IFAD’s (International Fund for Agricultural Development) Sustainable Livelihoods Approach website: http://www.ifad.org/sla/index.htm (November 2010).
Sayer, J., Campbell, B., Petheram, L., Aldrich, M., Ruiz Perez, M., Endamana, D., Nzooh Dongmo, Z.-L., Defo, L., Mariki. S., Doggart, N. and Burgess, N. 2007 Assessing environment and development outcomes in conservation landscapes. Biodiversity Conservation 16(9): 2677–2694.
Schreckenberg, K., Camargo, I., Withnall, K., Corrigan, C., Franks, P., Roe, D., Scherl, L.M. and Richardson,

A guide to learning about livelihood impacts of REDD+ projects | 81
V. 2010 Social assessment of protected areas: a review of rapid methodologies. A report for the Social Assessment of Protected Areas (SAPA) Initiative. International Institute for Environment and Development, London.
Social Carbon Methodology website: www.socialcarbon.org.
B. Tools/methods based on measuring income and consumption (pre-defined, objective indicators)
World Bank Living Standards Measurement Study Surveys (World Bank 1980–ongoing)The Living Standards Measurement Study (LSMS) was started by the World Bank to improve national statistics agencies’ data collection and to increase the use of household data in decision-making about development policies. The surveys collect household-level data on various aspects of well-being, including consumption, income, employment, educational level and anthropometric measures of health. Information is also collected about migration and fertility. The household surveys are complemented by a community-level questionnaire (interviews with community leaders) and a price questionnaire (interviews with market vendors to learn about prices). The LSMS surveys were piloted in 1985 in Côte d’Ivoire and Peru. Since then, the surveys have been implemented in several other countries. The current phase of the LSMS (2008–2015) is focused on understanding agriculture and linkages between farm and non-farm activities in Africa, with the goal of generating nationally representative panel datasets. Data for completed surveys, as well as a selection of analytical tools, are available on the World Bank LSMS website. These datasets could be useful for understanding impacts in national-level REDD+, although data appears to exist for only a small number of potential REDD+ countries.
Available at World Bank website: http://econ.worldbank.org/WBSITE/EXTERNAL/EXTDEC/EXTRESEARCH/EXTLSMS/0,,contentMDK:21610833~pagePK:64168427~piPK:64168435~theSitePK:3358997,00.html.
CIFOR’s Poverty Environment Network (PEN)The Poverty Environment Network is a collaboration between doctoral researchers and junior developing country researchers. A common set of village and household questionnaires focused on forest and environmental income was implemented in more than 35 research sites throughout the low-income tropics. The aim of the project is not only to document forest and environmental income, but also to better understand the complex relationship between poverty reduction and forest dependence. Data for more than 8000 households were collected between 2003 and 2009. www.cifor.cgiar.org/pen
C. Tools/methods based on rights, livelihood security, and opportunities
The ‘BAG’: Basic Assessment Guide for Human Well-Being (Colfer et al. 1999)The ‘BAG’ was developed by Carol Colfer and CIFOR colleagues in 1999 to assess the ‘sustainability’ of timber operations; it may be adapted for use in understanding impacts in REDD+. The ‘BAG’ focuses on understanding the effects of timber operations on local populations; it is combined with 2 other CIFOR toolkits focused on ecological functioning and forestry effects to make a 3-part toolbox for assessing timber operations’ ‘sustainability’, defined as ‘maintaining or enhancing human well-being and ecological functioning’. The ‘BAG’ outlines the following 3 principles: (1) forest management maintains or enhances fair intergenerational access to resources and economic benefits; (2) concerned stakeholders have acknowledged rights and means to manage forests cooperatively and equitably; and (3) the health of forest actors, culture and the forest is acceptable to all stakeholders. To assess adherence to each principle, the ‘BAG’ outlines criteria and indicators and identifies particular tools that could be used in the assessment. It also proposes use of a ‘Who Counts Matrix’ as well as focus groups to identify relevant stakeholders at the outset. The tools also guide users in scoring the principles, which is done on a 10-point scale, with weighting to reflect varying importance of the different principles.

82 | Pamela Jagger, Erin O. Sills, Kathleen Lawlor and William D. Sunderlin
‘The BAG’ has 2 companion pieces: (1) ‘The Grab Bag’, which outlines supplementary methods and (2) ‘The Scoring and Analysis Guide’, which explains how to systematise qualitative judgements and apply simplified quantitative data analysis methods, assuming use of Excel and SPSS.
References below and other relevant CIFOR toolkits available at: http://www.cifor.cgiar.org/acm/methods/toolbox.html.
Colfer, C.J.P., Brocklesby, M.A., Diaw, C., Etuge, P., Günter, M., Harwell, E., McDougall, C., Porro, N.M., Porro, R., Prabhu, R. et al. 1999 The BAG: basic assessment guide for human well-being. Criteria and Indicators Toolkit No. 5. CIFOR, Bogor, Indonesia.
Colfer, C.J.P., Brocklesby, M.A., Diaw, C., Etuge, P., Günter, M., Harwell, E., McDougall, C.,
Porro, N.M., Porro, R., Prabhu, R. et al. 1999 The Grab Bag: supplementary methods for assessing human well-being. Criteria and Indicators Toolkit No. 6. CIFOR, Bogor, Indonesia.
Salim, A., Colfer, C.J.P. and McDougall, C. 1999 The scoring and analysis guide for assessing human well-being. Criteria and Indicators Toolkit No. 7. CIFOR, Bogor, Indonesia.
Household livelihood security assessments: a toolkit for practitioners (CARE 2002) The authors define ‘household livelihood security assessments’ (HLSA) as a type of rapid rural appraisal or participatory rural appraisal that embraces a rights-based approach and uses multidisciplinary analysis to ‘enhance understanding about local livelihood systems…and important differences among types of households and among members within households’. It does this by disaggregating data by groups (ethnicity, gender, economic or social status, age, etc.) in order to understand differences in access to goods and services, control over resources, the division of labour, the exercise of rights, capital accumulation, vulnerability and marginalisation and the distribution of political and economic power. The manual’s list of possible uses of the HLSA does not acknowledge use for project/programme impact assessment (the focus is instead on understanding conditions before and during the project and building support for CARE projects). However, repeated use of the methods in the manual could be useful for low-cost impact
assessments in REDD+, particularly where there is interest in understanding food security, vulnerability and marginalisation issues.
The manual outlines steps and numerous tools for the pre-assessment, assessment and analysis phases. The pre-assessment consists of reviewing secondary data, identifying vulnerable groups and creating livelihood security profiles. The assessment phase involves collecting qualitative and quantitative data on livelihood systems and well-being as well as causal data (e.g. the factors leading to vulnerability). A triangulation of methods is proposed for collecting these data: household surveys, focus groups, key informant interviews, wealth ranking, participatory mapping, etc. Guidance is provided on both random and purposeful sampling strategies, as well as on survey team selection and training. In addition, the manual presents a variety of methods for analysing the data, including Opportunities Analysis, Gender Analysis, Institutional Analysis and Benefit–Harm Analysis.
CARE. 2002 Household livelihood security assessments: a toolkit for practitioners. Prepared for the PHLS Unit by TANGO International Inc., Tucson, Arizona. http://www.proventionconsortium.org/themes/default/pdfs/CRA/HLSA2002_meth.pdf.
D. Tools/methods suitable for retrospective analysis
Strengthening the evaluation of programme effectiveness through reconstructing baseline data (Bamberger 2009) Recognising that lack of pre-project data is a persistent problem for impact evaluation, Bamberger outlines various quantitative, qualitative and mixed-methods techniques that the evaluator can employ to ‘reconstruct’ pre-project (baseline) data. Options include using secondary data, such as the World Bank Living Standards Measurement Study (LSMS) surveys (see entry in Section II(B)), the recall method, or interviews with key informants or focus groups. The article also presents the following methods for reconstructing baseline data for the comparison (control) group: propensity score matching, judgemental matching, pipeline

A guide to learning about livelihood impacts of REDD+ projects | 83
comparison group, internal comparison group and intensity score analysis, post-test cross-sectional project/comparison group design and cluster analysis.
Bamberger, M. 2009 Strengthening the evaluation of programme effectiveness through reconstructing baseline data. Journal of Development Effectiveness 1(1): 37–59.
Most significant change (Davies and Dart 2005)The ‘most significant change’ technique is a qualitative, participatory method that may be suitable for cases where resources are limited and there are no pre-project data. The technique involves collecting ‘stories of significant change’ through multiple methods: evaluators can write down unsolicited stories that they have heard, conduct and document interviews, facilitate and document group discussions and/or ask people to write down their stories. The ‘most significant’ stories are then selected according to the following process. First, in a group, respondents read their stories. Second, the group discusses which stories should be selected. Third, the group decides which stories are the ‘most significant’ (this could be done via voting by ballot, publicly scoring stories or iterative voting). Finally, the reasons for the group’s selection are recorded. Following these participatory steps are ‘verification of stories, quantification, secondary analysis and meta-monitoring’.
Key referencesDavies, R. and Dart, J. 2005 Most significant change
(MSC) technique: a guide to its use. http://mande.co.uk/docs/MSCGuide.pdf.
Rick Davies’ most significant change website: http://mande.co.uk/special-issues/most-significant-change-msc/.
UNICEF India’s Most Significant Change website: http://www.mostsignificantchange.org/.
Stages of Progress (Krishna 2005)See Section 2.A.
Participatory impact assessment: a guide for practitioners (Catley et al. 2007)See Section 1.C.
3. Perceptions of land use and land use change
International Forestry Resources and Institutions (IFRI)The International Forestry Resources and Institutions (IFRI) research programme has been collecting data on forest governance and institutions since 1992. Their resources provide an excellent starting point for developing questionnaires focused on local institutions, collective action and forest condition. The IFRI protocols involve guidance on how to sample representative forest plots and how to collect biophysical data on forest condition and forest degradation. IFRI also involves qualitative assessments of deforestation and forest degradation by stakeholder groups ranging from village members to forest officials. http://sitemaker.umich.edu/ifri/resources
Other sourcesCaviglia-Harris, J.L. and Harris, D.W. 2005. Examining
the reliability of survey data with remote sensing and geographic information systems to improve deforestation modeling. The Review of Regional Studies 35: 187–205.
Caviglia-Harris, J.L. and Harris, D.W. 2008 Integrating survey and remote sensing data to analyze land use at a fine scale: insights from agricultural households in the Brazilian Amazon. International Regional Science Review 31: 115–137.
Kerr, J. and Pender, J. 2005 Farmers’ perceptions of soil erosion and its consequences in India’s semiarid tropics. Land Degradation and Development 16: 257–271.
Ostrom, E. and Wertime, M.B. 2000 International forestry resources and institutions research strategy. In: Gibson, C., McKean, M. and Ostrom, E. (eds) People and forests: communities, institutions, and governance, 1–28. MIT Press, Cambridge, Massachusetts.
Participatory Mapping (International Centre for Development-oriented Research in Agriculture) http://www.icra-edu.org/objects/anglolearn/Maps_&_transects-Guidelines.pdf
Potvin, C., Tschakert, P., Lebel, F., Kirby, K., Barrios, H., Bocariza, J., Caisamo, J., Caisamo, L., Cansari, C., Casamá, J., et al. 2007 A participatory approach to the establishment of a baseline scenario for

84 | Pamela Jagger, Erin O. Sills, Kathleen Lawlor and William D. Sunderlin
a reforestation Clean Development Mechanism project. Mitigation and Adaptation Strategies for Global Change 12: 1341–1362.
4. Drivers of deforestation and degradation
A complex web of economic and institutional forces drives deforestation and degradation. The forces driving land use change vary from landscape to landscape, change over time and are often difficult to identify. The question of what drives deforestation and degradation has thus motivated significant research as well as fierce debate. Understanding what drives forest loss in a given landscape is a necessity for designing effective conservation interventions and developing theories of change for projects and impact evaluations. This section provides a list of recent reviews on deforestation and degradation drivers, as well as a small selection of literature on drivers in some of the key REDD+ regions.
A. Syntheses and reviews
Angelsen, A. and Kaimowitz, D. 1999 Rethinking the causes of deforestation: lessons from economic models. The World Bank Research Observer 14(1): 73–98. World Bank, Washington, DC.
Barbier, E.B. 2001 The economics of tropical deforestation and land use: an introduction to the special issue. Land Economics 77(2): 155–171.
Butler, R.A. and Lawrence, W.F. 2008 New strategies for conserving tropical forests. Trends in Ecology and Evolution 23(9): 469–472.
Chomitz, K., Balmford, A., Whitten, T., Richards. M. and Berlin, A. 2007 At loggerheads? Agricultural expansion, poverty reduction, and environment in tropical forests. World Bank Policy Research Report. World Bank, Washington, DC. http://go.worldbank.org/TKGHE4IA30.
DeFries, R.S., Rudel, T., Uriarte, M. and Hansen, M. 2010 Deforestation driven by urban population growth and agricultural trade in the twenty-first century. Nature Geoscience 3: 178–181.
Geist, H.J. and Lambin, D.F. 2002 Proximate causes and underlying driving forces of tropical deforestation. BioScience (52)2: 143–150.
Kanninen, M., Murdiyarso, D., Seymour, F., Angelsen, A., Wunder, S. and German, L. 2007 Do trees grow on money? The implications of deforestation research for policies to promote REDD. CIFOR, Bogor, Indonesia.
Lawlor, K. 2009 Addressing the causes of tropical deforestation: lessons learned and the implications for international forest carbon policy. In: Olander, L.P., Boyd, W., Lawlor, K., Myers Madeira, E. and Niles, J.O. (eds) International forest carbon and the climate change challenge: issues and options, 43–53. Nicholas Institute for Environmental Policy Solutions, Duke University, Durham, North Carolina.
B. The Amazon
Araujo, C., Araujo Bonjean, C., Combes, J.-L., Combes Motel, P. and Reis, E.J. 2009 Property rights and deforestation in the Brazilian Amazon. Ecological Economics 68: 2461–2468.
Asner, G.P., Knapp, D.E., Broadbent, E.N., Oliveira, P.J.C., Keller, M. and Silva, J.N. 2005 Selective logging the Brazilian Amazon. Science 310: 480–482.
McAlpine, C.A., Etter, A., Fearnside, P.M., Seabrook, L. and Laurance, W.F. 2009 Increasing world consumption of beef as a driver of regional and global change: A call for policy action based on evidence from Queensland (Australia), Colombia and Brazil. Global Environmental Change 19: 21–33.
Morton, D., DeFries, R.S., Shimabukuro, Y.E., Anderson, L.O., Arai, E., Bon Espirito-Santo, F., Freitas, R. and Morisette, J. 2006 Cropland expansion changes deforestation dynamics in the southern Brazilian Amazon. Proceedings of the National Academy of Sciences USA 103(39): 14637–14641.
Pfaff, A. 1999 What drives deforestation in the Brazilian Amazon? Evidence from satellite and socioeconomic data. Journal of Environmental Economics and Management 37(1): 26–43.
C. Central America
Barbier, E.B. and Burgess, J.C. 1996. Economic analysis of deforestation in Mexico. Environment and Development Economics 1: 203–239.

A guide to learning about livelihood impacts of REDD+ projects | 85
Kaimowitz, D. 1996 Livestock and deforestation in Central America in the 1980s and 1990s: a policy perspective. CIFOR, Bogor, Indonesia.
D. Southeast Asia
Angelsen, A. 1995 Shifting cultivation and ‘deforestation’: a study from Indonesia. World Development 23(10): 1713–1729.
Barbier, E.B., Bockstael, N., Burgess, J.C. and Strand, I. 1995 The linkages between the timber trade and tropical deforestation – Indonesia. World Economy 18(3): 411–442.
Curran, L.M., Trigg, S.N., McDonald, A.K., Astiani, D., Hardiono, Y.M., Siregar, P., Caniago, I. and Kasischke, E. 2004 Lowland forest loss in protected areas of Indonesian Borneo. Science 303(5660): 1000–1003.
Fitzherbert, E.B., Struebig, M.J., Morel, A., Danielsen, F., Bruhl, C.A., Donald, P.F. and Phalan, B. 2008 How will oil palm expansion affect biodiversity? Trends in Ecology and Evolution 23(10): 538–545.
Global Witness 2007 Cambodia’s family trees: illegal logging and the stripping of public assets by Cambodia’s elite. Global Witness, London.
Palmer, C. 2001 The extent and causes of illegal logging: an analysis of a major cause of deforestation in Indonesia. CSERGE Working Paper. Centre for Social and Economic Research on the Global Environment (CSERGE), London.
Sunderlin, W.D. and Resosudarmo, I.A.P. 1996 Rates and causes of deforestation in Indonesia: towards a resolution of the ambiguities. CIFOR Occasional Paper No. 9. CIFOR, Bogor, Indonesia.
E. South Asia
Bajracharya, D. 1983 Deforestation in the food/fuel context: historical and political perspectives from Nepal. Mountain Research and Development 3(3): 227–240.
Lele, N., Nagendra, H. and Southworth, J. 2010 Accessibility, demography and protection: drivers of forest stability and change at multiple scales in the Cauvery Basin, India. Remote Sensing 2: 306–332.
F. The Congo Basin
De Wasseige, C., Devers, D., de Marcken, P., Eba’a Atyi, R., Nasi, R. and Mayaux, P. (eds) 2009 The forests of the Congo Basin: state of the forest 2008. Publications Office of the European Union, Luxembourg. http://carpe.umd.edu/resources/sof/
Hansen, C.P. and Treue, T. 2008 Assessing illegal logging in Ghana. International Forestry Review 10(4): 573–590.
Jenkins, M. 2008 Who murdered the Virunga gorillas? National Geographic, July, 34–65.
Laporte, N.T., Stabach, J.A., Grosch, R., Lin, T.S. and Goetz, S.J. 2007 Expansion of industrial logging in Central Africa. Science 316(5830): 1451.
Mertens, B., Sunderlin, W.D., Ndoye, O. and Lambin, E.F. 2000 Impact of macroeconomic change on deforestation in south Cameroon: integration of household survey and remotely-sensed data. World Development 28(6): 983–999.
Zhang, Q., Devers, D., Desch, A., Justice, C.O. and Townshend, J. 2005 Mapping tropical deforestation in Central Africa. Environmental Monitoring and Assessment 101(1–3): 69–83.
G. West Africa
Appiah, M., Blay, D., Damnyag, L., Dwomoh, F.K., Pappinen, A. and Luukkanen, O. 2009 Dependence on forest resources and tropical deforestation in Ghana. Environment, Development and Sustainability 11: 471–487.
Barbier, E.B. and Benhin, J.K.A. 2001 The effects of the structural adjustment program on deforestation in Ghana. Agricultural and Resource Economics Review 30(1): 66–88.
Fairhead, J. and Leach, M. 1998 Reframing deforestation: global analyses and local realities with studies in West Africa. Routledge, London.
Global Witness. 2005 Timber, Taylor, soldier spy: how Liberia’s uncontrolled resource exploitation, Charles Taylor’s manipulation and the re-recruitment of ex-combatants are threatening regional peace. A report submitted to the UN Security Council by Global Witness.
Hansen, C.P. and Treue, T. 2008 Assessing illegal logging in Ghana. International Forestry Review 10(4): 573–590.

86 | Pamela Jagger, Erin O. Sills, Kathleen Lawlor and William D. Sunderlin
5. Measuring forest carbon in REDD+
The parallel literature on measuring forest carbon outcomes is clearly relevant to this guide’s focus on understanding how REDD+ affects local livelihoods. The large literature on establishing deforestation/degradation reference emission levels (RELs) and addressing leakage in REDD+, as well as the literature on predicting land use change through agent-based modelling and other methods, can inform the development of counterfactual scenarios for both social and ecological outcomes in impact evaluations. Further, to understand synergies and trade-offs between the forest carbon and welfare impacts of REDD+ and to further our knowledge about joint production and feedback loops in complex socio-ecological systems, evaluations will need to ensure that social and deforestation/degradation reference scenarios are established in tandem. This section provides a small sample of references on these topics, highlighting sources from both the academic literature and certification standards.
A. Best practice guides
GOFC-GOLD 2009 A sourcebook of methods and procedures for monitoring and reporting anthropogenic greenhouse gas emissions and removals caused by deforestation, gains and losses of carbon stocks in forests remaining forests and forestation. http://www.gofc-gold.uni-jena.de/redd/.
Estrada, M. 2010 Standards and methods available for estimating project-level REDD+ carbon benefits: Manual for project managers. CIFOR, Bogor, Indonesia.
B. Establishing deforestation and degradation counterfactuals
1. Reference emission levels (RELs) at the national level: Competing proposals and debates
Angelsen, A. 2008a REDD models and baselines. International Forestry Review 10(3): 465–475.
Angelsen, A. 2008b How do we set the reference levels for REDD payments? In: Angelsen, A. (ed.)
Moving ahead with REDD: issues, options and implications, 53–64. CIFOR, Bogor, Indonesia.
Griscom, B., Shoch, D., Stanley, B., Cortez, R. and Virgillo, N. 2009 Sensitivity of amounts and distribution of tropical forest carbon credits depending on baseline rules. Environmental Science & Policy 12(7): 897–911.
Karsenty, A. 2008 The architecture of proposed REDD schemes after Bali: facing critical choices. International Forestry Review 10(3): 443–457.
Motel, P.C., Pirard, R. and Combes, J.-L. 2008 A methodology to estimate impacts of domestic policies on deforestation: Compensated Successful Efforts for ‘avoided deforestation’. Ecological Economics 68(3): 680–691.
Tacconi, L. 2009 Compensated successful efforts for avoided deforestation vs. compensated reductions. Ecological Economics 68(8–9): 2469–2472.
2. RELs at the project or subnational level: Criticism and debate
Plantinga, A.J. and Richards, K.R. 2008 International forest carbon sequestration in a post-Kyoto agreement. The Harvard Project on International Climate Agreements Discussion Paper 2008-11. Cambridge, Massachusetts.
Richards, K. and Andersson, K. 2001 The leaky sink: persistent obstacles to a forest carbon sequestration program based on individual projects. Climate Policy 1: 41–54.
Schlamadinger, B., Ciccarese, L., Dutschke, M., Fearnside, P.M., Brown, S. and Murdiyarso, D. 2005 Should we include avoidance of deforestation in the international response to climate change? In: Murdiyarso, D. and H. Herawati, H. (eds) Carbon forestry: who will benefit? Proceedings of Workshop on Carbon Sequestration and Sustainable Livelihoods, Bogor, Indonesia, 16–17 February. CIFOR, Bogor, Indonesia.
3. RELs at the project/subnational level: Methodologies from certification standards
Voluntary Carbon Standard Guidance and Tools: http://www.v-c-s.org/afl.html.Voluntary Carbon Standard Methodologies:
• Approved: http://www.v-c-s.org/vcsmethodologies.html.
• Under review: http://www.v-c-s.org/public_comment.html.

A guide to learning about livelihood impacts of REDD+ projects | 87
4. Approaches from the academic literature
Brown, S., Hall, M., Andrasko, K., Ruiz, F., Marzoli, W., Guerrero, G., Masera, O., Dushku, A., DeJong, B. and Cornell, J. 2007 Baselines for land-use change in the tropics: application to avoided deforestation projects. Mitigation and Adaptation Strategies for Global Change 123(86): 1001–1026.
Gaveau, D.L.A., Epting, J., Lyne, O., Linkie, M., Kumara, I., Kanninen, M. and Leader-Williams, N. 2009 Evaluating whether protected areas reduce tropical deforestation in Sumatra. Journal of Biogeography 36(11): 2165–2175.
Honey-Roses, J., Lopez-Garcia, J., Rendon-Salinas, E., Peralta-Higuera, A. and Galindo-Leal, C. 2009 To pay or not to pay? Monitoring performance and enforcing conditionality when paying for forest conservation in Mexico. Environmental Conservation 36(2): 120–128.
Potvin, C., Tschakert, P., Lebel, F., Kirby, K., Barrios, H., Bocariza, J., Caisamo, J., Caisamo, L., Cansari, C., Casamá, J., et al. 2007 A participatory approach to the establishment of a baseline scenario for a reforestation Clean Development Mechanism project. Mitigation and Adaptation Strategies for Global Change 12: 1341–1362.
Veldkamp, A. and Lambin, E.F. 2001 Editorial: predicting land-use change. Agriculture, Ecosystems and Environment 85: 1–6.
Veldkamp, A. and Verburg, P.H. 2004 Editorial: modeling land use change and environmental impact. Journal of Environmental Management 72: 1–3.
a. Agent-based modelling Evans, T.P. and Kelley, H. 2004 Multi-scale analysis of a
household level agent-based model of land cover change. Journal of Environmental Management 72: 57–72.
Castella, J.-C., Kam, S.P., Quang, D.D., Verburg, P.H. and Hoanh, C.H. 2007 Combining top-down and bottom-up modeling approaches of land use/cover
change to support public policies: application to sustainable management of natural resources in northern Vietnam. Land Use Policy 24: 531–545.
Parker, D.C., Manson, S.M., Janssen, M.A., Hoffmann, M.J. and Deadman, P. 2003 Multi-agent systems for the simulation of land-use and land-cover change: a review. Annals of the Association of American Geographers 93(2): 314–337.
Walsh, S.J., Crawford, T.W., Crews-Meyer, K.A. and Welsh, W.F. 2001 A multi scale analysis of land use land cover change and NDVI variation in Nang Rong district, northeast Thailand. Agriculture, Ecosystems and Environment 85: 47–64.
C. Leakage
1. Addressing leakage at national and international levels
Murray, B.C. 2009 Leakage from an avoided deforestation compensation policy: concepts, empirical evidence, and corrective policy options. In: Palmer, C. and Engel, S. (eds) Avoided deforestation: prospects for mitigating climate change, 11–38. Routledge, New York.
Wunder, S. 2008 How do we deal with leakage? In Angelsen, A. (ed.) Moving ahead with REDD: issues, options and implications, 65–76. CIFOR, Bogor, Indonesia.
2. Addressing leakage at the project level: Methodologies from certification standards
Voluntary Carbon Standard Guidance and Tools: http://www.v-c-s.org/afl.html.Voluntary Carbon Standard Methodologies:
• Approved: http://www.v-c-s.org/vcsmethodologies.html.
• Under review: http://www.v-c-s.org/public_comment.html.


CIFOR’s Global Comparative Study on REDD+ (GCS-REDD) includes a rigorous evaluation of the social and biophysical impacts of REDD+ pilot projects. The materials described in this annex are the core of the study’s social impact evaluation instruments. The questionnaires and technical guidelines that accompany these materials are international public goods. As such, they are available to members of the scientific, donor, non-government and civil society organisation, conservation organisation and forest user communities. The materials include a variety of questionnaires created to elicit information in a nested structure designed to evaluate the process of establishing REDD+ and the outcome of introducing REDD+ incentives. This annex provides a short description of each of the survey instruments and points users to the relevant sections of the technical guidelines.
The technical guidelines form a dynamic document that will be updated as CIFOR’s GCS-REDD progresses. For this reason, we refer users to particular sections of the technical guidelines, but not to specific page numbers (see Table C.1). We review each of the survey instruments in turn, starting with the project level and narrowing to the household level. Also contained in the technical guidelines is a great deal of information central to the study of REDD+, including:
Annex C. About the technical guidelines and survey instruments
• background information on CIFOR, REDD+ and the GCS-REDD (Section 2 of the technical guidelines);
• essential elements of GCS-REDD research design including the research problem (Section 3.1), the conceptual framework of effectiveness, efficiency, equity and co-benefits (3E+) (Section 3.2), the goal of the research (Section 3.3), specific research questions (Section 3.4), an operational definition of REDD+ (Section 3.5), an overview of the Before–After/Control–Intervention (BACI) research design (Section 3.6), evaluation of implementation and impact (Section 3.7), an overview of the intensive and extensive dimensions of the research (Section 3.8), issues related to measuring and monitoring carbon emissions (Section 3.9) and a description of how countries were selected for the GCS-REDD (Section 3.10);
• tips on how to successfully carry out field research, including guidance on maintaining independence from project proponents (Section 5.4), on ensuring the anonymity of respondents and confidentiality (Section 5.5) and on principles of good field research (Section 5.7);
• organisational aspects of the GCS-REDD including an organigram (Section 3.14) and a timetable for implementing the GCS-REDD (Section 3.17); and
• plans for impact-oriented outputs and dissemination (Sections 3.15 and 3.16).

90 | Pamela Jagger, Erin O. Sills, Kathleen Lawlor and William D. Sunderlin
Table C.1: Overview of GCS-REDD research instruments and technical guidelines
Survey instrument Description Relevant sections of technical guidelines
Proponent appraisal The proponent appraisal is designed to:
• serve as an initial reconnaissance exercise to plan the rest of the research at a specific project site;
• identify all stakeholders who should be interviewed;
• identify which elements of the project are in the design phase, which are underway and which have been completed;
• collect basic information on the project and project site which cannot be collected from secondary sources or by telephone;
• collect village information to enable the selection of a sample of villages for CIFOR’s research.
3.11 Project selection
4.8 Proponent appraisal
5.2 Memorandum of cooperation
5.9 How to fill out survey forms
5.10 Use of codes
5.11 How to conduct research on tenure
8.2 Forest land use categories
8.3 Agricultural land use categories
8.4 Other land use categories
Annex 5 Instructions for the proponent appraisal form
Survey of project implementation (SPI)
The SPI is used to:
• characterise and record details of project implementation;
• identify stakeholders:
- all major stakeholders bearing implementation and opportunity costs in the project as a whole and in study villages;
- stakeholder group(s) expected to bear the greatest proportion of opportunity costs, that is, the group expected to forego the land use that would provide the greatest total profits in the project area under counterfactual conditions;
• quantify the total project implementation costs to date; (In extensive sites, the GCS-REDD will rely on the total official budget for implementation, whereas in intensive sites, we will also seek information on significant in-kind contributions not included in that official budget.)
• disaggregate implementation costs:
- estimate the percentages of implementation costs to date dedicated to (i) FPIC and (ii) MRV;
- estimate the percentage of implementation costs to date dedicated to the study villages. (In intensive sites only, the GCS-REDD will estimate current profits from land use in the study villages earned by actors that are (1) not resident in the village (and therefore did not participate in the household or village survey) and (2) likely to have to make substantial changes in their land use as a result of the project.)
• assess perceptions of REDD+ by multiple proponents and other stakeholders.
4.17 Survey of project implementation
5.11 How to conduct research on tenure

A guide to learning about livelihood impacts of REDD+ projects | 91
Survey instrument Description Relevant sections of technical guidelines
Largeholder questionnaire The largeholder questionnaire is used at each intensive site when large landholders are likely to bear the greatest opportunity cost due to REDD+. This is the group that is likely to forego the most profits from ‘business as usual’ land use due to changes in land use induced by the REDD+ project. At many sites, this ‘stakeholder group’ includes just a few entities that manage large areas for highly profitable commercial uses (e.g. 1–2 timber or oil palm concessions). However, at several sites in Brazil, this group includes a substantial number of large commercial farmers/ranchers.
4.13 Largeholder questionnaire
5.9 How to fill out survey forms
5.10 Use of codes
5.11 How to conduct research on tenure
8.2 Forest land use categories
8.3 Agricultural land use categories
8.4 Other land use categories
Village questionnaire The village questionnaire is the main tool for obtaining data about intervention and control villages in intensive project sites, and about intervention villages in extensive project sites.
Sections 1–5 are completed using secondary sources or through consultation with village officials and key informants. These sections cover:
1. basic information on demography, settlement and infrastructure;
2. village institutions and forest use regulations and rules;
3. wages and prices;
4. development projects/income to the village; and
5. village land tenure and use.
Sections 6–10 are completed based on information gathered during a village meeting. These sections cover:
1. basic information on livelihoods in the village and changes over time;
2. changes in forest area, quality and use;
3. views on tenure security over agricultural and forest resources;
4. perceptions on changes in well-being; and
5. village knowledge and involvement in REDD+.
If no spatial information is available for study villages, or if village boundaries are undefined, a brief village mapping exercise is conducted. The village mapping exercise is designed to get a rough spatial estimation of village boundaries. This information is used to link the survey information to land cover change analyses in study villages through the use of satellite imagery. Where shapefiles are available for study villages, there is no need to conduct the village mapping exercise: the spatial data would simply need to be compiled to submit to staff at CIFOR headquarters, along with the database.
3.12 Village selection
4.14 Village mapping exercise
4.15 Village questionnaire
5.7 One and two year recall method
5.8 How to record responses in a group interview
5.9 How to fill out survey forms
5.10 Use of codes
5.11 How to conduct research on tenure
8.2 Forest land use categories
8.3 Agricultural land use categories
8.4 Other land use categories

92 | Pamela Jagger, Erin O. Sills, Kathleen Lawlor and William D. Sunderlin
Survey instrument Description Relevant sections of technical guidelines
Village appraisal The purpose of the village appraisal form is to gather village-level data to help guide selection of intervention and control villages for the BACI analysis in intensive research sites. Village Selection Variables (VSVs) (one for each question in the form) will serve as the basis for identifying intervention and control villages that are similar to each other. The more similar they are to each other, the greater our assurance that differences between intervention and control villages in the ‘before’ and ‘after’ periods are attributable to REDD+ and not to something else. The use of the village appraisal form is closely linked to the use of exercise 27 in the proponent appraisal form.
3.12 Village selection
4.9 Village appraisal
5.9 How to fill out survey forms
5.10 Use of codes
8.1 Technical definition of a household
Annex 1 Instructions for village appraisal form
Annex 2 Village appraisal form
Women’s questionnaire The women’s questionnaire has 3 purposes. First, it is an instrument that enables women to have a voice as respondents in this study. Second, it is a way to obtain data that are specific to the experience and knowledge of women. Third, it supplies information that compares the livelihood activities and outlooks of women and men.
The women’s questionnaire is composed of four sections:
1. women’s livelihoods in the village and changes over time;
2. women’s participation in village decisions;
3. perception of changes in women’s well-being; and
4. women’s knowledge of and involvement in REDD+.
4.16 Women’s questionnaire
5.7 One and two year recall method
5.8 How to record responses in a group interview
5.9 How to fill out survey forms
5.10 Use of codes
5.11 How to conduct research on tenure
8.2 Forest land use categories
8.3 Agricultural land use categories
8.4 Other land use categories
Household questionnaire The household questionnaire is the only instrument in the GCS-REDD for obtaining household-level data. It is our key means of getting in-depth knowledge in intensive sites, and our main entry point for gathering socio-economic data in the BACI approach.
The main functions of the household questionnaire are to:
• measure the potential effect of REDD+ on household well-being, based on objective metrics (livelihood, assets, income over 12 months) and subjective metrics (perceived well-being status, reasons for change among those who experience change);
• measure the potential effect of REDD+ on land and resource use at the household level; and
• gather household knowledge of and involvement in the process of establishing and implementing REDD+.
Successful implementation of the household questionnaire depends on thorough understanding and mastery of the 1- and 2-year recall method.
4.11 Obtaining or creating a list of households
4.12 Household questionnaire
5.7 One and two year recall method
5.9 How to fill out survey forms
5.10 Use of codes
5.11 How to conduct research on tenure
7.1 How to conduct a random sample of households
8.1 Technical definition of a household
8.2 Forest land use categories
8.3 Agricultural land use categories
8.4 Other land use categories

A guide to learning about livelihood impacts of REDD+ projects | 93
Survey instrument Description Relevant sections of technical guidelines
Scale of housing materials form
The scale of housing materials is a form used to determine a village-specific scale of the value (low, medium, high) of materials used in the construction of houses in the village. The specific purpose of this scale is to serve as the source of codes for answering Table 2C in the household survey questionnaire. The information gathered in Table 2C will serve as one of the indicators of the relative well-being of households in the village.
4.10 Scale of housing materials
Annex 6 Scale of housing materials form


www.cifor.cgiar.org www.ForestsClimateChange.org
CIFOR Occasional Papers contain research results that are significant to tropical forestry. The content is peer reviewed internally and externally.
Center for International Forestry Research CIFOR advances human wellbeing, environmental conservation and equity by conducting research to inform policies and practices that affect forests in developing countries. CIFOR is one of 15 centres within the Consultative Group on International Agricultural Research (CGIAR). CIFOR’s headquarters are in Bogor, Indonesia. It also has offices in Asia, Africa and South America.
The multiyear Global Comparative Study on REDD+ aims to inform policy makers, practitioners and donors about what works in reducing emissions from deforestation and forest degradation, and enhancement of forest carbon stocks in developing countries. We gratefully acknowledge support received from the Norwegian Agency for Development Cooperation, the Australian Agency for International Development, the UK Department for International Development, the European Commission, the Department for International Development Cooperation of Finland, the David and Lucile Packard Foundation, the Program on Forests, the US Agency for International Development and the US Forestry Service of the Department of Agriculture.