![Ion Adsorption at the Rutile Water Interface: Linking ...bedzyk.mccormick.northwestern.edu/files/...water.pdf · and the ¢/.,,, +] + Ion Adsorption at the Rutile-Water Interface](https://static.fdocuments.net/doc/165x107/5f1e9d4ddd181c133d42cafa/ion-adsorption-at-the-rutile-water-interface-linking-and-the-ion.jpg)
A Grüneisen tensor for rutile and its application to host ... · 36 (HFSEs: Nb, Ta, Zr, Hf) (e.g....
36
1 Revision 1 1 A Grüneisen tensor for rutile and its application to host-inclusion 2 systems 3 Word count: 4914 4 Kira A. Musiyachenko 1 , Mara Murri 2 , Mauro Prencipe 3 , *Ross J. Angel 4 , Matteo Alvaro 1 5 1 Department of Earth and Environmental Sciences, University of Pavia, Via A. Ferrata, 1 27100 Pavia, Italy 6 2 Department of Earth and Environmental Sciences, University of Milano-Bicocca, Piazza della 7 Scienza 4, I-20126 Milano, Italy 8 3 Department of Earth Sciences, University of Torino, Via Valperga Caluso 35, 10125 Torino, Italy 9 4 IGG CNR, Via Giovanni Gradenigo, 6, 35131 Padova, Italy 10 11 *Corresponding author: [email protected] 12 Submitted to American Mineralogist 13 Abstract 14 Rutile is often found as inclusions in garnet, quartz and several other rock-forming minerals 15 and it is also a common accessory phase in high-pressure metamorphic rocks. Its relatively simple 16 structure, chemistry, broad PT stability field and its wide occurrence in nature makes it a candidate 17 for the application of elastic geobarometry. However, thermodynamic studies coupled with 18 observations on natural samples predict that rutile inclusions in garnets should exhibit zero residual 19 pressure. This implies that the rutile inclusions are detached from the inclusion walls in the host 20 garnet after entrapment. We determined the elastic and vibrational properties of rutile via ab initio 21 hybrid Hartree Fock/Density Functional Theory simulations under different strain states. Our 22 results confirmed the thermodynamic behavior of rutile in garnet and allowed us to determine for 23 the first time the components of the phonon-mode Grüneisen tensors of rutile. We demonstrated 24 that pure rutile inclusions in garnets from metamorphic rocks exhibit no residual strain or stress, 25
Transcript of A Grüneisen tensor for rutile and its application to host ... · 36 (HFSEs: Nb, Ta, Zr, Hf) (e.g....

1
Revision 1 1
A Grüneisen tensor for rutile and its application to host-inclusion 2
systems 3
Word count: 4914 4
Kira A. Musiyachenko1, Mara Murri2, Mauro Prencipe3, *Ross J. Angel4, Matteo Alvaro1 5 1Department of Earth and Environmental Sciences, University of Pavia, Via A. Ferrata, 1 27100 Pavia, Italy 6
2Department of Earth and Environmental Sciences, University of Milano-Bicocca, Piazza della 7 Scienza 4, I-20126 Milano, Italy 8
3Department of Earth Sciences, University of Torino, Via Valperga Caluso 35, 10125 Torino, Italy 9 4 IGG CNR, Via Giovanni Gradenigo, 6, 35131 Padova, Italy 10
11 *Corresponding author: [email protected] 12 Submitted to American Mineralogist 13
Abstract 14
Rutile is often found as inclusions in garnet, quartz and several other rock-forming minerals 15
and it is also a common accessory phase in high-pressure metamorphic rocks. Its relatively simple 16
structure, chemistry, broad PT stability field and its wide occurrence in nature makes it a candidate 17
for the application of elastic geobarometry. However, thermodynamic studies coupled with 18
observations on natural samples predict that rutile inclusions in garnets should exhibit zero residual 19
pressure. This implies that the rutile inclusions are detached from the inclusion walls in the host 20
garnet after entrapment. We determined the elastic and vibrational properties of rutile via ab initio 21
hybrid Hartree Fock/Density Functional Theory simulations under different strain states. Our 22
results confirmed the thermodynamic behavior of rutile in garnet and allowed us to determine for 23
the first time the components of the phonon-mode Grüneisen tensors of rutile. We demonstrated 24
that pure rutile inclusions in garnets from metamorphic rocks exhibit no residual strain or stress, 25

2
consistent with thermodynamic modelling. Nevertheless, there are rutile inclusions in garnet 26
surrounded by optical birefringence haloes, which are indicative of residual inclusion pressures. 27
Careful examination of these show that they contain significant amounts of amphibole which 28
reduce the elastic moduli of the composite inclusion to less than that of the garnet hosts. A 29
calculation method for the residual pressures of multi-phase inclusions is described. 30
31
Keywords: rutile, Grüneisen tensor, HF/DFT, elastic geobarometry 32
Introduction 33
Rutile is a widely distributed mineral in all types of rocks and has a wide range of applications in 34
Earth sciences. It is one of the most important carriers of titanium and high field strength elements 35
(HFSEs: Nb, Ta, Zr, Hf) (e.g. Meinhold 2010). Large rutile crystals usually occur in granitic 36
pegmatites and vein mineralization (e.g. Černý et al. 2007, 2015). More commonly, rutile occurs 37
as an accessory phase, both as inclusions in the rock-forming minerals and within the matrix. Rutile 38
inclusions can have several origins; they can be primary (i.e. igneous or metamorphic, peritectic, 39
xenocrystic) or secondary phases (i.e. hydrothermal alteration, e.g. Carruzzo et al. 2006; Meinhold 40
2010). 41
Rutile is already widely used in classical geothermobarometry in a variety of chemical 42
thermometers and barometers (e.g. Ferry and Watson 2007). Moreover, when it occurs as primary 43
inclusions, it also has the potential to provide fundamental information about the pressures and 44
temperatures of entrapment through elastic geobarometry. This provides a different and 45
complementary approach to recover the crystallization conditions of the system which does not 46
require a chemical equilibrium, but it is based on the elastic interactions between the host –47

3
inclusion pair (e.g. Rosenfeld and Chase 1961; Angel et al. 2014b; Alvaro et al. 2020). Because of 48
the contrast in the elastic properties, the host-inclusion system develops non-lithostatic stresses 49
upon exhumation. The residual elastic strain in the inclusion can be determined directly (e.g. from 50
the measured lattice parameters with single-crystal X-ray diffraction) or indirectly from the 51
changes in the wavenumbers of Raman-active phonon modes relative to an unstrained crystal with 52
the phonon-mode Grüneisen approach (Murri et al. 2018; Angel et al. 2019). The remnant 53
inclusion stress is then calculated from the measured strains. In addition, the remnant stress in the 54
inclusion can be detected as birefringence haloes around the inclusion pointing to the fact that the 55
host-inclusion interface and the surrounding host mineral is deformed (i.e. it is subject to strains, 56
Campomenosi et al. 2020). 57
In this paper we present the structure and the Raman spectra of rutile calculated by means of ab 58
initio hybrid Hartree-Fock/Density Functional Theory (HF/DFT) simulations under different strain 59
conditions (i.e. from -2% to +2% covering the expected range of strains for common rutile 60
inclusions) in order to determine the components of the phonon-mode Grüneisen tensors of rutile. 61
We then discuss the application of elastic geobarometry to garnet-rutile host-inclusion systems. 62
Methods 63
Quantum mechanical calculations 64
Ab initio hybrid HF/DFT simulations have been performed with the CRYSTAL17 code (Dovesi 65
et al. 2018b) by employing the WC1LYP functional which is particularly suitable for the correct 66
reproduction of the elastic and vibrational properties of crystals (e.g. Prencipe 2012, 2019; 67
Stangarone et al. 2016). The WC1LYP functional is based on the generalized gradient 68
approximation (GGA) exchange functional WC (Wu and Cohen 2006), mixed with 16% of the 69

4
exact non-local Hartree–Fock exchange. The functional also includes the LYP correlation 70
contribution (Lee et al. 1988). The grid for the numerical evaluation of the DFT exchange–71
correlation functionals was chosen by the keyword XXLGRID of the CRYSTAL17 user manual 72
(Dovesi et al. 2018a) and corresponds to a total of 19394 points in the unit cell. A measure of the 73
numerical accuracy provided by such a grid is the evaluation of the total number of electrons in 74
the unit cell, by the numerical integration of the electron density over the cell volume. For rutile, 75
we obtained 76.00003 electrons out of 76 for the reference volume at the static limit (i.e. 0 GPa 76
and no zero-point and thermal pressures due to vibrational effects included; see Prencipe et al. 77
2011). The localized contracted atomic basis sets used were 8-6411(d311f) and 8-411d11f (Erba 78
and Dovesi 2013; Peintinger et al. 2013) for Ti and O, respectively. 79
Within the CRYSTAL code, the accuracy in evaluating the Coulomb and Hartree–Fock exchange 80
series is controlled by the keyword TOLINTEG, for which we set the five parameters to 10 (T1, 81
T2, T3 and T4) and 24 (T5) (Dovesi et al. 2014). The diagonalization of the Hamiltonian matrix 82
was performed at 18 independent k vectors in reciprocal space (Monkhorst and Pack 1976) by 83
setting the shrinking factor IS to 4 (Dovesi et al. 2014). Cell parameters and fractional coordinates 84
were optimized by analytical gradient methods, as implemented in CRYSTAL17 (Civalleri et al. 85
2001; Dovesi et al. 2014; Dovesi et al. 2018b). For hydrostatic simulations, lattice parameters and 86
fractional coordinates were optimized at the WC1LYP level (at the static limit), at pressures of 0, 87
3, 5 and 10 GPa using the keyword EXTPRESS. Geometry optimization was considered converged 88
when each component of the gradient (TOLDEG parameter in CRYSTAL17) was smaller than 89
0.00003 Hartree/ Bohr and displacements (TOLDEX) were smaller than 0.00012 Bohr with 90
respect to the previous step. For the non-hydrostatic simulations, the cell was fixed at the chosen 91
strain conditions and only the fractional coordinates were optimized with the keyword 92

5
ATOMONLY (Civalleri et al. 2001; Dovesi et al. 2014). The chosen values of strains are large 93
enough to provide changes in frequency of vibrational modes that are significantly above the level 94
of the numerical noise in the simulations. These values also cover the range of strains expected to 95
be found in rutile inclusions. All simulations preserved the tetragonal symmetry of rutile. 96
Vibrational wavenumbers of all of the normal modes were calculated at the Г point within the limit 97
of the harmonic approximation, by diagonalizing a mass-weighted Hessian matrix, whose elements 98
are the second derivatives of the full potential of the crystal with respect to the mass-weighted 99
atomic displacements (Pascale et al. 2004). 100
Structural and vibrational data for all of the simulations, performed at the static limit, are reported 101
in the deposited crystallographic information file (cif). The space group symmetry of rutile, TiO2, 102
is P42/mnm with a primitive unit cell containing 6 atoms. This gives rise to 18 crystal normal 103
phonons in rutile, three of which are acoustic phonons and have zero wavenumber at the Brillouin-104
zone center. Hence, the representation of the remaining 15 optic phonons at the center of the 105
Brillouin zone is: 106
Гopt= 1A1g+1A2g+1A2u+ 1B1g+1B2g+2B1u+1Eg+3Eu 107
The A2g, A2u, B1u and Eu modes are only infrared-active, while the A1g mode is non-polar and only 108
Raman active together with the B1g, B2g and the doubly degenerate Eg mode. Since rutile is 109
centrosymmetric the transverse and longitudinal optical polarizations of the Eg mode have the same 110
frequency. 111
Raman spectroscopy 112
Rutile Raman spectra of both intergranular grains and inclusions in garnet were collected from 113
eclogite sample SL501 from Pohorje Mountains (Eastern Alps, Slovenia, Vrabec et al. 2012). Two 114

6
reference rutile crystals were measured as standards. One intergranular rutile was measured to 115
have a reference with the same chemical composition as the inclusions. A further crystal of 116
unknown provenance was selected from the mineralogical collection of the Department of Earth 117
and Environmental Sciences at the University of Pavia to have another standard free crystal of 118
rutile. 119
Raman spectra were collected with a Horiba LabRam HR Evolution spectrometer (holographic 120
gratings of 1800 grooves/mm) equipped with an Olympus BX41 confocal microscope at the 121
controlled temperature of 20(1)°C. Raman spectra were excited by the 532 nm line of a solid state 122
(YAG) laser. The laser power on the sample surface was approximately 1-2 mW. The spectrometer 123
was calibrated to the silicon Raman peak at 520.5 cm–1. The spectral resolution was ~ 2 cm−1 and 124
the instrumental reproducibility in determining the peak positions was ~ 0.5 cm−1. The OriginPro® 125
2018 software package was used for data evaluation. The collected spectra were baseline corrected 126
for the continuum luminescence background and normalized to the acquisition time. Peak 127
positions, full-widths at half maximum (FWHMs), and integrated intensities were determined from 128
fits with pseudo-Voigt functions [pV=(1-q)*Lorentz+q*Gauss, where q is the weight coefficient]. 129
The change in the peak position, hereafter Δω (cm-1), is calculated as the difference between the 130
wavenumber of the peak of the sample inclusion crystal (ωi) and the peak position of the unstrained 131
reference crystal (ω0) used as the standard. To avoid changes in peak position due to instrumental 132
drift and/or minor changes to room temperature affecting Δω, the unstrained standard of the rutile 133
was measured multiple times per session. The ω0 values were averaged and then subtracted from 134
the ωi of the strained inclusions analyzed in between two consecutive standard measurements to 135
obtain Δω. 136
Results 137

7
Structure at the static limit 138
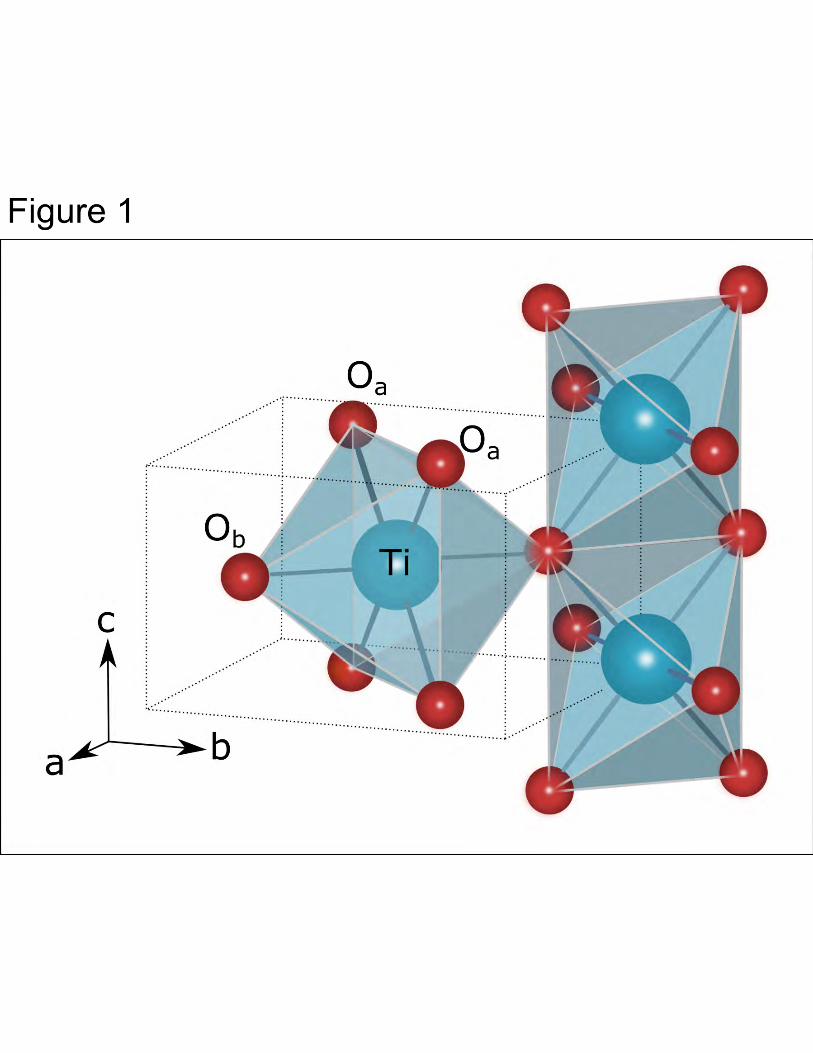
The structure of rutile consists of chains of TiO6 octahedra parallel to c axis (Fig. 1). Each chain 139
is built by octahedra each of which shares two opposite edges with adjacent octahedra. The 140
structure has one unique titanium and oxygen position and two non-equivalent nearest neighbor 141
Ti-O distances with the longer two (Ti-Ob) oriented perpendicular to the c-axis and the shorter four 142
Ti-Oa lying in the <110> plane. Lattice and structural parameters (atomic coordinates, bonds and 143
angles, Table 1) determined via ab initio simulations at the static limit (0 K, 0 GPa static pressure) 144
are in good agreement with those from Burdett et al. (1987) determined by neutron diffraction 145
measurements at 15K (Table 1, column “tw-b” – the difference between the results of this work 146
and the results of Burdett et al. (1987), columns “this work” and “b” respectively). 147
Hydrostatic calculations of the lattice parameters (V/V0, a/a0, c/c0) reproduced correctly the pattern 148
of anisotropy of the elasticity of rutile, with the c-axis being much stiffer than the a and b-axes 149
(Fig. 2b,c). The zero-pressure bulk modulus determined by fitting the volumes from the hydrostatic 150
simulations against static pressures with a 3rd order Birch-Murnaghan equation of state (BM3-151
EoS), is 233.78(24) GPa with the 𝐾′ = 4.54(5). The calculated bulk modulus is stiffer than that 152
determined by Zaffiro et al. (2019) and Angel et al. (2020) from the available data in the literature 153
(K0T = 205.14(15) GPa, 𝐾′=6.9(4)), obtained by using the same EoS, partially because our 154
simulations are performed at the static limit and therefore do not account either for the zero-point 155
pressure nor for thermal pressure that would soften the bulk modulus on passing from 0K to 300K 156
(Prencipe et al. 2011). In addition, the rutile structure has a soft mode whose effect on the bulk 157
modulus will not be accounted for in our static DFT simulations. The intrinsic anharmonicity of 158
the soft mode would cause a further reduction of the calculated K0T. This effect was observed for 159
the soft mode in quartz (e.g. Demuth et al. 1999; Kimizuka et al. 2003). 160

8
Structure under various strain conditions 161
Under hydrostatic conditions the structures simulated by HF/DFT show a smooth compression of 162
all structural parameters with increasing pressure (hydrostatic pressure trend is marked by the 163
dotted line in Fig. 3). Figure 3 shows the change of various structural parameters of rutile under 164
non-symmetry-breaking strains. The strain definition used is Lagrangian infinitesimal and the 165
reference system for the strains coincides with the unit-cell axes. Therefore, 𝜀! = ""!− 1 166
represents the fractional change of the c axis relative to the unstrained reference state at zero 167
pressure, with cell parameters a0 and c0. To maintain tetragonal symmetry, the strains e1 and e2 168
were constrained to be equal, and the contour maps are therefore plotted with 2e1=e1+e2 as the x-169
axis. A negative strain therefore corresponds to a compression of the corresponding axis, and the 170
lower left quadrant of the contour plots represents compression of all three axes of the unit cell of 171
rutile. The top left quadrant represents conditions of shear strain, equivalent to expansion of the c 172
axis and isotropic compression in the a-b plane. The bottom right quadrant represents the opposite 173
sense of shear strains. 174
Shortening of the Ti-O bonds with negative e1 and e3 strains is explained by geometrical orientation 175
of the bonds: Ti-Ob is parallel to the a-b plane while Ti-Oa has a smaller angle with the c axis (Fig. 176
1). In contrast values of the bond angles display a strong dependence on the deviatoric strain with 177
the Ti-O-Ti(1) being the less sensitive, whereas polyhedral volume contours are parallel to the 178
isochors (Fig. 3c). This pattern of structural behavior is similar to that of quartz and zircon (Murri 179
et al. 2019; Stangarone et al. 2019), demonstrating that non-hydrostatic stresses in the most 180
common mineral inclusions found in garnet hosts are mostly accommodated by internal angular 181
distortion and deformation of the polyhedra (i.e. SiO4 tetrahedra, ZrO8 polyhedra and TiO6 182
octahedra). These studies show that the dominant structural response of crystal structures under 183

9
deviatoric stress is shear deformation of the strongly bonded cation-oxygen polyhedra and, where 184
this is allowed by the topology of the structure, as in quartz (Murri et al. 2019), the tilting of the 185
polyhedra with respect to one another. 186
Raman spectrum 187
Experimentally-determined Raman spectra of rutile consist of four easily-detectable bands: one 188
low intensity sharp peak at 142 cm-1 (B1g), a broad band centered at 230 cm-1 (multi-phonon 189
interaction process, Porto et al. 1967), a medium intensity band at 445 cm-1 (Eg) and a strong band 190
at 609 cm-1 (A1g). Moreover, from the factor group analysis (see Methods section), one B2g mode 191
is also Raman active. This occurs at 801 cm-1, but it is usually hard to detect due to its very low 192
intensity and broad character (Fig. 4). On the other hand, while frequency calculations based on 193
the DFT simulations do not suffer detection limits due to weak intensities or broad peak widths as 194
do experiments, they do not include phonon-phonon interaction processes. Therefore, the broad 195
band at 230 cm-1 is not reported in the calculated Raman spectra. Calculated Raman frequencies 196
at the reference state (0 GPa static limit and 0 K) are reported in Table 2 together with the measured 197
Raman frequencies on our ‘standard’ rutile from Pohorje (peak positions of the two selected 198
standards are the same within the instrumental reproducibility of ~ 0.5 cm-1) and literature data 199
which includes both theoretical and experimental data. Values of the calculated peak positions at 200
0K differ slightly from the experimental results at room temperature, due to the difference in 201
temperature and the specifics of the calculation method. Ab initio hybrid HF/DFT calculations 202
with the WC1LYP functional proved, on average, to be more effective in reproducing vibrational 203
frequencies than other methods (Prencipe 2012, 2019). Frequencies calculated with WC1LYP for 204
the Eg, A1g and B2g modes are all within the range of experimental uncertainty. The significant 205

10
discrepancy occurs with the experimental value of the B1g mode because it is a low frequency 206
partially anharmonic mode, for which the computational uncertainties are larger. 207
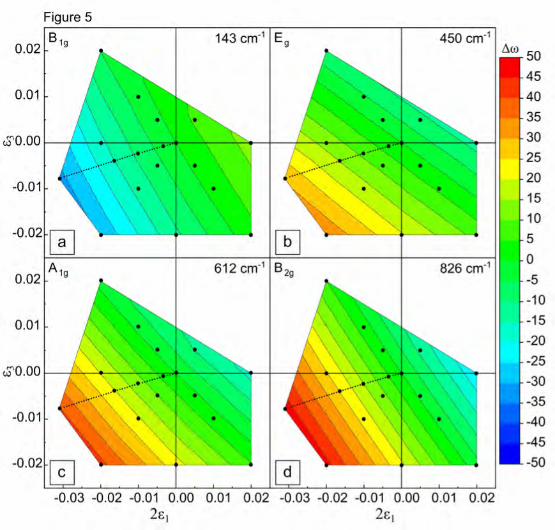
Figure 5 displays the calculated Δω (cm-1) of the rutile Raman active modes (black solid lines) as 208
a function of the two independent strain components. The Eg, A1g and B2g modes display an 209
increase of their vibrational frequencies with increase of negative strains. Their behavior could be 210
seen to be almost linear within the studied strain field. According to the calculated displacement 211
vectors from the DFT simulations, the Eg mode involves the vibrations along the c axis of the Ob 212
atoms (Figure 1) with the Oa atoms remaining fixed (one of the possible displacement geometries). 213
The A1g and the B2g modes correspond to the movements of the oxygen atoms in the a-b planes 214
which includes Ti-Ob stretching and Oa-Ti-Oa scissoring in the <110> plane. The B1g mode has an 215
opposite behavior with respect to all of the other modes in that it displays negative shifts under 216
compression (Fig. 5a). This anomalous behavior has already been described in the literature and 217
is related to the pressure-induced structural phase transitions in rutile (Samara and Peercy 1973). 218
The B1g mode corresponds to rotational vibrations of the octahedra around the c axis. The 219
directions of the rotations between adjacent octahedra are opposite to one another so this mode 220
represents a distortion of the octahedral chains involving only oxygen atom motions in the a-b 221
plane. Softening of the B1g optic mode drives a ferroelastic transition in which the symmetry is 222
reduced from P42/mnm to Pnnm that also occurs at high pressures in several other compounds (e.g. 223
stishovite, Carpenter et al. 2000) that have the rutile structure type. 224
Grüneisen tensor 225
Since the contour lines of equal Δω (cm-1) (black solid lines in the plots in Fig. 5) are equally-226
spaced, straight and parallel to one-another, the dependence of all of the Raman modes of rutile on 227
strain is linear. Therefore, the phonon-mode Grüneisen tensor approach can be applied in order to 228
11
determine the Grüneisen tensor components for each Raman active mode. These will allow the 229
strains in crystals to be determined from measured Δω (cm-1) and vice versa. The phonon-mode 230
Grüneisen tensor 𝜸𝒎 is a second rank symmetric property tensor (e.g. Ziman 1960; Key 1967; 231
Cantrell 1980; Angel et al. 2019) characteristic of each phonon mode m. Therefore, since only 232
non-symmetry-breaking strains are considered, it obeys the symmetry constraints of the studied 233
system. Rutile is tetragonal with non-symmetry-breaking strains restricted to ε1= ε2≠ ε3 and, as a 234
consequence, there are only two symmetry-independent Grüneisen components to be determined 235
for each Raman active mode: 𝛾$%and 𝛾!%
.Thus, the relationship between the wavenumber shifts 236
of the Raman modes of rutile and the strains can be written in terms of the Grüneisen tensor as: 237
− ∆(()= 2γ$%ε$ + γ!%ε! (1) 238
We determined the phonon-mode Grüneisen tensor components γ$% and γ!% for each Raman-active 239
mode of rutile by a least-squares fit of the calculated Δω (cm-1) as a function of the strains. The 240
reference values of w0 were taken from our measurements on the standard intergranular rutile from 241
Pohorje (Slovenia). 242
In order to validate the calculated values of the symmetry-independent components of the mode 243
Grüneisen tensors we used them along with measured unit-cell strains under pressure to predict 244
the Raman shift changes under pressure (Figure 6). The available Raman data in the literature are 245
only presented in the form of pressure derivatives (Dw/P coefficients) and not measurements of 246
individual data. The pressure interval of the experiments was 0-4 GPa (Nicol and Fong 1971; 247
Samara and Peercy 1973), and in one case up to 40 GPa (Arashi 1992), but with a pressure medium 248
of 4:1 methanol-ethanol mixture which is hydrostatic only up to 9.8 GPa (Angel et al. 2007). We 249
have a good agreement for the B1g and A1g modes and our calculations for the Eg mode are 250

12
consistent with the experimental work done by Arashi (1992) over the larger interval of pressure. 251
The difference in behavior of the calculated Eg mode from the experimental data of Nicol and Fong 252
(1971) and Samara and Peercy (1973) might be due to its broader character and lower intensity 253
compared to that of the A1g mode. 254
Moreover, a linear behavior of the Raman modes with hydrostatic pressure is assumed when 255
constant Dw/P coefficients are used. However, the vibrational frequencies do not depend on the 256
pressure but on the strains (Key 1967) and in our work were found to be linear with volume. The 257
pressure dependence of the volume of rutile is described by the non-linear Burch-Murnaghan 258
equation of state of the third order (Zaffiro et al. 2019). Thus, fitting the Δω (cm-1) against pressure 259
with a linear equation is not correct. 260
Discussion 261
Garnet is one of the most common host minerals for rutile and many other key inclusions such as 262
quartz and zircon in metamorphic rocks. Quartz- and zircon-in-garnet elastic geobarometry has 263
been successfully used to reconstruct PT histories of metamorphic rocks (e.g. Gonzalez et al. 2019; 264
Alvaro et al. 2020). However, calculations based on the equations of state of garnet (Milani et al. 265
2015) and rutile indicate that rutile inclusions trapped inside garnets at typical metamorphic 266
conditions should exhibit negative residual pressures when measured at room conditions provided 267
they did not undergo some non-elastic process after entrapment (Zaffiro et al. 2019). Ab initio 268
calculations did not reveal any anomalous behavior of the structure in the studied range of strains 269
which could result in a deviation of the behavior described by the EoS, nor any non-linearity in 270
the Grüneisen relationship between strains and Raman peak shifts (Eqn. 1). 271

13
EoS calculations are confirmed by Raman measurements on both natural and synthetic samples. 272
Bonazzi et al. (2019) synthesized at 3 GPa and 775°C almost pure pyrope garnets with quartz and 273
rutile inclusions. We performed Raman measurements on the rutile inclusions from these samples 274
and according to these and our optical observations these synthetic rutile inclusions show no signs 275
of residual pressure. Moreover, pyrope megablasts from the Dora Maira UHP locality (Chopin and 276
Schertl 1999) are a good example of a natural garnet-rutile host inclusion system. Several rutile 277
inclusions that are found in the same growth zones as coesite inclusions in these garnets do not 278
show any sign of residual pressure: their Raman peaks are at the same wavenumbers as the free 279
reference crystal and there is no evidence for optical birefringence halos in the surrounding garnet 280
(N. Campomenosi, personal communication). These observations are consistent with our 281
simulation results and the thermodynamic calculations and indicate that rather than exhibiting 282
negative pressures, which would imply that the rutile inclusions are bound to the host garnet crystal 283
and stretched by it, the rutile inclusions are detached from the inclusion walls in the host garnet. 284
However, there are some rutile inclusions that appear to exhibit signs of residual pressure. For 285
example, rutile inclusions in garnet from an eclogite from the Pohorje HP locality (Slovenia) are 286
surrounded by a clearly distinguishable birefringence halo (Fig. 7). 287
This halo reflects the elastic deformation of the host garnet in the immediate vicinity of the 288
inclusion due to its elastic relaxation (Campomenosi et al. 2020). The phenomenon of relaxation 289
develops as a result of the differences between the thermo-elastic properties of the host and 290
inclusion phases that lead to the inclusion exhibiting a different pressure than the host. Therefore, 291
birefringence haloes around these rutile inclusions when their host is at room pressure indicate that 292
the inclusions are at some non-ambient pressure that cannot be caused solely by the contrast in 293
elastic properties between rutile and garnet. 294

14
Optical and Raman spectroscopic studies of rutile inclusions in garnet from Pohorje revealed the 295
presence of small amphibole crystals attached to each of the rutiles surrounded by a birefringence 296
halo (e.g. Fig 7a,d). Amphibole occurs as laminar crystals wrapping rutile grains, which makes it 297
hard to detect and determine a volume fraction. Raman 3D imaging allowed us to estimate that an 298
average volume fraction of amphibole in the inclusions exhibiting birefringence haloes is between 299
15 and 30 % of the inclusion volume (rutile + amphibole) (Fig. 8). Electron microprobe analyses 300
confirmed that the amphibole composition is close to the cummingtonite end member (Table S1). 301
The room-pressure bulk modulus of cummingtonite (Holland and Powell 2011) is 70 GPa, which 302
is less than half the bulk modulus of pyrope. If the inclusion were pure amphibole it would 303
therefore exhibit a positive residual inclusion pressure (Pinc) when examined in our sections. 304
The elastic properties of mixed-phase inclusions have Reuss and Voigt bounds. We used the Reuss 305
approximation as we expect the two phases to be under the same pressure rather than the same 306
strain (Voigt approximation). The Reuss bulk modulus depends on the volume fractions x1 and x2 307
of both components: 308
𝐾*+* = .,"-"+ ,#
-#/.$
(2) 309
On this basis, the presence of at least 14% in volume of cummingtonite is enough to reduce the 310
bulk modulus (at ambient conditions) of the mixture to less than that of the garnet (Fig 9). This 311
makes the inclusion softer than the host and should lead to the development of a positive inclusion 312
pressure upon exhumation. 313
The value of the relaxed inclusion pressure for the multiple phase inclusion can be calculated using 314
various approaches, for example an average EoS weighted by molar fractions. But this method is 315
inappropriate for the phases with contrasting elastic properties like rutile and amphibole because 316

15
it does not account correctly for the differences in 𝐾′ between the phases. Therefore, we developed 317
a methodology that is implemented in the MPHASE utility of EosFit7c (Angel et al. 2014a), in 318
which the volume of the mixture at all P and T is treated as the sum of the volumes of the individual 319
phases calculated from their EoS weighted by their molar fractions. This calculation therefore 320
treats the inclusion as a closed system of fixed composition under uniform stress. The orange and 321
green curves in Figure 9 show variation of the Pinc value over the range of all possible amphibole 322
fractions in a cummingtonite+rutile inclusion for the entrapment conditions of 3 GPa 800°C and 2 323
GPa 600°C. Different entrapment conditions within the range of regional metamorphism lead to a 324
different slope of this curve, but it always crosses the point of zero Pinc at approximately 0.14 325
volume fraction of the amphibole component. A mixture of ~14 volume % of an cummingtonite 326
and ~86 % of a rutile has the same bulk modulus as a pyrope garnet, therefore Pinc should be 327
approximately zero in the interval from 13 to 15 vol.% of cummingtonite (variation of 1 vol.% for 328
the different entrapment conditions). Inverse calculations of the entrapment conditions of such 329
composite inclusions therefore require a precise measurement of the volume fractions of the phases 330
and the value of the Pinc, as well as the composition of the amphibole as the bulk modulus and EoS 331
of amphiboles varies with composition. 332
The multiphase inclusion from Pohorje eclogite with 30 vol.% of cummingtonite amphibole can 333
exhibit up to 0.28 GPa of a residual pressure according to the calculated Pinc curves, which is 334
consistent with the presence of birefringence haloes in the host around these inclusions. Changes 335
in the Raman peak positions (Δ𝜔, cm-1) in the rutile spectrum corresponding to this pressure 336
however are impossible to resolve as they are less than the typical measurement uncertainties. 337
However, amphibole Raman Δ𝜔 (cm-1) could be used to detect the residual pressure but for this a 338
reliable pressure calibration is needed. 339

16
Implications 340
Ab initio calculations of elastic and vibrational properties of rutile predicted a linear response of 341
its structural parameters and vibrational frequencies to strains. We determined the symmetry-342
independent components of the phonon-mode Grüneisen tensors for the rutile Raman active modes 343
that can be used in Raman elastic geobarometry calculations. Our DFT calculations succeeded in 344
predicting the anomalous behavior of the soft B1g mode. Thus, we confirm that a compressional 345
strain causes a negative shift of the lowest-frequency Raman mode (141.6 cm-1) of rutile. 346
Thermodynamic calculations predict a negative Pinc for rutile inclusions entrapped in garnet at HP 347
conditions, therefore we would expect a positive peak shift for the B1g mode and negative peak 348
shifts for the other Raman modes in rutile. However, this behavior has not been observed so far, 349
and pure rutile inclusions have zero pressures in both natural and synthetic samples. On the other 350
hand, we demonstrated that detecting a positive Pinc in some rutile inclusions is theoretically 351
possible due to softening of the overall inclusion bulk modulus. Extensive radiation damage to 352
rutile or the presence of a second phase, softer than rutile and garnet (e.g. amphibole), can modify 353
the bulk modulus of the inclusion enough to reverse the contrast of elastic properties to the host 354
garnet. Here, we described a method to calculate the elastic properties of multiphase inclusions 355
with the EoSFit-7c software (Angel et al. 2014a). The results of our calculations can be used as a 356
control for the presence of plastic deformation, radiation damage or the vicinity of another phase 357
in case where a residual pressure in the inclusion or a birefringence halo is detected. 358
Elastic geobarometry can still be used for rutile inclusions in other hosts with more contrasting 359
elastic properties such as quartz or diamond (Angel et al. 2015, 2017). Even though quartz is softer 360
than rutile at room P and T, a window of positive Pinc occurs for rutile inclusions entrapped at low 361

17
P (up to 0.7 GPa) and medium-high T (200-700 °C) conditions under the zero-pressure entrapment 362
isomeke (Fig. S1a). Rutile inclusions in diamond will exhibit positive Pinc if entrapped above the 363
zero isomeke (Fig. S1b) corresponding to low T and high P conditions. For example, a Pinc of 1 364
GPa, corresponding to a 0.4 % volume strain, will cause the Raman modes B1g, Eg, A1g and B2g to 365
shift -3.2, 3.1, 4.2 and 5.2 cm-1, respectively. These Dw values are significantly above the 366
measurement uncertainties caused by line broadening and thus residual pressures of rutile 367
inclusions in diamonds could be detected by Raman measurements. 368
In cases of a positive inclusion pressure, a strained rutile inclusion will display a negative Δ𝜔cm-1 369
for the B1g mode and positive Δ𝜔cm-1 for the other Raman modes. However, it is important to 370
remember that in anisotropic hosts the differences from the hydrostatic calibration depend on the 371
reciprocal orientation of host and inclusion. The problem of orientation is partially solved in case 372
of rutile inclusions that have exsolved from the host phase. They are usually tiny needles of 373
acicular rutile, oriented along crystallographic axes of the host phase. The process of the 374
decomposition of a Ti-rich solid solution leads to the formation of coherent inclusions (e.g. Zhang 375
et al. 2003; Proyer et al. 2013). Understanding the influence of this coherency on the resulting 376
strains in a host-inclusion system is now possible with an application of these newly calculated 377
symmetry-independent components of the phonon-mode Grüneisen tensors. 378
Acknowledgments 379
This project received funding from the European Research Council under the European Union’s 380
Horizon 2020 research and innovation program grant agreement 714936 TRUE DEPTHS to 381
Matteo Alvaro. The authors thank Hugo Van Schrojenstein Lantman for the samples from Pohorje 382

18
and electron microprobe analyses, and Mattia Bonazzi and Nicola Campomenosi for discussions 383
about Raman data of rutile inclusions in garnet. 384

19
References 385
Abrahams, S.C., and Bernstein, J.L. (1971) Rutile: Normal Probability Plot Analysis and Accurate 386 Measurement of Crystal Structure. The Journal of Chemical Physics, 55, 3206–3211. 387
Alvaro, M., Mazzucchelli, M.L., Angel, R.J., Murri, M., Campomenosi, N., Scambelluri, M., 388 Nestola, F., Korsakov, A., Tomilenko, A.A., Marone, F., and others (2020) Fossil 389 subduction recorded by quartz from the coesite stability field. Geology, 48, 24–28. 390
Angel, R.J., Bujak, M., Zhao, J., Gatta, G.D., and Jacobsen, S.D. (2007) Effective hydrostatic 391 limits of pressure media for high-pressure crystallographic studies. Journal of Applied 392 Crystallography, 40, 26–32. 393
Angel, R.J., Alvaro, M., and Gonzalez-Platas, J. (2014a) EosFit7c and a Fortran module (library) 394 for equation of state calculations. Zeitschrift für Kristallographie - Crystalline Materials, 395 229, 405–419. 396
Angel, R.J., Mazzucchelli, M.L., Alvaro, M., Nimis, P., and Nestola, F. (2014b) Geobarometry 397 from host-inclusion systems: The role of elastic relaxation. American Mineralogist, 99, 398 2146–2149. 399
Angel, R.J., Alvaro, M., Nestola, F., and Mazzucchelli, M.L. (2015) Diamond thermoelastic 400 properties and implications for determining the pressure of formation of diamond-inclusion 401 systems. Russian Geology and Geophysics, 56, 211–220. 402
Angel, R.J., Alvaro, M., Miletich, R., and Nestola, F. (2017) A simple and generalised P–T–V EoS 403 for continuous phase transitions, implemented in EosFit and applied to quartz. 404 Contributions to Mineralogy and Petrology, 172, 29. 405
Angel, R.J., Murri, M., Mihailova, B., and Alvaro, M. (2019) Stress, strain and Raman shifts. 406 Zeitschrift für Kristallographie - Crystalline Materials, 234, 129–140. 407
Angel, R.J., Alvaro, M., Schmid-Beurmann, P., and Kroll, H. (2020) Commentary on “Constraints 408 on the Equations of State of stiff anisotropic minerals: rutile, and the implications for rutile 409 elastic barometry” [Miner. Mag. 83 (2019) pp. 339–347]. Mineralogical Magazine, 84, 410 339–347. 411
Arashi, H. (1992) Raman spectroscopic study of the pressure-induced phase transition in TiO2. 412 Journal of Physics and Chemistry of Solids, 53, 355–359. 413
Bonazzi, M., Tumiati, S., Thomas, J.B., Angel, R.J., and Alvaro, M. (2019) Assessment of the 414 reliability of elastic geobarometry with quartz inclusions. Lithos, 350–351, 105201. 415
Burdett, J.K., Hughbanks, T., Miller, G.J., Richardson, J.W., and Smith, J.V. (1987) Structural-416 electronic relationships in inorganic solids: powder neutron diffraction studies of the rutile 417 and anatase polymorphs of titanium dioxide at 15 and 295 K. Journal of the American 418 Chemical Society, 109, 3639–3646. 419

20
Campomenosi, N., Mazzucchelli, M.L., Mihailova, B., Scambelluri, M., Angel, R.J., Nestola, F., 420 Reali, A., and Alvaro, M. (2018) How geometry and anisotropy affect residual strain in 421 host-inclusion systems: Coupling experimental and numerical approaches. American 422 Mineralogist, 103, 2032–2035. 423
Campomenosi, N., Mazzucchelli, M.L., Mihailova, B.D., Angel, R.J., and Alvaro, M. (2020) 424 Using polarized Raman spectroscopy to study the stress gradient in mineral systems with 425 anomalous birefringence. Contributions to Mineralogy and Petrology, 175, 16. 426
Cantrell, J.H. (1980) Generalized Grüneisen tensor from solid nonlinearity parameters. Physical 427 Review B, 21, 4191–4195. 428
Carpenter, M.A., Hemley, R.J., and Mao, H. (2000) High-pressure elasticity of stishovite and the 429 P42/mnm ⇌ Pnnm phase transition. Journal of Geophysical Research: Solid Earth, 105, 430 10807–10816. 431
Carruzzo, S., Clarke, D.B., Pelrine, K.M., and MacDonald, M.A. (2006) Texture, composition, 432 and origin of rutile in the South Mountain batholith, Nova Scotia. The Canadian 433 Mineralogist, 44, 715–729. 434
Černý, P., Novak, M., Chapman, R., and Ferreira, K.J. (2007) Subsolidus behavior of niobian rutile 435 from the Pisek region, Czech Republic: a model for exsolution in W- and Fe2+>>Fe3+-rich 436 phases. Journal of Geosciences, 52, 143–159. 437
Černý, P., Chapman, R., Simmons, W.B., and Chackowsky, L.E. (2015) Niobian rutile from the 438 McGuire granitic pegmatite, Park County, Colorado: Solid solution, exsolution, and 439 oxidation. American Mineralogist, 84, 754–763. 440
Chopin, C., and Schertl, H.-P. (1999) The UHP Unit in the Dora-Maira Massif, Western Alps. 441 International Geology Review, 41, 765–780. 442
Civalleri, B., D’Arco, Ph., Orlando, R., Saunders, V.R., and Dovesi, R. (2001) Hartree–Fock 443 geometry optimisation of periodic systems with the Crystal code. Chemical Physics 444 Letters, 348, 131–138. 445
Demuth, T., Jeanvoine, Y., Hafner, J., and Ángyán, J.G. (1999) Polymorphism in silica studied in 446 the local density and generalized-gradient approximations. Journal of Physics: Condensed 447 Matter, 11, 3833–3874. 448
Dovesi, R., Saunders, V.R., Roetti, C., Orlando, R., Zicovich Wilson, C.M., Pascale, F., Civalleri, 449 B., Doll, K., Harrison, N.M., Bush, I.J., and others (2014) CRYSTAL14. 450
Dovesi, Roberto, Saunders, V.R., Roetti, C., Orlando, R., Zicovich-Wilson, C.M., Pascale, F., 451 Civalleri, B., Doll, K., Harrison, N.M., Bush, I.J., and others (2018) CRYSTAL17 User’s 452 Manual, 461 p. 453

21
Dovesi, R., Erba, A., Orlando, R., Zicovich‐Wilson, C.M., Civalleri, B., Maschio, L., Rérat, M., 454 Casassa, S., Baima, J., Salustro, S., and others (2018) Quantum-mechanical condensed 455 matter simulations with CRYSTAL. WIREs Computational Molecular Science, 8, 1360. 456
Erba, A., and Dovesi, R. (2013) Photoelasticity of crystals from theoretical simulations. Physical 457 Review B, 88, 045121. 458
Ferry, J.M., and Watson, E.B. (2007) New thermodynamic models and revised calibrations for the 459 Ti-in-zircon and Zr-in-rutile thermometers. Contributions to Mineralogy and Petrology, 460 154, 429–437. 461
Gonzalez, J.P., Thomas, J.B., Baldwin, S.L., and Alvaro, M. (2019) Quartz-in-garnet and Ti-in-462 quartz thermobarometry: Methodology and first application to a quartzofeldspathic gneiss 463 from eastern Papua New Guinea. Journal of Metamorphic Geology, 37, 1193–1208. 464
Henderson, C.M.B., Knight, K.S., and Lennie, A.R. (2009) Temperature dependence of rutile 465 (TiO2) and geikielite (MgTiO3) structures determined using neutron powder diffraction. 466 The Open Mineralogy Journal, 3, 1–11. 467
Holland, T.J.B., and Powell, R. (2011) An improved and extended internally consistent 468 thermodynamic dataset for phases of petrological interest, involving a new equation of 469 state for solids. Journal of Metamorphic Geology, 29, 333–383. 470
Key, S.W. (1967) Grüneisen Tensor for Anisotropic Materials. Journal of Applied Physics, 38, 471 2923–2928. 472
Kimizuka, H., Kaburaki, H., and Kogure, Y. (2003) Molecular-dynamics study of the high-473 temperature elasticity of quartz above the \ensuremath{\alpha}-\ensuremath{\beta} phase 474 transition. Physical Review B, 67, 024105. 475
Lan, T., Tang, X., and Fultz, B. (2012) Phonon anharmonicity of rutile TiO2 studied by Raman 476 spectrometry and molecular dynamics simulations. Physical Review B, 85, 094305. 477
Lan, T., Li, C.W., Hellman, O., Kim, D.S., Muñoz, J.A., Smith, H., Abernathy, D.L., and Fultz, 478 B. (2015) Phonon quarticity induced by changes in phonon-tracked hybridization during 479 lattice expansion and its stabilization of rutile TiO2. Physical Review B, 92, 054304. 480
Lee, C., Yang, W., and Parr, R.G. (1988) Development of the Colle-Salvetti correlation-energy 481 formula into a functional of the electron density. Physical Review B, 37, 785–789. 482
Meinhold, G. (2010) Rutile and its applications in earth sciences. Earth-Science Reviews, 102, 1–483 28. 484
Merle, P., Pascual, J., Camassel, J., and Mathieu, H. (1980) Uniaxial-stress dependence of the first-485 order Raman spectrum of rutile. I. Experiments. Physical Review B, 21, 1617–1626. 486

22
Milani, S., Nestola, F., Alvaro, M., Pasqual, D., Mazzucchelli, M.L., Domeneghetti, M.C., and 487 Geiger, C.A. (2015) Diamond–garnet geobarometry: The role of garnet compressibility 488 and expansivity. Lithos, 227, 140–147. 489
Mitev, P.D., Hermansson, K., Montanari, B., and Refson, K. (2010) Soft modes in strained and 490 unstrained rutile TiO2. Physical Review B, 81, 134303. 491
Momma, K., and Izumi, F. (2008) VESTA: a three-dimensional visualization system for electronic 492 and structural analysis. Journal of Applied Crystallography, 41, 653–658. 493
Monkhorst, H.J., and Pack, J.D. (1976) Special points for Brillouin-zone integrations. Physical 494 Review B, 13, 5188–5192. 495
Montanari, B., and Harrison, N.M. (2002) Lattice dynamics of TiO2 rutile: influence of gradient 496 corrections in density functional calculations. Chemical Physics Letters, 364, 528–534. 497
Murri, M., Mazzucchelli, M.L., Campomenosi, N., Korsakov, A.V., Prencipe, M., Mihailova, 498 B.D., Scambelluri, M., Angel, R.J., and Alvaro, M. (2018) Raman elastic geobarometry for 499 anisotropic mineral inclusions. American Mineralogist, 103, 1869–1872. 500
Murri, M., Alvaro, M., Angel, R.J., Prencipe, M., and Mihailova, B.D. (2019) The effects of non-501 hydrostatic stress on the structure and properties of alpha-quartz. Physics and Chemistry 502 of Minerals, 46, 487–499. 503
Nicol, M., and Fong, M.Y. (1971) Raman spectrum and polymorphism of titanium dioxide at high 504 pressures. The Journal of Chemical Physics, 54, 3167–3170. 505
Pascale, F., Zicovich‐Wilson, C.M., Gejo, F.L., Civalleri, B., Orlando, R., and Dovesi, R. (2004) 506 The calculation of the vibrational frequencies of crystalline compounds and its 507 implementation in the CRYSTAL code. Journal of Computational Chemistry, 25, 888–508 897. 509
Peintinger, M.F., Oliveira, D.V., and Bredow, T. (2013) Consistent Gaussian basis sets of triple-510 zeta valence with polarization quality for solid-state calculations. Journal of Computational 511 Chemistry, 34, 451–459. 512
Porto, S.P.S., Fleury, P.A., and Damen, T.C. (1967) Raman Spectra of TiO2, MgF2, ZnF2, FeF2, 513 and MnF2. Physical Review, 154, 522–526. 514
Prencipe, M. (2012) Simulation of vibrational spectra of crystals by ab initio calculations: an 515 invaluable aid in the assignment and interpretation of the Raman signals. The case of 516 jadeite (NaAlSi2O6). Journal of Raman Spectroscopy, 43, 1567–1569. 517
——— (2019) Quantum mechanics in Earth sciences: a one-century-old story. Rendiconti Lincei. 518 Scienze Fisiche e Naturali, 30, 239–259. 519
Prencipe, M., Scanavino, I., Nestola, F., Merlini, M., Civalleri, B., Bruno, M., and Dovesi, R. 520 (2011) High-pressure thermo-elastic properties of beryl (Al4Be6Si12O36) from ab initio 521

23
calculations, and observations about the source of thermal expansion. Physics and 522 Chemistry of Minerals, 38, 223–239. 523
Proyer, A., Habler, G., Abart, R., Wirth, R., Krenn, K., and Hoinkes, G. (2013) TiO2 exsolution 524 from garnet by open-system precipitation: evidence from crystallographic and shape 525 preferred orientation of rutile inclusions. Contributions to Mineralogy and Petrology, 166, 526 211–234. 527
Rosenfeld, J.L., and Chase, A.B. (1961) Pressure and temperature of crystallization from elastic 528 effects around solid inclusions in minerals? American Journal of Science, 259, 519–541. 529
Samara, G.A., and Peercy, P.S. (1973) Pressure and Temperature Dependence of the Static 530 Dielectric Constants and Raman Spectra of TiO2 (Rutile). Physical Review B, 7, 1131–531 1148. 532
Stangarone, C., Tribaudino, M., Prencipe, M., and Lottici, P.P. (2016) Raman modes in Pbca 533 enstatite (Mg2Si2O6): an assignment by quantum mechanical calculation to interpret 534 experimental results. Journal of Raman Spectroscopy, 47, 1247–1258. 535
Stangarone, C., Angel, R.J., Prencipe, M., Campomenosi, N., Mihailova, B., and Alvaro, M. 536 (2019) Measurement of strains in zircon inclusions by Raman spectroscopy. European 537 Journal of Mineralogy, 685–694. 538
Sugiyama, K., and Takéuchi, Y. (2015) The crystal structure of rutile as a function of temperature 539 up to 1600° C. Zeitschrift für Kristallographie - Crystalline Materials, 194, 305–314. 540
Vrabec, M., Janák, M., Froitzheim, N., and De Hoog, J.C.M. (2012) Phase relations during peak 541 metamorphism and decompression of the UHP kyanite eclogites, Pohorje Mountains 542 (Eastern Alps, Slovenia). Lithos, 144–145, 40–55. 543
Wu, Z., and Cohen, R.E. (2006) More accurate generalized gradient approximation for solids. 544 Physical Review B, 73, 235116. 545
Zaffiro, G., Angel, R.J., and Alvaro, M. (2019) Constraints on the Equations of State of stiff 546 anisotropic minerals: rutile, and the implications for rutile elastic barometry. Mineralogical 547 Magazine, 83, 339–347. 548
Zhang, R.Y., Zhai, S.M., Fei, Y.W., and Liou, J.G. (2003) Titanium solubility in coexisting garnet 549 and clinopyroxene at very high pressure: the significance of exsolved rutile in garnet. Earth 550 and Planetary Science Letters, 216, 591–601. 551
Ziman, J.M. (1960) Electrons and Phonons, the International Series of Monographs on Physics. 552 Oxford University, London, UK. 553
554
555

24
List of figure captions 556
Figure 1. Rutile structure model in three dimensions. Blue spheres in octahedral coordination 557
represent Ti atoms, red spheres represent O atoms. Bonds are represented by dark-gray lines. The 558
unit cell of rutile is indicated by the dashed lines. Structure was drawn with the VESTA software 559
(Momma and Izumi 2008) based on the ab initio calculation at the static limit 560
Figure 2. Lattice parameters and volume of rutile as a function of pressure. 561
Figure 3. Contour maps of structural parameters of rutile as a function of strains e1 and e3. Strains 562
derived from the hydrostatic pressure simulations lie along the dotted line and represent pressure 563
conditions of 0, 1, 3, 5, and 10 GPa; zero pressure is at the origin of all of these plots. 564
Figure 4. Raman spectra of the two natural rutile samples used as standards (rutile standard free 565
crystal and intergranular rutile standard from the Pohorje eclogite). 566
Figure 5. Calculated wavenumber shifts (cm-1) of the Raman-active modes of rutile. Strains 567
derived from the hydrostatic pressure simulations lie along the dotted line and represent pressure 568
conditions of 0, 1, 3, 5, and 10 GPa from right to left. 569
Figure 6. Predictions of the pressure-induced Raman shifts from the mode Grüneisen tensors 570
(solid black lines) compared to Dw/P coefficients from literature (colored dotted lines). 571
Figure 7. Composite rutile + amphibole inclusions in garnet (eclogite from Pohorje massif). (a), 572
(b) – parallel polarized light (PPL) and crossed polarized light (XPL) microphotographs of the 573
inclusions with the surrounding birefringent halo. (c), (d) – Surface inclusion in garnet (XPL and 574
reflected light (RL) microphotographs). Birefringent halo is absent on the image (c) because the 575
stress is released as the inclusion is exposed (see Campomenosi et al. 2018 for details). 576

25
Figure 8. Raman imaging of a mixed rutile+amphibole inclusion along XZ and YZ planes. The 577
blue area in the image indicate the presence of the 671 cm-1 characteristic peak of amphibole, while 578
dark red and grey are related to the characteristic peaks at 141.6 and 917 cm-1 from rutile and 579
garnet, respectively. 580
Figure 9. Bulk modulus (red) and Pinc (orange and green) curves at room conditions of rutile plus 581
cummingtonite mixtures as a function of volume fraction of the amphibole. Negative Pinc values 582
are indicated with blue dots, while positive values with red and yellow dots. The bulk modulus 583
curve corresponds to the Reuss expression for the bulk modulus of the two-phase mixture. Values 584
of the Pinc are calculated for the entrapment condition at 3 GPa 800°C and at 2 GPa 600°C as an 585
example. The volume fraction of the amphibole (0.14) leading to a zero Pinc is also the composition 586
for which the bulk modulus of the inclusion is equal to that of the pyrope host. 587
588
589
590

26
Tables 591
592
593
594
Table 2. Frequencies (cm-1) of the Raman-active modes of rutile. This work a b c d e f
calc exp Pohorje
theoretical experimental
T (K) 0 298 0 0 300 298 298 298
Symmetry
B1g
163.98 141.6 137.0 130.0 169.0 143.0 143.0 143.0
Eg 453.83 445.28 463.2 457.0 400.0 450.0 449.0 447.0 A1g
600.03 609.32 611.6 601.0 558.0 612.0 612.0 612.0
B2g 818.96 801.79 824.7 805.0 803.0 826.0 826.0 826.0 Notes: a Montanari and Harrison 2002, b Mitev et al. 2010, c Lan et al. 2012, d Samara and Peercy 1973, e
Merle et al. 1980, f Porto et al. 1967. 595
596
Table 1. Lattice parameters, atomic coordinates, bonds and angles of rutile This work a b c d e f tw- b
T (K) 0 0 15 298 298 298 300 - Lattice parameters
a (Å) 4.59867 4.572 4.58666(4) 4.594 4.5924(2) 4.5923(3) 4.499 0.01201 c (Å) 2.95652 2.943 2.95407(3) 2.959 2.9575(2) 2.9576(3) 3.077 0.00245
V (Å3) 62.52389 61.52 62.15 62.432 62.38(1) 62.37 62.28 0.37389 Atomic coordinates
Ox 0.30485 0.30400 0.30469(6) 0.30500 0.30499(8) 0.3092(6) 0.30590 0.00016 Bonds and angles
Ti-Oa (Å) 1.9483 - 1.9459 (3) - 1.9470(2) 1.930(3) - 0.0024 Ti-Ob (Å) 1.9826 - 1.9764 (4) - 1.9808(3) 2.008(4) - 0.0062
Ti-O-Ti (°) 130.648 - 130.62 (1) - 130.58 (1) 129.97(9) - 0.028 Oa-Ti-Oa (°) 81.296 - 81.24 (2) - 81.16(1) 79.93(18) - 0.055 Ti-O-Ti (°) 98.704 - 98.76 (2) - - - - -0.055
Ob-Ti-Ob (°) 98.704 - 98.76 (2) - - - - -0.055 Notes: a Mitev et al. 2010, b Burdett et al. 1987, c Abrahams and Bernstein 1971, d Sugiyama and Takéuchi 2015, e Henderson et al. 2009, f Lan et al. 2015.

27
Table 3. Symmetry-independent components of the Grüneisen tensors of rutile at 300K
w0 g1 g3
B1g 141.6 -5.64 (16) -4.23(21)
Eg 445.28 1.45 (2) 2.38 (2)
A1g 609.32 1.57 (3) 1.88 (4)
B2g 801.79 1.57 (1) 1.32 (1)
597