A Green Prison: Santa Rita Jail Creeps Towards Zero Net...
16
A Green Prison: Santa Rita Jail Creeps Towards Zero Net Energy (ZNE) Chris Marnay, Nicholas DeForest, Michael Stadler, Jon Donadee, Carlos Dierckxsens, Gonçalo Mendes, Judy Lai, Gonçalo Ferreira Cardoso Environmental Energy Technologies Division To be presented at the ECEEE 2011 Summer Study 6–11 June 2011 Belambra Presqu'île de Giens, France http://eetd.lbl.gov/EA/EMP/emp-pubs.html The work described in this paper was funded by the Office of Electricity Delivery and Energy Reliability’s Smart Grids Program in the U.S. Department of Energy under Contract No. DE-AC02-05CH11231. ERNEST ORLANDO LAWRENCE BERKELEY NATIONAL LABORATORY
Transcript of A Green Prison: Santa Rita Jail Creeps Towards Zero Net...

A Green Prison: Santa Rita Jail Creeps Towards Zero
Net Energy (ZNE) Chris Marnay, Nicholas DeForest, Michael Stadler, Jon Donadee, Carlos Dierckxsens, Gonçalo Mendes, Judy Lai, Gonçalo Ferreira Cardoso
Environmental Energy Technologies Division To be presented at the ECEEE 2011 Summer Study 6–11 June 2011 Belambra Presqu'île de Giens, France http://eetd.lbl.gov/EA/EMP/emp-pubs.html The work described in this paper was funded by the Office of Electricity Delivery and Energy Reliability’s Smart Grids Program in the U.S. Department of Energy under Contract No. DE-AC02-05CH11231.
ERNEST ORLANDO LAWRENCE BERKELEY NATIONAL LABORATORY
Judy
Typewritten Text
Judy
Typewritten Text
Judy
Typewritten Text
LBNL-4497E

2
.
Disclaimer
This document was prepared as an account of work sponsored by the United States Government. While this document is believed to contain correct information, neither the United States Government nor any agency thereof, nor The Regents of the University of California, nor any of their employees, makes any warranty, express or implied, or assumes any legal responsibility for the accuracy, completeness, or usefulness of any information, apparatus, product, or process disclosed, or represents that its use would not infringe privately owned rights. Reference herein to any specific commercial product, process, or service by its trade name, trademark, manufacturer, or otherwise, does not necessarily constitute or imply its endorsement, recommendation, or favoring by the United States Government or any agency thereof, or The Regents of the University of California. The views and opinions of authors expressed herein do not necessarily state or reflect those of the United States Government or any agency thereof, or The Regents of the University of California. Ernest Orlando Lawrence Berkeley National Laboratory is an equal opportunity employer.


1 of 12
Paper 100 + Chris Marnay
A Green Prison: Santa Rita Jail Creeps Towards Zero Net Energy (ZNE)
Chris Marnay – Staff Scientist Lawrence Berkeley National Laboratory 1 Cyclotron Road MS90R1121 Berkeley CA 94720 USA Email: [email protected] Nicholas DeForest – Senior Research Associate Lawrence Berkeley National Laboratory Email: [email protected] Michael Stadler –Scientist Lawrence Berkeley National Laboratory Email: [email protected] Jon Donadee– Graduate Student Researcher Lawrence Berkeley National Laboratory Email: [email protected] Carlos Dierckxsens Katholieke Universiteit Leuven Email: [email protected] Gonçalo Mendes Instituto Superior Técnico, Lisbon Email: [email protected] Judy Lai – Senior Research Associate Lawrence Berkeley National Laboratory Email: [email protected] Gonçalo Ferreira Cardoso Instituto Superior Técnico, Lisbon Email: [email protected]
Abstract A large project is underway at Alameda County’s twenty-year old 45 ha 4,000-inmate Santa Rita Jail, about 70 km east of San Francisco. Often described as a green prison, it has a considerable installed base of distributed energy resources including a seven-year old 1.2 MW PV array, a four-year old 1 MW fuel cell with heat recovery, and efficiency investments. A current US$14 M expansion will add approximately 2 MW of NaS batteries, and undetermined wind capacity and a concentrating solar thermal system. This ongoing effort by a progressive local government with considerable Federal and State support provides some excellent lessons for the struggle to lower building carbon footprint. The Distributed Energy Resources Customer Adoption Model (DER-CAM) finds true optimal combinations of equipment and operating schedules for microgrids that minimize energy bills and/or carbon emissions without

2 of 12
significant searching or rules-of-thumb prioritization, such as “efficiency first then on-site generation.” The results often recommend complex systems, and sensitivities show how policy changes will affect choices. This paper reports an analysis of the historic performance of the PV system and fuel cell, describes the complex optimization applied to the battery scheduling, and shows how results will affect the jail’s operational costs, energy consumption, and carbon footprint. DER-CAM is used to assess the existing and proposed DER equipment in its ability to reduce tariff charges.
Introduction
Santa Rita Jail The current Santa Rita Jail (SRJ) facility was opened in 1989 on a 0.5 km2 site in Dublin, California. It is the third largest jail in the state, and can house up to 4,500 inmates at a given time. Over the past decade, Alameda County, which operates the jail, has installed a series of distributed energy resources (DER) to reduce energy consumption at the site. These include a 1.2 MW rooftop photovoltaic system installed in 2001 and a 1 MW molten carbonate fuel cell originally installed in 2006. The fuel cell operates as combined heat and power (CHP) unit, meaning it provides pre-heating for domestic hot water in addition to base load electricity. The jail has also undergone a series of efficiency improvements to further reduce consumption. Peak demand in the jail is approximately 3 MW. The next proposed addition is electric storage, in the form of a 12 MWh battery bank manufactured by NGK. In this endeavor, Chevron Energy Solutions is the primary contractor responsible for acquisition and installation of the battery. Lawrence Berkeley National Laboratory (LBNL) will provide support and analysis utilizing their internally developed Distributed Energy Resources Customer Adoption Model (DER-CAM).
DER-CAM DER-CAM is an optimization engine developed at LBNL over the past 10 years. It is a powerful analytical tool for determining the optimal combination of DER equipment for a given facility, based on loads and available resources. It also delivers an optimized operations schedule to effectively utilize that equipment. DER-CAM can be used to minimize costs (comprised of utility charges and capital and O&M costs of DER equipment), carbon emissions, or some combination of the two. Because the jail already features installed DER equipment, DER-CAM will primarily be used to optimize operations. Once electric storage is installed, LBNL intends to deliver week-ahead optimized battery schedules utilizing predicted load profiles based on forecasts of weather and other pertinent data (see also Stadler et al. 2008, 2009). As subsequent analysis will show, electric storage is only as valuable as the schedule used to operate it. Intelligent operations, as determined from DER-CAM optimizations, have the potential to save SRJ thousands of dollars every month. While the DER equipment at SRJ goes a long way in reducing the site’s energy purchases and carbon footprint, future installations will increasingly depend on the economic viability of the DER equipment. Consequently, the focus of this paper will center on the financial value of said equipment.
Tariff Rate Structure Santa Rita Jail currently purchases its electricity under Pacific Gas and Electric’s E-20 tariff for industrial and general service customers. This particular tariff can be better understood by exploring its various charges and their sources. First, the jail is subject to daily customer and meter charges, irrespective of utility purchases. The bulk of the utility bill will stem from either energy purchases or power demand charges. Energy purchases, or costs per kilowatt-hour or electricity consumed, are determined by a time of use (TOU) rate structure. Demand charges are based on the maximum power required by the jail in a given time period. It is also determined on a TOU basis. Current E-20 TOU rates, which will vary based on season and time of day, are summarized in Table 1 below. While rates have changed through the duration of this investigation at the jail, all utility charge calculations presented here utilize the values given below. Summer months extend from May through October, with winter comprising the remaining months.

3 of 12
Table 1: PG&E E-20 Industrial Rate
Given the high time variability of this tariff structure, the ability to utilize DER to reduce loads during peak hours will prove to be of substantial value to the jail. Their performance (or lack thereof) will play a major role in the consequent utility bill. Based on the previously described tariff rates, the monthly electricity bill at Santa Rita Jail is given below. Note this figure takes into account historically variable behavior of the DER equipment currently present at the jail. The details of this performance will be discussed later. In the meantime, do not attempt to infer too much about the nature of the seasonal load patterns of the jail from this figure alone. One feature that is clear, however, is the significance of demand charges, particularly in summer months, which can exceed 30% of the total bill in some instances.
Figure 1: Composition of 2009 PG&E electricity bill by month and charge type. Note this figure excludes daily customer and meter charges, which are fixed and insignificant relative to energy and power charges.
Efficiency Measures In addition to generation equipment, SRJ has also undergone a series of building equipment retrofits to improve efficiency and reduce peak electricity demand. Of the most recent improvements, two have targeted lighting. The first, a T-8 ballast retrofit completed in 2009, is estimated to save 225 kW from the peak power demand and 1.34 GWh annually. The 2010 installation of induction lighting in day rooms will save 217 kW peak power and 1.55 GWh annually. Taken together, these two measures represent a 15% savings in peak power at the jail. There is no doubt that such measures also have appreciable impacts on both utility charges and carbon emissions. Beyond these, there have been a number of other efficiency improvements beginning in the mid 90s targeting HVAC systems, lighting, refrigeration and other end-uses. Most notable among them is a chiller upgrade which saved an estimated of 423 kW from peak power. The jail also utilizes waste heat from its fuel cell for domestic hot water preheating. At full power, this provides 15% of the hot water needs of the facility. The jail also plans to install a roof-mounted

4 of 12
solar-thermal system, which when operational will provide another 40% of the hot water needs. By approaching from the demand side first, the goal of ZNE at SRJ becomes a more attainable goal.
Photovoltaic Historically, the PV arrays at Santa Rita Jail have consistently underperformed their 1.2 MW rating. This is evidenced in Figure 2, which shows the maximum output observed from the PV system. With the exception of a single month in 2007, the system has not exceeded 700 kW in recent years. Of the four separate arrays, one currently suffers from extremely poor performance and is scheduled to be replaced with a 220 kW rated array. This troublesome array may explain why 2007 experiences a single month of uncharacteristically high maximum power generated at the onset of summer. Initially performing, the array suddenly undergoes a rapid deterioration. After this point, the PV performance has been low, but steady. Figure 3 shows the total monthly generation from PV. The jail is currently utilizes the roofs of 14 of its 18 inmate buildings, or pods. However, this space constraint has not hindered the plan to expand on-site PV. The next proposed addition is a ground mounted solar-tracking PV system adjacent to the jail and rated at 240 kW. It is scheduled to be installed sometime in 2011.
Figure 2: Peak PV output 2007-2009
Figure 3: Generated electricity from PV 2007-2009

5 of 12
Despite its underwhelming recent performance, the PV system at Santa Rita still provides a valuable service. Because its generation coincides with summer months and peak hours, it is able to mitigate both energy and power charges when they are at their highest. Figure 4 illustrates this fact clearly, with estimated savings topping $20,000 in several summer months. To put this in the context of the total electricity bill, refer back to Figure 1.
Figure 4: Reductions to 2009 utility electricity bill from on-site PV generation
Fuel Cell Given that it is not dependent upon the position of the sun, the molten carbonate fuel cell should have greater potential to reduce electricity bills than PV. However, the savings impact from the fuel cell (Figure 5) show a great deal of variation. In some months, energy charge savings are small and power savings are absent. To understand why this is occurring, a closer inspection of fuel cell performance is required.
Figure 5: Reductions to 2009 utility electricity bill from fuel cell generation

6 of 12
Figure 6: Historic fuel cell capacity factor relative to 1 MW rating The fuel cell at the jail was intended to provide a consistent base-load supply of 1 MW. Were this actually the case, this would provide an immense benefit to reducing electricity purchases from the utility. However, consistent performance has not been the case. Monthly capacity factors demonstrate the extent to which the fuel cell is underperforming. As Figure 6 shows, the fuel cell output shifts erratically from month to month. Since its installation in 2006, the fuel cell has been plagued by a series of outages. The history of these outages can be seen in Figure 7. 2007 performance shows a number of short outages, as well as a period of several weeks in which output was limited to about 80%. Near the end of the year, the fuel cell experienced a prolonged outage. 2008 began with the fuel cell up and running, but short outages continued to occur. As the year progressed, performance deteriorated significantly. At the close of this year, the fuel cell stack had to be replaced. With a new stack installed shortly into 2009, outages appear to be fewer; however, output remained at approximately 80% for the latter half of the year.

7 of 12
Figure 7: 3 year fuel cell outage history The consequences of this inconsistent performance can be seen in the utility bill. A single outage during peak hours could potentially set the power demand charge for the whole month by creating a window of time in which the entire power demand of the jail must be met using utility purchases. This is what is occurring in November of 2009. The outage history shows only two brief outages this month, however, as Figure 5 shows, the power savings for November are zero. This effect can be understood further by examining the cost of fuel cell outages (Figure 8). This exercise compares the charges incurred using the actual Santa Rita Jail fuel with those from an ideal fuel cell running at a constant 1 MW. The potential energy savings are high in the first two months, which coincide with the time the cell was down for maintenance. The middle of the year saw relatively consistent 80% output, so energy related outage costs were moderate. November, as discussed previously, lost the entirety of its power savings from two brief outages.

8 of 12
Figure 8: Utility charged incurred from fuel cell outages in 2009 Consequently, there exists a strong financial incentive to avoid even short fuel cell outages. Outages may occur from mechanical problems with the fuel cell, or voltage disturbances. Additionally, due to limitations of the current power equipment, the fuel cell will be turned off to avoid exporting power. That is to say, if the total load of the jail is approaching 1 MW, the fuel cell will trip off to prevent exporting and remain down for several hours. While this problem will eventually be corrected, the addition of electric storage could immediately address this outage source, allowing surplus power to be sent a battery rather than back to the grid. Furthermore, storage may prove useful in mitigating the charges due to power demand spikes from unavoidable fuel cell outages. These many short outages are also suspected to shorten the life of the fuel cell stack, so storage may also extend the life of this expensive equipment.
Electric Storage Previously, a 2 MW 12 MWh NGK sodium-sulfur (NaS) battery bank had been proposed for installation at the jail in early 2011. The specifics of this addition have since become uncertain. While electric storage will be installed shortly, the particular technology and storage capacity employed may be different. For the purposes of this investigation, the original battery specifications are used. Given that the PV can only be utilized when available, and the fuel cell is ideally expected to run continuously, the battery remains the one truly dispatchable resource at the jail. As such, the schedule of the battery, i.e. when it charges and discharges, will play a major role in shaping the consequent bill. Utilizing DER-CAM, an optimized weekly schedule will be determined. Currently, this is only being done for historic data, however, once the batteries have been installed, LBNL intends to deliver a week-ahead optimization based on predicted loads.
Scenario 1: Operational Fuel Cell The first scenario explores a week of nearly ideal fuel cell performance. Note that this simulation occurs in the month of May, which incurs the summer rate with off, part and max peak periods. With an operational fuel cell and PV, a large portion of the jail’s electricity demand is already being met on site. However, the battery provides a useful resource for avoiding charges during the peak times. Figure 9 presents the several datasets necessary to understanding scheduling and utility charges, including the output of the fuel cell and PV, electricity in and out of the battery as well as the state of charge (SOC). A number of interesting phenomenon are occurring in this figure. First, there is no battery charging or discharging during weekends, when all rates are off-peak. Charging the battery occurs in the hours just prior to the first weekday part-peak hours, in a condensed period to avoid decay losses in the battery. Also, as there is no off-peak demand charge, there is no incentive to spread the charging over the duration of the weekend. On the first three weekdays, the battery is charged only during off-peak hours. During part-peak hours, no energy is moved in or out of storage. A slight decay can be observed over these hours. Once max-peak rates set in, the battery is discharged to offset all purchases necessary from the grid. During the last two weekdays, the peak

9 of 12
power requirements at the jail are higher, so the battery must also charge during part-peak hours. Note however that the power demand at this point (inferred from the slope of the SOC line) is lower. This will result in a lower part-peak power charge. Once again the battery is used to offset all max-peak electricity purchases.
Figure 9: DER-CAM optimized schedule for week with operational fuel cell
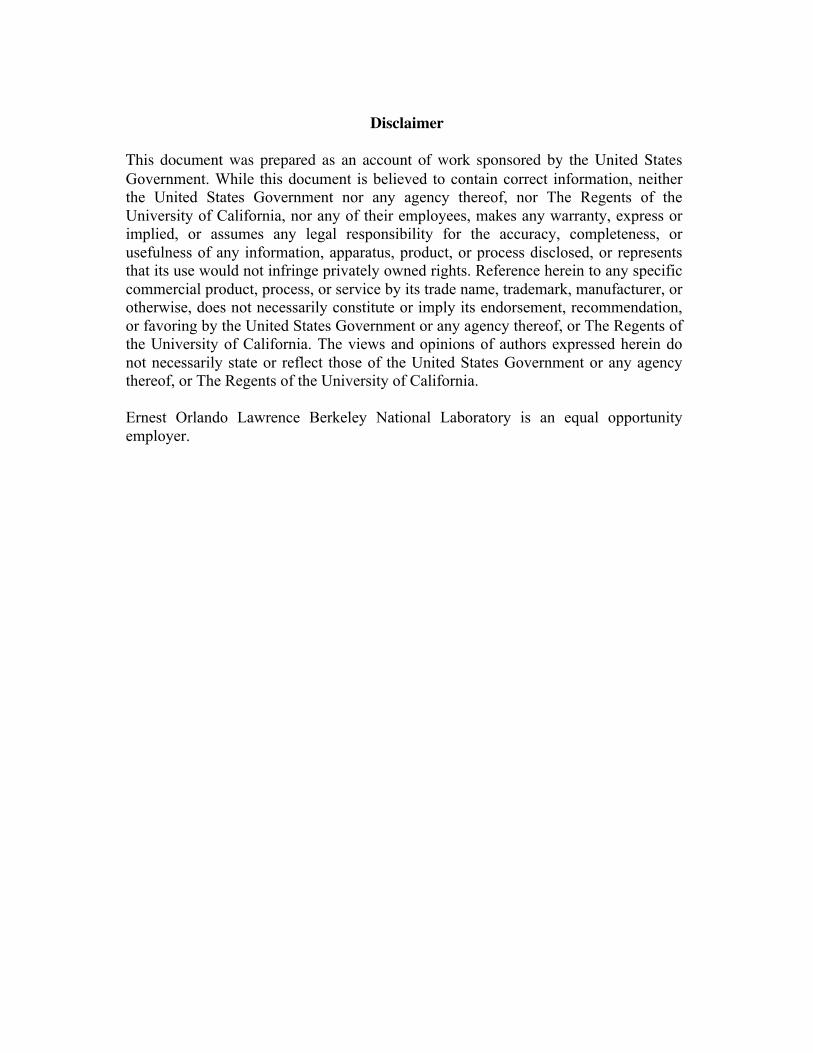
Scenario 2: Brief Fuel Cell Outage Given the past performance of the fuel cell, it is unlikely that uninterrupted generation could continue for long. Therefore, it is also important to know how the battery would behave in the face of a fuel cell outage. Note that this analysis assumes prior knowledge of the outage, which would not always be the case. Similar to scenario 1, results are given below in Figure 10. Prior to the outage, the charge/discharge behavior is identical to scenario 1. The night before the outage, the battery charges to its full capacity and discharges during max-peak hours. Unlike scenario 1, it is unable to offset completely the energy purchased during this period. While the fuel cell is still down, the battery recharges, but once again not enough to offset the entirety of max-peak purchases. On Friday, the fuel cell is able to ramp up again. The battery discharges, and utility purchases are made such that the maximum demand charge is the same as the one incurred on Thursday.
10 of 12
Figure 10: DER-CAM optimized schedule for week with brief fuel cell outage
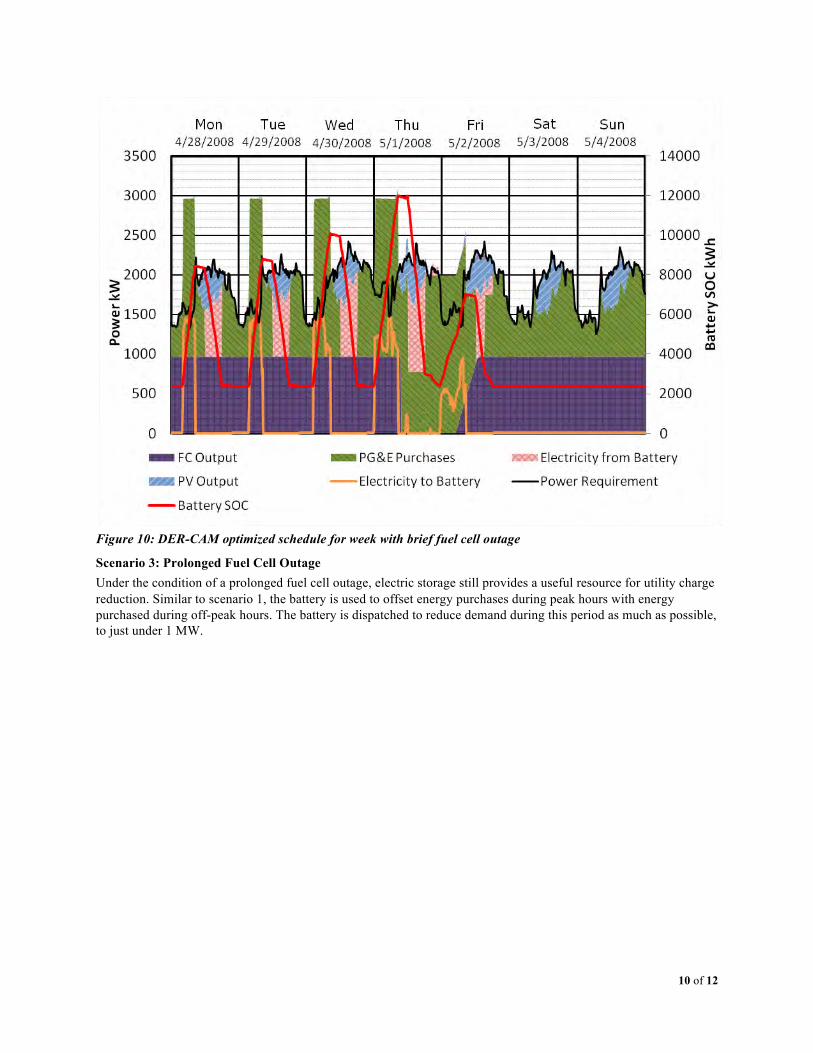
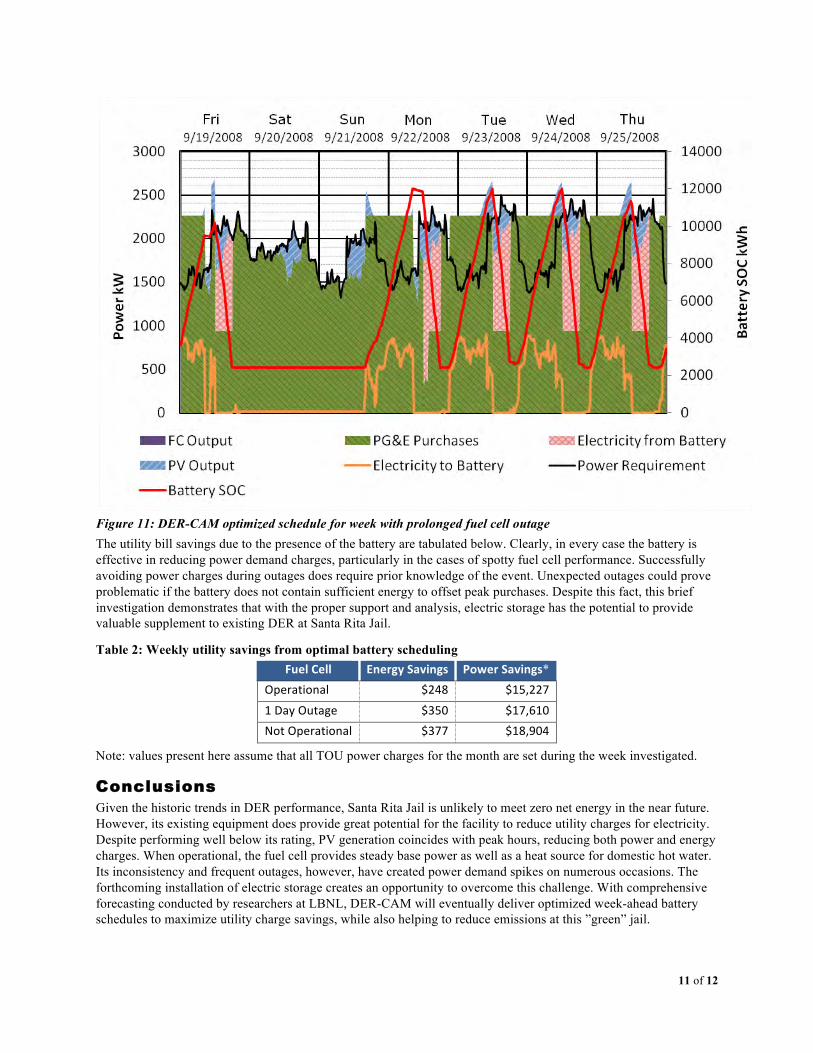
Scenario 3: Prolonged Fuel Cell Outage Under the condition of a prolonged fuel cell outage, electric storage still provides a useful resource for utility charge reduction. Similar to scenario 1, the battery is used to offset energy purchases during peak hours with energy purchased during off-peak hours. The battery is dispatched to reduce demand during this period as much as possible, to just under 1 MW.
11 of 12
Figure 11: DER-CAM optimized schedule for week with prolonged fuel cell outage The utility bill savings due to the presence of the battery are tabulated below. Clearly, in every case the battery is effective in reducing power demand charges, particularly in the cases of spotty fuel cell performance. Successfully avoiding power charges during outages does require prior knowledge of the event. Unexpected outages could prove problematic if the battery does not contain sufficient energy to offset peak purchases. Despite this fact, this brief investigation demonstrates that with the proper support and analysis, electric storage has the potential to provide valuable supplement to existing DER at Santa Rita Jail.
Table 2: Weekly utility savings from optimal battery scheduling FuelCell EnergySavings PowerSavings*
Operational $248 $15,227
1DayOutage $350 $17,610
NotOperational $377 $18,904
Note: values present here assume that all TOU power charges for the month are set during the week investigated.
Conclusions Given the historic trends in DER performance, Santa Rita Jail is unlikely to meet zero net energy in the near future. However, its existing equipment does provide great potential for the facility to reduce utility charges for electricity. Despite performing well below its rating, PV generation coincides with peak hours, reducing both power and energy charges. When operational, the fuel cell provides steady base power as well as a heat source for domestic hot water. Its inconsistency and frequent outages, however, have created power demand spikes on numerous occasions. The forthcoming installation of electric storage creates an opportunity to overcome this challenge. With comprehensive forecasting conducted by researchers at LBNL, DER-CAM will eventually deliver optimized week-ahead battery schedules to maximize utility charge savings, while also helping to reduce emissions at this ”green” jail.

12 of 12
References Dierckxsens, Carlos, Valuation of the Santa Rita Jail Photovoltaic Array, Traineeship Report, Katholike Universiteit
Leuven, August 2009 Marnay, Chris, Michael Stadler, Afzal Siddiqui, Nicholas DeForest, Jon Donadee, Prajesh Bhattacharya, and Judy
Lai. “Applications of Optimal Building Energy System Selection and Operation,” paper to be presented at Microgen’II: Second International Confer-ence of Microgeneration and Related Technologies, University of Strathclyde, Glasgow, Scotland, 4-6 Apr 2011.
Pacific Gas & Electric E-20 Tariff, http://www.pge.com/tariffs/electric.shtml, last accessed Jan 31, 2011 Stadler, M., C. Marnay, A. Siddiqui, J. Lai, B. Coffey, and H. Aki (2008), “Effect of Heat and Electricity Storage
and Reliability on Microgrid Viability: A Study of Commercial Buildings in California and New York States”, Report number LBNL-1334E, December 2008
Stadler, M., C. Marnay, A. Siddiqui, J. Lai, and H. Aki, (2009), “Integrated Building Energy Systems Design Considering Storage Technologies”, 2009 ECEEE Summer Study, June 2009, La Colle sur Loup, France.
Acknowledgments The work described in this paper was funded by the Office of Electricity Delivery and Energy Reliability’s Smart Grids Program in the U.S. Department of Energy under Contract No. DE-AC02-05CH11231. Special thanks to Matt Muniz of Alameda County for providing the authors with valuable data and guidance.